WO2019088089A1 - 力測定方法、力測定装置、力測定システム、力測定プログラム及び記録媒体 - Google Patents
力測定方法、力測定装置、力測定システム、力測定プログラム及び記録媒体 Download PDFInfo
- Publication number
- WO2019088089A1 WO2019088089A1 PCT/JP2018/040300 JP2018040300W WO2019088089A1 WO 2019088089 A1 WO2019088089 A1 WO 2019088089A1 JP 2018040300 W JP2018040300 W JP 2018040300W WO 2019088089 A1 WO2019088089 A1 WO 2019088089A1
- Authority
- WO
- WIPO (PCT)
- Prior art keywords
- cargo
- force
- data
- fluctuation
- fluctuation value
- Prior art date
- Legal status (The legal status is an assumption and is not a legal conclusion. Google has not performed a legal analysis and makes no representation as to the accuracy of the status listed.)
- Ceased
Links
Images






Classifications
-
- G—PHYSICS
- G01—MEASURING; TESTING
- G01L—MEASURING FORCE, STRESS, TORQUE, WORK, MECHANICAL POWER, MECHANICAL EFFICIENCY, OR FLUID PRESSURE
- G01L5/00—Apparatus for, or methods of, measuring force, work, mechanical power, or torque, specially adapted for specific purposes
- G01L5/04—Apparatus for, or methods of, measuring force, work, mechanical power, or torque, specially adapted for specific purposes for measuring tension in flexible members, e.g. ropes, cables, wires, threads, belts or bands
- G01L5/10—Apparatus for, or methods of, measuring force, work, mechanical power, or torque, specially adapted for specific purposes for measuring tension in flexible members, e.g. ropes, cables, wires, threads, belts or bands using electrical means
- G01L5/105—Apparatus for, or methods of, measuring force, work, mechanical power, or torque, specially adapted for specific purposes for measuring tension in flexible members, e.g. ropes, cables, wires, threads, belts or bands using electrical means using electro-optical means
-
- G—PHYSICS
- G01—MEASURING; TESTING
- G01L—MEASURING FORCE, STRESS, TORQUE, WORK, MECHANICAL POWER, MECHANICAL EFFICIENCY, OR FLUID PRESSURE
- G01L1/00—Measuring force or stress, in general
-
- C—CHEMISTRY; METALLURGY
- C12—BIOCHEMISTRY; BEER; SPIRITS; WINE; VINEGAR; MICROBIOLOGY; ENZYMOLOGY; MUTATION OR GENETIC ENGINEERING
- C12M—APPARATUS FOR ENZYMOLOGY OR MICROBIOLOGY; APPARATUS FOR CULTURING MICROORGANISMS FOR PRODUCING BIOMASS, FOR GROWING CELLS OR FOR OBTAINING FERMENTATION OR METABOLIC PRODUCTS, i.e. BIOREACTORS OR FERMENTERS
- C12M1/00—Apparatus for enzymology or microbiology
- C12M1/34—Measuring or testing with condition measuring or sensing means, e.g. colony counters
-
- C—CHEMISTRY; METALLURGY
- C12—BIOCHEMISTRY; BEER; SPIRITS; WINE; VINEGAR; MICROBIOLOGY; ENZYMOLOGY; MUTATION OR GENETIC ENGINEERING
- C12Q—MEASURING OR TESTING PROCESSES INVOLVING ENZYMES, NUCLEIC ACIDS OR MICROORGANISMS; COMPOSITIONS OR TEST PAPERS THEREFOR; PROCESSES OF PREPARING SUCH COMPOSITIONS; CONDITION-RESPONSIVE CONTROL IN MICROBIOLOGICAL OR ENZYMOLOGICAL PROCESSES
- C12Q1/00—Measuring or testing processes involving enzymes, nucleic acids or microorganisms; Compositions therefor; Processes of preparing such compositions
- C12Q1/02—Measuring or testing processes involving enzymes, nucleic acids or microorganisms; Compositions therefor; Processes of preparing such compositions involving viable microorganisms
-
- G—PHYSICS
- G01—MEASURING; TESTING
- G01N—INVESTIGATING OR ANALYSING MATERIALS BY DETERMINING THEIR CHEMICAL OR PHYSICAL PROPERTIES
- G01N21/00—Investigating or analysing materials by the use of optical means, i.e. using sub-millimetre waves, infrared, visible or ultraviolet light
- G01N21/84—Systems specially adapted for particular applications
- G01N21/85—Investigating moving fluids or granular solids
-
- G—PHYSICS
- G06—COMPUTING OR CALCULATING; COUNTING
- G06F—ELECTRIC DIGITAL DATA PROCESSING
- G06F17/00—Digital computing or data processing equipment or methods, specially adapted for specific functions
- G06F17/10—Complex mathematical operations
- G06F17/18—Complex mathematical operations for evaluating statistical data, e.g. average values, frequency distributions, probability functions, regression analysis
-
- G—PHYSICS
- G01—MEASURING; TESTING
- G01N—INVESTIGATING OR ANALYSING MATERIALS BY DETERMINING THEIR CHEMICAL OR PHYSICAL PROPERTIES
- G01N33/00—Investigating or analysing materials by specific methods not covered by groups G01N1/00 - G01N31/00
- G01N33/48—Biological material, e.g. blood, urine; Haemocytometers
- G01N33/483—Physical analysis of biological material
Definitions
- the present invention relates to a force measurement method, a force measurement device, a force measurement system, a force measurement program, and a recording medium.
- eukaryotic cells are equipped with a developed intracellular transport system.
- neurons have been used as research targets for intracellular transport systems.
- Neurons have cell bodies and long processes (axons) extending from the cell bodies.
- Neuronal cell morphology is formed by proteins that make up the cytoskeleton, and axons are mainly formed by tubulin, which makes up microtubules.
- the microtubules function as a trunk of a physical distribution system (axon transport) between the cell body and the synapse at the tip of the axon.
- intracellular organelles (organella) and vesicles (vesicles) covered with a lipid bilayer membrane are known.
- organelles for example, mitochondria and endosomes are known.
- the vesicles contain proteins, nucleic acid macromolecules, small molecules and the like as materials for forming axons and synapses or signal transduction substances.
- Cargo transport includes anterograde transport from the cell body to the tip of the axon and retrograde transport in the reverse direction.
- a motor protein called kinesin carries a cargo and travels over microtubules.
- dynein is responsible for cargo transport.
- the motor protein transports cargo using the energy obtained by hydrolysis of ATP.
- axonal transport disorders in axonal transport are also considered to be a cause of neurological diseases such as Alzheimer's disease and Parkinson's disease, and analysis of axonal transport is expected to contribute to understanding and treatment of neurological diseases.
- transport of cargo by motor protein has been described using axon transport as a specific example, but transport of cargo by motor protein is not limited to axon transport.
- transport of cargo not only in axons but also in processes such as dendrites or in cell bodies is performed.
- the cargo is not necessarily covered with the lipid bilayer membrane, and may be a protein complex or a protein / nucleic acid complex.
- the motor protein not only kinesin or dynein moving on microtubules but also various motor molecules such as myosin moving on actin fibers may be used.
- intracellular transport is performed by the same mechanism not only in neurons but in all eukaryotic cells.
- skin melanocytes melanocytes
- intracellular granules containing a melanin pigment are transported as cargo
- insulin-secreting cells of the pancreas intracellular vesicles containing insulin are transported as cargo. That is, although transport of cargo by a motor protein has been described above using nerve cells as a specific example, transport of cargo by a motor protein is not necessarily performed by nerve cells alone, and cells other than nerve cells may be used. To be done.
- transport of cargo by motor protein is performed by movement of motor protein on microtubules in addition to axons.
- the force applied to the cargo in living cells.
- a method of measuring the force applied to cargo in a living cell for example, there has been a method using optical tweezers.
- the method using the optical tweezers was a method of measuring the force applied to the cargo by pulling the cargo by holding the cargo to be observed with the optical tweezers.
- the force applied to the cargo is, for example, the force applied by the motor protein to the cargo.
- laser light of excessive intensity is required, which may cause cell damage and thermal damage.
- the method using the optical tweezers is a invasive method using a laser beam, and thus has a problem that the cells to be observed may be damaged.
- the present invention aims to provide a technique for measuring the force applied to cargo in living cells in a non-invasive manner.
- One aspect of the present invention is the time of the position of the cargo during a period in which the displacement of the unit time of the cargo is substantially constant among the data included in the time course data indicating the trajectory of movement of the cargo acquired by non-invasive means
- the motor protein that transports the cargo calculates a fluctuation value proportional to the force applied to the cargo based on the first probability distribution indicating. And the force is calculated based on the calculated fluctuation value.
- a force calculation step of calculating a force measurement method.
- One aspect of the present invention is the force measurement method described above, wherein the force calculation step calculates the force by performing clustering on the fluctuation value.
- One embodiment of the present invention is the force measurement method described above, wherein among the time course data indicating the trajectory of the movement of the cargo acquired by non-invasive means, the first data and the position of the cargo are time
- One mode of the present invention is the above-mentioned force measurement method, wherein the fluctuation coefficient calculating step calculates a viscosity coefficient of a medium surrounding the cargo based on the second data.
- One aspect of the present invention is the force measurement method described above, wherein the fluctuation coefficient calculation step calculates the speed at which the cargo moves based on the first data acquired in the second acquisition step. Do.
- One aspect of the present invention is the force measurement method described above, wherein the fluctuation coefficient calculation step calculates the fluctuation coefficient based on the viscosity coefficient and the speed.
- One aspect of the present invention is the time of the position of the cargo during a period in which the displacement of the unit time of the cargo is substantially constant among the data included in the time course data indicating the trajectory of movement of the cargo acquired by non-invasive means
- the motor protein that transports the cargo calculates a fluctuation value proportional to the force applied to the cargo based on the first probability distribution representing the value, and the force is calculated based on the calculated fluctuation value.
- a force calculation unit to calculate.
- the computer displays the cargo during a period in which the displacement of the cargo unit time is substantially constant.
- the first data indicating the temporal change of position is acquired, and the computer is a probability distribution based on the time course data, wherein the probability that the amount of change of the predetermined position of the cargo during a unit time is a predetermined amount
- the motor protein transporting the cargo calculates a fluctuation value proportional to the force applied to the cargo based on the first probability distribution indicating the distribution of the force, and the computer calculates the fluctuation value based on the calculated fluctuation value. Is a force measurement program for calculating
- the computer displays the cargo during a period in which the displacement of the cargo unit time is substantially constant.
- the first data indicating the temporal change of position is acquired, and the computer is a probability distribution based on the time course data, wherein the probability that the amount of change of the predetermined position of the cargo during a unit time is a predetermined amount
- the motor protein transporting the cargo calculates a fluctuation value proportional to the force applied to the cargo based on the first probability distribution indicating the distribution of the force, and the computer calculates the fluctuation value based on the calculated fluctuation value.
- the invention makes it possible to measure the force on cargo in living cells in a non-invasive way.
- the flowchart which shows the flow of the concrete processing in which force measuring device 1 of an embodiment computes the force concerning motor protein.
- the present invention measures the force applied to cargo by measuring the physical quantity related to the force applied to cargo by the fluctuation theorem. Therefore, in explaining the present invention, first, after explaining the fluctuation theorem, the principle of measuring the force applied to the cargo according to the present invention will be described.
- the fluctuation theorem is a theorem of nonequilibrium statistical mechanics, a field of physics, published in 1993 by D. J. Evans.
- the fluctuation theorem is a theorem that relates a predetermined physical quantity in a thermodynamically non-equilibrium system to a physical quantity that changes the predetermined physical quantity.
- a system in a thermodynamically non-equilibrium state is, for example, a system in which a cargo moves, in which case the fluctuation theorem relates the position of the cargo in the system to the force applied to the cargo. In that case, it is known that the fluctuation theorem relating the position of the moving cargo and the force applied to the moving cargo is expressed by the following equation.
- ⁇ X represents the displacement of the cargo during unit time
- P ( ⁇ X) represents the probability that the displacement of the cargo is ⁇ X.
- (DELTA) X is shown by the following formula (2).
- X (t) is the position of the cargo at time t.
- X (t + ⁇ t) is the position of the cargo at time t + ⁇ t.
- ⁇ X represents the magnitude of the force applied to the cargo by force F c (denoted as F in equation (1)).
- A is a conversion factor between the physical quantity represented by the left side of equation (1) and the force F c .
- the physical quantity represented by the left side of equation (1) is referred to as a fluctuation value ⁇ , and A is referred to as a fluctuation coefficient.
- the fluctuation coefficient A is a value unique to the combination of cargo and motor protein.
- the displacement amount of the cargo represents a change amount of the position of the cargo.
- the position of the cargo may be any position as long as it is the position of the part of the cargo, and is, for example, the center of gravity of the cargo.
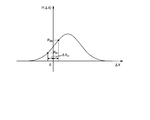
- FIGS. 1A and 1B are explanatory diagrams for explaining that the fluctuation theorem reflects the force F c .
- FIGS. 1A and 1B both show the probability distribution of ⁇ X when cargo is under force.
- FIG. 1A shows the probability distribution of ⁇ X when the noise applied to the cargo is large.
- the probability distributions in FIGS. 1A and 1B are, for example, both probability distributions following a Gaussian distribution. Comparing FIG. 1A with FIG. 1B, in FIG. 1A, since the noise applied to the cargo is small, the range of possible values of ⁇ X is narrower than the range of possible values of ⁇ X in FIG. 1B. Therefore, the height of the peak of the probability distribution in FIG.
- the fluctuation coefficient A is calculated based on the fluctuation value ⁇ and the force F c calculated based on the viscosity coefficient ⁇ .
- the fluctuation coefficient A is the product of the Boltzmann constant k b and the temperature T eff of the system including the cargo to be observed in the non-equilibrium state (that is, a temperature generally called non-equilibrium temperature or effective temperature).
- T eff the temperature of the system including the cargo to be observed in the non-equilibrium state
- Teff is a constant value. This has been verified experimentally.
- FIG. 2 is a view showing a specific example of a force measurement system 100 configured using the force measurement device 1 of the embodiment.
- the force measurement system 100 is a system that measures the force applied to the cargo by detecting the cargo in the cell by non-invasive means and recording the movement of the cargo.
- the force measurement system 100 includes a force measurement device 1, a fluctuation coefficient calculation device 2 and an imaging device 9.
- the cell to be observed by the present invention may be any cell as long as it has cargo and motor protein and the motor protein transports cargo in the cell. Many of the commonly known eukaryotic cells have such cargo and motor proteins.
- the observation target is preferably a nerve cell because it is easy to observe transport of cargo in cells. Examples of cells suitable for observation other than nerve cells include glial cells, vascular endothelial cells, fibroblasts such as skin, melanocytes, commonly used established animal cells, egg cells and the like.
- nerve cell to be observed by the present invention is not particularly limited.
- nerve cells that can be cultured in vitro are preferable.
- it may be a cell in which cells that support nerve cells or other cells coexist.
- glial cells such as astrocytes (astroglia), oligodendrocytes, Schwann cells, vascular cells such as vascular epithelial cells, mesenchymal cells such as fibroblasts, etc.
- nerve cells include nerve cells that secrete amino acid neurotransmitters, nerve cells that secrete peptide neurotransmitters, and nerve cells that secrete monoamines and acetylcholine.
- auxiliary cells When culturing nerve cells, cells that support nerve cells may be coexisted for the purpose of approaching the in vivo environment.
- auxiliary cells include astrocytes (astrocytes), oligodendrocytes, glial cells such as Schwann cells, and the like.
- the type of cargo transported in cells to be observed by the present invention is not particularly limited, as long as it is a cargo whose fluctuation can be measured by an optical instrument.
- the presence or absence of the fluorescent labeling of cargo when measuring fluctuation is not limited.
- the cargo is a lipid bilayer enveloped vesicle or organelle, it can be fluorescently labeled, for example, with a carbocyanine dye such as DiD, DiI, DiO, DiR.
- proteins contained in cargo can be fluorescently labeled with a fluorescent protein such as GFP.
- known labeling methods using staining using a fluorescent dye, biotin, avidin, antibodies, etc. are also applicable.
- the transport route of the cargo to be observed is not particularly limited, and may be axonal transport or other intracellular transport, and can be appropriately selected according to the purpose of analysis.
- the force measuring device 1 calculates the force F c applied to the cargo to be observed based on the data group of the image showing the movement of the cargo to be observed.
- a data group of images showing the movement of cargo to be observed is referred to as observation data.
- the image showing the movement of the cargo to be observed may be, for example, a two-dimensional image.
- the observation data may be, for example, a moving image.
- the fluctuation coefficient calculation device 2 calculates the fluctuation coefficient A of the cargo to be observed based on the observation data.
- the fluctuation coefficient calculation device 2 outputs the calculated fluctuation coefficient A to the force measurement device 1.
- the imaging device 9 images the cargo to be observed by non-invasive means, and generates observation data in which the movement of the cargo is recorded.
- the noninvasive means may be, for example, a means for acquiring information on an observation object with visible light.
- the information on the observation target is, for example, a signal indicating the position of the center of gravity of the observation target.
- the noninvasive means may be, for example, means for fluorescently labeling an observation target and acquiring information on the observation target by the fluorescence.
- These non-invasive means may be realized using a microscope such as a fluorescence microscope or a differential interference microscope.
- the non-invasive means may be means for acquiring information on the observation target by means of a magnetic field having an intensity that has less influence on the observation target.
- an invasive means is a means which acquires information regarding an observation object by irradiating a laser to observation objects like optical tweezers, for example.
- the method of generating observation data in which the movement of cargo is recorded is not particularly limited, and examples thereof include known methods using a confocal laser microscope equipped with a commercially available digital video camera for cell dynamics observation.
- the frame rate for imaging is preferably about 10 to 100 frames / second or more, particularly preferably 100 frames / second, from the viewpoint of the speed of axonal transport of cargo and the like.
- various methods can be applied in the step or means of extracting the axonal region in the captured image frame, for example, a method of judging the axonal region by visual observation is performed.
- FIG. 3 is a diagram showing a specific example of observation data of the embodiment.
- FIG. 3 is a two-dimensional still image at a certain time t.
- An area surrounded by a dotted line in the still image of FIG. 3 represents an axon.
- the light emitting point in the region 101 surrounded by a line is a cargo to be observed.
- FIG. 4 is an explanatory view for explaining that a plurality of observation data of the embodiment show movement of an observation target.
- the cargo to be observed is the cargo to be observed in the area 101 in FIG.
- the image 103 shows the position of the cargo to be observed at a time after 0 s and before 1.8 s.
- the observation data is a data group including a plurality of two-dimensional still images shown in FIG. 3 at different times. Therefore, the observation data indicates the movement of the cargo to be observed as shown in FIG. 4 by the data of the still images at different times provided by itself.
- FIG. 5 is a diagram showing a specific example of the functional configuration of the force measurement device 1 of the embodiment.
- the force measurement device 1 includes a first locus data acquisition unit 11, a fluctuation value calculation unit 12, a repetition control unit 13, a clustering unit 14, a fluctuation coefficient storage unit 15, and a force calculation unit 16.
- the first trajectory data acquisition unit 11 acquires time course data including constant-velocity movement data generated based on observation data.
- the time course data is data indicating a projection on a predetermined one axis of the trajectory of the observation target indicated by the observation data, and is a set of data having two values of time t and the position X of the cargo at time t.
- the predetermined one axis may be any axis, for example, an axis parallel to the direction in which the cargo is transported.
- the constant speed movement data is data included in the time course data, and indicates a time change of the position of the cargo in a period in which the displacement of the unit time of the cargo is substantially constant (hereinafter referred to as "constant speed period"). It is data.
- the constant speed movement data is data indicating a temporal change of the position of the cargo during a period in which the cargo moves at a substantially constant speed.
- the constant speed movement data is also a set of data having two values of time t and position X of a cargo.
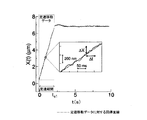
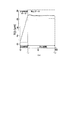
- FIG. 6 is a diagram showing specific examples of time course data, constant speed movement data, and a constant speed period according to the embodiment.
- the horizontal axis represents time
- the vertical axis represents the position X of the cargo.
- X on the vertical axis is represented as X (t) to specify that the position X depends on the time t.
- data in a period from time 0 to time t s1 is data indicating that the cargo to be observed moves at a substantially constant speed, and is a specific example of the constant-speed movement data.
- the period from time 0 to time t s1 is a specific example of the constant speed period.
- FIG. 6 Also shown in FIG. 6 is an enlarged view of a portion of a graph showing constant speed movement data.
- the straight line of the enlarged view is a regression line for the constant velocity movement data.
- the regression line indicates that the cargo moves at a constant speed in the direction in which the value of X increases.
- the enlarged view shows that the movement speed of the cargo is not constant in a short time of 50 ms or less, and moves at a speed with fluctuation of a position of 200 nm or less in 50 ms.
- the fluctuation value calculation unit 12 calculates the fluctuation value ⁇ ⁇ ⁇ based on the constant velocity movement data. Specifically, the fluctuation value calculation unit 12 calculates the fluctuation value by executing the fluctuation value calculation process after executing the first probability distribution calculation process.
- the first probability distribution calculation process will be described.
- the first probability distribution calculation process is a process of calculating the probability distribution of the displacement amount ⁇ X of the position of the cargo in the unit time ⁇ t during the constant velocity period based on one constant velocity movement data.
- the time origin in constant-speed movement data is t 0
- the position of the cargo at time origin t 0 is X 0, and time t 0 + n ⁇ ⁇ t (n is an integer)
- the displacement ⁇ X n X n -X (n-1) of the position of the cargo is acquired for various n.
- the process of acquiring the displacement amount ⁇ X n of the position of the cargo for various n is referred to as displacement amount calculation processing.
- the first probability distribution calculation process calculates a probability distribution (hereinafter referred to as “first probability distribution”) in which the value of the displacement amount ⁇ X of the position of the cargo is ⁇ X n .
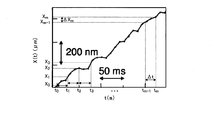
- FIG. 7 is an explanatory view for explaining a specific procedure of displacement amount calculation processing in the first probability distribution calculation processing of the embodiment.
- the graph of FIG. 7 is a graph in the enlarged view of a part of time course data in FIG.
- the fluctuation value calculation unit 12 first executes displacement amount calculation processing to position the cargo from time t 0 to time t m at each predetermined unit time ⁇ t (that is, X 0, X 1 , X 2 ... X m ).
- the fluctuation value calculation unit 12 executes displacement amount calculation processing to calculate the displacement amount of the position of the cargo.
- ⁇ X 1 X 1 ⁇ X 0
- ⁇ X 2 X 2 ⁇ X 1
- ⁇ X 3 X 3 ⁇ X 2
- the fluctuation value calculation unit 12 obtains the position of the cargo from time t 0 to time t m for each predetermined unit time Delta] t.
- the fluctuation value calculation unit 12 calculates the fluctuation value ⁇ by the fluctuation value calculation process based on the first probability distribution and the equation (1).
- the fluctuation value ⁇ is a physical quantity represented by the left side of the equation (1).
- the value substituted for P ( ⁇ X) on the left side of the equation (1) is the value of the probability represented by the first probability distribution, and the value of the probability that the displacement amount of the cargo position is ⁇ X. It is.
- the repetition control unit 13 controls the fluctuation value calculation unit 12 so as to calculate a plurality of fluctuation values ⁇ . Specifically, the repeat control unit 13 first calculates fluctuation values so as to calculate fluctuation values ⁇ ⁇ ⁇ ⁇ in a plurality of predetermined unit times ⁇ t from the shortest unit time to the longest unit time with respect to one constant-speed movement data Control unit 12; Hereinafter, this control is referred to as unit time change repetitive control.
- the longest unit time is a predetermined time predetermined by the user, and is the shortest time of the time that can be taken by the unit time ⁇ t.
- the longest unit time is a predetermined time predetermined by the user, and is the longest time that can be taken by the unit time ⁇ t.
- the shortest unit time may be, for example, 10 ms.
- the longest unit time may be, for example, 100 ms.
- the unit time may be, for example, 50 ms.
- the repetition control unit 13 performs unit time change repetition control on each of the time course data including the constant speed movement data acquired by the first trajectory data acquisition unit 11.
- the unit time change repetition control controls, for example, the fluctuation value calculation unit 12 so as to calculate the fluctuation value ⁇ ⁇ ⁇ ⁇ at each ⁇ t in order from the shortest unit time ⁇ t from the shortest unit time to the longest unit time, for example. Control may be performed.
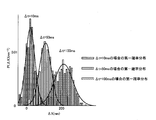
- FIG. 8 is a diagram showing a specific calculation result of the first probability distribution of the embodiment.
- FIG. 8 shows the first probability distribution when the unit time ⁇ t is 10 ms, 50 ms and 100 ms.
- the peak moves in the direction in which the value of ⁇ X at the peak of the distribution increases as the unit time ⁇ t increases. This result is a result of the cargo moving at a constant speed, and is a result of the longer the time the cargo travels.
- the dispersion becomes larger as the unit time ⁇ t becomes longer. The result is that the longer the time, the longer the moving distance of the cargo, and the greater the variation in the displacement amount of the cargo per unit time.
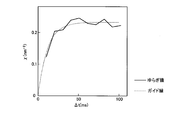
- FIG. 9 is a diagram showing a specific calculation result of the fluctuation value ⁇ of the embodiment. More specifically, FIG. 9 is a graph showing the value of ⁇ ⁇ per unit time ⁇ t with respect to one time course data. FIG. 9 shows that the fluctuation value ⁇ converges to a constant value as the unit time ⁇ t increases. The result that the fluctuation value ⁇ converges to a constant value as the ⁇ t increases is a result that reflects that the system is relaxed.
- the relaxation of the system means that the system including the cargo to be observed relaxes to the equilibrium state. Relaxation is caused by micro movement of substances contained in the system, ATP hydrolysis of motor proteins in the system, and the like.
- the clustering unit 14 performs clustering on the plurality of fluctuation values ⁇ calculated by the fluctuation value calculation unit 12 and outputs a value of ⁇ with reduced variation in measurement.
- the variation regarding measurement is, for example, variation of acquired data caused by a change in temperature or humidity of a system including an observation target at the time of measurement, a vibration of a measuring apparatus, or the like.
- the clustering unit 14 first performs clustering on the plurality of fluctuation values ⁇ ⁇ calculated by the fluctuation value calculation unit 12 under the control of the repetition control unit 13 to classify the fluctuation values ⁇ .
- Clustering may be performed by any method as long as it has a reference value for automatically estimating the number of clusters.
- the clustering unit 14 outputs the representative value of the result of clustering as a habit with reduced variation in measurement.
- the representative value may be any value as long as it represents a cluster for each method of clustering, and may be, for example, an average value or a median value.
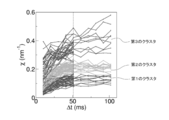
- FIG. 10 is a diagram showing fluctuation values ⁇ ⁇ ⁇ ⁇ ⁇ ⁇ ⁇ clustered by the clustering unit 14 of the embodiment.
- FIG. 10 shows three clusters (ie, first to third clusters) in which representative values are discretized.
- the representative values in FIG. 10 are average values.
- the representative values of the first to third clusters are, in ascending order, the representative value of the first cluster, the representative value of the second cluster, and the representative value of the third cluster.
- the representative value of the second cluster and the representative value of the third cluster are respectively integer multiples of the representative value of the first cluster.
- the fluctuation coefficient storage unit 15 stores the fluctuation coefficient A calculated by the fluctuation coefficient calculation device 2.
- the fluctuation coefficient storage unit 15 is configured using a storage device such as a magnetic hard disk drive or a semiconductor storage device.
- the force calculation unit 16 calculates the force F c applied to the cargo to be observed, based on the fluctuation value ⁇ and the fluctuation coefficient A. Specifically, F c is calculated using that the right side of Formula (1) and Formula (1) is ⁇ .
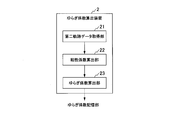
- FIG. 11 is a diagram showing a specific example of the functional configuration of the fluctuation coefficient calculation device 2 of the embodiment.
- the fluctuation coefficient calculation device 2 includes a second trajectory data acquisition unit 21, a viscosity coefficient calculation unit 22, and a fluctuation coefficient calculation unit 23.
- the second trajectory data acquisition unit 21 acquires time course data including constant speed movement data and static data generated based on observation data.
- Stationary data is data included in a time course, and is data showing temporal changes in the position of the cargo during a period in which the position of the cargo is substantially the same regardless of time (hereinafter referred to as "stationary period").
- the static data is data indicating a temporal change of the position of the cargo during a period in which the cargo remains at the same position regardless of the time.
- the static data is also a set of data having two values of time t and position X of the cargo, similarly to the time course data.
- time course data including constant speed movement data a ratio of time course data including not only constant speed movement data but also still data is approximately 10%.
- FIG. 12 is a diagram showing a specific example of time course data including stationary data and constant speed movement data according to the embodiment.
- the horizontal axis represents time
- the vertical axis represents the position X of the cargo.
- X on the vertical axis is represented as X (t) in order to specify that the position X depends on the time t.
- X (t) in order to specify that the position X depends on the time t.
- data in a period from time t s1 to time t s2 is data indicating that the cargo to be observed remains at the same position regardless of the time. That is, the data in the period from time t s1 to time t s2 in FIG. 12 is a specific example of static data. The period from time t s1 to time t s2 is a specific example of the stationary period. The data in the period from time 0 to time t s1 is a specific example of the constant speed movement data similar to FIG.
- the viscosity coefficient calculation unit 22 calculates the viscosity coefficient based on the static data. Specifically, the viscosity coefficient calculation unit 22 calculates the viscosity coefficient by sequentially executing the second probability distribution calculation processing, the distribution coefficient calculation processing, the power spectrum calculation processing, the power coefficient calculation processing, and the viscosity coefficient calculation processing. .
- the second probability distribution calculation process is a process of calculating a probability distribution (hereinafter referred to as “second probability distribution”) of the position X of the cargo at time t in the stationary period based on one static data.
- the second probability distribution is a distribution according to the Boltzmann distribution.
- the value of the fitting parameter K is obtained by performing fitting using the Boltzmann function P B (X), which is a function including K as a fitting parameter, on the second probability distribution calculated by the second probability distribution calculation process.
- the fitting parameter K is referred to as a distribution coefficient.
- the fitting may be performed by any fitting method, for example, by the least squares method.
- P B (X) represents the probability that the position of the cargo is X.
- Z and T represent the distribution function and the temperature of the environment, respectively.
- the temperature of the environment is the temperature of the medium surrounding the cargo to be observed.
- the power spectrum calculation process is a process of Fourier-transforming the second probability distribution with the frequency ⁇ to calculate a power spectrum.
- the power coefficient calculation process is a process of calculating a fitting parameter B p by fitting a power spectrum with a Lorentzian function g ( ⁇ ) including A p and B p as fitting parameters.
- the specific functional form of the function g (v) is the functional form represented by the equation (5).
- the fitting parameter B p is referred to as a power coefficient.
- the fitting may be performed by any fitting method, for example, by the method of least squares.
- the viscosity coefficient calculation process is a process of calculating a viscosity coefficient ⁇ expressed by the following equation (6) using the distribution coefficient K and the power coefficient B p .
- the fluctuation coefficient calculation unit 23 calculates the fluctuation coefficient A based on the viscosity coefficient ⁇ and the fluctuation value ⁇ .
- the viscosity coefficient calculation unit calculates the fluctuation coefficient A by sequentially executing the speed calculation processing and the fluctuation coefficient calculation processing.
- the speed calculation process is a process of calculating the speed average velocity V of the cargo during the constant speed movement period using the constant speed movement data of the time course data including the static data. Specifically, the speed calculation process is a process of calculating the slope of the regression line of the constant speed movement data in a graph in which the horizontal axis is time and the vertical axis is the position of the cargo.
- the fluctuation coefficient calculation process is a process of calculating the fluctuation coefficient A by the velocity V, the viscosity coefficient ⁇ and the fluctuation value ⁇ .
- the fluctuation coefficient calculation unit 23 has data having two values of the force F c calculated by the equation (3) and the fluctuation value ⁇ calculated by the fluctuation value calculation unit 12 (hereinafter referred to as “force Data) is acquired for a plurality of time course data including static data and constant speed movement data.
- force Data the fluctuation coefficient calculation unit 23 in the fluctuation coefficient calculation process, a plurality of force fluctuation values corresponding data acquired is fitted by a linear function as shown in formula (7) containing a fitting parameters A 1.
- a 1 is a fitting parameter, and the value of A 1 obtained by fitting is a fluctuation coefficient A. It is apparent from equations (1) and (6) that the value of A 1 obtained by fitting is the fluctuation coefficient A.
- FIG. 13 is a flowchart showing a flow of a specific process in which the force measurement device 1 of the embodiment calculates the force applied to the motor protein.
- the imaging device 9 generates observation data of a cargo to be observed (step S101).
- the first trajectory data acquisition unit 11 acquires time course data including constant-velocity movement data generated based on the observation data acquired by the imaging device 9 (step S102).
- the repetition control unit 13 executes unit time repetition control for a plurality of predetermined unit times ⁇ t on one of the time course data including the constant speed movement data (hereinafter referred to as “calculation target data”).
- the fluctuation value ⁇ at a plurality of unit times ⁇ t is calculated (step S103).
- the repetition control unit 13 determines whether or not there is time course data for which the first probability distribution calculation process has not been performed among the time course data including the constant-velocity movement data acquired by the first trajectory data acquisition unit 11. (Step S104). If there is no time course data for which the first probability distribution calculation process has not been performed (step S104: No), the clustering unit 14 performs clustering on the fluctuation value ⁇ to reduce fluctuation value ⁇ of the measurement. It calculates (step S105).
- the second trajectory data acquisition unit 21 acquires time course data including static data and constant speed movement data (step S106).
- the viscosity coefficient calculation unit 22 executes a second probability distribution calculation process to obtain a second trajectory data acquisition unit. The second probability distribution is calculated based on the static data acquired by the H.21 (step S107).
- the viscosity coefficient calculation unit 22 executes a distribution coefficient calculation process on the second probability distribution, and the distribution coefficient K in the Boltzmann function P B (X) represented by the equation (4) The value of is calculated (step S108).
- the viscosity coefficient calculation unit 22 that has calculated the distribution coefficient K executes power spectrum calculation processing on the second probability distribution to calculate a power spectrum (step S109).
- the viscosity coefficient calculation unit 22 that has calculated the power spectrum executes viscosity coefficient calculation processing to calculate a viscosity coefficient ⁇ (step S110).
- the fluctuation coefficient calculation unit 23 executes fluctuation coefficient calculation processing to calculate the fluctuation coefficient A (step S111).
- the force calculation unit 16 calculates the force F c applied to the cargo based on ⁇ calculated in step S105 and the fluctuation coefficient A calculated in step S111 (step S112). .
- step S104 when there is time course data for which the first probability distribution calculation process has not been performed in step S104 (step S104: Yes), the repetition control unit 13 sets the time course data as new calculation target data (step S113). The repetition control unit 13 executes unit time repetition control on new calculation target data (step S103).
- Steps S106 to S110 need not necessarily be performed after step S107, and may be performed in parallel with steps S103 to S105, or may be performed before steps S103 to S105.
- FIG. 14 is a flowchart showing the flow of a specific process of the unit time repetitive control (step S103) of the embodiment.
- the fluctuation value calculation unit 12 acquires the time course data acquired by the first trajectory data acquisition unit 11, and executes a first probability distribution calculation process (step S201).
- the fluctuation value calculation unit 12 calculates the first probability distribution by executing the first probability distribution calculation process.
- the fluctuation value calculation unit 12 that has calculated the first probability distribution calculates fluctuation value ⁇ by executing fluctuation value calculation processing (step S202).
- the fluorescent dye DiI was added to a culture medium of neural cells in culture to a final concentration of 100 nM and stained for 10 minutes, and then used for fluorescence observation.
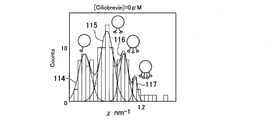
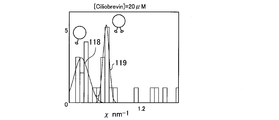
- FIGS. 15A, 15B and 15C show that addition of Ciliobrevin, which is a reagent that inhibits the function of a motor protein, to melanocytes changes the frequency distribution of fluctuation values using the force measurement device 1 of the embodiment. It is a figure which shows the concrete result which shows that it became clear by measurement of the eyelid.
- FIG. 15A is a diagram showing a frequency distribution of fluctuation value ⁇ measured by the force measurement device 1 when Ciliobrevin is not added to cells.
- ⁇ is classified into four clusters (clusters 114 to 117) as the distribution of data.
- FIG. 15B is a diagram showing a frequency distribution of fluctuation value ⁇ measured by the force measurement device 1 when the concentration of Ciliobrevin in the cell culture medium is 20 ⁇ M.
- the data distribution is classified into two clusters (clusters 118 and 119).
- FIG. 15C is a diagram showing the frequency distribution of fluctuation value ⁇ measured by the force measurement device 1 when the concentration of Ciliobrevin in the cell culture medium is 40 ⁇ M.
- ⁇ is classified into one cluster 120 as the distribution of data.
- FIG. 15A A comparison of FIG. 15A, FIG. 15B and FIG. 15C shows that the number of clusters decreases as the addition of Ciliobrevin increases.
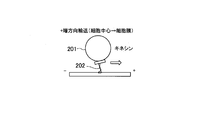
- FIGS. 16A and 16B are explanatory diagrams illustrating that endosomes are transported by kinesin or dynein between the cell center and the cell membrane.
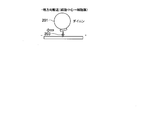
- FIG. 16A shows that endosome 201 is transported along the microtubule from the cell center to the cell membrane by kinesin 202 binding to itself.
- FIG. 16B shows that endosome 201 is transported along the microtubule from the cell membrane to the cell center by dynein 203 bound to itself.
- FIGS. 17A and 17B show that the difference in the frequency distribution of fluctuation values ⁇ between endosomal transport by kinesin and transport by dynein was revealed by measurement using the force measurement device 1 of the embodiment.
- FIG. 17A shows that the difference in the frequency distribution of fluctuation values ⁇ between endosomal transport by kinesin and transport by dynein was revealed by measurement using the force measurement device 1 of the embodiment.
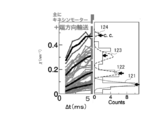
- FIG. 17A is a view showing the distribution of wrinkles when endosome 201 is transported by kinesin 202 shown in FIG. 16A.
- the fluctuation value ⁇ is classified into four clusters (clusters 121 to 124) in the data distribution. Clustering is the result of clustering analysis.
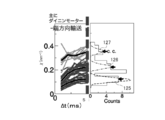
- FIG. 17B is a view showing the distribution of wing when endosome 201 is transported by dynein 203 shown in FIG. 16B.
- the fluctuation value ⁇ is classified into three clusters (clusters 125 to 127) in the data distribution.
- Comparison of FIGS. 17A and 17B shows that the transport of endosome 201 differs in the frequency distribution of fluctuation value ⁇ between cell center to cell membrane and cell membrane to cell center.
- the functional units of the force measurement device 1 and the fluctuation coefficient calculation device 2 may not necessarily be mounted in different housings, and may be mounted in one housing.
- the second trajectory data acquisition unit 21 does not necessarily have to acquire time course data including constant speed movement data and static data based on observation data, and the time course acquired by the first trajectory data acquisition unit 11 Data may be acquired, and among the acquired time course data, time course data including fixed speed movement data and static data may be acquired.
- the time course data including the constant-velocity movement data acquired by the first trajectory data acquisition unit 11 may be generated by the user based on the observation data, or may be generated by the device.
- the time course data including the constant velocity movement data and the static data acquired by the second trajectory data acquisition unit 21 may be generated by the user based on the observation data, or may be generated by the device.
- the constant-speed movement data used by the fluctuation value calculation unit 12 to calculate the fluctuation value may be manually selected by the user or may be selected by the apparatus.
- the constant-speed movement data and static data used by the fluctuation coefficient calculation device 2 may also be manually selected by the user or may be selected by the device. Also, the selection of cargo to be observed may be manually selected by the user or may be selected by the device.
- the image data group and the observation data may not necessarily be two-dimensional data, but may be three-dimensional or one-dimensional data.
- the force measuring device 1 and the fluctuation coefficient calculating device 2 in the above-described embodiment may be realized by a computer.
- a program for realizing this function may be recorded in a computer readable recording medium, and the program recorded in the recording medium may be read and executed by a computer system.
- the “computer system” includes an OS and hardware such as peripheral devices.
- the “computer-readable recording medium” means a portable medium such as a flexible disk, a magneto-optical disk, a ROM, a CD-ROM, or a storage device such as a hard disk built in a computer system.
- “computer-readable recording medium” dynamically holds a program for a short time, like a communication line in the case of transmitting a program via a network such as the Internet or a communication line such as a telephone line. It may also include one that holds a program for a certain period of time, such as volatile memory in a computer system that becomes a server or a client in that case. Further, the program may be for realizing a part of the functions described above, or may be realized in combination with the program already recorded in the computer system. It may be realized using a programmable logic device such as an FPGA (Field Programmable Gate Array).
- FPGA Field Programmable Gate Array
- the present invention was expressed as a force measuring device, the present invention can also be expressed as a force measuring method.
- the force measurement method according to the present invention corresponding to the force measurement device in the embodiment is the unit time of the cargo among the data included in the time course data indicating the trajectory of the movement of the cargo acquired by the noninvasive means.
- the first acquisition step corresponds to the operation or processing of the first trajectory data acquisition unit 11 in the embodiment
- the fluctuation value calculation step is the fluctuation in the embodiment This corresponds to the operation or processing of the value calculation unit 12 and the repetition control unit 13.
- the force calculation step corresponds to the operation or processing of the force calculation unit 16 in the embodiment.
- the operation or processing of the second trajectory data acquisition unit 21 in the embodiment is an example of the second acquisition step
- the operation or processing of the fluctuation coefficient calculation unit 23 in the embodiment is an example of the fluctuation coefficient calculation step.
- the first trajectory data acquisition unit 11 is an example of a first acquisition unit.
- the second trajectory data acquisition unit 21 is an example of a second acquisition unit.
- the constant speed movement data is an example of the first data.
- Still data is an example of second data.
Landscapes
- Engineering & Computer Science (AREA)
- Physics & Mathematics (AREA)
- Chemical & Material Sciences (AREA)
- Life Sciences & Earth Sciences (AREA)
- General Physics & Mathematics (AREA)
- Health & Medical Sciences (AREA)
- Bioinformatics & Cheminformatics (AREA)
- Organic Chemistry (AREA)
- Data Mining & Analysis (AREA)
- Wood Science & Technology (AREA)
- Zoology (AREA)
- General Engineering & Computer Science (AREA)
- Biotechnology (AREA)
- General Health & Medical Sciences (AREA)
- Biochemistry (AREA)
- Analytical Chemistry (AREA)
- Mathematical Physics (AREA)
- Theoretical Computer Science (AREA)
- Pure & Applied Mathematics (AREA)
- Mathematical Optimization (AREA)
- Mathematical Analysis (AREA)
- Computational Mathematics (AREA)
- Microbiology (AREA)
- Immunology (AREA)
- Proteomics, Peptides & Aminoacids (AREA)
- Genetics & Genomics (AREA)
- Algebra (AREA)
- Databases & Information Systems (AREA)
- Bioinformatics & Computational Biology (AREA)
- Evolutionary Biology (AREA)
- Operations Research (AREA)
- Probability & Statistics with Applications (AREA)
- Software Systems (AREA)
- Biophysics (AREA)
- Molecular Biology (AREA)
- Medicinal Chemistry (AREA)
- Biomedical Technology (AREA)
- Sustainable Development (AREA)
- Pathology (AREA)
- Force Measurement Appropriate To Specific Purposes (AREA)
Abstract
本発明の一態様は、非侵襲的な手段によって取得したカーゴの移動の軌跡を示すタイムコースデータに含まれるデータのうち、カーゴの単位時間の変位が略一定である期間におけるカーゴの位置の時間変化を示す第一のデータを取得する第一取得ステップと、前記第一のデータに基づく確率分布であって、単位時間における前記カーゴの所定の位置の変化量が所定の量である確率の分布を示す第一の確率分布に基づいて、前記カーゴを輸送するモータータンパク質が前記カーゴにくわえる力に比例するゆらぎ値を算出するゆらぎ値算出ステップと、算出した前記ゆらぎ値に基づいて、前記力を算出する力算出ステップと、を有する力測定方法である。
Description
本発明は、力測定方法、力測定装置、力測定システム、力測定プログラム及び記録媒体に関する。
本願は、2017年10月31日に、日本に出願された特願2017-210698号に基づき優先権を主張し、その内容をここに援用する。
本願は、2017年10月31日に、日本に出願された特願2017-210698号に基づき優先権を主張し、その内容をここに援用する。
多くの真核細胞は発達した細胞内輸送システムを備えている。従来、神経細胞が細胞内輸送システムの研究対象として用いられてきた。神経細胞は、細胞体と細胞体から延びる長い突起(軸索)とを有する。神経細胞の形態は細胞骨格を構成するタンパク質群によって形成されており、軸索は主に微小管を構成するチューブリンによって形成されている。微小管は、細胞体と軸索の先端にあるシナプスとの間の物流システム(軸索輸送)の幹線として機能する。軸索輸送で運ばれるカーゴ(Cargo)の例として、脂質二重膜によって覆われた細胞内小器官(オルガネラ)や小胞(ベシクル)が知られている。細胞小器官の例としては、例えば、ミトコンドリアやエンドソームが知られている。小胞内には、軸索やシナプスの形成材料又は情報伝達物質としてのタンパク質、核酸高分子、低分子等が含まれている。カーゴの輸送には、細胞体から軸索先端側へ向かう順行性輸送と、その逆方向の逆行性輸送とがある。順行性輸送では、キネシンと呼ばれるモータータンパク質が、カーゴを背負って微小管の上を辿りながら移動することが知られている。同様に、逆行性輸送ではダイニンと呼ばれるモータータンパク質が、カーゴの輸送を担っている。モータータンパク質は、ATPの加水分解によって得たエネルギーを用いてカーゴを輸送する。
軸索輸送の乱れは、アルツハイマー病やパーキンソン病などの神経性疾患の一因とも考えられており、軸索輸送の解析が神経性疾患の理解や治療に貢献すると期待されている。
ここまで、軸索輸送を具体例としてモーター蛋白質によるカーゴの輸送を説明したが、モータータンパク質によるカーゴの輸送は、軸索輸送に限られない。神経細胞においても、軸索のみならず、樹状突起などの突起内あるいは細胞体におけるカーゴの輸送が行われる。その際、カーゴは必ずしも脂質二重膜に覆われているとは限らず、タンパク質複合体あるいはタンパク質・核酸複合体などの場合がある。また、モータータンパク質は、必ずしも微小管の上を辿って移動するキネシンあるいはダイニンだけが用いられるわけではなく、アクチン繊維上を移動するミオシンなど様々なモーター分子が用いられる場合がある。また、細胞内輸送は、神経細胞に限らず、全ての真核細胞で同様の機構により行われている。例えば皮膚のメラニン細胞(メラノサイト)では、メラニン色素を含む細胞内顆粒がカーゴとして輸送され、膵臓のインスリン分泌細胞では、インスリンを含む細胞内小胞がカーゴとして輸送される。すなわち、ここまで、神経細胞を具体例としてモータータンパク質によるカーゴの輸送を説明したが、モータータンパク質によるカーゴの輸送は、必ずしも神経細胞だけで行われるわけではなく、神経細胞以外の細胞であっても行われる。例えば、神経細胞以外の細胞では、モータータンパク質によるカーゴの輸送は、軸索の他、微小管の上をモータータンパク質が移動することで行われる。
従来、このようなカーゴの輸送を解析するため、生きている細胞内のカーゴにかかる力を測定することが行われていた。生きている細胞内のカーゴにかかる力を測定する方法としては、例えば、光ピンセットを用いた方法があった。光ピンセットを用いた方法は、光ピンセットによって観察対象のカーゴに力をくわえて、カーゴを引っ張ることでカーゴにかかる力を測定する方法であった。なお、カーゴにかかる力とは、例えば、モータータンパク質がカーゴにかける力である。
K. Hayashi, C.G. Pack, M.K. Sato, K. Mouri, K. Kaizu, K. Takahashi, and Y. Okada、"Viscosity and drag force involved in organelle transport: Investigation of the fluctuation dissipation theorem"、The European Physical Jounal E, 36: 136 (2013)
しかしながら、光ピンセットを用いた方法は、カーゴとその周囲の細胞質の屈折率差及びカーゴの大きさとレーザー光の強度が発生力を決めるため、油滴のような特定のカーゴ以外への適用が難しい。その結果、光ピンセットを用いた方法を油滴等以外のカーゴに適用しようとすると過大な強度のレーザー光が必要であり、細胞侵害・熱的ダメージを生じる場合があった。
このように、光ピンセットを用いた方法は、レーザー光を用いる侵襲的な方法であるため観察対象の細胞を傷つける可能性があるという問題があった。
このように、光ピンセットを用いた方法は、レーザー光を用いる侵襲的な方法であるため観察対象の細胞を傷つける可能性があるという問題があった。
上記事情に鑑み、本発明は、生きている細胞内のカーゴにかかる力を非侵襲的な方法で測定する技術を提供することを目的としている。
本発明の一態様は、非侵襲的な手段によって取得したカーゴの移動の軌跡を示すタイムコースデータに含まれるデータのうち、カーゴの単位時間の変位が略一定である期間におけるカーゴの位置の時間変化を示す第一のデータを取得する第一取得ステップと、前記第一のデータに基づく確率分布であって、単位時間における前記カーゴの所定の位置の変化量が所定の量である確率の分布を示す第一の確率分布に基づいて、前記カーゴを輸送するモータータンパク質が前記カーゴにくわえる力に比例するゆらぎ値を算出するゆらぎ値算出ステップと、算出した前記ゆらぎ値に基づいて、前記力を算出する力算出ステップと、を有する力測定方法である。
本発明の一態様は、上記の力測定方法であって、前記力算出ステップは、前記ゆらぎ値に対してクラスタリングを行うことで前記力を算出する。
本発明の一態様は、上記の力測定方法であって、非侵襲的な手段によって取得したカーゴの移動の軌跡を示すタイムコースデータのうち、前記第一のデータと、前記カーゴの位置が時間によらず略同一の位置である期間の前記カーゴの位置の時間変化を示す第二のデータとを含むタイムコースデータを取得する第二取得ステップと、
前記力と前記ゆらぎ値との換算係数であるゆらぎ係数を前記第一及び第二のデータに基づいて算出するゆらぎ係数算出ステップとを有する。
前記力と前記ゆらぎ値との換算係数であるゆらぎ係数を前記第一及び第二のデータに基づいて算出するゆらぎ係数算出ステップとを有する。
本発明の一態様は、上記の力測定方法であって、前記ゆらぎ係数算出ステップは、前記第二のデータに基づいて、前記カーゴを囲む媒質の粘性係数を算出する。
本発明の一態様は、上記の力測定方法であって、前記ゆらぎ係数算出ステップは、前記第二取得ステップにおいて取得された前記第一のデータに基づいて、前記カーゴが移動する速さを算出する。
本発明の一態様は、上記の力測定方法であって、前記ゆらぎ係数算出ステップは、前記粘性係数と前記速さとに基づいて前記ゆらぎ係数を算出する。
本発明の一態様は、上記の力測定方法であって、前記ゆらぎ値算出ステップは、前記位置の変化量をΔXとし、前記単位時間におけるΔXの値がΔX1である確率を第一の確率P1(ΔX1)とし、前記ゆらぎ値をχとした場合に、χ=ln[P1(ΔX1)/P1(-ΔX1)]/ΔX1の式によってχを算出する。
本発明の一態様は、非侵襲的な手段によって取得したカーゴの移動の軌跡を示すタイムコースデータに含まれるデータのうち、カーゴの単位時間の変位が略一定である期間におけるカーゴの位置の時間変化を示す第一のデータを取得する第一取得部と、前記第一のデータに基づく確率分布であって、単位時間における前記カーゴの所定の位置の変化量が所定の量である確率の分布を示す第一の確率分布に基づいて、前記カーゴを輸送するモータータンパク質が前記カーゴにくわえる力に比例するゆらぎ値を算出するゆらぎ値算出部と、算出した前記ゆらぎ値に基づいて、前記力を算出する力算出部と、を備える力測定装置である。
本発明の一態様は、非侵襲的な手段によって取得したカーゴの移動の軌跡を示すタイムコースデータに含まれるデータのうち、カーゴの単位時間の変位が略一定である期間におけるカーゴの位置の時間変化を示す第一のデータを取得する第一取得部と、前記第一のデータに基づく確率分布であって、単位時間における前記カーゴの所定の位置の変化量が所定の量である確率の分布を示す第一の確率分布に基づいて、前記カーゴを輸送するモータータンパク質が前記カーゴにくわえる力に比例するゆらぎ値を算出するゆらぎ値算出部と、算出した前記ゆらぎ値に基づいて、前記力を算出する力算出部と、を備える力測定システムである。
本発明の一態様は、コンピュータに、非侵襲的な手段によって取得したカーゴの移動の軌跡を示すタイムコースデータに含まれるデータのうち、カーゴの単位時間の変位が略一定である期間におけるカーゴの位置の時間変化を示す第一のデータを取得させ、前記コンピュータに、前記タイムコースデータに基づく確率分布であって、単位時間中における前記カーゴの所定の位置の変化量が所定の量である確率の分布を示す第一の確率分布に基づいて、前記カーゴを輸送するモータータンパク質が前記カーゴにくわえる力に比例するゆらぎ値を算出させ、前記コンピュータに、算出した前記ゆらぎ値に基づいて、前記力を算出させるための力測定プログラムである。
本発明の一態様は、コンピュータに、非侵襲的な手段によって取得したカーゴの移動の軌跡を示すタイムコースデータに含まれるデータのうち、カーゴの単位時間の変位が略一定である期間におけるカーゴの位置の時間変化を示す第一のデータを取得させ、前記コンピュータに、前記タイムコースデータに基づく確率分布であって、単位時間中における前記カーゴの所定の位置の変化量が所定の量である確率の分布を示す第一の確率分布に基づいて、前記カーゴを輸送するモータータンパク質が前記カーゴにくわえる力に比例するゆらぎ値を算出させ、前記コンピュータに、算出した前記ゆらぎ値に基づいて、前記力を算出させるためのプログラムを記憶する記録媒体である。
本発明により、生きている細胞内のカーゴにかかる力を非侵襲的な方法で測定することが可能となる。
(原理)
本発明は、カーゴにかかる力に対してゆらぎの定理によって関係づけられた物理量を測定することでカーゴにかかる力を測定する。そこで、本発明の説明にあたって、まずはゆらぎの定理を説明した後、本発明によってカーゴにかかる力が測定される原理を説明する。
本発明は、カーゴにかかる力に対してゆらぎの定理によって関係づけられた物理量を測定することでカーゴにかかる力を測定する。そこで、本発明の説明にあたって、まずはゆらぎの定理を説明した後、本発明によってカーゴにかかる力が測定される原理を説明する。
ゆらぎの定理はD.J.Evansらによって1993年に発表された、物理学の1分野である非平衡統計力学の定理である。ゆらぎの定理は、熱力学的に非平衡な状態にある系における所定の物理量と、その所定の物理量を変化させる物理量とを関係づける定理である。熱力学的に非平衡な状態にある系とは、例えば、カーゴが移動する系であり、その場合、ゆらぎの定理は、その系におけるカーゴの位置と、カーゴにかかる力とを関係づける。その場合、移動するカーゴの位置とその移動するカーゴにかかる力とを関係づけるゆらぎの定理は、次の式で表わされることが知られている。

ΔXは、単位時間中のカーゴの変位量を表し、P(ΔX)は、カーゴの変位量がΔXである確率を表す。なお、ΔXは、以下の式(2)で示される。

式(2)において、X(t)は、時刻tにおけるカーゴの位置である。式(2)において、X(t+Δt)は、時刻t+Δtにおけるカーゴの位置である。
ΔXは、力Fc(式(1)ではFと表記)は、カーゴにかかる力の大きさを表す。Aは、式(1)の左辺が表す物理量と力Fcとの換算係数である。以下、式(1)の左辺が表す物理量をゆらぎ値χといい、Aをゆらぎ係数という。ゆらぎ係数Aは、カーゴとモータータンパク質との組み合わせに固有の値である。
ΔXは、力Fc(式(1)ではFと表記)は、カーゴにかかる力の大きさを表す。Aは、式(1)の左辺が表す物理量と力Fcとの換算係数である。以下、式(1)の左辺が表す物理量をゆらぎ値χといい、Aをゆらぎ係数という。ゆらぎ係数Aは、カーゴとモータータンパク質との組み合わせに固有の値である。
カーゴの変位量が測定されれば、ゆらぎ値χが算出される。そのため、ゆらぎ係数Aが与えられれば、式(1)によりカーゴにかかる力Fcが算出され得る。
なお、カーゴの変位量は、カーゴの位置の変化量を表す。また、カーゴの位置とは、カーゴの部位の位置であればどのような位置であってもよく、例えば、カーゴの重心位置である。
なお、カーゴの変位量は、カーゴの位置の変化量を表す。また、カーゴの位置とは、カーゴの部位の位置であればどのような位置であってもよく、例えば、カーゴの重心位置である。
図1A及び図1Bは、ゆらぎの定理が力Fcを反映することを説明する説明図である。図1A及び図1Bは、どちらもカーゴに力がかかる場合におけるΔXの確率分布を表す。ただし、図1Aは、カーゴにかかるノイズが大きい場合のΔXの確率分布を表す。
図1A及び図1Bにおける確率分布は、例えば、どちらもガウス分布に従う確率分布である。図1Aと図1Bとを比較すると、図1Aにおいては、カーゴにかかるノイズが小さいため、ΔXがとり得る値の範囲が図1BにおけるΔXがとり得る値の範囲よりも狭い。
そのため、図1Aにおける確率分布のピークの高さは、図1Aにおける確率分布のピークの高さよりも低い。しかしながらP(ΔX)とP(-ΔX)の比はどちらも等しく、P(ΔX)そのものでなくP(ΔX)とP(-ΔX)の比が力Fcを反映していることを表す。そのため、ゆらぎの定理は力Fcを反映する定理であると言える。
図1A及び図1Bにおける確率分布は、例えば、どちらもガウス分布に従う確率分布である。図1Aと図1Bとを比較すると、図1Aにおいては、カーゴにかかるノイズが小さいため、ΔXがとり得る値の範囲が図1BにおけるΔXがとり得る値の範囲よりも狭い。
そのため、図1Aにおける確率分布のピークの高さは、図1Aにおける確率分布のピークの高さよりも低い。しかしながらP(ΔX)とP(-ΔX)の比はどちらも等しく、P(ΔX)そのものでなくP(ΔX)とP(-ΔX)の比が力Fcを反映していることを表す。そのため、ゆらぎの定理は力Fcを反映する定理であると言える。
カーゴの変位が測定された場合には、式(1)の左辺の値だけでなくゆらぎ係数Aも算出され得る。このことを以下で説明する。粘性のある媒質中を速さVで定速移動するカーゴにおいては、モータータンパク質によってカーゴにくわえられる力と、媒質による粘性抵抗の力とが釣り合う。そのため、媒質の粘性係数Γがわかれば、モータータンパク質によってカーゴにくわえられる力Fcが算出され得る。具体的には、力Fcと粘性係数Γとは以下の式(3)の関係を満たす。

そのため、ゆらぎ値χと、粘性係数Γに基づいて算出された力Fcとに基づいて、ゆらぎ係数Aが算出される。なお、ゆらぎ係数Aは、ボルツマン定数kbと、非平衡状態における観察対象のカーゴを含む系の温度Teff(すなわち、一般に非平衡温度又は有効温度といわれる温度)との積である。非平衡状態は、カーゴが輸送されている状態である。
モータータンパク質によるカーゴの輸送においては、Teffは一定値である。このことは実験的に検証済みである。
モータータンパク質によるカーゴの輸送においては、Teffは一定値である。このことは実験的に検証済みである。
(実施形態)
図2は、実施形態の力測定装置1を用いて構成された力測定システム100の具体例を示す図である。力測定システム100は、非侵襲的な手段によって細胞中のカーゴを検出し、そのカーゴの動きを記録することで、そのカーゴにかかる力を測定するシステムである。力測定システム100は、力測定装置1、ゆらぎ係数算出装置2及び撮像装置9を備える。
図2は、実施形態の力測定装置1を用いて構成された力測定システム100の具体例を示す図である。力測定システム100は、非侵襲的な手段によって細胞中のカーゴを検出し、そのカーゴの動きを記録することで、そのカーゴにかかる力を測定するシステムである。力測定システム100は、力測定装置1、ゆらぎ係数算出装置2及び撮像装置9を備える。
なお、本発明が観察対象とする細胞は、カーゴ及びモータータンパク質を有し、細胞内でモータータンパク質がカーゴを輸送する細胞であれば、どのような細胞であってもよい。一般的に知られる真核細胞の多くはこのようなカーゴ及びモータータンパク質を有する。細胞内におけるカーゴの輸送を観察し易いことから、観察対象は神経細胞であることが好ましい。神経細胞以外で観察対象として好適な細胞としては、例えばグリア細胞、血管内皮細胞、皮膚などの繊維芽細胞、メラニン細胞、一般的に用いられる株化された動物細胞、卵細胞等が挙げられる。
本発明が観察対象とする神経細胞の種類は特に限定されず、例えば、神経細胞内の動画撮影が容易である観点からin vitroで培養可能な神経細胞が好ましい。また、神経細胞を補助する細胞あるいはその他の細胞を併存させた細胞であってもよい。このような細胞として、例えば、アストロサイト(星状膠細胞)、オリゴデンドロサイト、シュワン細胞などのグリア細胞、血管上皮細胞などの血管系細胞など、繊維芽細胞などの間葉系細胞などが挙げられる。また、このような神経細胞の例として、アミノ酸系神経伝達物質を分泌する神経細胞、ペプチド系神経伝達物質を分泌する神経細胞、モノアミン類やアセチルコリンを分泌する神経細胞等が挙げられる。神経細胞を培養する際には、生体内環境に近づける目的で、神経細胞を補助する細胞を併存させてもよい。このような補助細胞として、例えば、アストロサイト(星状膠細胞)、オリゴデンドロサイト、シュワン細胞等のグリア細胞等が挙げられる。
また、本発明が観察対象とする細胞内で輸送されるカーゴの種類は特に限定されず、光学機器によってゆらぎを測定可能なカーゴであればよい。ゆらぎを測定する際のカーゴの蛍光標識の有無は限定されない。カーゴが脂質二重膜で包まれた小胞又は細胞小器官である場合、例えば、DiD、DiI、DiO、DiR等のカルボシアニン色素によって蛍光標識することができる。あるいは、カーゴに含まれるタンパク質をGFPなどの蛍光タンパク質によって蛍光標識することができる。その他、蛍光色素を用いた染色、ビオチン・アビジン、抗体などを用いた公知の標識方法も適用可能である。観察するカーゴの輸送経路は特に限定されず、軸索輸送でもよいし、その他の細胞内輸送であってもよく、解析の目的に応じて適宜選択することができる。
力測定装置1は、観察対象のカーゴの動きを示す画像のデータ群に基づいて、観察対象のカーゴにかかる力Fcを算出する。以下、観察対象のカーゴの動きを示す画像のデータ群を、観察データという。観察対象のカーゴの動きを示す画像は、例えば、二次元画像であってもよい。また、観察データは、例えば動画であってもよい。
ゆらぎ係数算出装置2は、観察データに基づいて、観察対象のカーゴのゆらぎ係数Aを算出する。ゆらぎ係数算出装置2は、算出したゆらぎ係数Aを力測定装置1に出力する。
撮像装置9は、非侵襲的な手段によって、観察対象のカーゴを撮影し、そのカーゴの動きを記録した観察データを生成する。非侵襲的な手段とは、例えば、可視光で観察対象に関する情報を取得する手段であってもよい。観察対象に関する情報とは、例えば、観察対象の重心位置を示す信号である。また、非侵襲的な手段とは、例えば、観察対象を蛍光標識しその蛍光によって観察対象に関する情報を取得する手段であってもよい。これらの非侵襲的な手段は、蛍光顕微鏡や、微分干渉顕微鏡等の顕微鏡を用いて実現されてもよい。
また、非侵襲的な手段とは、観察対象への影響が少ない強度の磁場によって観察対象に関する情報を取得する手段であってもよい。なお、侵襲的な手段とは、例えば、光ピンセットのような、観察対象へレーザーを照射することで観察対象に関する情報を取得する手段である。
また、非侵襲的な手段とは、観察対象への影響が少ない強度の磁場によって観察対象に関する情報を取得する手段であってもよい。なお、侵襲的な手段とは、例えば、光ピンセットのような、観察対象へレーザーを照射することで観察対象に関する情報を取得する手段である。
なお、カーゴの動きを記録した観察データを生成する方法は特に限定されず、例えば、市販の細胞動態観察用デジタルビデオカメラを備えた共焦点レーザー顕微鏡などを用いる公知方法が挙げられる。撮影のフレームレートとしては、カーゴの軸索輸送の速度等の観点から、10~100フレーム/秒程度またはそれ以上が好ましく、100フレーム/秒が特に好ましい。
また、撮影した画像フレーム中の軸索領域を抽出する工程又は手段では、種々の方法を適用することが可能であるが、例えば、目視によって軸索領域を判断する方法が行われる。
また、撮影した画像フレーム中の軸索領域を抽出する工程又は手段では、種々の方法を適用することが可能であるが、例えば、目視によって軸索領域を判断する方法が行われる。
図3は、実施形態の観察データの具体例を示す図である。
図3は、ある時刻tにおける二次元の静止画像である。図3の静止画像における点線で囲まれた領域は軸索を表す。図3において、線で囲まれた領域101内の発光する点は、観察対象のカーゴである。
図3は、ある時刻tにおける二次元の静止画像である。図3の静止画像における点線で囲まれた領域は軸索を表す。図3において、線で囲まれた領域101内の発光する点は、観察対象のカーゴである。
図4は、実施形態の複数の観察データが観察対象の移動を示すことを説明する説明図である。
図4において、画像102は、時刻t=0sにおける観察対象のカーゴの位置を示す。
なお、ここで観察対象のカーゴは、図3における領域101内の観察対象のカーゴである。図4において、画像103は、0sより後であって1.8sより前の時刻における観察対象のカーゴの位置を示す。図4において、画像104は、時刻t=1.8sにおける観察対象のカーゴの位置を示す。
図4において、画像102は、時刻t=0sにおける観察対象のカーゴの位置を示す。
なお、ここで観察対象のカーゴは、図3における領域101内の観察対象のカーゴである。図4において、画像103は、0sより後であって1.8sより前の時刻における観察対象のカーゴの位置を示す。図4において、画像104は、時刻t=1.8sにおける観察対象のカーゴの位置を示す。
観察データは、図3に示される二次元の静止画像を、時刻を変えて複数備えたデータ群である。そのため、観察データは、自身が備える異なる時刻における静止画像のデータによって、図4に示すような観察対象のカーゴの移動を示す。
図5は、実施形態の力測定装置1の機能構成の具体例を示す図である。力測定装置1は、第一軌跡データ取得部11、ゆらぎ値算出部12、繰り返し制御部13、クラスタリング部14、ゆらぎ係数記憶部15及び力算出部16を備える。
第一軌跡データ取得部11は、観察データに基づいて生成された定速移動データを含むタイムコースデータを取得する。タイムコースデータは、観察データが示す観察対象の軌跡の所定の一軸上の射影を示すデータであって、時刻tと時刻tにおけるカーゴの位置Xとの二つの値を有するデータの集合である。所定の一軸とは、どのような軸であってもよく、例えば、カーゴが輸送される方向に平行な軸であってもよい。また、定速移動データは、タイムコースデータに含まれるデータであって、カーゴの単位時間の変位が略一定である期間(以下「定速期間」という。)におけるカーゴの位置の時間変化を示すデータである。すなわち、定速移動データは、カーゴが概ね一定の速度で移動する期間のカーゴの位置の時間変化を示すデータである。定速移動データもまた、時刻tとカーゴの位置Xとの二つの値を有するデータの集合である。
図6は、実施形態のタイムコースデータ、定速移動データ及び定速期間の具体例を示す図である。
図6のグラフは、時刻t=0sからt=10sまでの時間におけるカーゴの位置Xを示すタイムコースデータである。図6において、横軸は時刻を表し、縦軸はカーゴの位置Xを表す。図6において縦軸のXは、位置Xが時刻tに依存することを明記するためにX(t)と表されている。図6において、時刻0から時刻ts1までの期間のデータは、観察対象のカーゴが概ね一定の速度で移動することを示すデータであり、定速移動データの具体例である。また、時刻0から時刻ts1までの期間は、定速期間の具体例である。図6には、定速移動データを示すグラフの一部分の拡大図も示されている。拡大図の直線は、定速移動データに対する回帰直線である。回帰直線は、Xの値が大きくなる方向に一定の速さでカーゴが移動することを示す。拡大図は、50ms以下の短時間ではカーゴの移動の速さは一定ではなく、50msで200nm以下の位置のゆらぎを有する速さで移動することを示す。
図6のグラフは、時刻t=0sからt=10sまでの時間におけるカーゴの位置Xを示すタイムコースデータである。図6において、横軸は時刻を表し、縦軸はカーゴの位置Xを表す。図6において縦軸のXは、位置Xが時刻tに依存することを明記するためにX(t)と表されている。図6において、時刻0から時刻ts1までの期間のデータは、観察対象のカーゴが概ね一定の速度で移動することを示すデータであり、定速移動データの具体例である。また、時刻0から時刻ts1までの期間は、定速期間の具体例である。図6には、定速移動データを示すグラフの一部分の拡大図も示されている。拡大図の直線は、定速移動データに対する回帰直線である。回帰直線は、Xの値が大きくなる方向に一定の速さでカーゴが移動することを示す。拡大図は、50ms以下の短時間ではカーゴの移動の速さは一定ではなく、50msで200nm以下の位置のゆらぎを有する速さで移動することを示す。
図5の説明に戻る。ゆらぎ値算出部12は、定速移動データに基づいてゆらぎ値χを算出する。具体的にはゆらぎ値算出部12は、第一確率分布算出処理を実行した後にゆらぎ値算出処理を実行することで、ゆらぎ値を算出する。以下、第一確率分布算出処理とゆらぎ値算出処理の具体的な処理内容を説明する。まず、第一確率分布算出処理を説明する。
第一確率分布算出処理は、ひとつの定速移動データに基づいて定速期間中の単位時間Δtにおけるカーゴの位置の変位量ΔXの確率分布を算出する処理である。具体的には、第一確率分布算出処理は、まず、定速移動データにおける時間原点をt0とし、時間原点t0におけるカーゴの位置をX0とし、時刻t0+n×Δt(nは整数)におけるカーゴの位置をXnとした場合の、カーゴの位置の変位量ΔXn=Xn-X(n-1)をさまざまなnに対して取得する。以下、カーゴの位置の変位量ΔXnをさまざまなnに対して取得する処理を変位量算出処理という。次に第一確率分布算出処理は、カーゴの位置の変位量ΔXの値がΔXnである確率分布(以下「第一確率分布」という。)を算出する。
図7は、実施形態の第一確率分布算出処理における変位量算出処理の具体的な手順を説明する説明図である。
図7のグラフは、図6におけるタイムコースデータの一部分の拡大図におけるグラフである。図7において、ゆらぎ値算出部12は、まず、変位量算出処理を実行することで、所定の単位時間Δtごとに時刻t0から時刻tmまでのカーゴの位置(すなわち、X0、X1、X2、・・・Xm)を取得する。次に、ゆらぎ値算出部12は、変位量算出処理を実行することで、カーゴの位置の変位量を算出する。すなわち、ΔX1=X1-X0、ΔX2=X2-X1、ΔX3=X3-X2、・・・ΔXm=Xm-Xm-1を算出する。このようにして、ゆらぎ値算出部12は、所定の単位時間Δtごとに時刻t0から時刻tmまでのカーゴの位置を取得する。
図7のグラフは、図6におけるタイムコースデータの一部分の拡大図におけるグラフである。図7において、ゆらぎ値算出部12は、まず、変位量算出処理を実行することで、所定の単位時間Δtごとに時刻t0から時刻tmまでのカーゴの位置(すなわち、X0、X1、X2、・・・Xm)を取得する。次に、ゆらぎ値算出部12は、変位量算出処理を実行することで、カーゴの位置の変位量を算出する。すなわち、ΔX1=X1-X0、ΔX2=X2-X1、ΔX3=X3-X2、・・・ΔXm=Xm-Xm-1を算出する。このようにして、ゆらぎ値算出部12は、所定の単位時間Δtごとに時刻t0から時刻tmまでのカーゴの位置を取得する。
図5の説明に戻る。ゆらぎ値算出部12が実行するゆらぎ値算出処理を説明する。ゆらぎ値算出部12は、ゆらぎ値算出処理によって、第一確率分布と式(1)とに基づいてゆらぎ値χを算出する。ゆらぎ値χは上述したように、式(1)の左辺が表す物理量である。ゆらぎ値算出処理において、式(1)の左辺におけるP(ΔX)に代入される値は、第一確率分布が表す確率の値であって、カーゴの位置の変位量がΔXである確率の値である。
繰り返し制御部13は、複数のゆらぎ値χを算出するようにゆらぎ値算出部12を制御する。具体的には、繰り返し制御部13は、まず、ひとつの定速移動データ対して、最短単位時間から最長単位時間までの所定の複数の単位時間Δtにおけるゆらぎ値χを算出するようにゆらぎ値算出部12を制御する。以下、この制御を単位時間変更繰り返し制御という。最長単位時間は、ユーザによって予め定められた所定の時間であって、単位時間Δtがとり得る時間のうち、最短の時間である。最長単位時間は、ユーザによって予め定められた所定の時間であって、単位時間Δtがとり得る時間のうち、最長の時間である。最短単位時間は例えば、10msであってもよい。最長単位時間は例えば、100msであってもよい。また、単位時間は例えば、50msであってもよい。さらに、繰り返し制御部13は、単位時間変更繰り返し制御を、第一軌跡データ取得部11が取得した定速移動データを含むタイムコースデータのそれぞれに対して行う。
なお、単位時間変更繰り返し制御は、例えば、最短単位時間から最長単位時間まで、時間の短い方の単位時間Δtから順番に各Δtにおける、ゆらぎ値χを算出するようにゆらぎ値算出部12を制御する制御であってもよい。
なお、単位時間変更繰り返し制御は、例えば、最短単位時間から最長単位時間まで、時間の短い方の単位時間Δtから順番に各Δtにおける、ゆらぎ値χを算出するようにゆらぎ値算出部12を制御する制御であってもよい。
図8及び図9によって、ゆらぎ値算出部12及び繰り返し制御部13によって算出された第一確率分布及びゆらぎ値χの具体例を示す。
図8は、実施形態の第一確率分布の具体的な算出結果を示す図である。図8は、単位時間Δtを10ms、50ms及び100msとした場合の第一確率分布を表す。第一確率分布は、単位時間Δtが長くなるほど、分布のピークにおけるΔXの値が大きくなる方向にピークが移動する。この結果は、カーゴが一定の速さで動いているために生じた結果であり、時間が長くなればカーゴが移動する距離が長くなるために生じた結果である。また、第一確率分布は、単位時間Δtが長くなるほど分散が大きくなる。この結果は、時間が長くなるほどカーゴが移動する距離が長くなり、単位時間におけるカーゴの変位量のばらつきが大きくなるために生じた結果である。
図9は、実施形態のゆらぎ値χの具体的な算出結果を示す図である。より具体的には、図9は、ひとつのタイムコースデータに対する複数の単位時間Δtごとのχの値を示すグラフである。図9は、単位時間Δtが大きくなるにつれてゆらぎ値χが一定値に収束することを示す。Δtが大きくなるにつれてゆらぎ値χが一定の値に収束する結果は、系が緩和することが反映された結果である。系が緩和するとは、観察対象のカーゴを含む系が平衡状態に緩和することを意味する。緩和は、系に含まれる物質のミクロな運動や、その系内のモータータンパク質のATP加水分解等によって引き起こされる。
図5の説明に戻る。クラスタリング部14は、ゆらぎ値算出部12が算出した複数のゆらぎ値χを対象としてクラスタリングを実行し、測定に関するばらつきを減らしたχの値を出力する。なお、測定に関するばらつきとは、例えば、測定時の観察対象を含む系の温度や湿度等の変化や測定装置の振動等によって引き起こされる取得データのばらつきである。具体的には、クラスタリング部14はまず、繰り返し制御部13の制御によってゆらぎ値算出部12が算出した複数のゆらぎ値χに対してクラスタリングを実行しゆらぎ値χを分類する。クラスタリングは、クラスタ数を自動推定するための基準値を有するクラスタリング方法であればどのような方法で行われてもよい。例えば、基準値であるAIC(Akaike's Information Criterion)の算出を伴ったk-means methodであってもよい。クラスタ数を自動推定するための基準値はAICに限らず、例えばBIC(Bayesian Information Criterion)や、MDL(Minimum Description Length)等の基準値であってもよい。クラスタリングする方法はk-means methodに限らず、例えば、k-means++ methodであってもよい。
次にクラスタリング部14は、クラスタリングした結果の代表値を、測定に関するばらつきを減らしたχとして出力する。なお、代表値はクラスタリングの方法ごとにクラスタを代表する値であればどのような値であってもよく、例えば、平均値であってもよいし、中央値であってもよい。
次にクラスタリング部14は、クラスタリングした結果の代表値を、測定に関するばらつきを減らしたχとして出力する。なお、代表値はクラスタリングの方法ごとにクラスタを代表する値であればどのような値であってもよく、例えば、平均値であってもよいし、中央値であってもよい。
図10は、実施形態のクラスタリング部14によってクラスタリングされたゆらぎ値χを示す図である。図10は、代表値が離散化された3つのクラスタ(すなわち、第1~3のクラスタ)を表す。第1のクラスタに属するゆらぎ値χの大きさは、Δt=100msにおいて、0以上0.2以下の値である。第2のクラスタに属するゆらぎ値χの大きさは、Δt=100msにおいて、0.1以上0.2以下の値である。第3のクラスタに属するゆらぎ値χの大きさは、Δt=100msにおいて、0.3以上0.6以下の値である。なお、図10における代表値は平均値である。第1~3のクラスタの代表値の値は、小さな順に、第1のクラスタの代表値、第2のクラスタの代表値、第3のクラスタの代表値である。また、第2のクラスタの代表値及び第3のクラスタの代表値は、それぞれ第1のクラスタの代表値の整数倍である。
ゆらぎ係数記憶部15は、ゆらぎ係数算出装置2が算出したゆらぎ係数Aを記憶する。
ゆらぎ係数記憶部15は、磁気ハードディスク装置や半導体記憶装置などの記憶装置を用いて構成される。
ゆらぎ係数記憶部15は、磁気ハードディスク装置や半導体記憶装置などの記憶装置を用いて構成される。
力算出部16は、ゆらぎ値χとゆらぎ係数Aとに基づいて、観察対象のカーゴにかかる力Fcを算出する。具体的には、式(1)と式(1)の右辺がχであることを用いて、Fcを算出する。
図11は、実施形態のゆらぎ係数算出装置2の機能構成の具体例を示す図である。ゆらぎ係数算出装置2は、第二軌跡データ取得部21、粘性係数算出部22及びゆらぎ係数算出部23を備える。
第二軌跡データ取得部21は、観察データに基づいて生成された定速移動データ及び静止データを含むタイムコースデータを取得する。静止データは、タイムコースに含まれるデータであって、カーゴの位置が時間によらず略同一の位置である期間(以下「静止期間」という。)のカーゴの位置の時間変化を示すデータである。すなわち、静止データは、カーゴが時刻によらず同じ位置にとどまっている期間のカーゴの位置の時間変化を示すデータである。静止データもまたタイムコースデータと同様に、時刻tとカーゴの位置Xとの二つの値を有するデータの集合である。なお、定速移動データを含むタイムコースデータのうち、定速移動データだけではなく、さらに静止データをも含むタイムコースデータの割合は、1割程度である。
図12は、実施形態の静止データ及び定速移動データを含むタイムコースデータの具体例を示す図である。
図12のグラフは、図6のグラフと同様のグラフであり、時刻t=0sからt=10sまでの期間におけるカーゴの位置Xを示すタイムコースデータを示すグラフである。図12において、横軸は時刻を表し、縦軸はカーゴの位置Xを表す。図12においても、図6と同様に縦軸のXは、位置Xが時刻tに依存することを明記するためにX(t)と表されている。図12において、時刻ts1から時刻ts2までの期間のデータは、観察対象のカーゴが時刻によらず同じ位置にとどまっていることを示すデータである。すなわち、図12における時刻ts1から時刻ts2までの期間のデータは、静止データの具体例である。また、時刻ts1から時刻ts2までの期間は、静止期間の具体例である。なお、時刻0から時刻ts1までの期間のデータは、図5と同様の定速移動データの具体例である。
図12のグラフは、図6のグラフと同様のグラフであり、時刻t=0sからt=10sまでの期間におけるカーゴの位置Xを示すタイムコースデータを示すグラフである。図12において、横軸は時刻を表し、縦軸はカーゴの位置Xを表す。図12においても、図6と同様に縦軸のXは、位置Xが時刻tに依存することを明記するためにX(t)と表されている。図12において、時刻ts1から時刻ts2までの期間のデータは、観察対象のカーゴが時刻によらず同じ位置にとどまっていることを示すデータである。すなわち、図12における時刻ts1から時刻ts2までの期間のデータは、静止データの具体例である。また、時刻ts1から時刻ts2までの期間は、静止期間の具体例である。なお、時刻0から時刻ts1までの期間のデータは、図5と同様の定速移動データの具体例である。
図11の説明に戻る。粘性係数算出部22は、静止データに基づいて、粘性係数を算出する。具体的には、粘性係数算出部22は、第二確率分布算出処理、分布係数算出処理、パワースペクトル算出処理、パワー係数算出処理及び粘性係数算出処理を順次実行することで、粘性係数を算出する。
第二確率分布算出処理は、ひとつの静止データに基づいて静止期間中の時刻tにおけるカーゴの位置Xの確率分布(以下「第二確率分布」という。)を算出する処理である。第二確率分布は、ボルツマン分布にしたがう分布である。
分布係数算出処理は、第二確率分布算出処理によって算出された第二確率分布に対して、フィッティングパラメータとしてKを含む関数であるボルツマン関数PB(X)によるフィッティングを行い、フィッティングパラメータKの値を算出する。ボルツマン関数PB(X)の具体的な関数形は、式(4)で表される関数形である。以下、フィッティングパラメータKを分布係数という。なお、フィッティングは、どのようなフィッティング方法で行われてもよく、例えば、最小二乗法によって行われてもよい。

PB(X)は、カーゴの位置がXである確率を表す。Z及びTはそれぞれ、分配関数及び環境の温度を表す。環境の温度とは、観察対象のカーゴを取り囲む媒質の温度である。
パワースペクトル算出処理は、第二確率分布を周波数νによってフーリエ変換し、パワースペクトルを算出する処理である。
パワー係数算出処理は、フィッティングパラメータとしてAp及びBpを含むローレンチアン型の関数g(ν)によってパワースペクトルをフィッティングし、フィッティングパラメータBpを算出処理である。関数g(ν)の具体的な関数形は式(5)で表される関数形である。以下、フィッティングパラメータBpをパワー係数という。フィッティングは、どのようなフィッティング方法で行われてもよく、例えば、最小二乗法によって行われてもよい。

粘性係数算出処理は、分布係数Kとパワー係数Bpとを用いて、以下の式(6)によって表される粘性係数Γを算出する処理である。

ゆらぎ係数算出部23は、粘性係数Γとゆらぎ値χとに基づいて、ゆらぎ係数Aを算出する。粘性係数算出部は、速さ算出処理及びゆらぎ係数算出処理を順次実行することで、ゆらぎ係数Aを算出する。
速さ算出処理は、静止データを含むタイムコースデータの定速移動データを用いて、定速移動期間におけるカーゴの時間平均の速さVを算出する処理である。具体的には、速さ算出処理は、横軸を時刻とし縦軸をカーゴの位置とするグラフにおける定速移動データの回帰直線の傾きを算出する処理である。
ゆらぎ係数算出処理は、速さV、粘性係数Γ及びゆらぎ値χによって、ゆらぎ係数Aを算出する処理である。ゆらぎ係数算出処理において、ゆらぎ係数算出部23はまず、式(3)によって算出される力Fcとゆらぎ値算出部12によって算出されたゆらぎ値χとの二つの値を有するデータ(以下「力ゆらぎ値対応データ」という。)を、静止データと定速移動データとを含む複数のタイムコースデータについて取得する。次に、ゆらぎ係数算出処理においてゆらぎ係数算出部23は、取得した複数の力ゆらぎ値対応データを、フィッティングパラメータA1を含む以下の式(7)に示す一次関数によってフィッティングする。

A1はフィッティングパラメータであり、フィッティングによって得られたA1の値はゆらぎ係数Aである。フィッティングによって得られたA1の値がゆらぎ係数Aであることは式(1)及び式(6)によって明らかである。
図13は、実施形態の力測定装置1がモータータンパク質にかかる力を算出する具体的な処理の流れを示すフローチャートである。
撮像装置9は、観察対象のカーゴの観察データを生成する(ステップS101)。第一軌跡データ取得部11は、撮像装置9が取得した観察データに基づいて生成された定速移動データを含むタイムコースデータを取得する(ステップS102)。繰り返し制御部13は、定速移動データを含むタイムコースデータのうちのひとつに対して(以下「算出対象データ」という。)、所定の複数の単位時間Δtにおける単位時間繰り返し制御を実行することで、複数の単位時間Δtにおけるゆらぎ値χを算出する(ステップS103)。
繰り返し制御部13は、第一軌跡データ取得部11が取得した定速移動データを含むタイムコースデータのうち、第一確率分布算出処理が行われていないタイムコースデータがあるか否かを判定する(ステップS104)。第一確率分布算出処理が行われていないタイムコースデータがない場合(ステップS104:No)、クラスタリング部14は、ゆらぎ値χに対してクラスタリングを実行し、測定に関するばらつきを減らしたゆらぎ値χを算出する(ステップS105)。
クラスタリング部14が測定に関するばらつきを減らしたゆらぎ値χを算出した後、第二軌跡データ取得部21は、静止データ及び定速移動データを含むタイムコースデータを取得する(ステップS106)。第二軌跡データ取得部21が静止データ及び定速移動データを含むタイムコースデータを取得した後、粘性係数算出部22は、第二確率分布算出処理を実行することで、第二軌跡データ取得部21が取得した静止データに基づいて第二確率分布を算出する(ステップS107)。粘性係数算出部22は、第二確率分布を算出した後、第二確率分布に対して分布係数算出処理を実行し、式(4)で表されるボルツマン関数PB(X)における分布係数Kの値を算出する(ステップS108)。分布係数Kを算出した、粘性係数算出部22は、第二確率分布に対してパワースペクトル算出処理を実行し、パワースペクトルを算出する(ステップS109)。パワースペクトルを算出した粘性係数算出部22は、粘性係数算出処理を実行し粘性係数Γを算出する(ステップS110)。
粘性係数算出部22が粘性係数Γを算出した後、ゆらぎ係数算出部23は、ゆらぎ係数算出処理を実行し、ゆらぎ係数Aを算出する(ステップS111)。ゆらぎ係数Aが算出された後、力算出部16は、ステップS105において算出されたχとステップS111において算出されたゆらぎ係数Aとに基づいて、カーゴにかかる力Fcを算出する(ステップS112)。
一方、ステップS104において、第一確率分布算出処理が行われていないタイムコースデータがある場合(ステップS104:Yes)、繰り返し制御部13は、そのタイムコースデータを新たな算出対象データとする(ステップS113)。繰り返し制御部13は、新たな算出対象データに対して、単位時間繰り返し制御を実行する(ステップS103)。
なお、ステップS106~110は必ずしも、ステップ107の後に実行される必要はなく、ステップS103~105と並列して実行されてもよいし、ステップS103~105よりも先に実行されてもよい。
図14は、実施形態の単位時間繰り返し制御(ステップS103)の具体的な処理の流れを示すフローチャートである。ゆらぎ値算出部12は、第一軌跡データ取得部11が取得したタイムコースデータを取得し、第一確率分布算出処理を実行する(ステップS201)。ゆらぎ値算出部12は、第一確率分布算出処理を実行することで、第一確率分布を算出する。第一確率分布を算出したゆらぎ値算出部12は、ゆらぎ値算出処理を実行することによって、ゆらぎ値χを算出する(ステップS202)。
このように構成された実施形態の力測定装置1によれば、カーゴの動きを示す二次元画像のデータ群に基づいて観察対象のカーゴにかかる力Fcに比例する値χを算出するゆらぎ値算出部12を備えるため、ユーザは生きている細胞内のカーゴにかかる力を非侵襲的な方法で測定することができる。
(神経細胞の培養方法(例))
3週齢ICRマウス(オス)から上頚神経節を採取し、0.5%トリプシンと0.5%コラゲナーゼなどの酵素で処理した。個々に分かれた神経細胞を10%非働化牛血清入りDMEM/F12培地でリンスした後、マトリゲルコートされたガラスボトムディッシュに撒いた。この神経細胞を37℃、CO2 5%のインキュベータ内で10%非働化牛血清と200ng/ml 2.5S神経成長因子入りDMEM/F12培地にて2~4日培養し、力測定装置1を用いた実験に用いた。
3週齢ICRマウス(オス)から上頚神経節を採取し、0.5%トリプシンと0.5%コラゲナーゼなどの酵素で処理した。個々に分かれた神経細胞を10%非働化牛血清入りDMEM/F12培地でリンスした後、マトリゲルコートされたガラスボトムディッシュに撒いた。この神経細胞を37℃、CO2 5%のインキュベータ内で10%非働化牛血清と200ng/ml 2.5S神経成長因子入りDMEM/F12培地にて2~4日培養し、力測定装置1を用いた実験に用いた。
(細胞小器官(例:エンドソーム)の染色方法)
培養中の神経細胞の培地に最終濃度100nMとなるように蛍光色素DiIを添加し、10分間染色した後、蛍光観察に用いた。
培養中の神経細胞の培地に最終濃度100nMとなるように蛍光色素DiIを添加し、10分間染色した後、蛍光観察に用いた。
(蛍光観察の方法(例))
染色後のディッシュをヒーティングプレート(CU-201, Live Cell Instrument)上に設置し、37℃で保温しながら、メラニン細胞内の染色されたメラニン色素小胞を暗視野顕微鏡(IX71, Olympus)で観察した。100倍の対物レンズ(UPlanFL 100x/1.3, Plympus)で98 frames per secondでEMCCDカメラ(LucaS (Andor))を用いて動画を撮影した。動画からImageJ(Rasband, 1997)を用いて、メラニン色素小胞の重心位置のタイムコースデータを計算した。
染色後のディッシュをヒーティングプレート(CU-201, Live Cell Instrument)上に設置し、37℃で保温しながら、メラニン細胞内の染色されたメラニン色素小胞を暗視野顕微鏡(IX71, Olympus)で観察した。100倍の対物レンズ(UPlanFL 100x/1.3, Plympus)で98 frames per secondでEMCCDカメラ(LucaS (Andor))を用いて動画を撮影した。動画からImageJ(Rasband, 1997)を用いて、メラニン色素小胞の重心位置のタイムコースデータを計算した。
図15A、図15B及び図15Cは、モータータンパク質の機能を阻害する試薬であるCiliobrevinのメラニン細胞への添加によってゆらぎ値χの度数分布が変化することが、実施形態の力測定装置1を用いたχの測定によって明らかになったことを示す具体的な結果を示す図である。
図15AはCiliobrevinが細胞に添加されていない場合に力測定装置1によって測定されたゆらぎ値χの度数分布を示す図である。図15Aにおいて、χは、データの分布が4つのクラスタ(クラスタ114~117)に分類される。
図15Bは細胞培養培地中のCiliobrevin濃度が20μMである場合に力測定装置1によって測定されたゆらぎ値χの度数分布を示す図である。図15Bにおいて、χは、データの分布が2つのクラスタ(クラスタ118及び119)に分類される。
図15Cは細胞培養培地中のCiliobrevin濃度が40μMである場合に力測定装置1によって測定されたゆらぎ値χの度数分布を示す図である。図15Cにおいて、χは、データの分布が一つのクラスタ120に分類される。
図15Bは細胞培養培地中のCiliobrevin濃度が20μMである場合に力測定装置1によって測定されたゆらぎ値χの度数分布を示す図である。図15Bにおいて、χは、データの分布が2つのクラスタ(クラスタ118及び119)に分類される。
図15Cは細胞培養培地中のCiliobrevin濃度が40μMである場合に力測定装置1によって測定されたゆらぎ値χの度数分布を示す図である。図15Cにおいて、χは、データの分布が一つのクラスタ120に分類される。
図15Aと、図15Bと、図15Cとの比較によって、Ciliobrevinの添加量が増加するとクラスタの数が減少することが示される。
図16A及び図16Bは、エンドソームが細胞中心と細胞膜との間をキネシン又はダイニンによって輸送されることを説明する説明図である。
図16Aは、エンドソーム201が自身に結合するキネシン202によって、細胞中心から細胞膜まで微小管にそって輸送されることを示す。
図16Bは、エンドソーム201が自身に結合するダイニン203によって、細胞膜から細胞中心まで微小管にそって輸送されることを示す。
図16Aは、エンドソーム201が自身に結合するキネシン202によって、細胞中心から細胞膜まで微小管にそって輸送されることを示す。
図16Bは、エンドソーム201が自身に結合するダイニン203によって、細胞膜から細胞中心まで微小管にそって輸送されることを示す。
図17A及び図17Bは、エンドソームがキネシンによって輸送される場合とダイニンによって輸送される場合とのゆらぎ値χの度数分布の違いが実施形態の力測定装置1を用いた測定で明らかになったことを示す図である。
図17Aは、図16Aに示すキネシン202によってエンドソーム201が輸送された場合のχの分布を示す図である。図17Aにおいて、ゆらぎ値χは、データの分布が4つのクラスタ(クラスタ121~124)に分類される。クラスタ化はクラスタリング解析の結果である。
図17Bは、図16Bに示すダイニン203によってエンドソーム201が輸送された場合のχの分布を示す図である。図17Bにおいて、ゆらぎ値χは、データの分布が3つのクラスタ(クラスタ125~127)に分類される。
図17Aと図17Bとの比較によって、エンドソーム201の輸送は、細胞中心から細胞膜に向かう場合と、細胞膜から細胞中心に向かう場合とでゆらぎ値χの度数分布が異なることが示される。
図17Bは、図16Bに示すダイニン203によってエンドソーム201が輸送された場合のχの分布を示す図である。図17Bにおいて、ゆらぎ値χは、データの分布が3つのクラスタ(クラスタ125~127)に分類される。
図17Aと図17Bとの比較によって、エンドソーム201の輸送は、細胞中心から細胞膜に向かう場合と、細胞膜から細胞中心に向かう場合とでゆらぎ値χの度数分布が異なることが示される。
(変形例)
力測定装置1及びゆらぎ係数算出装置2の機能部は必ずしも異なる筐体によって実装されなくてもよく、ひとつの筐体に実装されてもよい。
力測定装置1及びゆらぎ係数算出装置2の機能部は必ずしも異なる筐体によって実装されなくてもよく、ひとつの筐体に実装されてもよい。
なお、第二軌跡データ取得部21は、必ずしも、観察データに基づいて、定速移動データ及び静止データを含むタイムコースデータを取得する必要はなく、第一軌跡データ取得部11が取得したタイムコースデータを取得し、取得したタイムコースデータのうち定速移動データ及び静止データを含むタイムコースデータを取得してもよい。
なお、第一軌跡データ取得部11が取得する定速移動データを含むタイムコースデータは、観察データに基づいてユーザによって生成されてもよいし、装置によって生成されてもよい。また、第二軌跡データ取得部21が取得する定速移動データ及び静止データを含むタイムコースデータは、観察データに基づいてユーザによって生成されてもよいし、装置によって生成されてもよい。ゆらぎ値算出部12がゆらぎ値の算出に使用する定速移動データは、ユーザによって手動で選定されてもよいし、装置によって選定されてもよい。
ゆらぎ係数算出装置2によって使用される定速移動データ及び静止データもまた、ユーザによって手動で選定されてもよいし、装置によって選定されてもよい。また、観察対象のカーゴの選定もユーザによって手動で選定されてもよいし、装置によって選定されてもよい。
ゆらぎ係数算出装置2によって使用される定速移動データ及び静止データもまた、ユーザによって手動で選定されてもよいし、装置によって選定されてもよい。また、観察対象のカーゴの選定もユーザによって手動で選定されてもよいし、装置によって選定されてもよい。
なお、画像のデータ群と、観察データとは必ずしも二次元のデータでなくてもよく、三次元又は一次元のデータであってもよい。
上述した実施形態における力測定装置1及びゆらぎ係数算出装置2をコンピュータで実現するようにしてもよい。その場合、この機能を実現するためのプログラムをコンピュータ読み取り可能な記録媒体に記録して、この記録媒体に記録されたプログラムをコンピュータシステムに読み込ませ、実行することによって実現してもよい。なお、ここでいう「コンピュータシステム」とは、OSや周辺機器等のハードウェアを含むものとする。また、「コンピュータ読み取り可能な記録媒体」とは、フレキシブルディスク、光磁気ディスク、ROM、CD-ROM等の可搬媒体、コンピュータシステムに内蔵されるハードディスク等の記憶装置のことをいう。さらに「コンピュータ読み取り可能な記録媒体」とは、インターネット等のネットワークや電話回線等の通信回線を介してプログラムを送信する場合の通信線のように、短時間の間、動的にプログラムを保持するもの、その場合のサーバやクライアントとなるコンピュータシステム内部の揮発性メモリのように、一定時間プログラムを保持しているものも含んでもよい。また上記プログラムは、前述した機能の一部を実現するためのものであってもよく、さらに前述した機能をコンピュータシステムにすでに記録されているプログラムとの組み合わせで実現できるものであってもよく、FPGA(Field Programmable Gate Array)等のプログラマブルロジックデバイスを用いて実現されるものであってもよい。
上述した各実施形態では、本発明を力測定装置として表現したが、本発明は、力測定方法として表現することもできる。この場合、実施形態における力測定装置に対応した本発明による力測定方法は、非侵襲的な手段によって取得したカーゴの移動の軌跡を示すタイムコースデータに含まれるデータのうち、カーゴの単位時間の変位が略一定である期間におけるカーゴの位置の時間変化を示す第一のデータを取得する第一取得ステップと、前記第一のデータに基づく確率分布であって、単位時間における前記カーゴの所定の位置の変化量が所定の量である確率の分布を示す第一の確率分布に基づいて、前記カーゴを輸送するモータータンパク質が前記カーゴにくわえる力に比例するゆらぎ値を算出するゆらぎ値算出ステップと、算出した前記ゆらぎ値に基づいて、前記力を算出する力算出ステップと、を有する力測定方法として表現することができる。
上記の実施形態における力測定装置に対応した力測定方法において、第一取得ステップは、実施形態における第一軌跡データ取得部11の動作または処理に相当し、ゆらぎ値算出ステップは、実施形態におけるゆらぎ値算出部12及び繰り返し制御部13の動作または処理に相当する。また、力算出ステップは、実施形態における力算出部16の動作または処理に相当する。
なお、実施形態における第二軌跡データ取得部21の動作または処理は、第二取得ステップの一例であり、実施形態におけるゆらぎ係数算出部23の動作または処理はゆらぎ係数算出ステップの一例である。
なお、第一軌跡データ取得部11は、第一取得部の一例である。なお、第二軌跡データ取得部21は、第二取得部の一例である。なお、定速移動データは第一のデータの一例である。なお、静止データは第二のデータの一例である。
なお、第一軌跡データ取得部11は、第一取得部の一例である。なお、第二軌跡データ取得部21は、第二取得部の一例である。なお、定速移動データは第一のデータの一例である。なお、静止データは第二のデータの一例である。
以上、この発明の実施形態について図面を参照して詳述してきたが、具体的な構成はこの実施形態に限られるものではなく、この発明の要旨を逸脱しない範囲の設計等も含まれる。
1…力測定装置、 2…ゆらぎ係数算出装置、 11…第一軌跡データ取得部、 12…ゆらぎ値算出部、 13…繰り返し制御部、 14…クラスタリング部、 15…ゆらぎ係数記憶部、 16…力算出部、 21…第二軌跡データ取得部、 22…粘性係数算出部、 23…ゆらぎ係数算出部、 100…力測定システム
Claims (11)
- 非侵襲的な手段によって取得したカーゴの移動の軌跡を示すタイムコースデータに含まれるデータのうち、カーゴの単位時間の変位が略一定である期間におけるカーゴの位置の時間変化を示す第一のデータを取得する第一取得ステップと、
前記第一のデータに基づく確率分布であって、単位時間における前記カーゴの所定の位置の変化量が所定の量である確率の分布を示す第一の確率分布に基づいて、前記カーゴを輸送するモータータンパク質が前記カーゴにくわえる力に比例するゆらぎ値を算出するゆらぎ値算出ステップと、
算出した前記ゆらぎ値に基づいて、前記力を算出する力算出ステップと、
を有する力測定方法。 - 前記力算出ステップは、前記ゆらぎ値に対してクラスタリングを行うことで前記力を算出する、
請求項1に記載の力測定方法。 - 非侵襲的な手段によって取得したカーゴの移動の軌跡を示すタイムコースデータのうち、前記第一のデータと、前記カーゴの位置が時間によらず略同一の位置である期間の前記カーゴの位置の時間変化を示す第二のデータとを含むタイムコースデータを取得する第二取得ステップと、
前記力と前記ゆらぎ値との換算係数であるゆらぎ係数を前記第一及び第二のデータに基づいて算出するゆらぎ係数算出ステップと、
を有する請求項1又は2に記載の力測定方法。 - 前記ゆらぎ係数算出ステップは、前記第二のデータに基づいて、前記カーゴを囲む媒質の粘性係数を算出する、
請求項3に記載の力測定方法。 - 前記ゆらぎ係数算出ステップは、前記第二取得ステップにおいて取得された前記第一のデータに基づいて、前記カーゴが移動する速さを算出する請求項4に記載の力測定方法。
- 前記ゆらぎ係数算出ステップは、前記粘性係数と前記速さとに基づいて前記ゆらぎ係数を算出する、
請求項5に記載の力測定方法。 - 前記ゆらぎ値算出ステップは、前記位置の変化量をΔXとし、前記単位時間におけるΔXの値がΔX1である確率を第一の確率P1(ΔX1)とし、前記ゆらぎ値をχとした場合に、χ=ln[P1(ΔX1)/P1(-ΔX1)]/ΔX1の式によってχを算出する、
請求項1に記載の力測定方法。 - 非侵襲的な手段によって取得したカーゴの移動の軌跡を示すタイムコースデータに含まれるデータのうち、カーゴの単位時間の変位が略一定である期間におけるカーゴの位置の時間変化を示す第一のデータを取得する第一取得部と、
前記第一のデータに基づく確率分布であって、単位時間における前記カーゴの所定の位置の変化量が所定の量である確率の分布を示す第一の確率分布に基づいて、前記カーゴを輸送するモータータンパク質が前記カーゴにくわえる力に比例するゆらぎ値を算出するゆらぎ値算出部と、
算出した前記ゆらぎ値に基づいて、前記力を算出する力算出部と、
を備える力測定装置。 - 非侵襲的な手段によって取得したカーゴの移動の軌跡を示すタイムコースデータに含まれるデータのうち、カーゴの単位時間の変位が略一定である期間におけるカーゴの位置の時間変化を示す第一のデータを取得する第一取得部と、
前記第一のデータに基づく確率分布であって、単位時間における前記カーゴの所定の位置の変化量が所定の量である確率の分布を示す第一の確率分布に基づいて、前記カーゴを輸送するモータータンパク質が前記カーゴにくわえる力に比例するゆらぎ値を算出するゆらぎ値算出部と、
算出した前記ゆらぎ値に基づいて、前記力を算出する力算出部と、
を備える力測定システム。 - コンピュータに、非侵襲的な手段によって取得したカーゴの移動の軌跡を示すタイムコースデータに含まれるデータのうち、カーゴの単位時間の変位が略一定である期間におけるカーゴの位置の時間変化を示す第一のデータを取得させ、
前記コンピュータに、前記第一のデータに基づく確率分布であって、単位時間における前記カーゴの所定の位置の変化量が所定の量である確率の分布を示す第一の確率分布に基づいて、前記カーゴを輸送するモータータンパク質が前記カーゴにくわえる力に比例するゆらぎ値を算出させ、
前記コンピュータに、算出した前記ゆらぎ値に基づいて、前記力を算出するための力測定プログラム。 - コンピュータに、非侵襲的な手段によって取得したカーゴの移動の軌跡を示すタイムコースデータに含まれるデータのうち、カーゴの単位時間の変位が略一定である期間におけるカーゴの位置の時間変化を示す第一のデータを取得させ、
前記コンピュータに、前記第一のデータに基づく確率分布であって、単位時間における前記カーゴの所定の位置の変化量が所定の量である確率の分布を示す第一の確率分布に基づいて、前記カーゴを輸送するモータータンパク質が前記カーゴにくわえる力に比例するゆらぎ値を算出させ、
前記コンピュータに、算出した前記ゆらぎ値に基づいて、前記力を算出させるためのプログラムを記憶する記録媒体。
Priority Applications (1)
| Application Number | Priority Date | Filing Date | Title |
|---|---|---|---|
| US16/759,040 US11448563B2 (en) | 2017-10-31 | 2018-10-30 | Force measurement method, force measurement device, force measurement system, force measurement program, and recording medium |
Applications Claiming Priority (2)
| Application Number | Priority Date | Filing Date | Title |
|---|---|---|---|
| JP2017210698A JP6889884B2 (ja) | 2017-10-31 | 2017-10-31 | 力測定方法、力測定装置、力測定システム、力測定プログラム及び記録媒体 |
| JP2017-210698 | 2017-10-31 |
Publications (1)
| Publication Number | Publication Date |
|---|---|
| WO2019088089A1 true WO2019088089A1 (ja) | 2019-05-09 |
Family
ID=66333111
Family Applications (1)
| Application Number | Title | Priority Date | Filing Date |
|---|---|---|---|
| PCT/JP2018/040300 Ceased WO2019088089A1 (ja) | 2017-10-31 | 2018-10-30 | 力測定方法、力測定装置、力測定システム、力測定プログラム及び記録媒体 |
Country Status (3)
| Country | Link |
|---|---|
| US (1) | US11448563B2 (ja) |
| JP (1) | JP6889884B2 (ja) |
| WO (1) | WO2019088089A1 (ja) |
Citations (1)
| Publication number | Priority date | Publication date | Assignee | Title |
|---|---|---|---|---|
| US20140067342A1 (en) * | 2012-08-28 | 2014-03-06 | Numerica Corporation | Particle tracking in biological systems |
Family Cites Families (5)
| Publication number | Priority date | Publication date | Assignee | Title |
|---|---|---|---|---|
| JPH0112187Y2 (ja) | 1981-02-27 | 1989-04-10 | ||
| JP2869422B2 (ja) | 1995-12-28 | 1999-03-10 | シスメックス株式会社 | 流体中の粒子分析装置 |
| RU2132635C1 (ru) | 1996-09-30 | 1999-07-10 | Алексеев Сергей Григорьевич | Способ диагностики онкологических заболеваний и устройство для его осуществления |
| JP5569892B2 (ja) | 2007-09-25 | 2014-08-13 | 公立大学法人横浜市立大学 | 軸索内移動粒子の自動追跡システム |
| JP2019165694A (ja) | 2018-03-23 | 2019-10-03 | 国立大学法人東北大学 | 力測定方法、力測定装置、力測定システム、力測定プログラム及び記録媒体 |
-
2017
- 2017-10-31 JP JP2017210698A patent/JP6889884B2/ja active Active
-
2018
- 2018-10-30 US US16/759,040 patent/US11448563B2/en active Active
- 2018-10-30 WO PCT/JP2018/040300 patent/WO2019088089A1/ja not_active Ceased
Patent Citations (1)
| Publication number | Priority date | Publication date | Assignee | Title |
|---|---|---|---|---|
| US20140067342A1 (en) * | 2012-08-28 | 2014-03-06 | Numerica Corporation | Particle tracking in biological systems |
Also Published As
| Publication number | Publication date |
|---|---|
| US11448563B2 (en) | 2022-09-20 |
| JP2019082432A (ja) | 2019-05-30 |
| US20200333202A1 (en) | 2020-10-22 |
| JP6889884B2 (ja) | 2021-06-18 |
Similar Documents
| Publication | Publication Date | Title |
|---|---|---|
| Ruggeri et al. | Identification of oxidative stress in red blood cells with nanoscale chemical resolution by infrared nanospectroscopy | |
| Petroll et al. | Direct correlation of collagen matrix deformation with focal adhesion dynamics in living corneal fibroblasts | |
| Dulińska-Molak et al. | Age-related changes in the mechanical properties of human fibroblasts and its prospective reversal after anti-wrinkle tripeptide treatment | |
| Stein et al. | Toward absolute molecular numbers in DNA-PAINT | |
| Ferrara et al. | Label-free imaging and biochemical characterization of bovine sperm cells | |
| Wu et al. | Particle tracking microrheology of cancer cells in living subjects | |
| Petersen et al. | Microenvironmental modulation of calcium wave propagation velocity in engineered cardiac tissues | |
| Kumamoto et al. | High-throughput cell imaging and classification by narrowband and low-spectral-resolution Raman microscopy | |
| Coppola et al. | Quantifying cellular forces and biomechanical properties by correlative micropillar traction force and Brillouin microscopy | |
| Guerrero-Cazares et al. | Brief report: Robo1 regulates the migration of human subventricular zone neural progenitor cells during development | |
| Magalhães et al. | The long-term culture of human fibroblasts reveals a spectroscopic signature of senescence | |
| Baričević et al. | Label-free long-term methods for live cell imaging of neurons: new opportunities | |
| Pena et al. | Invertebrate retinal progenitors as regenerative models in a microfluidic system | |
| Parodi et al. | Characterization of mesenchymal stem cell differentiation within miniaturized 3D scaffolds through advanced microscopy techniques | |
| Chen et al. | The applications of lattice light-sheet microscopy for functional volumetric imaging of hippocampal neurons in a three-dimensional culture system | |
| Durso et al. | Lysosome dynamic properties during neuronal stem cell differentiation studied by spatiotemporal fluctuation spectroscopy and organelle tracking | |
| Masedunskas et al. | Intravital microscopy reveals differences in the kinetics of endocytic pathways between cell cultures and live animals | |
| Cao et al. | Stiff extracellular matrix promotes invasive behaviors of trophoblast cells | |
| Peña et al. | VEGF upregulates EGFR expression to stimulate chemotactic behaviors in the rMC-1 model of Müller glia | |
| Hsiao et al. | Molecularly specific and functional live cell imaging by label-free interference microscopy | |
| JP2019165694A (ja) | 力測定方法、力測定装置、力測定システム、力測定プログラム及び記録媒体 | |
| Turnbull et al. | Single-cell analysis of Contractile forces in iPSC-derived cardiomyocytes: paving the way for precision medicine in cardiovascular disease | |
| Augustyniak et al. | Molecular tracking of interactions between progenitor and endothelial cells via Raman and FTIR spectroscopy imaging: A proof of concept of a new analytical strategy for in vitro research | |
| Hargreaves et al. | Live-cell SOFI correlation with SMLM and AFM imaging | |
| US11448563B2 (en) | Force measurement method, force measurement device, force measurement system, force measurement program, and recording medium |
Legal Events
| Date | Code | Title | Description |
|---|---|---|---|
| 121 | Ep: the epo has been informed by wipo that ep was designated in this application |
Ref document number: 18872322 Country of ref document: EP Kind code of ref document: A1 |
|
| NENP | Non-entry into the national phase |
Ref country code: DE |
|
| 122 | Ep: pct application non-entry in european phase |
Ref document number: 18872322 Country of ref document: EP Kind code of ref document: A1 |