WO2019033852A1 - 用于生成热力图的方法、装置以及系统 - Google Patents
用于生成热力图的方法、装置以及系统 Download PDFInfo
- Publication number
- WO2019033852A1 WO2019033852A1 PCT/CN2018/092678 CN2018092678W WO2019033852A1 WO 2019033852 A1 WO2019033852 A1 WO 2019033852A1 CN 2018092678 W CN2018092678 W CN 2018092678W WO 2019033852 A1 WO2019033852 A1 WO 2019033852A1
- Authority
- WO
- WIPO (PCT)
- Prior art keywords
- height
- height threshold
- user
- data
- generating
- Prior art date
- Legal status (The legal status is an assumption and is not a legal conclusion. Google has not performed a legal analysis and makes no representation as to the accuracy of the status listed.)
- Ceased
Links
Images




Classifications
-
- G—PHYSICS
- G06—COMPUTING OR CALCULATING; COUNTING
- G06F—ELECTRIC DIGITAL DATA PROCESSING
- G06F16/00—Information retrieval; Database structures therefor; File system structures therefor
- G06F16/90—Details of database functions independent of the retrieved data types
- G06F16/95—Retrieval from the web
- G06F16/957—Browsing optimisation, e.g. caching or content distillation
-
- G—PHYSICS
- G06—COMPUTING OR CALCULATING; COUNTING
- G06F—ELECTRIC DIGITAL DATA PROCESSING
- G06F16/00—Information retrieval; Database structures therefor; File system structures therefor
- G06F16/90—Details of database functions independent of the retrieved data types
- G06F16/95—Retrieval from the web
- G06F16/957—Browsing optimisation, e.g. caching or content distillation
- G06F16/9577—Optimising the visualization of content, e.g. distillation of HTML documents
-
- G—PHYSICS
- G06—COMPUTING OR CALCULATING; COUNTING
- G06F—ELECTRIC DIGITAL DATA PROCESSING
- G06F16/00—Information retrieval; Database structures therefor; File system structures therefor
Definitions
- the present invention relates to the field of computer information processing, and in particular to a method, apparatus and system for generating a heat map.
- the decorators of various websites are strongly expected to master more user-screened browsing behavior information, such as page arrival visits, average user access depth, etc.; based on user behavior information.
- the analysis, the decorator can optimize the page layout more rationally, save the decoration cost, improve the user's attention, and achieve the expected effect; to meet this demand, it is necessary to collect the user browsing behavior information in real time, and summarize the information. Refining, and then showing to the decorator of the website backstage, for decoration reference.
- scheme 1 statistics clicks on each target pixel of the target webpage to obtain a click heat map of the target webpage, and generate a click heat map based on the single or multi-page link area, and the scheme 1 passes the target
- the webpage is buried, the whole page click event is monitored, and the number of clicks in each pixel area of the summary page is counted, thereby forming a click heat map.
- the second scheme is to perform click event monitoring on a specific single or multiple areas of the webpage, and finally collect and summarize the click heat map of the designated area.
- the click heat maps are statistically summarized for the click volume dimension, but the split screen browsing behavior data is not counted.
- the granularity of the acquired data is too coarse, and it is difficult to judge the overall behavior or general behavior of the user; the drawing of the heat map has little effect on the webpage layout and decoration optimization of the website operators.
- the indicators of technical statistics tend to be based on the whole page; the field of web page split-screen browsing data has not yet been involved.
- thermogram Therefore, there is a need for a new method, apparatus, and system for generating a thermogram.
- the present invention provides a method, apparatus, and system for generating a heat map capable of performing web page split screen browsing data statistics.
- a method for generating a heat map comprising: monitoring an operation of a user on a browser page to generate operation data, the operation including a mouse sliding event; and determining when a mouse sliding event is detected Whether the current webpage height is greater than a height threshold; when the current webpage height is greater than the height threshold, the height threshold is updated with the current webpage height; and the heat map is generated by the height threshold and the operational data.
- an apparatus for generating a heat map comprising: a listening module for monitoring an operation of a user on a browser page to generate operation data, the operation comprising a mouse sliding event; When the mouse sliding event is monitored, it is determined whether the current webpage height is greater than a height threshold; the update module is configured to update the height threshold with the current webpage height when the current webpage height is greater than the height threshold; and the drawing module is configured to pass the height threshold and The operational data generates a thermogram.
- a system for generating a heat map comprising: a monitoring system for monitoring an operation of a user on a browser page to generate operation data, the operation including a mouse sliding event; When the event is swiped, it is determined whether the current webpage height is greater than a height threshold; when the current webpage height is greater than the height threshold, the current webpage height is used to update the height threshold; and the distributed real-time computing system is configured to generate a thermogram by using the height threshold and the operational data.
- an electronic device comprising: one or more processors; a storage device for storing one or more programs; and one or more programs being one or more processors Executing, such that one or more processors implement the method as described above.
- a computer readable medium having stored thereon a computer program, characterized in that the program, when executed by a processor, implements a method as hereinbefore described.
- web page split screen browsing data statistics can be performed.
- FIG. 1 is a system architecture of a method for generating a heat map, according to an exemplary embodiment.
- thermogram 2 is a flow chart showing a method for generating a thermogram according to an exemplary embodiment.
- FIG. 3 is a flow chart showing a method for generating a thermogram according to another exemplary embodiment.
- FIG. 4 is a flow chart showing a method for generating a thermogram according to another exemplary embodiment.
- FIG. 5 is a flow chart showing a method for generating a thermogram according to another exemplary embodiment.
- FIG. 6 is a block diagram of an apparatus for generating a heat map, according to an exemplary embodiment.
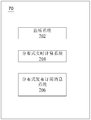
- FIG. 7 is a block diagram of a system for generating a heat map, according to an exemplary embodiment.
- FIG. 8 is a block diagram of a system for generating a thermogram, according to another exemplary embodiment.
- thermogram 9 is a block diagram of a system for generating a thermogram, according to another exemplary embodiment.
- FIG. 10 is a block diagram of an electronic device, according to an exemplary embodiment.
- FIG. 11 is a schematic diagram of a computer readable medium according to an exemplary embodiment.
- FIG. 1 is a system architecture of a method for generating a heat map, according to an exemplary embodiment.
- system architecture 100 can include terminal devices 101, 102, 103, network 104, and server 105.
- the network 104 is used to provide a medium for communication links between the terminal devices 101, 102, 103 and the server 105.
- Network 104 may include various types of connections, such as wired, wireless communication links, fiber optic cables, and the like.
- the user can interact with the server 105 over the network 104 using the terminal devices 101, 102, 103 to receive or transmit messages and the like.
- Various communication client applications such as a shopping application, a web browser application, a search application, an instant communication tool, a mailbox client, a social platform software, and the like, may be installed on the terminal devices 101, 102, and 103.
- the terminal devices 101, 102, 103 may be various electronic devices having a display screen and supporting web browsing, including but not limited to smartphones, tablets, laptop portable computers, desktop computers, and the like.
- the server 105 may be a server that provides various services, such as a background management server (for example only) that provides support for a shopping site browsed by the user using the terminal devices 101, 102, 103.
- the background management server may analyze and process data such as the received product information query request, and feed back the processing result (split screen data) to the terminal device.
- split screen data processing provided by the embodiment of the present application is generally performed by the server 105. Accordingly, the split screen data analyzing apparatus is generally disposed in the server 105.
- terminal devices, networks, and servers in Figure 1 is merely illustrative. Depending on the implementation needs, there can be any number of terminal devices, networks, and servers.
- thermogram 2 is a flow chart showing a method for generating a thermogram according to an exemplary embodiment.
- the operation of the user on the browser page is generated to generate operation data, and the operation includes a mouse sliding event.
- the operation of the user on the browser page may be generated by means of a page burying point, and the operation data includes user information.
- the operation data may include, for example, a user's mouse operation, and may, for example, monitor a mouse swipe event when the user browses the webpage, and then automatically report the user's browsing data by the event trigger.
- the maximum height threshold may be recorded by a global variable, for example, when the user accesses the webpage, the global variable maxHeight is set and assigned to the currently reached webpage height, and may also be assigned, for example, an arbitrary value smaller than the current webpage height.
- the invention is not limited thereto. In the recording system, for example, by turning on the mouse sliding event monitor to achieve the purpose of the arrow mouse sliding event.
- the height of the webpage that the user currently browses is obtained (for example, it can be set to H), and it is determined whether the height of the webpage that the user currently browses is greater than the global variable maxHeight (ie, judge: H>maxHeight).
- the height threshold is updated with the current webpage height.
- the update maxHeight value is the current page height value. It is also possible, for example, to initiate a url request at this time (the request may include, for example, user id and maxHeight information) to update the updated data as a whole.
- a heat map is generated by the height threshold and the operation data.
- the processing data and the height threshold may be processed, for example, by a distributed real-time computing system (Storm), the processing result is generated; the minimum statistical pixel area is determined; the processing result is saved by the minimum statistical pixel area and the Hbase table; and the thermal map is generated by the processing result.
- Storm is a distributed, fault-tolerant real-time computing system. Following the Eclipse Public License 1.0, Storm can easily write and extend complex real-time computing in a cluster of computers. Storm is processed in real time, just like Hadoop for batch processing. Storm guarantees that every message will be processed, and it's fast -- in a small cluster, it can process millions of messages per second.
- HBase is a distributed, column-oriented open source database. For example, setting a minimum statistical area, recording the maximum height of the browsed webpage in real time according to the user's mouse operation data, and updating the recorded maximum height data in real time with the maximum height data, for example, by browsing the data of the user and minimizing each The data of the statistical area generates a heat map.
- the webpage splitting heat map can be generated by using the height threshold and the operation data, and the number of screens of the webpage can be determined, for example, by the original webpage screen height data and the maximum length of the webpage; and the number of split screens of the webpage is combined with the above heat map. Processing, generating a heat map by processing the result and the number of split screens.
- the method for generating a heat map by monitoring the user's mouse operation data, the maximum height value of the browsed webpage is obtained, the maximum height value and the operation data are acquired, and the heat map is generated, and the webpage screen browsing data can be performed. statistics.
- FIG. 3 is a flow chart showing a method for generating a thermogram according to another exemplary embodiment.
- FIG. 3 is an exemplary description of S204 and S206, and the present invention is not limited thereto.
- the initial value of the global variable maxHeight is defined as the current screen height.
- the front-end machine lua performs /datalogPc interception processing and reports. Perform url interception and parameter verification at the Nginx of the website, and finally send valid user information to Kafka.
- Kafka performs distributed log real-time acquisition.
- the operational data and altitude thresholds are collected in real time through a distributed publish subscription messaging system.
- the Kafka system is responsible for distributed real-time collection of user information, all of which are stored in the Kafka system in multiple zones in the same topic.
- S304-S312 is repeated to implement the loop listener statistics to report the maximum web page height value reached by the user browsing.
- the user can directly obtain the current visit arrival webpage height value.
- FIG. 4 is a flow chart showing a method for generating a thermogram according to another exemplary embodiment.
- FIG. 4 is an exemplary description of processing operation data in S208, and the present invention is not limited thereto.
- the operation data and the height threshold are processed by the distributed real-time computing system to generate a processing result; the minimum statistical pixel area is determined; the processing result is saved by the minimum statistical pixel area and the Hbase table; and the heat map is generated by the processing result.
- the Map is initialized, for example, the timer time is set to 3 minutes.
- the Map object is used to temporarily store user data arriving within 3 minutes; the timer uses the timing function provided by the Storm framework to update the user data of the Hbase table every three minutes.
- a piece of user data is obtained, which may be, for example, a webpage address, a user id, a maxHeight, or the like.
- the user access maximum height table is updated, which may be, for example, an hbase table.
- the maximum height value of the user access page stored in the Map is updated to the Hbase table; at the same time, the Map object is cleared.
- the real-time query and update Hbase table it can be realized by, for example, two tables.
- the table structure design of each table is as follows:
- Hbase table rowKey Column value Table 1 URL + date + user id The maximum height value reached by the user visiting the web page Table 2 URL + date + minimum statistical pixel area Number of users arriving in this pixel area
- Table 1 serves as an intermediate table for storing the number of users arriving on the web page each day, and the maximum height value of each user web page access arrival. For a large amount of daily visits, for example, the durability of each record is set to 2 days.
- Table 2 is the final table, because the number of users arriving in each area of the vertical page is stored; in order to improve performance and reduce the number of records, the page is vertically divided into discrete areas of 20px steps (for example: 20px, 40px, 60px); The data in Table 1 calculates the number of users arriving in each discrete area.
- the user can directly obtain the current visit arrival webpage height value.
- FIG. 5 is a flow chart showing a method for generating a thermogram according to another exemplary embodiment.
- FIG. 5 is an exemplary depiction of generating a heat map in S208, and the present invention is not limited thereto.
- the foreground initiates a request.
- the background webpage operation decoration personnel initiates a view of the split screen arrival data request. For example, you can pass in: URL, maximum height of the page, specify each screen height, query date
- the Hbase table 2 is scanned to query the number of users arriving in each area of the webpage within the statistical date.
- the total screen number of the webpage is calculated according to the screen height in the transmission parameter and the total height of the webpage.
- each screen reaches the number of users plus the number of arriving users of the current data, as set as above: 20.
- the arrival rate of each screen user the number of users per screen / the number of users of the entire page.
- the foreground renders and displays the user's split screen arrival data. Return to the screen to reach the number of users before the rendering to the designated person.
- the webpage is divided into different pixel regions (for example, region 1: 0-20px, region 2: 20-20px) in a specified pixel step size (for example, 20px), and finally the screens arrive at the user.
- pixel regions for example, region 1: 0-20px, region 2: 20-20px
- a specified pixel step size for example, 20px
- the method of superimposing the number of users in each area of the screen is adopted. It is also possible to directly superimpose the number of user arrivals of each pixel value in each screen without specifying the pixel step size, and also obtain the number of users arriving at each screen.
- the invention is not limited thereto.
- dynamic split screen data statistics can be realized by collecting and processing user data in real time.
- FIG. 6 is a block diagram of an apparatus for generating a heat map, according to an exemplary embodiment.
- the listening module 602 is configured to listen to the operation of the user on the browser page to generate operation data, and the operation includes a mouse sliding event.
- the determining module 604 is configured to determine whether the current webpage height is greater than a height threshold when the mouse sliding event is monitored.
- the update module 606 is configured to update the height threshold with the current webpage height when the current webpage height is greater than the height threshold.
- the mapping module 608 is configured to generate a thermogram from the height threshold and the operational data.
- the device for generating a heat map by monitoring the user's mouse operation data, the maximum height value of the browsed webpage is obtained, the maximum height value and the operation data are acquired, and the heat map is generated, and the webpage split screen browsing data can be performed. statistics.
- FIG. 7 is a block diagram of a system for generating a heat map, according to an exemplary embodiment.
- the monitoring system 702 is configured to monitor the operation of the user on the browser page to generate operation data, and the operation includes a mouse sliding event; when the mouse sliding event is monitored, it is determined whether the current webpage height is greater than a height threshold; when the current webpage height is greater than a height threshold, Update the height threshold with the current page height.
- the distributed real-time computing system 704 is configured to generate a thermogram from the altitude threshold and the operational data.
- the distributed publish and subscribe message system 706 is used to collect operational data and altitude thresholds in real time.
- FIG. 8 is a block diagram of a system for generating a thermogram, according to another exemplary embodiment.
- the Kafka distributed collection log module 802 is used for real-time data collection, for example, by burying the page, monitoring the mouse sliding event when the user browses the webpage, and then automatically reporting the user browsing data by the event trigger, and the data collection work is completed by Kafka. .
- the Storm distributed real-time computing module 804 can, for example, adopt a Storm distributed real-time computing framework.
- the topology of the Storm consists of a spout and a two-layer blot.
- the specific streaming layered processing design is shown in FIG. 9.
- Spout is responsible for accessing Kafka's consumer interface and is responsible for reading user data in real time.
- Url filters the blot layer, which is responsible for parsing the data captured by the spout, and filtering out the required users to browse the data through the screen to the next layer.
- the data calculation and storage blot layer is responsible for calculating the filter layer to pass data, and writing the processing result to the Hbase database table.
- the Spout message source is the message producer, who reads data from an external source and sends a message to the topology: tuple.
- Bolt message handler all message processing logic is encapsulated in bolts, processing the input data stream and generating the output new data stream, performing filtering, aggregation, querying the database and other operations.
- the data summary module 806 can be used, for example, for the background webpage operation decorator to initiate viewing of the split screen arrival data request.
- the number of users arriving at each screen can be collectively calculated based on the number of users that each discrete area is stored in Table 2, for example, by HBase massive data real-time query and storage 808. Return to the split screen to reach the number of users before the rendering is presented to the operation.
- FIG. 10 is a block diagram of an electronic device, according to an exemplary embodiment.
- FIG. 10 An electronic device 200 according to this embodiment of the present invention will be described below with reference to FIG. 10 is merely an example and should not impose any limitation on the function and scope of use of the embodiments of the present invention.
- electronic device 200 is embodied in the form of a general purpose computing device.
- the components of the electronic device 200 may include, but are not limited to, at least one processing unit 210, at least one storage unit 220, a bus 230 connecting different system components (including the storage unit 220 and the processing unit 210), a display unit 240, and the like.
- the storage unit stores program code, and the program code may be executed by the processing unit 210, such that the processing unit 210 performs various exemplary embodiments according to the present invention described in the electronic recipe flow processing method section of the present specification.
- the processing unit 210 can perform the steps as shown in FIG. 2.
- the storage unit 220 may include a readable medium in the form of a volatile storage unit, such as a random access storage unit (RAM) 2201 and/or a cache storage unit 2202, and may further include a read only storage unit (ROM) 2203.
- RAM random access storage unit
- ROM read only storage unit
- the storage unit 220 may also include a program/utility 2204 having a set (at least one) of the program modules 2205, including but not limited to: an operating system, one or more applications, other program modules, and programs. Data, each of these examples or some combination may include an implementation of a network environment.
- Bus 230 may be representative of one or more of several types of bus structures, including a memory unit bus or memory unit controller, a peripheral bus, a graphics acceleration port, a processing unit, or a local area using any of a variety of bus structures. bus.
- the electronic device 200 can also communicate with one or more external devices 300 (eg, a keyboard, pointing device, Bluetooth device, etc.), and can also communicate with one or more devices that enable the user to interact with the electronic device 200, and/or with Any device (eg, router, modem, etc.) that enables the electronic device 200 to communicate with one or more other computing devices. This communication can take place via an input/output (I/O) interface 250.
- electronic device 200 can also communicate with one or more networks (e.g., a local area network (LAN), a wide area network (WAN), and/or a public network, such as the Internet) via network adapter 260.
- Network adapter 260 can communicate with other modules of electronic device 200 via bus 230.
- the technical solution according to an embodiment of the present disclosure may be embodied in the form of a software product, which may be stored in a non-volatile storage medium (which may be a CD-ROM, a USB flash drive, a mobile hard disk, etc.) or on a network.
- the instructions include a number of instructions to cause a computing device (which may be a personal computer, server, or network device, etc.) to perform the electronic recipe flow processing method described above in accordance with an embodiment of the present disclosure.
- FIG. 11 is a schematic diagram of a computer readable medium according to an exemplary embodiment.
- a program product 400 for implementing the above method which may employ a portable compact disk read only memory (CD-ROM) and includes program code, and may be in a terminal device, is illustrated in accordance with an embodiment of the present invention.
- CD-ROM portable compact disk read only memory
- the program product of the present invention is not limited thereto, and in the present document, the readable storage medium may be any tangible medium containing or storing a program that can be used by or in connection with an instruction execution system, apparatus or device.
- the program product can employ any combination of one or more readable media.
- the readable medium can be a readable signal medium or a readable storage medium.
- the readable storage medium can be, for example, but not limited to, an electronic, magnetic, optical, electromagnetic, infrared, or semiconductor system, apparatus, or device, or any combination of the above. More specific examples (non-exhaustive lists) of readable storage media include: electrical connections with one or more wires, portable disks, hard disks, random access memory (RAM), read only memory (ROM), erasable Programmable read-only memory (EPROM or flash memory), optical fiber, portable compact disk read only memory (CD-ROM), optical storage device, magnetic storage device, or any suitable combination of the foregoing.
- the computer readable storage medium can include a data signal that is propagated in a baseband or as part of a carrier, in which readable program code is carried. Such propagated data signals can take a variety of forms including, but not limited to, electromagnetic signals, optical signals, or any suitable combination of the foregoing.
- the readable storage medium can also be any readable medium other than a readable storage medium that can transmit, propagate or transport a program for use by or in connection with an instruction execution system, apparatus or device.
- Program code embodied on a readable storage medium may be transmitted by any suitable medium, including but not limited to wireless, wireline, optical cable, RF, etc., or any suitable combination of the foregoing.
- Program code for performing the operations of the present invention may be written in any combination of one or more programming languages, including an object oriented programming language such as Java, C++, etc., including conventional procedural Programming language—such as the "C" language or a similar programming language.
- the program code can execute entirely on the user computing device, partially on the user device, as a stand-alone software package, partially on the remote computing device on the user computing device, or entirely on the remote computing device or server. Execute on.
- the remote computing device can be connected to the user computing device via any kind of network, including a local area network (LAN) or wide area network (WAN), or can be connected to an external computing device (eg, provided using an Internet service) Businesses are connected via the Internet).
- LAN local area network
- WAN wide area network
- Businesses are connected via the Internet.
- the computer readable medium carries one or more programs, and when the one or more programs are executed by the device, the function is implemented as follows: monitoring the operation of the user on the browser page to generate operation data, the operation including the mouse A sliding event; when the mouse sliding event is monitored, determining whether the current webpage height is greater than a height threshold; when the current webpage height is greater than a height threshold, the current webpage height is used to update the height threshold; and the heat threshold is generated by the height threshold and the operational data.
- modules may be distributed in the device according to the description of the embodiments, or may be correspondingly changed in one or more devices different from the embodiment.
- the modules of the above embodiments may be combined into one module, or may be further split into multiple sub-modules.
- the exemplary embodiments described herein may be implemented by software, or may be implemented by software in combination with necessary hardware. Therefore, the technical solution according to the embodiment of the present invention may be embodied in the form of a software product, which may be stored in a non-volatile storage medium (which may be a CD-ROM, a USB flash drive, a mobile hard disk, etc.) or on a network.
- a non-volatile storage medium which may be a CD-ROM, a USB flash drive, a mobile hard disk, etc.
- a number of instructions are included to cause a computing device (which may be a personal computer, server, mobile terminal, or network device, etc.) to perform a method in accordance with an embodiment of the present invention.
- thermogram According to embodiments of the present invention, have one or more of the following advantages.
- the method for generating a heat map of the present invention can provide a real-time query user behavior data platform; provide a method for real-time consumption storage of tens of millions of user data, and collect and summarize in real time, so that the front-end user can be viewed in real time. Paging browsing behavior data is possible.
- the method for generating a heat map of the present invention can provide powerful data support, and is convenient for guiding a user to optimize web page layout and improve web page conversion rate. Through the split screen to reach the heat map, provide data support for the website operation, and then guide the reasonable typesetting.
- the method for generating a heat map of the present invention when storing a split screen to reach user data, divides a webpage by using a fixed length pixel area, records the number of user arrivals in a subregion, reduces the number of database records, and improves the query and Change performance.
- the method for generating a heat map of the present invention can provide a real-time solution for collecting and analyzing storage for large user behavior data of a large website.
Landscapes
- Engineering & Computer Science (AREA)
- Databases & Information Systems (AREA)
- Theoretical Computer Science (AREA)
- Data Mining & Analysis (AREA)
- Physics & Mathematics (AREA)
- General Engineering & Computer Science (AREA)
- General Physics & Mathematics (AREA)
- Information Transfer Between Computers (AREA)
Abstract
本申请公开一种用于生成热力图的方法、装置以及系统。涉及计算机信息处理领域,该方法包括:监听用户在浏览器页面上的操作生成操作数据,所述操作包括鼠标滑动事件;在监听到所述鼠标滑动事件时,判断当前网页高度是否大于高度阈值;在当前网页高度大于所述高度阈值时,用所述当前网页高度更新所述高度阈值;以及通过所述高度阈值与所述操作数据生成热力图。本申请公开的用于生成热力图的方法、装置以及系统,能够进行网页分屏浏览数据统计。 (图2)
Description
本发明涉及计算机信息处理领域,具体而言,涉及一种用于生成热力图的方法、装置以及系统。
互联网时代,各类网站后台的装修者在装修的过程中,强烈的期望掌握更多的用户分屏浏览行为信息,比如页面的到达访次、用户的平均访问深度等信息;基于对用户行为信息的分析,装修者可以更合理的优化页面排版,节约装修成本,提高用户的关注度,进而达到预期的效果;要满足这一需求则需要实时的采集用户浏览行为信息、并对信息进行汇总和提炼,进而展示给网站后台的装修者,供装修参考。
现有技术中对于网页上用户行为的统计主要是通过热力图的方式进行统计。一般方法是针对网页浏览用户的访问次数、点击量等指标进行统计进而生成热力图。现有网页热力图的实现方案主要有以下两种:方案一:统计目标网页各个像素点击量得到目标网页的点击热力图,生成基于单或多网页链接区域的点击热力图,方案一通过对目标网页进行埋点,监听整页点击事件,统计汇总页面各像素区域的点击次数,进而形成点击热力图。方案二则是通过对网页特定单片或多片区域进行点击事件监听,并最终统计汇总出指定区域的点击热力图。
现有的生成热力图的技术中,点击热力图都是针对点击量维度进行统计汇总,却未对分屏浏览行为数据作统计。获取的数据粒度过于粗糙,难以判断用户的整体行为或一般性行为;绘制的热力图对网站运营人员进行网页排版及装修优化作用甚微。技术统计的指标偏向于以整页为维度;网页分屏浏览数据统计领域却尚未涉足。
因此,需要一种新的用于生成热力图的方法、装置以及系统。
在所述背景技术部分公开的上述信息仅用于加强对本发明的背景的理解,因此它可以包括不构成对本领域普通技术人员已知的现有技术的信息。
发明内容
有鉴于此,本发明提供一种用于生成热力图的方法、装置以及系统,能够进行网页分屏浏览数据统计。
本发明的其他特性和优点将通过下面的详细描述变得显然,或部分地通过本发明的实践而习得。
根据本发明的一方面,提出一种用于生成热力图的方法,该方法包括:监听用户在浏览器页面上的操作生成操作数据,操作包括鼠标滑动事件;在监听到鼠标滑动事件时,判断当前网页高度是否大于高度阈值;在当前网页高度大于高度阈值时,用当前网页高度更新高度阈值;以及通过高度阈值与操作数据生成热力图。
根据本发明的一方面,提出一种用于生成热力图的装置,该装置包括:监听模块,用于监听用户在浏览器页面上的操作生成操作数据,操作包括鼠标滑动事件;判断模块,用于在监听到鼠标滑动事件时,判断当前网页高度是否大于高度阈值;更新模块,用于在当前网页高度大于高度阈值时,用当前网页高度更新高度阈值;以及绘图模块,用于通过高度阈值与操作数据生成热力图。
根据本发明的一方面,提出一种用于生成热力图的系统,该系统包括:监听系统,用于监听用户在浏览器页面上的操作生成操作数据,操作包括鼠标滑动事件;在监听到鼠标滑动事件时,判断当前网页高度是否大于高度阈值;在当前网页高度大于高度阈值时,用当前网页高度更新高度阈值;以及分布式实时计算系统,用于通过高度阈值与操作数据生成热力图。
根据本发明的一方面,提出一种电子设备,该电子设备包括:一个或多个处理器;存储装置,用于存储一个或多个程序;当一个或多个程序被一个或多个处理器执行,使得一个或多个处理器实现如上文的方法。
根据本发明的一方面,提出一种计算机可读介质,其上存储有计算机程序,其特征在于,程序被处理器执行时实现如上文中的方法。
根据本发明的用于生成热力图的方法、装置以及系统,能够进行网页分屏浏览数据统计。
应当理解的是,以上的一般描述和后文的细节描述仅是示例性的,并不能限制本发明。
通过参照附图详细描述其示例实施例,本发明的上述和其它目标、特征及优点将变得更加显而易见。下面描述的附图仅仅是本发明的一些实施例,对于本领域的普通技术人员来讲,在不付出创造性劳动的前提下,还可以根据这些附图获得其他的附图。
图1是根据一示例性实施例示出的一种用于生成热力图的方法的系统架构。
图2是根据一示例性实施例示出的一种用于生成热力图的方法的流程图。
图3是根据另一示例性实施例示出的一种用于生成热力图的方法的流程图。
图4是根据另一示例性实施例示出的一种用于生成热力图的方法的流程图。
图5是根据另一示例性实施例示出的一种用于生成热力图的方法的流程图。
图6是根据一示例性实施例示出的一种用于生成热力图的装置的框图。
图7是根据一示例性实施例示出的一种用于生成热力图的系统的框图。
图8是根据另一示例性实施例示出的一种用于生成热力图的系统的框图。
图9是根据另一示例性实施例示出的一种用于生成热力图的系统的框图。
图10是根据一示例性实施例示出的一种电子设备的框图。
图11是根据一示例性实施例示出的一种计算机可读介质示意图。
现在将参考附图更全面地描述示例实施例。然而,示例实施例能够以多种形式实施,且不应被理解为限于在此阐述的实施例;相反,提供这些实施例使得本发明将全面和完整,并将示例实施例的构思全面地传达给本领域的技术人员。在图中相同的附图标记表示相同或类似的部分,因而将省略对它们的重复描述。
此外,所描述的特征、结构或特性可以以任何合适的方式结合在一个或更多实施例中。在下面的描述中,提供许多具体细节从而给出对本发明的实施例的充分理解。然而,本领域技术人员将意识到,可以实践本发明的技术方案而没有特定细节中的一个或更多,或者可以采用其它的方法、组元、装置、步骤等。在其它情况下,不详细示出或描述公知方法、装置、实现或者操作以避免模糊本发明的各方面。
附图中所示的方框图仅仅是功能实体,不一定必须与物理上独立的实体相对应。即,可以采用软件形式来实现这些功能实体,或在一个或多个硬件模块或集成电路中实现这些功能实体,或在不同网络和/或处理器装置和/或微控制器装置中实现这些功能实体。
附图中所示的流程图仅是示例性说明,不是必须包括所有的内容和操作/步骤,也不是必须按所描述的顺序执行。例如,有的操作/步骤还可以分解,而有的操作/步骤可以合并或部分合并,因此实际执行的顺序有可能根据实际情况改变。
应理解,虽然本文中可能使用术语第一、第二、第三等来描述各种组件,但这些组件不应受这些术语限制。这些术语乃用以区分一组件与另一组件。因此,下文论述的第一组件可称为第二组件而不偏离本公开概念的教示。如本文中所使用,术语“及/或”包括相关联的列出项目中的任一个及一或多者的所有组合。
本领域技术人员可以理解,附图只是示例实施例的示意图,附图中的模块或流程并不一定是实施本发明所必须的,因此不能用于限制本发明的保护范围。
下面结合附图对本公开示例实施方式进行详细说明。
图1是根据一示例性实施例示出的一种用于生成热力图的方法的系统架构。
如图1所示,系统架构100可以包括终端设备101、102、103,网络104和服务器105。网络104用以在终端设备101、102、103和服务器105之间提供通信链路的介质。网络104可以包括各种连接类型,例如有线、无线通信链路或者光纤电缆等等。
用户可以使用终端设备101、102、103通过网络104与服务器105交互,以接收或发送消息等。终端设备101、102、103上可以安装有各种通讯客户端应用,例如购物类应用、网页浏览器应用、搜索类应用、即时通信工具、邮箱客户端、社交平台软件等。
终端设备101、102、103可以是具有显示屏并且支持网页浏览的各种电子设备,包括但不限于智能手机、平板电脑、膝上型便携计算机和台式计算机等等。
服务器105可以是提供各种服务的服务器,例如对用户利用终端设备101、102、103所浏览的购物类网站提供支持的后台管理服务器(仅为示例)。后台管理服务器可以对接收到的产品信息查询请求等数据进行分析等处理,并将处理结果(分屏数据)反馈给终端设备。
需要说明的是,本申请实施例所提供的分屏数据处理一般由服务器105执行,相应地,分屏数据分析装置一般设置于服务器105中。
应该理解,图1中的终端设备、网络和服务器的数目仅仅是示意性的。根据实现需要,可以具有任意数目的终端设备、网络和服务器。
图2是根据一示例性实施例示出的一种用于生成热力图的方法的流程图。
如图2所示,在S202中,监听用户在浏览器页面上的操作生成操作数据,所述操作包括鼠标滑动事件。可例如,通过页面埋点的方式,监听用户在浏览器页面上的操作生成操作数据,操作数据包括用户信息。操作数据可例如包括用户的鼠标操作,可例如监听用户浏览网页时的鼠标滑动事件,再由事件触发自动上报用户浏览数据。
在S204中,在监听到所述鼠标滑动事件时,判断当前网页高度是否大于高度阈值。可例如,通过全局变量来记录最大高度阈值,可例如,在用户访问网页时,设定全局变量maxHeight,并赋值为当前到达的网页高度,还可例如赋值为一小于当前网页高度的任意值,本发明不以此为限。在记录系统中,可例如通过开启鼠标滑动事件监听以达到箭筒鼠标滑动事件的目的。当监听到鼠标滑动事件:获取用户当前浏览到达的网页高度(可例如设为H),判断用户当前浏览到达的网页高度是否大于全局变量maxHeight(即判断:H>maxHeight)。
在S206中,在当前网页高度大于所述高度阈值时,用所述当前网页高度更新所述高度阈值。根据上文中的内容,如果H大于maxHeight,则更新maxHeight值为当前网页高度值。还可例如,在此时发起url请求(请求中可例如包含用户id和maxHeight信息)以便将该更新后的数据进行整体更新。
在S208中,通过所述高度阈值与所述操作数据生成热力图。可例如,通过分布式实时计算系统(Storm)处理操作数据与高度阈值,生成处理结果;确定最小统计像素区域;通过最小统计像素区域与Hbase表格保存处理结果;以及通过处理结果生成热力图。Storm是一个分布式的、容错的实时计算系统,遵循Eclipse Public License 1.0,Storm可以方便地在一个计算机集群中编写与扩展复杂的实时计算,Storm之于实时处理,就好比Hadoop之于批处理。Storm保证每个消息都会得到处理,而且它很快——在一个小集群中,每秒可以处理数以百万计的消息。HBase是一个分布式的、面向列的开源数据库。可例如,设定最小统计区域,根据用户鼠标操作数据,实时记录浏览网页的最大高度,并用最大高度数据实时更新已记录的最大高度数据的,可例如,通过用户浏览的数据和将每个最小统计区域的数据生成热力图。
还可例如,通过高度阈值与操作数据生成网页分屏热力图,可例如通过原始的网页屏幕高度数据,以及网页最大长度,确定网页的分屏数;将网页的分屏数与上述热力图结合处理,通过处理结果与分屏数生成热力图。
根据本发明的用于生成热力图的方法,通过监控用户鼠标操作数据,进而获得浏览网页的最大高度数值,获取最大高度数值以及操作数据,进而生成热力图的方式,能够进行 网页分屏浏览数据统计。
应清楚地理解,本发明描述了如何形成和使用特定示例,但本发明的原理不限于这些示例的任何细节。相反,基于本发明公开的内容的教导,这些原理能够应用于许多其它实施例。
图3是根据另一示例性实施例示出的一种用于生成热力图的方法的流程图。图3是对S204与S206的示例性描述,本发明不以此为限。
如图3所示,在S302中,定义全局变量maxHeight初始值为当前屏高。
在S304中,页面打开监听鼠标滑动事件。
在S306中,监测到鼠标滑动事件。
在S308中,用户当前浏览到达的屏高是否大于maxHeight。如果用户当前浏览到达的屏高大于maxHeight,则进入S310,否则返回S304。
在S310中,更新maxHeight。
在S312中,前端访问//datalogPc提交maxHeight。
在S314中,前置机lua进行/datalogPc拦截处理并上报。在网站的Nginx处进行url拦截、参数校验,最终将有效用户信息发给Kafka。
在S316中,Kafka进行分布式日志实时采集。通过分布式发布订阅消息系统实时采集操作数据与高度阈值。可例如,通过Kafka系统负责分布式实时采集用户信息,所有信息以同一个topic,分多区存储在Kafka系统。
重复S304-S312以实现循环监听统计上报用户浏览到达的最大网页高度值。
根据本发明的用于生成热力图的方法,通过实时采集监控用户鼠标操作数据,从而获得浏览网页的最大高度数值的方式,能够实时获取用户当前访问到达网页高度值。
图4是根据另一示例性实施例示出的一种用于生成热力图的方法的流程图。图4是对S208中处理操作数据的的示例性描述,本发明不以此为限。通过分布式实时计算系统处理操作数据与高度阈值,生成处理结果;确定最小统计像素区域;通过最小统计像素区域与Hbase表格保存处理结果;以及通过处理结果生成热力图。
如图4所示,在S402中,初始化Map,可例如设定定时器时间为3分钟。可例如,Map对象用于暂存3分钟内到达的用户数据;定时器,采用Storm框架自带的定时功能,实现每隔三分钟更新Hbase表的用户数据。
在S404中,获取一条用户数据,可例如为网页地址、用户id、maxHeight等。
在S406中,判断Map中是否有该用户相关信息。
在S408中,如果Map中有该用户相关信息,则更新Map用户访问到达的最大高度,操作完毕后返回S404。每获取一条用户数据,更新Map对象中存储的用户访问页面的最大高度值。
在S410中,如果Map中没有该用户相关信息,则新增Map用户访问到达的最大高度,操作完毕后返回S404。每获取一条用户数据,更新Map对象中存储的用户访问页面 的最大高度值。
在S412中,判断定时时间到达。
在S414中,遍历Map中所有用户数据。
在S416中,更新用户访问最大高度表,可例如为hbase表。当定时时间到则将Map中存储的用户访问页面的最大高度值更新到Hbase表中;同时清空Map对象。其中,考虑到实时查询和更新Hbase表,可例如通过两张表来实现,每张表的表结构设计如下表所示:
| Hbase表 | rowKey | 列值 |
| 表1 | 网址+日期+用户id | 用户访问网页到达的最大高度值 |
| 表2 | 网址+日期+最小统计像素区域 | 该像素区域到达的用户数 |
其中表1作为中间表,用于存储网页每一天到达的用户数,以及每一位用户网页访问到达的最大高度值,因日访问量较大,可例如设置每条记录持久性为2天。
表2作为最终表,由于存储网页纵向各个区域到达的用户数;为了提升性能并减小记录数,将网页纵向分成以20px为步长的离散区域(比如:20px、40px、60px);最终基于表1中的数据,计算出各个离散区域到达的用户数。
在S418中,更新网页各像素区域用户到达数。数据处理完毕后返回S402。
根据本发明的用于生成热力图的方法,通过实时采集监控用户鼠标操作数据,从而获得浏览网页的最大高度数值的方式,能够实时获取用户当前访问到达网页高度值。
图5是根据另一示例性实施例示出的一种用于生成热力图的方法的流程图。图5是对S208中生成热力图的示例性描述,本发明不以此为限。
如图5所示,在S502中,前台发起请求。后台网页运营装修人员发起查看分屏到达数据请求。可例如传入:网址、网页最大高度、指定每一屏高、查询日期
在S504中,传参规则校验并计算出网页的总屏数
在S506中,根据传参查询上面提到的Hbase表2,扫描Hbase表2查询出统计日期内网页各区域用户到达数
在S508中,根据传参中屏高和网页总高度,计算出网页总屏数。逐一处理和汇总查询的数据。可例如:设置rowKey=wangzhi20170622_1024,到达用户数=20,其中,1024指网页高度为1024px位置。
在S510中,向上取整求出统计位置(1024)落到第n屏,可例如指定屏高为800,则n=1024/800=2。
在S512中,遍历第1屏到第n屏,每一屏到达用户数加当前数据的到达用户数,如上所设:20。
在S514中,叠加每一条数据中的到达用户数得到整页用户数。基于表2中存储各个离散区域到达的用户数,汇总计算出到达各屏的用户数。
在S516中,计算:每一屏用户到达率=每一屏到达用户数/整页用户数。
在S518中,前台渲染并展示用户分屏到达数据。返回分屏到达用户数前段渲染展示给指定人员。
在本实施例中,将以指定像素步长(比如:20px),将网页划分为不同的像素区域(如:区域1:0-20px,区域2:20-20px),最终统计各屏到达用户数据时,采用的是屏内各区域用户数叠加的方式。也可以不指定像素步长,直接叠加各屏内每一个像素值的用户到达数,也可获得各屏到达用户数。本发明不以此为限。
根据本发明的用于生成热力图的方法,通过实时采集并处理用户数据,能够实现动态分屏数据统计。
本领域技术人员可以理解实现上述实施例的全部或部分步骤被实现为由CPU执行的计算机程序。在该计算机程序被CPU执行时,执行本发明提供的上述方法所限定的上述功能。所述的程序可以存储于一种计算机可读存储介质中,该存储介质可以是只读存储器,磁盘或光盘等。
此外,需要注意的是,上述附图仅是根据本发明示例性实施例的方法所包括的处理的示意性说明,而不是限制目的。易于理解,上述附图所示的处理并不表明或限制这些处理的时间顺序。另外,也易于理解,这些处理可以是例如在多个模块中同步或异步执行的。
下述为本发明装置实施例,可以用于执行本发明方法实施例。对于本发明装置实施例中未披露的细节,请参照本发明方法实施例。
图6是根据一示例性实施例示出的一种用于生成热力图的装置的框图。
监听模块602用于监听用户在浏览器页面上的操作生成操作数据,操作包括鼠标滑动事件。
判断模块604用于在监听到鼠标滑动事件时,判断当前网页高度是否大于高度阈值。
更新模块606用于在当前网页高度大于高度阈值时,用当前网页高度更新高度阈值。
绘图模块608用于通过高度阈值与操作数据生成热力图。
根据本发明的用于生成热力图的装置,通过监控用户鼠标操作数据,进而获得浏览网页的最大高度数值,获取最大高度数值以及操作数据,进而生成热力图的方式,能够进行网页分屏浏览数据统计。
图7是根据一示例性实施例示出的一种用于生成热力图的系统的框图。
监听系统702用于监听用户在浏览器页面上的操作生成操作数据,操作包括鼠标滑动事件;在监听到鼠标滑动事件时,判断当前网页高度是否大于高度阈值;在当前网页高度大于高度阈值时,用当前网页高度更新高度阈值。
分布式实时计算系统704用于通过高度阈值与操作数据生成热力图。
分布式发布订阅消息系统706用于实时采集操作数据与高度阈值。
图8是根据另一示例性实施例示出的一种用于生成热力图的系统的框图。
其中,Kafka分布式采集日志模块802,用于实时数据采集,可例如通过页面埋点, 监听用户浏览网页时的鼠标滑动事件,再由事件触发自动上报用户浏览数据,并由Kafka完成数据采集工作。
Storm分布式实时计算模块804,可例如,采用Storm分布式实时计算框架,Storm的topology由一个spout和两层blot组成,具体的流式分层处理设计如图9所示。其中,Spout负责接入Kafka的消费者接口,负责实时读取用户数据。Url过滤blot层,负责解析spout抓取的数据,并筛选出需要的用户分屏浏览数据传给下一层。数据计算及存储blot层,负责计算过滤层传递数据,并将处理结果写入Hbase数据库表。其中,Spout消息源,是消息生产者,他会从一个外部源读取数据并向topology里面面发出消息:tuple。Bolt消息处理者,所有的消息处理逻辑被封装在bolts里面,处理输入的数据流并产生输出的新数据流,可执行过滤,聚合,查询数据库等操作。
数据汇总模块806,可例如用于后台网页运营装修人员发起查看分屏到达数据请求。可例如通过Hbase海量数据实时查询及存储808,基于表2中存储各个离散区域到达的用户数,汇总计算出到达各屏的用户数。返回分屏到达用户数前段渲染展示给运营。
图10是根据一示例性实施例示出的一种电子设备的框图。
下面参照图10来描述根据本发明的这种实施方式的电子设备200。图10显示的电子设备200仅仅是一个示例,不应对本发明实施例的功能和使用范围带来任何限制。
如图10所示,电子设备200以通用计算设备的形式表现。电子设备200的组件可以包括但不限于:至少一个处理单元210、至少一个存储单元220、连接不同系统组件(包括存储单元220和处理单元210)的总线230、显示单元240等。
其中,所述存储单元存储有程序代码,所述程序代码可以被所述处理单元210执行,使得所述处理单元210执行本说明书上述电子处方流转处理方法部分中描述的根据本发明各种示例性实施方式的步骤。例如,所述处理单元210可以执行如图2中所示的步骤。
所述存储单元220可以包括易失性存储单元形式的可读介质,例如随机存取存储单元(RAM)2201和/或高速缓存存储单元2202,还可以进一步包括只读存储单元(ROM)2203。
所述存储单元220还可以包括具有一组(至少一个)程序模块2205的程序/实用工具2204,这样的程序模块2205包括但不限于:操作系统、一个或者多个应用程序、其它程序模块以及程序数据,这些示例中的每一个或某种组合中可能包括网络环境的实现。
总线230可以为表示几类总线结构中的一种或多种,包括存储单元总线或者存储单元控制器、外围总线、图形加速端口、处理单元或者使用多种总线结构中的任意总线结构的局域总线。
电子设备200也可以与一个或多个外部设备300(例如键盘、指向设备、蓝牙设备等)通信,还可与一个或者多个使得用户能与该电子设备200交互的设备通信,和/或与使得该电子设备200能与一个或多个其它计算设备进行通信的任何设备(例如路由器、调制解调器等等)通信。这种通信可以通过输入/输出(I/O)接口250进行。并且,电子设备200 还可以通过网络适配器260与一个或者多个网络(例如局域网(LAN),广域网(WAN)和/或公共网络,例如因特网)通信。网络适配器260可以通过总线230与电子设备200的其它模块通信。应当明白,尽管图中未示出,可以结合电子设备200使用其它硬件和/或软件模块,包括但不限于:微代码、设备驱动器、冗余处理单元、外部磁盘驱动阵列、RAID系统、磁带驱动器以及数据备份存储系统等。
通过以上的实施方式的描述,本领域的技术人员易于理解,这里描述的示例实施方式可以通过软件实现,也可以通过软件结合必要的硬件的方式来实现。因此,根据本公开实施方式的技术方案可以以软件产品的形式体现出来,该软件产品可以存储在一个非易失性存储介质(可以是CD-ROM,U盘,移动硬盘等)中或网络上,包括若干指令以使得一台计算设备(可以是个人计算机、服务器、或者网络设备等)执行根据本公开实施方式的上述电子处方流转处理方法。
图11是根据一示例性实施例示出的一种计算机可读介质示意图。
参考图11所示,描述了根据本发明的实施方式的用于实现上述方法的程序产品400,其可以采用便携式紧凑盘只读存储器(CD-ROM)并包括程序代码,并可以在终端设备,例如个人电脑上运行。然而,本发明的程序产品不限于此,在本文件中,可读存储介质可以是任何包含或存储程序的有形介质,该程序可以被指令执行系统、装置或者器件使用或者与其结合使用。
所述程序产品可以采用一个或多个可读介质的任意组合。可读介质可以是可读信号介质或者可读存储介质。可读存储介质例如可以为但不限于电、磁、光、电磁、红外线、或半导体的系统、装置或器件,或者任意以上的组合。可读存储介质的更具体的例子(非穷举的列表)包括:具有一个或多个导线的电连接、便携式盘、硬盘、随机存取存储器(RAM)、只读存储器(ROM)、可擦式可编程只读存储器(EPROM或闪存)、光纤、便携式紧凑盘只读存储器(CD-ROM)、光存储器件、磁存储器件、或者上述的任意合适的组合。
所述计算机可读存储介质可以包括在基带中或者作为载波一部分传播的数据信号,其中承载了可读程序代码。这种传播的数据信号可以采用多种形式,包括但不限于电磁信号、光信号或上述的任意合适的组合。可读存储介质还可以是可读存储介质以外的任何可读介质,该可读介质可以发送、传播或者传输用于由指令执行系统、装置或者器件使用或者与其结合使用的程序。可读存储介质上包含的程序代码可以用任何适当的介质传输,包括但不限于无线、有线、光缆、RF等等,或者上述的任意合适的组合。
可以以一种或多种程序设计语言的任意组合来编写用于执行本发明操作的程序代码,所述程序设计语言包括面向对象的程序设计语言—诸如Java、C++等,还包括常规的过程式程序设计语言—诸如“C”语言或类似的程序设计语言。程序代码可以完全地在用户计算设备上执行、部分地在用户设备上执行、作为一个独立的软件包执行、部分在用户计算设备上部分在远程计算设备上执行、或者完全在远程计算设备或服务器上执行。在涉及远程计算设备的情形中,远程计算设备可以通过任意种类的网络,包括局域网(LAN)或 广域网(WAN),连接到用户计算设备,或者,可以连接到外部计算设备(例如利用因特网服务提供商来通过因特网连接)。
上述计算机可读介质承载有一个或者多个程序,当上述一个或者多个程序被一个该设备执行时,使得该实现如下功能::监听用户在浏览器页面上的操作生成操作数据,操作包括鼠标滑动事件;在监听到鼠标滑动事件时,判断当前网页高度是否大于高度阈值;在当前网页高度大于高度阈值时,用当前网页高度更新高度阈值;以及通过高度阈值与操作数据生成热力图。
本领域技术人员可以理解上述各模块可以按照实施例的描述分布于装置中,也可以进行相应变化唯一不同于本实施例的一个或多个装置中。上述实施例的模块可以合并为一个模块,也可以进一步拆分成多个子模块。
通过以上的实施例的描述,本领域的技术人员易于理解,这里描述的示例实施例可以通过软件实现,也可以通过软件结合必要的硬件的方式来实现。因此,根据本发明实施例的技术方案可以以软件产品的形式体现出来,该软件产品可以存储在一个非易失性存储介质(可以是CD-ROM,U盘,移动硬盘等)中或网络上,包括若干指令以使得一台计算设备(可以是个人计算机、服务器、移动终端、或者网络设备等)执行根据本发明实施例的方法。
通过以上的详细描述,本领域的技术人员易于理解,根据本发明实施例的用于生成热力图的方法、装置以及系统具有以下优点中的一个或多个。
根据一些实施例,本发明的用于生成热力图的方法,可以提供实时查询用户行为数据平台;提供千万级用户数据实时消费存储的方法,并通过实时采集、汇总,从而让实时查看前台用户分页浏览行为数据成为可能。
根据另一些实施例,本发明的用于生成热力图的方法,可以提供强有力的数据支撑,便于引导用户更合理的优化网页排版,提升网页转化率。通过分屏到达热力图,为网站运营提供数据支持,进而引导合理排版。
根据另一些实施例,本发明的用于生成热力图的方法,存储分屏到达用户数据时,采用定长像素区域划分网页,分区域记录用户到达数,减少了数据库记录数,同时提升查询和更改性能。
根据另一些实施例,本发明的用于生成热力图的方法,可以针对大型网站庞大的用户行为数据,提供实时的采集分析存储的解决方案。
以上具体地示出和描述了本发明的示例性实施例。应可理解的是,本发明不限于这里描述的详细结构、设置方式或实现方法;相反,本发明意图涵盖包含在所附权利要求的精神和范围内的各种修改和等效设置。
此外,本说明书说明书附图所示出的结构、比例、大小等,均仅用以配合说明书所公开的内容,以供本领域技术人员了解与阅读,并非用以限定本公开可实施的限定条件,故 不具技术上的实质意义,任何结构的修饰、比例关系的改变或大小的调整,在不影响本公开所能产生的技术效果及所能实现的目的下,均应仍落在本公开所公开的技术内容得能涵盖的范围内。同时,本说明书中所引用的如“上”、“第一”、“第二”及“一”等的用语,也仅为便于叙述的明了,而非用以限定本公开可实施的范围,其相对关系的改变或调整,在无实质变更技术内容下,当也视为本发明可实施的范畴。
Claims (15)
- 一种用于生成热力图的方法,其特征在于,包括:监听用户在浏览器页面上的操作生成操作数据,所述操作包括鼠标滑动事件;在监听到所述鼠标滑动事件时,判断当前网页高度是否大于高度阈值;在当前网页高度大于所述高度阈值时,用所述当前网页高度更新所述高度阈值;以及通过所述高度阈值与所述操作数据生成热力图。
- 如权利要求1所述的方法,其特征在于,所述通过所述高度阈值与所述操作数据生成热力图,包括:通过所述高度阈值与所述操作数据生成网页分屏热力图。
- 如权利要求1所述的方法,其特征在于,所述监听用户在浏览器页面上的操作生成操作数据,包括:通过页面埋点的方式,监听所述用户在所述浏览器页面上的操作生成所述操作数据,所述操作数据包括用户信息。
- 如权利要求1所述的方法,其特征在于,还包括:通过分布式发布订阅消息系统实时采集所述操作数据与所述高度阈值。
- 如权利要求4所述的方法,其特征在于,所述操作数据分多区储存在所述分布式发布订阅消息系统中,且属性为相同主题。
- 如权利要求1所述的方法,其特征在于,所述通过所述高度阈值与所述操作数据生成热力图,包括:通过分布式实时计算系统处理所述操作数据与所述高度阈值,生成处理结果;确定最小统计像素区域;通过所述最小统计像素区域与Hbase表格保存所述处理结果;以及通过所述处理结果生成所述热力图。
- 如权利要求6所述的方法,其特征在于,所述通过分布式实时计算系统处理所述操作数据与所述高度阈值,生成处理结果,包括:通过分布式实时计算系统筛选所述操作数据与所述高度阈值,生成处理结果。
- 如权利要求6所述的方法,其特征在于,所述通过所述最小统计像素区域与Hbase表格保存所述处理结果,包括:通过所述最小统计像素区域对所述处理结果进行分区统计;以及通过Hbase表格保存分区统计数据并生成所述处理结果。
- 如权利要求6所述的方法,其特征在于,所述通过所述处理结果生成所述热力图,包括:确定网页的分屏数;通过通过所述处理结果与所述分屏数生成所述热力图。
- 如权利要求9所述的方法,其特征在于,所述确定网页的分屏数,包括:通过屏高与网页总高度确定网页的所述分屏数。
- 一种用于生成热力图的装置,其特征在于,包括:监听模块,用于监听用户在浏览器页面上的操作生成操作数据,所述操作包括鼠标滑动事件;判断模块,用于在监听到所述鼠标滑动事件时,判断当前网页高度是否大于高度阈值;更新模块,用于在当前网页高度大于所述高度阈值时,用所述当前网页高度更新所述高度阈值;以及绘图模块,用于通过所述高度阈值与所述操作数据生成热力图。
- 一种用于生成热力图的系统,其特征在于,包括:监听系统,用于监听用户在浏览器页面上的操作生成操作数据,所述操作包括鼠标滑动事件;在监听到所述鼠标滑动事件时,判断当前网页高度是否大于高度阈值;在当前网页高度大于所述高度阈值时,用所述当前网页高度更新所述高度阈值;以及分布式实时计算系统,用于通过所述高度阈值与所述操作数据生成热力图。
- 如权利要求12所述的系统,其特征在于,还包括:分布式发布订阅消息系统,用于实时采集所述操作数据与所述高度阈值。
- 一种电子设备,其特征在于,包括:一个或多个处理器;存储装置,用于存储一个或多个程序;当所述一个或多个程序被所述一个或多个处理器执行,使得所述一个或多个处理器实现如权利要求1-10中任一所述的方法。
- 一种计算机可读介质,其上存储有计算机程序,其特征在于,所述程序被处理器执行时实现如权利要求1-10中任一所述的方法。
Applications Claiming Priority (2)
| Application Number | Priority Date | Filing Date | Title |
|---|---|---|---|
| CN201710701921.4A CN110020273B (zh) | 2017-08-16 | 2017-08-16 | 用于生成热力图的方法、装置以及系统 |
| CN201710701921.4 | 2017-08-16 |
Publications (1)
| Publication Number | Publication Date |
|---|---|
| WO2019033852A1 true WO2019033852A1 (zh) | 2019-02-21 |
Family
ID=65361779
Family Applications (1)
| Application Number | Title | Priority Date | Filing Date |
|---|---|---|---|
| PCT/CN2018/092678 Ceased WO2019033852A1 (zh) | 2017-08-16 | 2018-06-25 | 用于生成热力图的方法、装置以及系统 |
Country Status (2)
| Country | Link |
|---|---|
| CN (1) | CN110020273B (zh) |
| WO (1) | WO2019033852A1 (zh) |
Cited By (4)
| Publication number | Priority date | Publication date | Assignee | Title |
|---|---|---|---|---|
| CN110781063A (zh) * | 2019-10-25 | 2020-02-11 | 北京博睿宏远数据科技股份有限公司 | 网页首屏时间的测量方法、装置、设备及存储介质 |
| CN113010626A (zh) * | 2021-04-27 | 2021-06-22 | 威创集团股份有限公司 | 一种热力图生成方法、装置、设备和存储介质 |
| CN113806648A (zh) * | 2020-12-02 | 2021-12-17 | 北京沃东天骏信息技术有限公司 | 一种信息生成的方法、装置和存储介质 |
| CN121328542A (zh) * | 2025-12-15 | 2026-01-13 | 钢研国际新材料创新中心(深圳)有限公司 | 一种自然语言驱动的热力学计算脚本自动生成方法及系统 |
Families Citing this family (2)
| Publication number | Priority date | Publication date | Assignee | Title |
|---|---|---|---|---|
| CN108804435B (zh) * | 2017-04-26 | 2022-02-01 | 北京京东尚科信息技术有限公司 | 用于确定当前屏热度值的方法和装置 |
| CN113010831A (zh) * | 2021-04-06 | 2021-06-22 | 金宝贝网络科技(苏州)有限公司 | 一种热力图优化方法、系统及存储介质 |
Citations (3)
| Publication number | Priority date | Publication date | Assignee | Title |
|---|---|---|---|---|
| CN104408133A (zh) * | 2014-11-27 | 2015-03-11 | 北京国双科技有限公司 | 网页链接区域的热力图的显示方法和装置 |
| CN104657417A (zh) * | 2014-12-17 | 2015-05-27 | 东软集团股份有限公司 | 热力图的处理方法及系统 |
| US20150363449A1 (en) * | 2009-05-08 | 2015-12-17 | Google Inc. | Refining location estimates and reverse Geocoding based on a user profile |
Family Cites Families (5)
| Publication number | Priority date | Publication date | Assignee | Title |
|---|---|---|---|---|
| AU2003295600A1 (en) * | 2002-11-14 | 2004-06-15 | Dharmacon, Inc. | Functional and hyperfunctional sirna |
| CN103561220A (zh) * | 2013-10-28 | 2014-02-05 | 三星电子(中国)研发中心 | 一种电视终端及其多屏显示和控制的方法 |
| CN106649372A (zh) * | 2015-10-30 | 2017-05-10 | 北京国双科技有限公司 | 热力图中广告点击量的展示方法和装置 |
| CN105930513A (zh) * | 2016-05-16 | 2016-09-07 | 北京京东尚科信息技术有限公司 | 一种浏览器历史记录排序方法及装置 |
| CN106599075B (zh) * | 2016-11-14 | 2019-07-09 | 武汉斗鱼网络科技有限公司 | 一种统计用户行为数据的方法及装置 |
-
2017
- 2017-08-16 CN CN201710701921.4A patent/CN110020273B/zh active Active
-
2018
- 2018-06-25 WO PCT/CN2018/092678 patent/WO2019033852A1/zh not_active Ceased
Patent Citations (3)
| Publication number | Priority date | Publication date | Assignee | Title |
|---|---|---|---|---|
| US20150363449A1 (en) * | 2009-05-08 | 2015-12-17 | Google Inc. | Refining location estimates and reverse Geocoding based on a user profile |
| CN104408133A (zh) * | 2014-11-27 | 2015-03-11 | 北京国双科技有限公司 | 网页链接区域的热力图的显示方法和装置 |
| CN104657417A (zh) * | 2014-12-17 | 2015-05-27 | 东软集团股份有限公司 | 热力图的处理方法及系统 |
Cited By (6)
| Publication number | Priority date | Publication date | Assignee | Title |
|---|---|---|---|---|
| CN110781063A (zh) * | 2019-10-25 | 2020-02-11 | 北京博睿宏远数据科技股份有限公司 | 网页首屏时间的测量方法、装置、设备及存储介质 |
| CN110781063B (zh) * | 2019-10-25 | 2023-12-05 | 北京博睿宏远数据科技股份有限公司 | 网页首屏时间的测量方法、装置、设备及存储介质 |
| CN113806648A (zh) * | 2020-12-02 | 2021-12-17 | 北京沃东天骏信息技术有限公司 | 一种信息生成的方法、装置和存储介质 |
| CN113010626A (zh) * | 2021-04-27 | 2021-06-22 | 威创集团股份有限公司 | 一种热力图生成方法、装置、设备和存储介质 |
| CN113010626B (zh) * | 2021-04-27 | 2023-12-05 | 威创集团股份有限公司 | 一种热力图生成方法、装置、设备和存储介质 |
| CN121328542A (zh) * | 2025-12-15 | 2026-01-13 | 钢研国际新材料创新中心(深圳)有限公司 | 一种自然语言驱动的热力学计算脚本自动生成方法及系统 |
Also Published As
| Publication number | Publication date |
|---|---|
| CN110020273B (zh) | 2021-06-29 |
| CN110020273A (zh) | 2019-07-16 |
Similar Documents
| Publication | Publication Date | Title |
|---|---|---|
| WO2019033852A1 (zh) | 用于生成热力图的方法、装置以及系统 | |
| EP2668767B1 (en) | Searching sensor data | |
| CN110019087B (zh) | 数据处理方法及其系统 | |
| CA3059738A1 (en) | Behaviour data processing method, device, electronic device and computer readable medium | |
| US20120197856A1 (en) | Hierarchical Network for Collecting, Aggregating, Indexing, and Searching Sensor Data | |
| CN108804445B (zh) | 热力图生成方法和装置 | |
| CN110704771B (zh) | 页面异常监控方法、系统、装置、电子设备及可读介质 | |
| DE112012004240T5 (de) | Überwachen des Ressourcenverbrauchs eines Anwendungsprogramms | |
| EP3031216A1 (en) | Dynamic collection analysis and reporting of telemetry data | |
| EP2668769A1 (en) | Indexing sensor data | |
| CN104714946A (zh) | 一种基于NoSQL的大规模Web日志分析系统 | |
| CN112182004B (zh) | 实时查看数据方法、装置、计算机设备及存储介质 | |
| CN110399212A (zh) | 任务请求处理方法、装置、电子设备及计算机可读介质 | |
| CN114731342B (zh) | 从边缘设备到远程网络的托管数据导出 | |
| CN103475749A (zh) | 一种跨域通信方法及装置 | |
| CN105229691B (zh) | 在滚动时延迟繁重操作 | |
| CN111240847B (zh) | 数据处理方法、装置、介质和计算设备 | |
| CN110020360A (zh) | 用户行为特征提取的方法,系统及服务器 | |
| CN103593345A (zh) | 网页流程图编辑方法及系统 | |
| CN116821493A (zh) | 消息推送方法、装置、计算机设备及存储介质 | |
| CN107870805B (zh) | 任务系统的信息处理方法及装置 | |
| CN106257447A (zh) | 云存储服务器的视频存储及检索方法、视频云存储系统 | |
| CN114254051A (zh) | 一种大数据计算方法、装置及大数据平台 | |
| US9692804B2 (en) | Method of and system for determining creation time of a web resource | |
| CN114372057B (zh) | 信息处理方法、装置、设备及介质 |
Legal Events
| Date | Code | Title | Description |
|---|---|---|---|
| NENP | Non-entry into the national phase |
Ref country code: DE |
|
| 122 | Ep: pct application non-entry in european phase |
Ref document number: 18846959 Country of ref document: EP Kind code of ref document: A1 |