WO2018174253A1 - Nitrobenzene derivative or salt thereof, and use of same - Google Patents
Nitrobenzene derivative or salt thereof, and use of same Download PDFInfo
- Publication number
- WO2018174253A1 WO2018174253A1 PCT/JP2018/011736 JP2018011736W WO2018174253A1 WO 2018174253 A1 WO2018174253 A1 WO 2018174253A1 JP 2018011736 W JP2018011736 W JP 2018011736W WO 2018174253 A1 WO2018174253 A1 WO 2018174253A1
- Authority
- WO
- WIPO (PCT)
- Prior art keywords
- group
- cells
- gstp1
- compound
- fluorescent probe
- Prior art date
Links
- XVFNKIUTLXVYFF-UHFFFAOYSA-N O=C(c1ccccc1)NI Chemical compound O=C(c1ccccc1)NI XVFNKIUTLXVYFF-UHFFFAOYSA-N 0.000 description 1
Images


Definitions
- the present invention relates to a nitrobenzene derivative or a salt thereof and use thereof.
- Glutathione-S-transferase (also referred to herein as “GST”) is an enzyme that catalyzes the formation of a conjugate between an electrophilic compound and reduced glutathione (also referred to herein as “GSH”). And is known to be involved in glutathione conjugation of drugs and endogenous active metabolites as drug-metabolizing enzymes.
- GST plays a role of detoxifying or discharging electrophilic compounds, for example, by producing these conjugates.
- GST has various functions such as steroid hormone biosynthesis, amino acid degradation, and prostaglandin biosynthesis.
- Non-Patent Document 1 discloses a series of fluorescent probes such as DNAFs and DNAT-Me as probes having a maximum absorption wavelength at 490 nm and a maximum fluorescence wavelength near 510 nm. These fluorescent probes show a significant increase in fluorescence intensity due to glutathioneization due to GST activity and the accompanying denitration reaction.
- the fluorescent probes (DNAFs and DNAT-Me) disclosed in Non-Patent Document 6 have high reactivity with GST-independent glutathione, there is a problem that a sufficient S / N ratio cannot be obtained. In addition, there was a problem that the fluorescence quantum yield after the reaction was low.
- GST is classified into three types, cytoplasmic type, mitochondrial type, and microsomal type, and human cytoplasmic type GST has seven types of classes, Alpha, Mu, Pi, Sigma, Theta, Omega, and Zeta.
- the Pi class molecular species GSTP1 which is expressed in limited normal tissues such as placenta, is overexpressed in many cancer cells (Non-patent Document 3). It has been reported that it contributes to cancer drug resistance (Non-patent Document 4).
- JNK c-jun-N-terminal kinase
- GSTP1 is dissociated from this complex and JNK is activated (Non-patent Document 5). That is, GSTP1 is thought to suppress apoptosis through activation of JNK by anticancer agents.
- GSTP1 inhibitors that have been developed so far bind to intracellular GSTP1 and inhibit the formation of GSTP1-JNK complex, thereby activating JNK and inducing apoptosis (Non-patent Document 6).
- GSTP1 is expected as a cancer marker and as a target molecule for anticancer drugs because it is overexpressed in many cancer cells and contributes to the acquisition of anticancer drug resistance. ing.
- Non-Patent Documents 7 and 8 fluorescent probes HMRef-bGal and gGlu-HMRG, which target ⁇ -galactosidase and ⁇ -glutamyltranspeptidase (GGT) that are overexpressed in cancer cells.
- these enzymes are not overexpressed in all cancer cells, and it is difficult to detect cancer cells with low expression levels.
- GSTP1 is overexpressed in almost all cancer cells except prostate cancer, it is considered that more cancer cells can be detected by capturing the overexpression of GSTP1. In the pathological diagnosis of cancer, tissue immunostaining is performed.
- this fluorescent probe can be applied to a biopsy tissue to detect cancer with GSTP1 activity as an index. The presence or absence can be evaluated.
- fluorescent probes that detect GSTP1 activity that can be used in living cells are expected to be used as new research tools.
- Fluorescent probes disclosed in Non-Patent Document 1 and Patent Document 1 have low selectivity for GST molecular species (that is, they do not have selectivity for GSTP1). Moreover, since the said fluorescent probe has high reactivity with GSH, its non-enzymatic reaction rate is large. For this reason, even if the fluorescent probe for GST activity measurement disclosed in Non-Patent Document 1 and Patent Document 1 is used, the presence of GSTP1 overexpressed in cancer cells cannot be specifically detected. There is.
- an object of the present invention is to provide a fluorescent probe capable of selectively detecting the activity of GSTP1.
- a nitrobenzene derivative (or a salt thereof) having a predetermined chemical structure is useful as a fluorescent probe capable of solving the above-mentioned problems, and has completed the present invention.
- L represents a fluorophore
- an EWG group represents an electron withdrawing group having a Hammett constant of 0.66 or more and less than 0.78
- a nitro (NO 2 ) group bonded to the benzene ring is bonded to the benzene ring.
- a fluorescent probe for measuring GSTP1 comprising the above nitrobenzene derivative or a salt thereof.
- composition for detecting cancer cells or cancer tissue a composition for cancer diagnosis, and the above-described fluorescent probe for measuring GSTP1 comprising the above-described fluorescent probe for measuring GSTP1.
- kit for cancer diagnosis using the said composition for a detection is provided.
- the step of applying the fluorescent probe for measuring GSTP1 or the composition for detection to a tissue the step of irradiating the tissue after application with excitation light, A step of detecting fluorescence from a tissue, a method of detecting cancer cells or cancer tissue, and a step of bringing the fluorescent probe for measuring GSTP1 or the composition for detection into contact with cells in blood collected from a living body
- a method for detecting cancer cells in blood comprising: irradiating the cells with excitation light; and detecting fluorescence from the cells.
- the EWG group represents an electron withdrawing group having a Hammett constant of 0.66 or more and less than 0.78, and the nitro (NO 2 ) group bonded to the benzene ring is ortho to the amide bond bonded to the benzene ring.
- the EWG group is located in the ortho or para position with respect to the nitro (NO 2 ) group, and R 1 is a substituted or unsubstituted alkyl group having 1 to 20 carbon atoms, Represents a substituted or unsubstituted alkoxy group having 1 to 20 carbon atoms, or an amide group (—C ( ⁇ O) NH 2 group), and m represents an integer of 0 to 5.
- the nitrobenzene derivative represented by these, or its salt is also provided.
- a fluorescent probe capable of selectively detecting the activity of GSTP1 is provided.
- the fluorescent probe according to the present invention can be used for applications such as detection of cancer cells or cancer tissues and diagnosis of cancer.
- the absorbance (Abs) value at the maximum absorption wavelength at the end of the 30-minute incubation in the presence of each GST molecular species was measured before the incubation.
- (A) shows the results of HPLC analysis
- FIGS. C and (D) are diagrams showing the results of HPLC analysis and LC-MS analysis of the fluorescent probe, respectively.
- the fluorescent probe according to the present invention Ps-TG which is a nitrobenzene derivative having a fluorophore
- GSTs having different concentrations are used for three types of GST (GSTA1-1, GSTM1-1, GSTP1-1). It is a figure which shows the result of having calculated specific activity by measuring the time-dependent change of the fluorescence intensity at the time of measuring GST activity.
- (A) is a graph showing changes over time in the fluorescence intensity of Ps-TG when the concentrations of various GSTs are 0.5 ⁇ g / mL.
- (B) is a graph showing the initial reaction rate of Ps-TG with various GSTs as a change in fluorescence intensity per unit time ( ⁇ F.I. / sec).
- (A) and (B) show the measurement results of the absorption spectrum and fluorescence spectrum of the fluorescent probe according to the present invention (Ps-DCTG, which is a nitrobenzene derivative having a fluorophore) synthesized in the examples.
- Ps-DCTG which is a nitrobenzene derivative having a fluorophore
- GSTs having different concentrations are used for three types of GST (GSTA1-1, GSTM1-1, GSTP1-1). It is a figure which shows the result of having calculated specific activity by measuring the time-dependent change of the fluorescence intensity at the time of measuring GST activity.
- A is a graph showing changes over time in the fluorescence intensity of Ps-DCTG when the concentrations of various GSTs are 0.5 ⁇ g / mL.
- B is a graph showing the initial reaction rate of Ps-DCTG with various GSTs as a change in fluorescence intensity per unit time ( ⁇ F.I.
- FIG. 1 It is a figure which shows the result of having investigated whether the fluorescence probe (Ps-TG, Ps-DCTG) which concerns on this invention synthesize
- (A) and (C) are chemical structural formulas of Ps-TG and Ps-DCTG, respectively.
- (B) and (D) are imaging images of MCF-7 cells to which each fluorescent probe was administered, respectively, from the left: fluorescence of the fluorescent probe; fluorescence of DsRed; and fluorescence of the fluorescent probe, fluorescence of DsRed, and It shows the superposition (Merge) of white images (the scale bars are all 20 ⁇ m).
- a fluorescent probe according to the present invention in which the phenolic hydroxy group of the xanthene ring is acylated (such as Ps-TAc and Ps-DCTAc) is added to a living cell, it permeates through the cell membrane and is taken into the cell. It is deacetylated by the hydrolysis of esterase present in the cell, converted to the corresponding phenol (Ps-TG or Ps-DCTG), and glutathioneated by the action of GSTP1 present in the cell. It is a figure for demonstrating the presumed mechanism which comes to emit a strong fluorescence.
- acylated such as Ps-TAc and Ps-DCTAc
- each of the three types of GST molecular species was expressed by the method using the expression vector pIRES2-DsRed Express2. It is a figure which shows the result of having performed the cell imaging at the time of applying to the expressed MCF-7 cell.
- A is a chemical structural formula of Ps-TAc
- B is an imaging image (the scale bars are all 40 ⁇ m)
- C is a cell expressing DsRed in which various GSTs are expressed (+ )
- non-expressing cells are graphs comparing the fluorescence intensities of green fluorescence.
- (D) is the chemical structural formula of Ps-DCTAc
- (E) is an imaging image (the scale bars are all 40 ⁇ m)
- (F) is the expression of DsRed in which various GSTs are expressed. It is the graph which compared the fluorescence intensity of the green fluorescence in a cell (+) and a non-expression cell (-).
- various molecular species of cytoplasmic GST and mitochondrial GST (18 types of 8 different classes) were incorporated into pIRES2-DsRed Express2 / 3xFLAG-GST and expressed by transfection into MCF-7 cells. It is an electrophoresis photograph showing the result of confirming the GSTP1 selectivity of the fluorescent probe (Ps-TAc) by Western blotting.
- FITC is an image of green fluorescence derived from a fluorescent probe (Ps-TAc)
- DsRed is an image of red fluorescence derived from DsRed
- Merge is an overlay image of these (scale) All bars are 20 ⁇ m).
- A) is an enlarged view of an observation image of GSTP1-expressing cells shown in FIG. 14, and
- B) is a graph in which the intensity of green fluorescence in each image shown in FIG. 14 is quantified among the GST-expressing cells. (The number of cells used for the measurement is 20).
- the activity of GSTP1 expressed by treating MCF-7 cells with a DNA methyltransferase inhibitor (5-azacytidine) can be captured using the fluorescent probe (PS-TAc) according to the present invention. It is a figure which shows the result of having verified whether it is possible.
- (A) is an imaging image of MCF-7 cells subjected to the above treatment
- (B) is a distribution of fluorescence intensity in 60 cells randomly extracted from each of the control group and the 5-azacytidine administration group.
- (A) is an imaging image of MCF-7 cells subjected to the above-described processing. Among them, “Merge ( ⁇ 10)” is a 10-fold enlarged image of the “Merge” image.
- (B) is a diagram showing the distribution of fluorescence intensity in 60 cells randomly extracted from each of the control siRNA administration group and the GSTP1 siRNA administration group.
- HT1080 cells which are fibroblastoma-derived cells expressing GSTP1. It is a figure which shows the result of applying the fluorescent probe (PS-TAc) which concerns on invention.
- (A) is an electrophoresis photograph showing the results of Western blotting.
- (B) is an imaging image of HT1080 cells subjected to the above-described processing, and among these, “Merge (wide field)” is a 6-fold enlarged image of the “Merge” image.
- (C) is a graph showing the distribution of fluorescence intensity in 60 cells randomly extracted from each of the control siRNA administration group and the GSTP1 siRNA administration group.
- (D) is an imaging image (corresponding to a merge (wide field)) before administration of Ps-TAc and after 6 minutes, 10 minutes, and 15 minutes after administration in a cell group administered with control siRNA and GSTP1 siRNA, respectively.
- the fluorescent probe according to the present invention ( It is a figure which shows the result of having administered Ps-TAc) to various cancer cells, and observing with a confocal laser microscope.
- A shows the chemical structure of the fluorescent probe according to the present invention (Ps-Naph which is a nitrobenzene derivative having a fluorophore) synthesized in the examples.
- B is a graph showing the results of measuring the fluorescence spectrum of the fluorescent probe (Ps-Naph) before and after the reaction with GSH in the presence of GSTP1-1.
- (A) shows the chemical structure of the fluorescent probe according to the present invention (Ps-FL which is a nitrobenzene derivative having a fluorophore) synthesized in the examples.
- (B) is a graph showing the results of measuring the fluorescence spectrum of the fluorescent probe (Ps-FL) before and after the reaction with GSH in the presence of GSTP1-1.
- (A) shows the chemical structure of the fluorescent probe according to the present invention (Ps-jRhod, which is a nitrobenzene derivative having a fluorophore) synthesized in the examples.
- (B) is a graph showing the results of measuring the fluorescence spectrum of the fluorescent probe (Ps-jRhod) before and after the reaction with GSH in the presence of GSTP1-1.
- One form of the present invention is the following general formula (1):
- the EWG group is an electron-withdrawing group, and has a Hammet constant of 0.66 or more and less than 0.78.
- the “Hammet constant ( ⁇ p)” is an index indicating the electron withdrawing property of the EWG group, and the larger this value, the higher the electron withdrawing property.
- the value of the Hammett constant ( ⁇ p) of the EWG group described in the literature shall be used. To do.
- the value of Hammett constant ( ⁇ p) is calculated by calculating the difference from the acid dissociation constant (pKa) of unsubstituted benzoic acid separately using a conventionally known software package. Can be obtained.
- “acid dissociation constant (pKa)” means an acid dissociation constant (pKa) in an aqueous solution, and the smaller this value, the greater the acid strength.
- the acid dissociation constant (pKa) in the aqueous solution can be actually measured by measuring the acid dissociation constant at 25 ° C. using an infinitely diluted aqueous solution.
- a value based on a database of known document values can be obtained by calculation.
- the Hammett constant of the EWG group is set to “0.66 or more and less than 0.78” because the Hammett constant of the EWG group is smaller than the value of the nitro group (—NO 2 group) (0.78). This indicates that the value is 0.66 or more of the cyano group (—C ⁇ N group).
- the EWG group preferably exhibits a resonance effect.
- the EWG group “represents a resonance effect” means that when the nitrobenzene derivative according to the present invention is used as a fluorescent probe for GSTP1 measurement, the aromatic quest for the benzene ring when the nitrobenzene derivative reacts with GSH.
- nitro bonded to the benzene ring (NO 2) groups is located in the ortho or para to the amide bond attached to the benzene ring, wherein EWG group, the nitro (NO 2 ) Located in the ortho or para position relative to the group.
- the nitrobenzene derivative can function as a GSTP1-selective fluorescent probe.
- L represents a fluorophore.
- the “fluorophore” means a chromophore that emits fluorescence, and is not particularly limited as long as it is a fluorescent functional group that can be used as a fluorescent labeling compound in the present invention.
- the fluorophore include those having a mother nucleus selected from the group consisting of fluorescein, rhodamine, BODIPY (boron-dipyrromethene), coumarin, TokyoGreen, TokyoMagenta, SingaporeGreen, naphthalimide, and rhodol.
- the fluorophore L is preferably the following general formula (2):
- R 1 represents a substituted or unsubstituted carbon atom having 1 to 20 carbon atoms (preferably 1 to 12 carbon atoms, more preferably 1 to 8 carbon atoms, still more preferably 1 to 4 carbon atoms, and particularly preferably 1 to 4 carbon atoms).
- N is the number of R 1 bonded to the benzene ring and represents an integer of 0 to 4.
- n is preferably an integer of 0 to 3, more preferably an integer of 0 to 2, and still more preferably 0 or 1.
- R 2 represents a hydrogen atom or 2 to 20 carbon atoms (preferably 2 to 12 carbon atoms, more preferably 2 to 8 carbon atoms, still more preferably 2 to 4 carbon atoms, particularly preferably carbon atoms). It represents an acyl group having 2 to 3, most preferably 2 carbon atoms. Among these, R 2 is preferably an acyl group having 2 to 20 carbon atoms from the viewpoint of high fat solubility (ie, cell membrane permeability) when used as a fluorescent probe for GSTP1 measurement.
- high fat solubility ie, cell membrane permeability
- X 1 and X 2 each independently represent a hydrogen atom or a halogen atom.
- the halogen atom may be a fluorine atom, a chlorine atom, a bromine atom, or an iodine atom.
- the halogen atom must be a fluorine atom or a chlorine atom. Is preferable, and a chlorine atom is particularly preferable.
- the “alkyl group” may be any alkyl group composed of a straight chain, a branched chain, a ring, or a combination thereof.
- R 1 is an alkyl group
- the carbon number thereof is 1 to 20 as described above, preferably 1 to 12 carbon atoms, more preferably 1 to 8 carbon atoms, still more preferably carbon number. 1 to 4, particularly preferably 1 to 2 carbon atoms (methyl group or ethyl group), and most preferably 1 carbon atom (methyl group).
- alkoxy group means —O-alkyl group, where “alkyl group” is a group having the above-mentioned definition and preferred form.
- acyl group may be either an aliphatic acyl group or an aromatic acyl group, or may be an aliphatic acyl group having an aromatic group as a substituent.
- the acyl group may contain one or more heteroatoms.
- an alkylcarbonyl group such as an acetyl group
- an alkyloxycarbonyl group such as an acetoxycarbonyl group
- an arylcarbonyl group such as a benzoyl group
- an aryloxycarbonyl group such as a phenyloxycarbonyl group
- an aralkylcarbonyl group Benzylcarbonyl group
- alkylthiocarbonyl group such as methylthiocarbonyl group
- alkylaminocarbonyl group such as methylaminocarbonyl group
- arylthiocarbonyl group such as phenylthiocarbonyl group
- arylaminocarbonyl group phenylaminocarbonyl group
- the alkyl group or alkoxy group as R 1 and the acyl group as R 2 described above may have one or more arbitrary substituents.
- substituents include an alkoxy group, a halogen atom (which may be a fluorine atom, a chlorine atom, a bromine atom, or an iodine atom), an amino group, a mono- or di-substituted amino group, a substituted silyl group, or
- the acyl group include, but are not limited to, an acyl group.
- the functional group has two or more substituents, they may be the same as or different from each other.
- the alkyl group and alkoxy group as R 1 are preferably unsubstituted, and when R 1 is present (when n is an integer of 1 to 4), R 1 is an unsubstituted alkyl group. It is preferable that Similarly, the acyl group as R 2 is preferably unsubstituted.
- the EWG group is more preferably a mesyl group or a cyano group, and the EWG group is most preferably a mesyl group. That is, in a preferred embodiment of the present invention, the nitrobenzene compound represented by the general formula (1) or a salt thereof is represented by the following general formula (3):
- the compound represented by the general formula (1) may exist as a salt.
- the salt include base addition salts, acid addition salts, amino acid salts and the like.
- the base addition salt include metal salts such as sodium salt, potassium salt, calcium salt, and magnesium salt, ammonium salts, and organic amine salts such as triethylamine salt, piperidine salt, and morpholine salt.
- the acid addition salt include mineral acid salts such as hydrochloride, sulfate, and nitrate, and organic acid salts such as methanesulfonate, paratoluenesulfonate, citrate, and oxalate.
- amino acid salts include glycine salts. However, the salt of the compound according to the present invention is not limited to these.
- the compound of the present invention represented by the general formula (1) may have one or more asymmetric carbons depending on the type of substituent, and there are stereoisomers such as enantiomers or diastereomers. There is a case. Pure forms of stereoisomers, any mixture of stereoisomers, racemates, and the like are all within the scope of the present invention.
- the compound of the present invention represented by the general formula (1) or a salt thereof may exist as a hydrate or a solvate, and any of these substances is included in the technical scope of the present invention.
- the kind of solvent which forms a solvate is not specifically limited, For example, solvents, such as ethanol, acetone, isopropanol, are mentioned.
- the nitrobenzene compound or a salt thereof according to the present invention is preferably present in a nonionic state under the condition of pH 7.4 (preferably pH 7.0 to 8.0) which is an in vivo environment.
- a compound satisfying such conditions is particularly useful as a fluorescent probe used for living cells as described later because it is particularly excellent in cell membrane permeability.
- the compound of the present invention represented by the general formula (1) can be used as a fluorescent probe for measuring glutathione-S-transferase (GST) P1.
- the compounds of the present invention are substantially non-fluorescent in the neutral region (eg, in the range of pH 5-9).
- GSH reduced glutathione
- GST glutathione-S-transferase
- the nitro group (—NO 2 group) bonded to the benzene ring the 2-position or 4-position of the compound of the present invention.
- Is desorbed and glutathione is converted to a strong fluorescent compound at this position.
- the compound represented by the general formula (1) or a salt thereof hardly emits fluorescence when irradiated with excitation light of, for example, about 490 nm in the neutral region, but the compound that is glutathione as described above is It has the property of emitting extremely intense fluorescence (for example, fluorescence wavelength 510 nm) under the same conditions.
- This reaction occurs selectively only with respect to GSTP1, and this reaction does not proceed even if other GST molecular species are present. Therefore, by using the compound of the present invention as a fluorescent probe for GSTP1 measurement, the presence of GSTP1 can be selectively measured based on the change in fluorescence intensity.
- a “fluorescent probe” refers to facilitating observation of a specific protein, cell, or tissue by specifically binding or distributing to a specific protein, cell, or tissue and emitting fluorescence. It means a substance that can be made.
- the term “fluorescent probe” refers to a substance that emits fluorescence, but in the present invention, a precursor that does not emit fluorescence itself but becomes fluorescent due to decomposition or the like is also referred to as “fluorescence probe”. It shall be included in the concept of “probe”.
- GSTP1 is overexpressed in almost all cancer cells except prostate cancer. For this reason, it is possible to detect cancer cells by capturing the overexpression of GSTP1 using the fluorescent probe for measuring GSTP1 according to the present invention. For example, it is possible to evaluate the presence or absence of cancer using GSTP1 activity as an index by applying a fluorescent probe according to the present invention capable of detecting GSTP1 activity to a biopsy tissue. That is, the fluorescent probe for measuring GSTP1 according to the present invention can be used as a probe for detecting cancer cells.
- a composition for cancer diagnosis or cancer It can also be used in diagnostic kits, and in cancer detection, determination, or diagnostic methods.
- the cancer detection, determination, or diagnosis method may be a method performed in vitro, or a method performed ex vivo or in vivo.
- the compound, fluorescent probe, or detection or diagnostic composition according to the present invention is applied to a biological sample held in an observation container generally used in a biological imaging technique such as a preparation, a glass bottom dish, a slide glass, or a multiwell plate. Although it can be made to act on, it can also be made to act on the biological sample held in the biological sample fixing device described in International Publication No. 2011/149032 pamphlet or the like. That is, according to another aspect of the present invention, there is provided a cancer diagnostic kit including the compound according to the present invention, a fluorescent probe or a detection or diagnostic composition, and a biological sample fixing device.
- the held biological sample is brought into contact by adding the compound according to the present invention, a fluorescent probe, a detection or diagnostic composition, or a solution thereof, and incubated for a predetermined time, and then a fluorescence microscope or a microplate reader is used. It is possible to irradiate a biological sample with excitation light and detect the generated fluorescence, and through this, a cell emitting fluorescence can be determined as a cancer cell.
- a preferred example of the biological sample is blood, and in this case, a group of cells obtained from blood is preferable.
- a group of blood cells collected from a patient suffering from cancer contains a large amount of blood cells and a small number of cancer cells, but the compound, fluorescent probe, or detection or diagnostic composition according to the present invention is used. By using it, cancer cells can be accurately detected from a large number of cells. Thereby, when a cancer cell exists in a test subject's blood cell, it can determine or diagnose that the said test subject has cancer. Alternatively, after incubation, the number of cancer cells and the acquisition of cancer cells can be performed using image acquisition by flow cytometry or fluorescence microscopy, followed by cell sorting using a micropipette.
- the origin of the biological sample is not particularly limited to blood, and it may be a biological sample other than blood or a non-biological sample.
- the kind of the sample derived from a living body other than blood is not particularly limited, and examples thereof include lymph, cerebrospinal fluid and other body fluids; cell extract (homogenate) and the like.
- the composition for detecting cancer cells or cancer tissue and the composition for cancer diagnosis according to the present invention is applied to the present invention in addition to in vivo imaging, in surgery or examination, before surgery or examination, or during surgery or examination.
- the composition for detecting cancer cells or cancer tissue is applied by parenteral administration, or the composition according to the present invention is sprayed or applied to a part or the whole of the surgical field under the naked eye or under the microscope.
- it may be used for detecting cancer cells or cancer tissue by applying by a method such as injection and irradiating the application site with excitation light after several tens of seconds to several minutes.
- the tissue emits fluorescence.
- the site emitting the fluorescence is cancer tissue. It can be identified, and it can be excised with the surrounding tissue including it.
- “surgery” refers to, for example, a craniotomy, a thoracotomy, a laparotomy, or a skin operation with a wound, and a mirror such as a gastroscope, a colonoscope, a laparoscope, or a thoracoscope Includes any surgery applied for the treatment of cancer, including visual surgery. This makes it possible to more clearly and accurately determine the range of cancer tissue that has been determined by relying on the morphology and tactile sensation of the cancer in surgical treatment to remove the cancer, making it easy to determine the extent of the removal. Become.
- examination refers to examinations using endoscopes such as gastroscopy and colonoscopy, and procedures such as excision and collection associated with examinations, as well as to tissues separated and collected from living organisms. This includes inspections that are performed on these.
- endoscopes such as gastroscopy and colonoscopy
- procedures such as excision and collection associated with examinations, as well as to tissues separated and collected from living organisms. This includes inspections that are performed on these.
- the cancer tissue When used in an examination using an endoscope, the cancer tissue emits fluorescence, so that the cancer tissue can be identified extremely easily.
- examination resection or therapeutic resection. Terms such as surgery and examination must be interpreted in the broadest sense and not in any way limited.
- the application concentration of the composition for detecting cancer cells or cancer tissue and the composition for cancer diagnosis according to the present invention is not particularly limited.
- a solution having a concentration of about 1000 ⁇ M can be applied.
- the pH of the composition is preferably used in the range of, for example, pH 7.0 to 7.5.
- the detection composition and diagnostic composition of the present invention the above-described compound (or a salt thereof) according to the present invention may be used as it is. However, if necessary, additives usually used for the preparation of reagents are used. You may mix
- additives such as solubilizers, pH adjusters, buffers, and isotonic agents can be used as additives for using the reagent in a physiological environment, and the amount of these can be selected as appropriate by those skilled in the art. It is.
- These compositions are generally provided as a composition in any form such as a mixture in powder form, a lyophilized product, granules, tablets, liquids, etc., but it is used in sterile water for injection or an appropriate buffer at the time of use. What is necessary is just to melt
- a method for detecting cancer cells or cancer tissues using the compound, fluorescent probe, or detection or diagnostic composition according to the present invention is applied to the cell or tissue, and the cell or tissue after application is irradiated with a predetermined excitation light, thereby Or detecting fluorescence in the tissue.
- a method for detecting cancer cells in the blood in which case the cells in the blood may be fixed to an observation container such as a preparation, or the biological sample fixing apparatus described above. It may be a diagnostic chip fixed by.
- such a detection method can be applied to a living tissue and used for a definitive diagnosis of cancer tissue at the time of surgery.
- it may be applied by spraying or applying to cells or tissues, or may be applied by injection or infusion.
- surgery / treatment including the steps of determining a cancer excision region using the cancer cell or cancer tissue detection method according to the present invention and excising the region. It may be related to the method.
- the cancer cell detection method according to the present invention can be used in a cancer determination or diagnosis method. That is, when the method for detecting cancer cells according to the present invention detects fluorescence higher than the fluorescence serving as an index, it can be determined or diagnosed that cancer is present.
- the determination method refers to a method of specifying without including a determination by a medical worker including a doctor by comparing with an index.
- a fluorescence cell can be selected as the fluorescence serving as an index.
- the severity of cancer can be determined by using the fluorescence intensity or the number of cells having fluorescence as an index.
- cancer tissue means any tissue containing cancer cells.
- tissue can be interpreted in the broadest sense, including part or all of an organ, and should not be limitedly interpreted in any way. Since the cancer diagnostic agent according to the present invention has an action of detecting the activity of GSTP1 that is specifically strongly expressed in cancer tissues, it highly expresses GSTP1 among cancer tissues. Tissues are preferred, and such cancer tissues are most cancer tissues except prostate cancer tissues. Examples of cancer include, for example, colorectal cancer, breast cancer, lung cancer, esophageal cancer, stomach cancer, liver cancer, biliary tract cancer, spleen cancer, kidney cancer, bladder cancer, uterine cancer, and ovarian cancer.
- GSTP1 is expressed in normal epithelial cells, it is known that the expression of GSTP1 is not observed when the CpG part of the promoter region of the GSTP1 gene is methylated by canceration. Therefore, if the fluorescent probe according to the present invention can be applied to such a system, it is also possible to detect prostate cancer cells (GSTP1 is not overexpressed) using the presence or absence of fluorescence as an index.
- cytoplasmic GST has seven classes such as Alpha, Mu, Pi, etc., but in this experiment, there are many reports in the paper because of the high expression level in vivo.
- the reactivity and selectivity of various nitrobenzene derivatives as GST substrates were evaluated by performing assays using three types of cytoplasmic GSTs, GSTA1, GSTM1, and GSTP1.
- an assay is performed using the fact that an absorption spectrum changes greatly when a nitro group (having high electron withdrawing property) is replaced with glutathione (having weak electron donating property) in a nitrobenzene derivative. Is going.
- Non-Patent Document 1 the following compound (A) (3, which is the GST substrate site of the GST activity detection fluorescent probe (DNAT-Me) proposed in Non-Patent Document 1 is used using the same method as in Non-Patent Document 1.
- 4-Dinitrobenzanilide (3,4-NNBA)) was synthesized as a reference substance.
- the following compounds (B) to (G) were synthesized in the same manner as the compound (A) by changing the synthesis raw material.
- FIGS. 1A to 1G The results are shown in FIGS. 1A to 1G.
- (A) shows the structure of each compound
- (B) shows the absorption spectrum at the end of the 30 minute incubation
- (C) shows the absorption wavelength of each compound (described in each figure). It is a graph which shows the time change of a light absorbency.
- “Before” is an absorption spectrum before addition of GSH and GST
- compound (B) which is a positional isomer of compound (A) reacts more slowly than compound (A), such as a slow change in absorption spectrum in the absence of an enzyme in which only GSH is present. Although there was a decrease in sex, there was no change in the selectivity trend of GST molecular species.
- the compound (C) showed no change in the absorption spectrum due to the presence or absence of GST ((B) in FIG. 1C).
- the formation of a meisenheimer complex as a reaction intermediate is considered to be a rate-determining step.
- the Hammett constant of the trifluoromethyl (CF 3 ) group is 0.54, and the cyano group (0.66) used in the compound (D) and the mesyl group (0.72) used in the compound (F). Is also small.
- compound (D) showed a rapid increase in absorbance at 290 nm in the presence of GSTP1.
- the absorbance decreased with time under conditions other than the presence of GSTP1. This difference suggests that different products are produced under each condition.
- compound (F) which is a positional isomer of compound (E), rapidly changes in the absorption spectrum in the presence of GSTP1, and shows a change in the absorption spectrum in the presence of GSTA1 or GSTM1. There wasn't. In addition, no reaction with enzyme-independent GSH was observed. Thus, compound (F) is extremely promising as a GSTP1-selective substrate.
- the compound (G) having a methylsulfinyl group (—SOCH 3 group) at the 2-position of the benzene ring did not change the absorption spectrum under any condition.
- the Hammett constant of the methylsulfinyl group is 0.49, which is smaller than the cyano group (0.66) used in the compound (D) and the mesyl group (0.72) used in the compound (F). .
- the contribution to the stabilization of the reaction intermediate (Meisenheimer complex) by the sulfinyl group is smaller than that of the cyano group or the mesyl group, it is considered that the glutathionation reaction did not proceed.
- the absorbance (Abs) value at the maximum absorption wavelength at the end of the 30-minute incubation in the presence of each GST molecular species is expressed as the absorbance (the result of comparison of abs 0 values divided by the value obtained by the) (abs / abs 0) shown in the graph of FIG. 1H.
- the absorbance the result of comparison of abs 0 values divided by the value obtained by the) (abs / abs 0) shown in the graph of FIG. 1H.
- the absorbance (Abs) value at the maximum absorption wavelength at the end of the 30-minute incubation in the presence of each GST molecular species is expressed as the absorbance (the result of comparison of abs 0 values divided by the value obtained by the) (abs / abs 0) shown in the graph of FIG. 1H.
- the compounds (D) to (F) only the value of Abs / Abs 0 in the presence of GSTP1 showed a large value.
- the compounds (D) to (F) can be candidates for GSTP1-selective substrates. If this is generalized, it can be considered that the structure shown in the general formula (4) can be a GSTP1-selective substrate as long as the following conditions are satisfied.
- the nitro (NO 2 ) group attached to the benzene ring is located in the ortho or para position relative to the amide bond attached to the benzene ring; and the EWG group is located in the ortho position relative to the nitro (NO 2 ) group or Located in the para position.
- the peak of the compound (F) seen before the reaction (upper) disappears after the reaction (lower), and a new compound having a shorter retention time may be generated. confirmed. Moreover, since the absorption spectrum of the newly produced
- GSH glutathione
- the Griess method is known as a method for detecting and quantifying nitrite ions, and uses a diazo coupling of NO 2 ⁇ , sulfanilamide, and 1-naphthylethylenediamine under acidic conditions to produce a azo compound.
- NO 2 ⁇ is indirectly detected and quantified by measuring absorbance.
- nitrite was added to a reaction solution obtained by incubating compound (F) in 100 mM aqueous sodium phosphate (pH 7.4) in the presence of 5.0 ⁇ g / mL GSTP1 and 1 mM GSH at 25 ° C. for 30 minutes. Ions were quantified (reaction mechanism is shown in FIG. 3A).
- a calibration curve based on the absolute concentration was prepared by quantifying separately prepared NO 2 - having a known concentration, and nitrite ions generated by the reaction were quantified by the calibration curve method.
- FIG. 3B it was confirmed that nitrite ions having a concentration almost equal to the substrate concentration used were present in the reaction solution.
- the starting material 2-methyl-4-nitrobenzoic acid (1) is first reduced to an alcohol by a borane complex, and the product is recrystallized from a mixed solvent of hexane / ethyl acetate (10: 1).
- 2-methyl-4-nitrobenzyl alcohol (2) was obtained in a yield of 81%.
- 2-methyl-4-nitrobenzyl alcohol was mixed with silica gel and oxidized to aldehyde with pyridinium chlorochromate (PCC).
- PCC pyridinium chlorochromate
- 2-methyl-4-nitrobenzaldehyde (3) was isolated by filtration through silica gel under reduced pressure (yield 91%).
- 2-methyl-4-nitrobenzaldehyde (3) and resorcinol are heated in methanesulfonic acid and subjected to Friedel-Crafts type condensation reaction, dehydration condensation and oxidation reaction, and then 2-methyl-4-nitro TG (4) was synthesized. Reduction of the nitro group of 2-methyl-4-nitro TG (4) to an amino group with hydrates of sodium sulfide and sodium hydrogen sulfide gave 4-amino-2-methyl TG (6) (in two steps). Yield 4%).
- the mixture was suspended in acetonitrile, 1N aqueous sodium hydroxide solution was added at room temperature with stirring at 4 ° C., and the mixture was allowed to react for 10 minutes.
- the reaction was neutralized with 200 mM sodium phosphate buffer, pH 7.4, diluted with HPLC initial solvent (below) and purified by preparative HPLC.
- 10 mM ammonium acetate buffer (pH 7.0) is used as mobile phase A
- acetonitrile is used as mobile phase B
- the elution was performed at a flow rate of 9 mL / min.
- 2-methyl-4-nitro-dichloroTG (5) (8.7 mg, 0.023 mmol), 5-mesyl-2-nitrobenzoic acid (12.2 mg, 0.050 mmol), and 1-ethyl-3- ( 3-Dimethylaminopropyl) carbodiimide hydrochloride (EDC ⁇ HCl; 14.6 mg, 0.076 mmol) was stirred in 1 mL of acetonitrile for 20 minutes at room temperature. After the reaction solution was diluted with ethyl acetate, the organic layer was washed 3 times with 0.1N hydrochloric acid and once with saturated brine, dried over anhydrous magnesium sulfate, and evaporated under reduced pressure.
- EDC ⁇ HCl 1-ethyl-3- ( 3-Dimethylaminopropyl) carbodiimide hydrochloride
- FIGS. 4A and 4B The measurement results of the absorption spectrum and the fluorescence spectrum for Ps-TG (compound (8)) are shown in FIGS. 4A and 4B, respectively.
- Ps-TG showed an increase in fluorescence intensity of about 60 times before and after the reaction (the fluorescence quantum yields before and after the reaction were 0.016 and 0.913, respectively). there were).
- the absorption spectrum did not change before and after the reaction, and only the fluorescence spectrum changed greatly. This is because there is no difference in the process in which electrons are excited from the ground state to the excited state before and after the reaction, but there is a difference in the transition process of the excited electrons.
- HPLC and LC-MS were performed to confirm that Ps-TG exhibited strong fluorescence by undergoing a glutathione reaction.
- HPLC measurement was performed using the sample whose absorption spectrum and fluorescence spectrum were measured as described above as a reaction solution.
- the HPLC analysis consisted of LC-10AT as a pump, SPD-M20A and RF-10AxL (manufactured by Shimadzu Corporation) as absorption and fluorescence detectors, and an Interstain C18 column (GL Science) as a separation column.
- An HPLC system was utilized.
- LC-MS analysis was performed on the reaction product in order to confirm that the strong fluorescent peak confirmed by HPLC analysis was actually a glutathione molecule.
- the same reaction solution as that for HPLC measurement was used for LC-MS analysis.
- LC-10AT as a pump
- SPD-M20A as an absorption detector
- quadrupole mass spectrometer LCMS-2020 manufactured by Shimadzu Corporation
- Inertsil ODS-3 column as a separation column A system composed of (GL Science) was used.
- FIG. 4D The analysis result by LC-MS is shown in FIG.
- the upper stage of FIG.4 (D) is an absorption chromatogram
- a lower stage is an extraction ion chromatogram.
- the GSTP1 selectivity of Ps-TG was evaluated. Specifically, with respect to Ps-TG synthesized above, the fluorescence intensity over time when GST activity was measured using GSTs of different concentrations for three types of GST (GSTA1-1, GSTM1-1, GSTP1-1). Specific activity was calculated by measuring various changes.
- GSTA1-1 1 ⁇ M Ps-TG is dissolved in 100 mM phosphate buffer (pH 7.4; DMSO 0.1% is included as a co-solvent), and various concentrations of GST (GSTA1-1; 0.1 to 10) are dissolved. 0.1 ⁇ g / mL, GSTM1-1; 0.4 to 10.1 ⁇ g / mL, GSTP1-1; 0.3 to 9.8 ⁇ g / mL) in the presence of 1 mM reduced glutathione (GSH) and room temperature (25 ° C. ), And the fluorescence intensity was recorded every 30 seconds for 30 minutes.
- GST reduced glutathione
- FIG. 5 (A) is a graph showing the change over time in the fluorescence intensity of Ps-TG when the concentration of various GSTs is 0.5 ⁇ g / mL.
- FIG. 5B is a graph showing the initial reaction rate of Ps-TG with various GSTs as a change in fluorescence intensity per unit time ( ⁇ F.I. / sec).
- FIGS. 5A and 5B no increase in fluorescence intensity was observed with 1 mM GSH in the absence of GST and in the presence of GSTA1.
- an increase in fluorescence intensity was observed in the presence of GSTM1 or GSTP1, and changes in fluorescence intensity per unit time ( ⁇ F.I. / sec) were 0.9 and 7.1, respectively. The difference was about 8 times, and high GSTP1 selectivity could be confirmed.
- the redox active species include dithiothreitol (DTT), cysteine, 2-mercaptoethanol ( ⁇ ME), sodium trisulfide (Na 2 S 3 ), reduced and oxidized nicotinamide adenine dinucleotide (NADH and NAD + ), reduced and oxidized nicotinamide adenine dinucleotide phosphate (NADPH and NADP + ), ascorbic acid (AA) were used.
- the excitation / fluorescence wavelength was 490/510 nm, and it was reacted with 2.0 ⁇ g / ml GSTP1-1 as a positive control (GSH / GSTP1).
- As a negative control (None)
- the same experiment was performed without adding GSTP1 or GSH. This experiment was performed using a multiwell plate reader (SH-9000, Corona Electric Co., Ltd.).
- MCF-7 cells which are human breast cancer-derived cells in which the endogenous GSTP1 expression is hardly observed, were used.
- MCF-7 cells and HT-1080 cells described later 5% at 37 ° C. in Dulbecco's modified Eagle medium (DMEM) containing 10% fetal bovine serum (FBS) and 1% penicillin-streptomycin-glutamine. The cells were cultured under% CO 2 conditions and cultured while being passaged once every 3 to 4 days.
- DMEM Dulbecco's modified Eagle medium
- FBS fetal bovine serum
- penicillin-streptomycin-glutamine penicillin-streptomycin-glutamine
- MCF-7 cells were placed in a 35 mm glass bottom dish (Matsunami Glass Industrial Co., Ltd.) or an 8-well chamber (IWAKI) at 3.0 ⁇ 10 5 cells / dish or 3.3 ⁇ 10 4 cells / well. Each sowing was carried out. After the cells adhere, the expression vector pIRES2-DsRed Express2 / 3xFLAG-GSTP1 in which a cDNA (3xFLAG-GSTP1) encoding GSTP1 with 3xFLAG tag at the N-terminus is inserted is introduced by transfection reagent Fugene 6 (Promega Corporation). The cells were introduced into the cells and used for experiments after 24 hours.
- one mRNA transcribed downstream of the CMV promoter has both 3xFLAG-GSTP1 and DsRed Express2 mRNA sequences. Between these sequences, there is an internal ribosomal entry site (IRES), and 3xFLAG-GSTP1 and DsRed Express2 proteins are expressed. That is, by using this vector, the expression of 3xFLAG-GSTP1 can be confirmed by the fluorescence emitted by the red fluorescent protein DsRed Express2.
- IRS internal ribosomal entry site
- an imaging experiment was performed by loading a probe onto MCF-7 cells into which the expression vector was introduced. Specifically, 2.5 ⁇ M Ps-TG or Ps-DCTG was incubated for 5 minutes at 37 ° C. under 5% CO 2 on MCF-7 cells into which the above-described vector was introduced, and then confocal. Observation was performed under a laser scanning microscope.
- FLUOVIEW FV10i-DOC manufactured by Olympus Corporation
- the fluorescence of the fluorescent probe was excited by an LD laser having a wavelength of 473 nm
- the fluorescence of DsRed Express2 was an LD having a wavelength of 584 nm
- a fluorescence image in the corresponding fluorescence spectrum was obtained by excitation with a laser.
- FIG. 10 are chemical structural formulas of Ps-TG and Ps-DCTG, respectively.
- 10 (B) and (D) are imaging images of MCF-7 cells to which each fluorescent probe was administered, respectively, from the left: fluorescence of the fluorescent probe; fluorescence of DsRed; and fluorescence of the fluorescent probe, DsRed (Merge) of the fluorescence and the white image (scale bars are both 20 ⁇ m).
- fluorescence of the fluorescent probe fluorescence of DsRed
- DsRed Fluorescence of the fluorescent probe
- DsRed Dege
- the intensity of green fluorescence in cells that do not show red fluorescence was weak. This indicates that the fluorescence intensity of the fluorescent probe is selectively increased in cells in which GSTP1 is expressed.
- the fluorescence intensity in the cells was relatively small, and strong fluorescence was observed in the cell membrane. That is, it was suggested that none of the fluorescent probes has a high cell membrane permeability. This was considered that these fluorescent probes showed anionic property and did not have sufficient fat solubility in the in vivo environment (pH 7.4), and as a result, it was difficult to permeate the cell membrane.
- N, N′-diisopropylethylamine was added at a temperature of 4 ° C. to 2 mL of tetrahydrofuran in which Ps-TG (8) (2.1 mg, 0.0039 mmol) and acetyl chloride (0.6 ⁇ L, 0.008 mmol) were suspended.
- DIEPA DIEPA
- ethyl acetate was added dropwise and stirred on ice for 2 hours.
- the organic layer was washed 3 times with 1N hydrochloric acid and dried over anhydrous magnesium sulfate.
- Ps-TAc compound (10)
- Ps-TAc showed absorption spectra having peaks at wavelengths of 450 nm and 490 nm, as shown by the “pre-reaction” absorption spectrum shown in FIG. This is considered to be because the phenolic hydroxy group of the xanthene ring constituting the fluorophore is protected by an acetyl group.
- Ps-TAc and Ps-DCTAc are added to living cells, they are first permeated through the cell membrane by the mechanism shown in FIG. 12 and then taken into the cells, and then the esterase present in the cells. Is hydrolyzed and deacetylated, and converted to the corresponding alcohol (Ps-TG or Ps-DCTG). Since Ps-TG and Ps-DCTG are GSTP1-selective fluorescent probes, it is presumed that if GSTP1 is present in the incorporated cells, it will undergo glutathione action and emit strong fluorescence. .
- Cell imaging (2) For the two types of acetylated fluorescent probes (Ps-TAc, Ps-DCTAc) prepared above, three types of GST molecules were obtained by a technique using the expression vector pIRES2-DsRed Express2 similar to “Cell Imaging (1)” described above. Cell imaging was performed when applied to MCF-7 cells in which each of the species (GSTP1, GSTM1, GSTA1) was expressed.
- each of three types of GST molecular species (GSTP1, GSTM1, GSTA1) was expressed in MCF-7 cells expressed as 3xFLAG-tagged cDNA at the N-terminus.
- 2.5 ⁇ M Ps-TAc or Ps-DCTAc was incubated at 37 ° C. under 5% CO 2 for 5 minutes, and then observed using a confocal laser scanning microscope. From the images obtained as a result, the fluorescence intensity derived from the fluorescent probe in each cell was calculated from DsRed expressing cells (with red fluorescence) showing GST expression as + and non-expressing cells as ⁇ .
- FIG. 13 The results are shown in FIG.
- (A) in FIG. 13 is a chemical structural formula of Ps-TAc
- (B) is an imaging image (the scale bars are all 40 ⁇ m)
- (C) shows various GSTs. It is the graph which compared the fluorescence intensity of the green fluorescence in the expression cell (+) and non-expression cell (-) of DsRed.
- (D) in FIG. 13 is a chemical structural formula of Ps-DCTAc
- E) is an imaging image (the scale bars are all 40 ⁇ m)
- (F) expresses various GSTs. It is the graph which compared the fluorescence intensity of the green fluorescence in the expression cell (+) and non-expression cell (-) of DsRed.
- MCF-7 cells were transfected with pIRES2-DsRed Express2 / 3xFLAG-GST incorporating each of eight different 18 classes of GST by the same method as described above.
- each GST molecular species was confirmed by Western blotting. Specifically, an equal amount of protein (derived from GST-expressing MCF-7 cells) was separated by SDS-polyacrylamide (PAGE) gel electrophoresis (12.5% polyacrylamide) and then applied to a polyvinylidene fluoride (PVDF) membrane. Transcribed. After confirming protein transfer onto the PVDF membrane with 0.1% Ponceau S staining solution (manufactured by Vehicle Corporation), TBS-T containing 3% skim milk (Tris buffer containing 0.1% Tween-20) In the liquid) at room temperature for 1 hour.
- PAGE SDS-polyacrylamide
- PVDF polyvinylidene fluoride
- anti-FLAG-M2 mouse IgG antibody (dilution ratio 1: 5000, Sigma-Aldrich Japan GK) or anti- ⁇ -actin rabbit IgG antibody (dilution ratio 1) was used as the primary antibody. : 4000, Laboratory of Biomedical Research) (in 5% bovine serum albumin (BSA)) and shaken overnight at 4 ° C.
- BSA bovine serum albumin
- HRP horseradish peroxidase
- HRP horseradish peroxidase
- HRP horseradish peroxidase
- HRP horseradish peroxidase
- secondary antibody horseradish peroxidase
- FIG. 14 shows the result of Western blotting performed as described above. As shown in FIG. 14, it was confirmed that the target GST protein was expressed in MCF-7 cells in which any GST molecular species was expressed.
- MCF-7 cells expressing each GST molecular species were fixed in 4% paraformaldehyde PBS solution at room temperature for 15 minutes. Thereafter, the membrane was permeabilized by treatment with a PBS solution containing 0.1% Triton X-100 for 30 minutes.
- antibody buffer PBS containing 1% bovine serum albumin (BSA), 0.1% Triton X-100 and 0.1% sodium azide
- anti-FLAG-M2 mouse IgG Antibody (dilution ratio 1: 500, Sigma-Aldrich Japan LLC) was added and incubated overnight at 4 ° C. Cells were incubated with PBS for 5 minutes and washed to remove excess primary antibody (total 5 times). Next, the cells were incubated for 1 hour at room temperature in an antibody buffer containing AlexaFluor (registered trademark) 647-labeled anti-mouse IgG goat antibody (dilution ratio 1: 1000, Abcam Inc.), and then incubated with PBS for 5 minutes.
- AlexaFluor registered trademark
- the DAPI, DsRed, and AlexaFluor 647 fluorescent dyes were excited using laser beams having wavelengths of 405 nm, 583 nm, and 635 nm, respectively, and detection was performed using a corresponding filter set.
- Ps-TAc was incubated on MCF-7 cells expressing any of the various GST molecular species as described above, and then fluorescence imaging was performed using an epifluorescence microscope. Specifically, 2.5 ⁇ M Ps-TAc was incubated for 5 minutes at 37 ° C. and 5% CO 2 on MCF-7 cells expressing each of various GST molecular species as 3 ⁇ FLAG-tagged cDNA. After that, observation was performed using an epifluorescence microscope IX80 (Olympus Corporation).
- the fluorescence derived from the probe and the fluorescence derived from DsRed are respectively U-MNIBA filter set (excitation wavelength: 470 to 495 nm, fluorescence wavelength: 510 to 550 nm) and U-MWIG filter set (excitation wavelength: 530 to 550 nm, fluorescence wavelength). : 575 nm or more).
- FITC in FIG. 16 is an image of green fluorescence derived from a fluorescent probe (Ps-TAc)
- DsRed is an image of red fluorescence derived from DsRed
- Merge is an overlay image of these. Yes (both scale bars are 20 ⁇ m).
- FIG. 17A an enlarged observation image of GSTP1-expressing cells is shown in FIG. 17A, and a graph in which the intensity of green fluorescence in each image is quantified between the GST-expressing cells is shown in FIG. The number of cells used is 20).
- GSTP1 is expressed by treating MCF-7 cells with 5-azacytidine, which is used as a DNA methyltransferase inhibitor, and the activity of GSTP1 thus expressed is captured using PS-TAc. was verified to be possible.
- the medium was changed to a medium containing vehicle or 5 ⁇ M 5-azacytidine.
- the cells were detached with 0.25% trypsin-EDTA, and the cells were seeded on a 35 mm glass bottom dish so as to be 1.0 ⁇ 10 5 cells / dish. Was allowed to stand for more than 96 hours.
- HBSS Hanks' Balanced Salt Solution
- HBSS Hank's Balanced Salt Solution
- FLUOVIEW FV10i-DOC manufactured by Olympus Corporation
- the fluorescence of the fluorescent probe was excited by an LD laser having a wavelength of 473 nm
- the fluorescence of Hoechst 33258 was excited by an LD laser having a wavelength of 405 nm.
- Fluorescence images in the corresponding fluorescence spectrum were acquired.
- FIG. 18 (A) is an imaging image of MCF-7 cells subjected to the above-described processing
- FIG. 18 (B) shows 60 images randomly extracted from each of the control group and the 5-azacytidine administration group. It is a figure which shows distribution of the fluorescence intensity in a cell. As shown in FIG. 18, strong fluorescent cells derived from the fluorescent probe were not observed in the control group, whereas cells having very high fluorescence intensity were observed in the 5-azacytidine administration group.
- RNAi RNA interference
- MCF-7 cells treated with 5 ⁇ M 5-azacytidine added to the medium and GSTP1
- 4 ⁇ L of Lipofectamine TM RNAiMAX Transfection of 30 pmol of control siRNA or GSTP1 siRNA was compared to MCF-7 cells in the 5-azacytidine administration group in which strong fluorescent cells were observed as described above.
- the cells were introduced into the cells using Reagent (Thermo Fisher Scientific).
- the cells After 24 hours from the introduction of siRNA, the cells are detached with 0.25% trypsin-EDTA, all the cells are suspended in 6-10 mL of DMEM, reseeded in a 35 mm glass bottom dish, and further 24 hours after reseeding. Thereafter, observation was performed using a confocal laser scanning microscope in the same manner as described above.
- FIG. 19A is an imaging image of MCF-7 cells subjected to the above-described processing
- “Merge ( ⁇ 10)” is a 10-fold enlarged image of the “Merge” image.
- FIG. 19B is a graph showing the distribution of fluorescence intensity in 60 cells randomly extracted from each of the control siRNA administration group and the GSTP1 siRNA administration group. As shown in FIG. 19, in the GSTP1 siRNA administration group, a significant decrease in the fluorescence intensity derived from the fluorescent probe (Ps-TAc) was observed.
- the presence or absence of GSTP1 protein expression based on demethylation of the promoter region of the GSTP1 gene can be detected by using the fluorescent probe (Ps-TAc) according to the present invention.
- GSTP1 is expressed in normal epithelial cells, it is known that expression of GSTP1 is not observed when the CpG part of the promoter region of the GSTP1 gene is methylated by canceration. Therefore, if the fluorescent probe according to the present invention can be applied to such a system, it is possible to detect prostate cancer cells (GSTP1 is not overexpressed) using the presence or absence of fluorescence as an index. Conceivable.
- the present invention is applied to HT1080 cells which are fibroblastoma-derived cells expressing GSTP1.
- HT1080 cells which are fibroblastoma-derived cells expressing GSTP1.
- PS-TAc fluorescent probe
- HT1080 cells were seeded in a 6-well plate at 2.0 ⁇ 10 5 cells / well, 30 ⁇ mol of control siRNA or GSTP1 siRNA (manufactured by Invitrogen) was added to each 4 ⁇ L of Lipofectamine TM RNAiMAX Transfection.
- the cells were introduced into the cells using Reagent (Thermo Fisher Scientific). After 24 hours from the introduction of siRNA, the cells are detached with 0.25% trypsin-EDTA, all the cells are suspended in 6-10 mL of DMEM, reseeded in a 35 mm glass bottom dish, and further 24 hours after reseeding. Thereafter, observation was performed using a confocal laser scanning microscope in the same manner as described above. Furthermore, GSTP1 knockdown was confirmed by Western blotting using the same method as described above.
- FIG. 20A is an electrophoretogram showing the results of Western blotting.
- FIG. 20B is an imaging image of the HT1080 cell subjected to the above-described processing. Among these, “Merge (wide field)” is a 6-fold enlarged image of the “Merge” image.
- FIG. 20 (C) is a diagram showing the distribution of fluorescence intensity in 60 cells randomly extracted from each of the control siRNA administration group and the GSTP1 siRNA administration group.
- FIG. 20 (D) corresponds to imaging images (merge (wide field)) before administration of Ps-TAc and after 6 minutes, 10 minutes and 15 minutes after administration in the cell groups administered with control siRNA and GSTP1 siRNA, respectively. ).
- the fluorescent probe (Ps-TAc and the like) according to the present invention is a fluorescent probe capable of detecting the activity even in cancer cells that endogenously express GSTP1. .
- Ps-TAc was administered to various cancer cells in order to clarify whether Ps-TAc can capture the GSTP1 activity of various cancer cells and evaluate the presence or absence of GSTP1 expression. Observed with a confocal laser microscope.
- the cells were cultured for 20 minutes at 37 ° C. in Hank's buffer containing 10 ⁇ g / mL Hoechst 33258. Thereafter, the medium was removed, and the cells were washed with a sodium phosphate buffer. Subsequently, Hank's buffer containing 2 ⁇ M Ps-TAc was added, and further incubated at room temperature for 15 minutes, followed by fluorescence imaging with a confocal laser microscope (Olympus). As a confocal laser scanning microscope, FLUOVIEW FV10i-DOC (manufactured by Olympus Corporation) was used.
- the fluorescence of Hoechst 33258 was excited by an LD laser having a wavelength of 405 nm, and the fluorescence of the fluorescent probe was excited by an LD laser having a wavelength of 473 nm. A fluorescence image in the spectrum was acquired.
- HCT116, HT29 (colon cancer cell), HuCCT1 (bile duct cancer cell), DU145 (prostate cancer cell), HT1080 (fibrosarcoma cell) are used as GSTP1-positive cells, and GSTP1-negative cells are used.
- MCF7 breast cancer cells
- LNCaP prostate cancer cells
- the results are shown in FIG. Of the photographs shown in FIG. 21, the upper photograph corresponding to each cell is a fluorescent image, and the lower photograph is a white light (BF) image, both taken using a confocal laser microscope. .
- the fluorescence intensity and the intracellular distribution of the fluorescent product differ depending on the cell type, fluorescence could be confirmed in all the GSTP1-expressing cells used in this experiment. On the other hand, no increase in fluorescence intensity was observed in cells not expressing GSTP1.
- the precipitate was dissolved in purified water (40 mL) in which sodium sulfide nonahydrate (2.42 g) was dissolved, and the mixture was stirred at 60 ° C. for 2 hours.
- the reaction solution was cooled to room temperature and poured into a saturated aqueous solution of sodium dihydrogen phosphate.
- the solution was separated with ethyl acetate, and washed twice with a saturated aqueous sodium dihydrogen phosphate solution and once with a saturated saline solution.
- the organic layer was dried over anhydrous magnesium sulfate, and ethyl acetate was distilled off under reduced pressure.
- the reaction solution was partitioned between ethyl acetate and saturated aqueous sodium dihydrogen phosphate, and washed twice with saturated aqueous sodium dihydrogen phosphate and once with saturated brine.
- the organic layer was dried over anhydrous magnesium sulfate, and ethyl acetate was distilled off under reduced pressure.
- a fluorescence spectrophotometer (RF-5300PC; manufactured by Shimadzu Corporation) was used.
- 100 mM phosphate buffer (pH 7.4; DMSO 1%) containing 2 ⁇ M Ps-FL containing 1 mM reduced glutathione (GSH) and 3 ⁇ g / mL glutathione-S-transferase (GSTP1-1) as a cosolvent ) was allowed to react for 2 hours with stirring at room temperature (25 ° C.). Thereafter, the fluorescence spectrum after the reaction was measured in the same manner as described above.
- the reaction solution was cooled to room temperature and adjusted to pH 4 using saturated aqueous sodium dihydrogen phosphate solution.
- the mixture was separated with ethyl acetate, and washed three times with a saturated aqueous sodium dihydrogen phosphate solution and once with a saturated saline solution.
- the organic layer was dried over anhydrous magnesium sulfate, and ethyl acetate was distilled off under reduced pressure.
Landscapes
- Organic Low-Molecular-Weight Compounds And Preparation Thereof (AREA)
- Investigating Or Analysing Biological Materials (AREA)
- Pyrane Compounds (AREA)
- Medicines Containing Antibodies Or Antigens For Use As Internal Diagnostic Agents (AREA)
- Investigating Or Analysing Materials By The Use Of Chemical Reactions (AREA)
- Measuring Or Testing Involving Enzymes Or Micro-Organisms (AREA)
Abstract
[Problem] To provide a fluorescent probe with which it is possible to selectively detect GSTP1 activity. [Solution] A nitrobenzene derivative represented by general formula (1) [in the formula, the symbols are defined as in the specification] or a salt thereof is used as a fluorescent probe for measuring glutathione-S-transferase P1 (GSTP1).
Description
本発明は、ニトロベンゼン誘導体またはその塩およびそれらの用途に関する。
The present invention relates to a nitrobenzene derivative or a salt thereof and use thereof.
グルタチオン-S-トランスフェラーゼ(本明細書中、「GST」とも称する)は、親電子性化合物と還元型グルタチオン(本明細書中、「GSH」とも称する)との抱合体の生成反応を触媒する酵素であり、薬物代謝酵素として薬物や内在性活性代謝物のグルタチオン抱合に関与していることが知られている。生体内において、GSTは、これら抱合体を生成することにより、例えば、親電子性化合物を無毒化したり、排出したりする役割を担っている。また、GSTはこれ以外にも、ステロイドホルモンの生合成・アミノ酸の分解・プロスタグランジンの生合成など、多岐にわたる機能をもつ。
Glutathione-S-transferase (also referred to herein as “GST”) is an enzyme that catalyzes the formation of a conjugate between an electrophilic compound and reduced glutathione (also referred to herein as “GSH”). And is known to be involved in glutathione conjugation of drugs and endogenous active metabolites as drug-metabolizing enzymes. In vivo, GST plays a role of detoxifying or discharging electrophilic compounds, for example, by producing these conjugates. In addition to this, GST has various functions such as steroid hormone biosynthesis, amino acid degradation, and prostaglandin biosynthesis.
従来提案されているGST活性の測定方法としては、吸光法(比色法)、生物発光法、蛍光法などがある。なかでも、高感度での測定が可能である蛍光法に基づくGST活性の測定方法として、いくつかの蛍光プローブが開発されている。
Conventionally proposed methods for measuring GST activity include absorption method (colorimetric method), bioluminescence method, fluorescence method and the like. Among them, several fluorescent probes have been developed as a method for measuring GST activity based on a fluorescence method that can be measured with high sensitivity.
例えば非特許文献1には、490nmに極大吸収波長、510nm付近に極大蛍光波長をそれぞれ有するプローブとして、DNAF類やDNAT-Meといった一連の蛍光プローブが開示されている。これらの蛍光プローブはGST活性によるグルタチオン化と、これに伴う脱ニトロ化反応によって大きな蛍光強度上昇を示す。ただし、非特許文献6に開示された蛍光プローブ(DNAF類やDNAT-Me)は、GST非依存的なグルタチオンとの反応性が高いことから、十分なS/N比が得られないという問題があり、また、反応後の蛍光量子収率が低いという問題があった。さらに、DNAF類を蛍光プローブとして用いると、弱酸性領域のpH条件下では生成物の蛍光強度が大幅に減少するという問題もあった。そして、これらの問題を解決することを目的とした技術として、特許文献1によれば、DNAF類におけるフルオレセイン構造のキサンテン環の特定部位にフッ素原子または塩素原子を導入したフルオレセイン誘導体をGST活性測定用蛍光プローブとして用いることが提案されている。
For example, Non-Patent Document 1 discloses a series of fluorescent probes such as DNAFs and DNAT-Me as probes having a maximum absorption wavelength at 490 nm and a maximum fluorescence wavelength near 510 nm. These fluorescent probes show a significant increase in fluorescence intensity due to glutathioneization due to GST activity and the accompanying denitration reaction. However, since the fluorescent probes (DNAFs and DNAT-Me) disclosed in Non-Patent Document 6 have high reactivity with GST-independent glutathione, there is a problem that a sufficient S / N ratio cannot be obtained. In addition, there was a problem that the fluorescence quantum yield after the reaction was low. Furthermore, when DNAFs are used as fluorescent probes, there is also a problem that the fluorescence intensity of the product is significantly reduced under pH conditions in a weakly acidic region. And as a technique aiming at solving these problems, according to Patent Document 1, a fluorescein derivative having a fluorine atom or a chlorine atom introduced into a specific site of a xanthene ring of a fluorescein structure in DNAFs is used for measuring GST activity. It has been proposed to be used as a fluorescent probe.
ところで、GSTは、細胞質型、ミトコンドリア型、ミクロソーム型の3種類に分類され、ヒトの細胞質型GSTにはAlpha、Mu、Pi、Sigma、Theta、Omega、Zetaの7種類のクラスが存在し、それぞれに最大5種類の分子種が存在する(非特許文献2)。なかでも、胎盤をはじめとした限られた正常組織に発現しているPiクラスの分子種GSTP1は、多くのがん細胞で過剰発現しており(非特許文献3)、がん細胞の抗がん剤耐性に寄与していることが報告されている(非特許文献4)。さらにGSTP1は、JNK(c-jun-N-terminal kinase)と相互作用して複合体を形成し、ストレスシグナルによるJNKの活性化を阻害している。酸化ストレスや抗がん剤といった刺激が加わることで、この複合体からGSTP1が解離し、JNKが活性化される(非特許文献5)。すなわち、GSTP1は、抗がん剤によるJNKの活性化を介したアポトーシスを抑制していると考えられている。これまでに開発されてきたGSTP1阻害剤は、細胞内GSTP1に結合し、GSTP1-JNK複合体の形成を阻害することでJNKを活性化し、アポトーシスを誘導する(非特許文献6)。このように、多くのがん細胞で過剰発現していることと抗がん剤耐性の獲得に寄与していることから、GSTP1はがんマーカーとして、また抗がん剤の標的分子として期待されている。従来、がん細胞で過剰発現しているβ-ガラクトシダーゼやγ-グルタミルトランスペプチダーゼ(GGT)を標的とした蛍光プローブのHMRef-bGalやgGlu-HMRGが開発され、微小がんの検出に成功している(非特許文献7、8)。しかしながら、これらの酵素はすべてのがん細胞で過剰発現しているわけではなく、発現量の低いがん細胞を検出することは困難である。一方、GSTP1は前立腺がんを除くほぼ全てのがん細胞で過剰発現しているため、GSTP1の過剰発現を捉えることでより多くのがん細胞を検出することが可能であると考えられる。がんの病理診断においては組織免疫染色等が行われるが、GSTP1の活性を検出可能な蛍光プローブを開発できれば、生検組織にこの蛍光プローブを塗布することでGSTP1活性を指標としたがんの有無の評価が可能となる。また、生細胞で利用可能なGSTP1活性を検出する蛍光プローブは、新たな研究ツールとしての使用が期待される。
By the way, GST is classified into three types, cytoplasmic type, mitochondrial type, and microsomal type, and human cytoplasmic type GST has seven types of classes, Alpha, Mu, Pi, Sigma, Theta, Omega, and Zeta. There are up to five types of molecular species (Non-patent Document 2). Among them, the Pi class molecular species GSTP1, which is expressed in limited normal tissues such as placenta, is overexpressed in many cancer cells (Non-patent Document 3). It has been reported that it contributes to cancer drug resistance (Non-patent Document 4). Furthermore, GSTP1 interacts with JNK (c-jun-N-terminal kinase) to form a complex and inhibits JNK activation by stress signals. By applying a stimulus such as oxidative stress or an anticancer agent, GSTP1 is dissociated from this complex and JNK is activated (Non-patent Document 5). That is, GSTP1 is thought to suppress apoptosis through activation of JNK by anticancer agents. GSTP1 inhibitors that have been developed so far bind to intracellular GSTP1 and inhibit the formation of GSTP1-JNK complex, thereby activating JNK and inducing apoptosis (Non-patent Document 6). Thus, GSTP1 is expected as a cancer marker and as a target molecule for anticancer drugs because it is overexpressed in many cancer cells and contributes to the acquisition of anticancer drug resistance. ing. Conventionally, fluorescent probes HMRef-bGal and gGlu-HMRG, which target β-galactosidase and γ-glutamyltranspeptidase (GGT) that are overexpressed in cancer cells, have been developed and succeeded in detecting microcancers. (Non-Patent Documents 7 and 8). However, these enzymes are not overexpressed in all cancer cells, and it is difficult to detect cancer cells with low expression levels. On the other hand, since GSTP1 is overexpressed in almost all cancer cells except prostate cancer, it is considered that more cancer cells can be detected by capturing the overexpression of GSTP1. In the pathological diagnosis of cancer, tissue immunostaining is performed. If a fluorescent probe capable of detecting the activity of GSTP1 can be developed, this fluorescent probe can be applied to a biopsy tissue to detect cancer with GSTP1 activity as an index. The presence or absence can be evaluated. In addition, fluorescent probes that detect GSTP1 activity that can be used in living cells are expected to be used as new research tools.
非特許文献1や特許文献1に開示された蛍光プローブは、GST分子種の選択性が低い(すなわち、GSTP1に対する選択性を有しない)。また、当該蛍光プローブはGSHとの反応性が高いことから、非酵素的な反応速度が大きい。このため、非特許文献1や特許文献1に開示されたGST活性測定用蛍光プローブを用いたとしても、がん細胞において過剰発現しているGSTP1の存在を特異的に検出することはできないという問題がある。
Fluorescent probes disclosed in Non-Patent Document 1 and Patent Document 1 have low selectivity for GST molecular species (that is, they do not have selectivity for GSTP1). Moreover, since the said fluorescent probe has high reactivity with GSH, its non-enzymatic reaction rate is large. For this reason, even if the fluorescent probe for GST activity measurement disclosed in Non-Patent Document 1 and Patent Document 1 is used, the presence of GSTP1 overexpressed in cancer cells cannot be specifically detected. There is.
そこで本発明は、GSTP1の活性を選択的に検出することが可能な蛍光プローブを提供することを目的とする。
Therefore, an object of the present invention is to provide a fluorescent probe capable of selectively detecting the activity of GSTP1.
本発明者らは、上記課題を解決すべく鋭意検討を行った。その結果、驚くべきことに、所定の化学構造を有するニトロベンゼン誘導体(またはその塩)が、上記課題を解決可能な蛍光プローブとして有用であることを見出し、本発明を完成させるに至った。
The present inventors have intensively studied to solve the above problems. As a result, it has surprisingly been found that a nitrobenzene derivative (or a salt thereof) having a predetermined chemical structure is useful as a fluorescent probe capable of solving the above-mentioned problems, and has completed the present invention.
すなわち、本発明の一形態によれば、下記一般式(1):
That is, according to one aspect of the present invention, the following general formula (1):

式中、Lは蛍光団を表し、EWG基は0.66以上0.78未満のハメット定数を有する電子求引性基を表し、ベンゼン環に結合したニトロ(NO2)基はベンゼン環に結合したアミド結合に対してオルト位またはパラ位に位置し、前記EWG基は、前記ニトロ(NO2)基に対してオルト位またはパラ位に位置している、
で表されるニトロベンゼン誘導体またはその塩が提供される。 In the formula, L represents a fluorophore, an EWG group represents an electron withdrawing group having a Hammett constant of 0.66 or more and less than 0.78, and a nitro (NO 2 ) group bonded to the benzene ring is bonded to the benzene ring. In the ortho or para position relative to the amide bond, and the EWG group is in the ortho or para position relative to the nitro (NO 2 ) group,
Or a salt thereof is provided.
また、本発明の他の形態によれば、上記ニトロベンゼン誘導体またはその塩を含む、GSTP1測定用蛍光プローブが提供される。
Further, according to another aspect of the present invention, there is provided a fluorescent probe for measuring GSTP1 comprising the above nitrobenzene derivative or a salt thereof.
さらに、本発明のさらに他の形態によれば、上記GSTP1測定用蛍光プローブを含む、がん細胞またはがん組織の検出用組成物、およびがん診断用組成物、並びに上記GSTP1測定用蛍光プローブまたは上記検出用組成物を用いたがん診断用キットが提供される。
Furthermore, according to still another aspect of the present invention, a composition for detecting cancer cells or cancer tissue, a composition for cancer diagnosis, and the above-described fluorescent probe for measuring GSTP1 comprising the above-described fluorescent probe for measuring GSTP1. Or the kit for cancer diagnosis using the said composition for a detection is provided.
また、本発明のさらに他の形態によれば、上記GSTP1測定用蛍光プローブまたは上記検出用組成物を組織に適用する工程と、適用後の前記組織に対して励起光を照射する工程と、前記組織からの蛍光を検出する工程と含む、がん細胞またはがん組織の検出方法、および、上記GSTP1測定用蛍光プローブまたは上記検出用組成物を、生体から採取した血液中の細胞と接触させる工程と、前記細胞に対して励起光を照射する工程と、前記細胞からの蛍光を検出する工程とを含む、血液中におけるがん細胞の検出方法が提供される。
According to still another aspect of the present invention, the step of applying the fluorescent probe for measuring GSTP1 or the composition for detection to a tissue, the step of irradiating the tissue after application with excitation light, A step of detecting fluorescence from a tissue, a method of detecting cancer cells or cancer tissue, and a step of bringing the fluorescent probe for measuring GSTP1 or the composition for detection into contact with cells in blood collected from a living body And a method for detecting cancer cells in blood, comprising: irradiating the cells with excitation light; and detecting fluorescence from the cells.
さらに、本発明のさらに他の形態によれば、下記一般式(4):
Furthermore, according to still another aspect of the present invention, the following general formula (4):

式中、EWG基は0.66以上0.78未満のハメット定数を有する電子求引性基を表し、ベンゼン環に結合したニトロ(NO2)基はベンゼン環に結合したアミド結合に対してオルト位またはパラ位に位置し、前記EWG基は、前記ニトロ(NO2)基に対してオルト位またはパラ位に位置し、R1は、置換もしくは非置換の炭素数1~20のアルキル基、置換もしくは非置換の炭素数1~20のアルコキシ基、またはアミド基(-C(=O)NH2基)を表し、mは0~5の整数を表す、
で表されるニトロベンゼン誘導体またはその塩もまた、提供される。 In the formula, the EWG group represents an electron withdrawing group having a Hammett constant of 0.66 or more and less than 0.78, and the nitro (NO 2 ) group bonded to the benzene ring is ortho to the amide bond bonded to the benzene ring. The EWG group is located in the ortho or para position with respect to the nitro (NO 2 ) group, and R 1 is a substituted or unsubstituted alkyl group having 1 to 20 carbon atoms, Represents a substituted or unsubstituted alkoxy group having 1 to 20 carbon atoms, or an amide group (—C (═O) NH 2 group), and m represents an integer of 0 to 5.
The nitrobenzene derivative represented by these, or its salt is also provided.
本発明によれば、GSTP1の活性を選択的に検出することが可能な蛍光プローブが提供される。本発明に係る蛍光プローブは、がん細胞またはがん組織の検出やがんの診断といった用途に用いられうる。
According to the present invention, a fluorescent probe capable of selectively detecting the activity of GSTP1 is provided. The fluorescent probe according to the present invention can be used for applications such as detection of cancer cells or cancer tissues and diagnosis of cancer.
以下、本発明の実施形態を説明する。
Hereinafter, embodiments of the present invention will be described.
本発明の一形態は、下記一般式(1):
One form of the present invention is the following general formula (1):

で表されるニトロベンゼン誘導体またはその塩である。
Or a salt thereof.
一般式(1)において、EWG基は電子求引性基(Electron-Withdrawing Group)であって、0.66以上0.78未満のハメット(Hammet)定数を有するものである。なお、本明細書において「ハメット(Hammet)定数(σp)」とは、EWG基の電子求引性を示す指標であり、この値が大きいほど、電子求引性が高いことを示す。ここで、文献(Hansch et al., Chemical Reviews, 1991, Vol,91, No. 2, 165-195)に記載されているEWG基のハメット定数(σp)の値についてはその値を用いるものとする。一方、文献に記載されていないEWG基については、別途、従来公知のソフトウェアパッケージを利用し、無置換安息香酸の酸解離定数(pKa)との差を算出することでハメット定数(σp)の値を得ることができる。また、「酸解離定数(pKa)」とは、水溶液中での酸解離定数(pKa)を意味し、この値が小さいほど酸強度が大きいことを示す。ここで、水溶液中での酸解離定数(pKa)は、具体的には、無限希釈水溶液を用い、25℃での酸解離定数を測定することにより実測することができる。また、従来公知のソフトウェアパッケージを用いることで、公知文献値のデータベースに基づいた値を計算により求めることもできる。
In the general formula (1), the EWG group is an electron-withdrawing group, and has a Hammet constant of 0.66 or more and less than 0.78. In the present specification, the “Hammet constant (σp)” is an index indicating the electron withdrawing property of the EWG group, and the larger this value, the higher the electron withdrawing property. Here, the value of the Hammett constant (σp) of the EWG group described in the literature (Hansch et al., Chemical Reviews, 1991, Vol, 91, No. 2, 165-195) shall be used. To do. On the other hand, for EWG groups not described in the literature, the value of Hammett constant (σp) is calculated by calculating the difference from the acid dissociation constant (pKa) of unsubstituted benzoic acid separately using a conventionally known software package. Can be obtained. Further, “acid dissociation constant (pKa)” means an acid dissociation constant (pKa) in an aqueous solution, and the smaller this value, the greater the acid strength. Here, the acid dissociation constant (pKa) in the aqueous solution can be actually measured by measuring the acid dissociation constant at 25 ° C. using an infinitely diluted aqueous solution. Further, by using a conventionally known software package, a value based on a database of known document values can be obtained by calculation.
本発明において、EWG基のハメット定数を「0.66以上0.78未満」としたのは、EWG基のハメット定数が、ニトロ基(-NO2基)の値(0.78)よりも小さく、シアノ基(-C≡N基)の値(0.66)以上であることを示したものである。また、一般式(1)において、EWG基は共鳴効果を示すものであることが好ましい。ここで、EWG基が「共鳴効果を示す」とは、本発明に係るニトロベンゼン誘導体をGSTP1測定用蛍光プローブとして用いた場合において、当該ニトロベンゼン誘導体がGSHと反応する際の上記ベンゼン環に対する芳香族求核置換反応の反応中間体であるマイゼンハイマー錯体の構造を安定化するように、当該ベンゼン環に結合したニトロ基上へ電子が局在化した共鳴構造が存在することを意味する。なお、本発明におけるEWG基の例としては、例えば、メシル基(-SO2CH3基;ハメット定数=0.72であり、共鳴効果を示す)やシアノ基(-C≡N基;ハメット定数=0.66であり、共鳴効果を示す)などが挙げられるが、これらに限定されない。
In the present invention, the Hammett constant of the EWG group is set to “0.66 or more and less than 0.78” because the Hammett constant of the EWG group is smaller than the value of the nitro group (—NO 2 group) (0.78). This indicates that the value is 0.66 or more of the cyano group (—C≡N group). In the general formula (1), the EWG group preferably exhibits a resonance effect. Here, the EWG group “represents a resonance effect” means that when the nitrobenzene derivative according to the present invention is used as a fluorescent probe for GSTP1 measurement, the aromatic quest for the benzene ring when the nitrobenzene derivative reacts with GSH. It means that there exists a resonance structure in which electrons are localized on the nitro group bonded to the benzene ring so as to stabilize the structure of the meisenheimer complex which is a reaction intermediate of the nuclear substitution reaction. Examples of the EWG group in the present invention include, for example, a mesyl group (—SO 2 CH 3 group; Hammett constant = 0.72, indicating a resonance effect) and a cyano group (—C≡N group; Hammett constant). = 0.66, indicating a resonance effect), but is not limited thereto.
また、一般式(1)において、ベンゼン環に結合したニトロ(NO2)基はベンゼン環に結合したアミド結合に対してオルト位またはパラ位に位置し、前記EWG基は、前記ニトロ(NO2)基に対してオルト位またはパラ位に位置している。このような配置とすることにより、ニトロベンゼン誘導体はGSTP1選択的な蛍光プローブとして機能することができる。なお、一般式(1)においてベンゼン環に結合したアミド結合の当該ベンゼン環への結合位置を1位としたときに、上記の規定を満足するニトロ(NO2)基およびEWG基の結合位置の組み合わせを列挙すると以下の通りである:
・2位=ニトロ(NO2)基、3位=EWG基;
・2位=ニトロ(NO2)基、5位=EWG基;
・4位=ニトロ(NO2)基、3位=EWG基。 In the general formula (1), nitro bonded to the benzene ring (NO 2) groups is located in the ortho or para to the amide bond attached to the benzene ring, wherein EWG group, the nitro (NO 2 ) Located in the ortho or para position relative to the group. With such an arrangement, the nitrobenzene derivative can function as a GSTP1-selective fluorescent probe. In addition, when the bonding position of the amide bond bonded to the benzene ring in the general formula (1) is the first position, the bonding position of the nitro (NO 2 ) group and the EWG group satisfying the above definition The combinations are listed as follows:
2nd position = nitro (NO 2 ) group, 3rd position = EWG group;
2nd position = nitro (NO 2 ) group, 5th position = EWG group;
· 4-position = nitro (NO 2) group, 3-position = EWG group.
一般式(1)において、Lは蛍光団を表す。ここで「蛍光団」とは、蛍光を発する発色団を意味し、本発明においては蛍光標識化合物として使用されうる蛍光性官能基であれば特に限定されない。当該蛍光団としては、例えば、フルオレセイン、ローダミン、BODIPY(ボロン-ジピロメテン)、クマリン、TokyoGreen、TokyoMagenta、SingaporeGreen、ナフタルイミドおよびロドール(Rhodol)からなる群から選択される母核を有するものが挙げられる。なかでも、脂溶性が高く細胞膜透過性を有するという観点からは、クマリン、TokyoGreen、TokyoMagenta、およびSingapore Greenからなる群から選択される母核を有するものが好ましく、TokyoGreenを母核として有するものが特に好ましい。ここで、一般式(1)で表されるニトロベンゼン誘導体において、蛍光団Lは、好ましくは下記一般式(2):
In the general formula (1), L represents a fluorophore. Here, the “fluorophore” means a chromophore that emits fluorescence, and is not particularly limited as long as it is a fluorescent functional group that can be used as a fluorescent labeling compound in the present invention. Examples of the fluorophore include those having a mother nucleus selected from the group consisting of fluorescein, rhodamine, BODIPY (boron-dipyrromethene), coumarin, TokyoGreen, TokyoMagenta, SingaporeGreen, naphthalimide, and rhodol. Among these, from the viewpoint of high fat solubility and cell membrane permeability, those having a mother nucleus selected from the group consisting of coumarin, TokyoGreen, TokyoMagenta, and Singapore Green are preferred, and those having TokyoGreen as the mother nucleus are particularly preferred. preferable. Here, in the nitrobenzene derivative represented by the general formula (1), the fluorophore L is preferably the following general formula (2):

で表される構造を有するものであり、TokyoGreenを母核として有する化合物はこの形態に包含される。
And a compound having TokyoGreen as a mother nucleus is included in this form.
一般式(2)において、R1は、置換もしくは非置換の炭素数1~20(好ましくは炭素数1~12、より好ましくは炭素数1~8、さらに好ましくは炭素数1~4、特に好ましくは炭素数1~2、最も好ましくは炭素数1)のアルキル基、置換もしくは非置換の炭素数1~20(好ましくは炭素数1~12、より好ましくは炭素数1~8、さらに好ましくは炭素数1~4、特に好ましくは炭素数1~2、最も好ましくは炭素数1)のアルコキシ基、またはアミド基(-C(=O)NH2基)を表す。また、nはベンゼン環に結合したR1の数であり、0~4の整数を表す。nは、好ましくは0~3の整数であり、より好ましくは0~2の整数であり、さらに好ましくは0または1である。
In the general formula (2), R 1 represents a substituted or unsubstituted carbon atom having 1 to 20 carbon atoms (preferably 1 to 12 carbon atoms, more preferably 1 to 8 carbon atoms, still more preferably 1 to 4 carbon atoms, and particularly preferably 1 to 4 carbon atoms). Is an alkyl group having 1 to 2 carbon atoms, most preferably 1 carbon atom, substituted or unsubstituted 1 to 20 carbon atoms (preferably 1 to 12 carbon atoms, more preferably 1 to 8 carbon atoms, still more preferably carbon atoms). It represents an alkoxy group having 1 to 4 carbon atoms, particularly preferably 1 to 2 carbon atoms, and most preferably 1 carbon atom), or an amide group (—C (═O) NH 2 group). N is the number of R 1 bonded to the benzene ring and represents an integer of 0 to 4. n is preferably an integer of 0 to 3, more preferably an integer of 0 to 2, and still more preferably 0 or 1.
一般式(2)において、R2は、水素原子または炭素数2~20(好ましくは炭素数2~12、より好ましくは炭素数2~8、さらに好ましくは炭素数2~4、特に好ましくは炭素数2~3、最も好ましくは炭素数2)のアシル基を表す。なかでも、GSTP1測定用蛍光プローブとして用いられた際の脂溶性(すなわち、細胞膜透過性)が高いという観点からは、R2は炭素数2~20のアシル基であることが好ましい。
In the general formula (2), R 2 represents a hydrogen atom or 2 to 20 carbon atoms (preferably 2 to 12 carbon atoms, more preferably 2 to 8 carbon atoms, still more preferably 2 to 4 carbon atoms, particularly preferably carbon atoms). It represents an acyl group having 2 to 3, most preferably 2 carbon atoms. Among these, R 2 is preferably an acyl group having 2 to 20 carbon atoms from the viewpoint of high fat solubility (ie, cell membrane permeability) when used as a fluorescent probe for GSTP1 measurement.
一般式(2)において、X1およびX2は、それぞれ独立して、水素原子またはハロゲン原子を表す。ハロゲン原子はフッ素原子、塩素原子、臭素原子、またはヨウ素原子のいずれであってもよいが、X1および/またはX2がハロゲン原子である場合、当該ハロゲン原子はフッ素原子または塩素原子であることが好ましく、塩素原子であることが特に好ましい。また、GSTP1測定用蛍光プローブとして用いられた場合のGSTP1選択性の観点からは、X1およびX2の少なくとも一方が水素原子であることが好ましく、X1およびX2がともに水素原子であることがより好ましい。
In the general formula (2), X 1 and X 2 each independently represent a hydrogen atom or a halogen atom. The halogen atom may be a fluorine atom, a chlorine atom, a bromine atom, or an iodine atom. When X 1 and / or X 2 is a halogen atom, the halogen atom must be a fluorine atom or a chlorine atom. Is preferable, and a chlorine atom is particularly preferable. In view of GSTP1 selectivity when used as a fluorescent probe for GSTP1 measurement, it is preferable that at least one of X 1 and X 2 are hydrogen atom, it X 1 and X 2 are both hydrogen atoms Is more preferable.
本明細書において、「アルキル基」は直鎖状、分枝鎖状、環状、またはそれらの組み合わせからなるアルキル基のいずれであってもよい。R1がアルキル基である場合、その炭素数は上述したように1~20であるが、好ましくは炭素数1~12であり、より好ましくは炭素数1~8であり、さらに好ましくは炭素数1~4であり、特に好ましくは炭素数1~2(メチル基またはエチル基)であり、最も好ましくは炭素数1(メチル基)である。
In the present specification, the “alkyl group” may be any alkyl group composed of a straight chain, a branched chain, a ring, or a combination thereof. When R 1 is an alkyl group, the carbon number thereof is 1 to 20 as described above, preferably 1 to 12 carbon atoms, more preferably 1 to 8 carbon atoms, still more preferably carbon number. 1 to 4, particularly preferably 1 to 2 carbon atoms (methyl group or ethyl group), and most preferably 1 carbon atom (methyl group).
本明細書において、「アルコキシ基」は、-O-アルキル基を意味し、ここで「アルキル基」は上述した定義および好ましい形態を有する基である。
In the present specification, “alkoxy group” means —O-alkyl group, where “alkyl group” is a group having the above-mentioned definition and preferred form.
本明細書において、「アシル基」は、脂肪族アシル基または芳香族アシル基のいずれであってもよく、芳香族基を置換基として有する脂肪族アシル基であってもよい。アシル基は1個または2個以上のヘテロ原子を含んでいてもよい。例えば、アシル基としてアルキルカルボニル基(アセチル基など)、アルキルオキシカルボニル基(アセトキシカルボニル基など)、アリールカルボニル基(ベンゾイル基など)、アリールオキシカルボニル基(フェニルオキシカルボニル基など)、アラルキルカルボニル基(ベンジルカルボニル基など)、アルキルチオカルボニル基(メチルチオカルボニル基など)、アルキルアミノカルボニル基(メチルアミノカルボニル基など)、アリールチオカルボニル基(フェニルチオカルボニル基など)、またはアリールアミノカルボニル基(フェニルアミノカルボニル基など)などのアシル基が挙げられるが、これらに限定されることはない。
In the present specification, the “acyl group” may be either an aliphatic acyl group or an aromatic acyl group, or may be an aliphatic acyl group having an aromatic group as a substituent. The acyl group may contain one or more heteroatoms. For example, as an acyl group, an alkylcarbonyl group (such as an acetyl group), an alkyloxycarbonyl group (such as an acetoxycarbonyl group), an arylcarbonyl group (such as a benzoyl group), an aryloxycarbonyl group (such as a phenyloxycarbonyl group), an aralkylcarbonyl group ( Benzylcarbonyl group), alkylthiocarbonyl group (such as methylthiocarbonyl group), alkylaminocarbonyl group (such as methylaminocarbonyl group), arylthiocarbonyl group (such as phenylthiocarbonyl group), or arylaminocarbonyl group (phenylaminocarbonyl group) And the like, but is not limited thereto.
本明細書において、上述したR1としてのアルキル基やアルコキシ基、R2としてのアシル基は、任意の置換基を1個以上有していてもよい。前記置換基としては、例えば、アルコキシ基、ハロゲン原子(フッ素原子、塩素原子、臭素原子、またはヨウ素原子のいずれであってもよい)、アミノ基、モノもしくはジ置換アミノ基、置換シリル基、またはアシル基などが挙げられるが、これらに限定されることはない。上記の官能基が2個以上の置換基を有する場合には、それらは互いに同一でも異なっていてもよい。ただし、R1としてのアルキル基およびアルコキシ基は非置換のものであることが好ましく、R1が存在する場合(nが1~4の整数である場合)、当該R1は非置換のアルキル基であることが好ましい。同様に、R2としてのアシル基は非置換のものであることが好ましい。
In the present specification, the alkyl group or alkoxy group as R 1 and the acyl group as R 2 described above may have one or more arbitrary substituents. Examples of the substituent include an alkoxy group, a halogen atom (which may be a fluorine atom, a chlorine atom, a bromine atom, or an iodine atom), an amino group, a mono- or di-substituted amino group, a substituted silyl group, or Examples of the acyl group include, but are not limited to, an acyl group. When the functional group has two or more substituents, they may be the same as or different from each other. However, the alkyl group and alkoxy group as R 1 are preferably unsubstituted, and when R 1 is present (when n is an integer of 1 to 4), R 1 is an unsubstituted alkyl group. It is preferable that Similarly, the acyl group as R 2 is preferably unsubstituted.
本発明の好ましい実施形態において、一般式(2)で表される蛍光団Lを有する化合物において、上述したNO2基とEWG基との結合部位の組み合わせのうち、「2位=ニトロ(NO2)基、5位=EWG基」の組み合わせのものであることが好ましく、この際、EWG基がメシル基またはシアノ基であることがより好ましく、EWG基がメシル基であることが最も好ましい。すなわち、本発明の好ましい実施形態において、一般式(1)で表されるニトロベンゼン化合物またはその塩は、下記一般式(3):
In a preferred embodiment of the present invention, in the compound having the fluorophore L represented by the general formula (2), among the combinations of the binding sites of the NO 2 group and the EWG group described above, “2-position = nitro (NO 2 ) Group, 5-position = EWG group ”. In this case, the EWG group is more preferably a mesyl group or a cyano group, and the EWG group is most preferably a mesyl group. That is, in a preferred embodiment of the present invention, the nitrobenzene compound represented by the general formula (1) or a salt thereof is represented by the following general formula (3):

で表されるものである。なお、一般式(3)における符号の定義は、上記と同様である。
It is represented by In addition, the definition of the code | symbol in General formula (3) is the same as the above.
上記一般式(1)で表される化合物は塩として存在する場合がある。塩としては、塩基付加塩、酸付加塩、アミノ酸塩などが挙げられる。塩基付加塩としては、例えば、ナトリウム塩、カリウム塩、カルシウム塩、マグネシウム塩などの金属塩、アンモニウム塩、またはトリエチルアミン塩、ピペリジン塩、モルホリン塩などの有機アミン塩が挙げられる。また、酸付加塩としては、例えば、塩酸塩、硫酸塩、硝酸塩などの鉱酸塩、メタンスルホン酸塩、パラトルエンスルホン酸塩、クエン酸塩、シュウ酸塩などの有機酸塩が挙げられる。アミノ酸塩としてはグリシン塩などが例示されうる。ただし、本発明に係る化合物の塩はこれらに限定されることはない。
The compound represented by the general formula (1) may exist as a salt. Examples of the salt include base addition salts, acid addition salts, amino acid salts and the like. Examples of the base addition salt include metal salts such as sodium salt, potassium salt, calcium salt, and magnesium salt, ammonium salts, and organic amine salts such as triethylamine salt, piperidine salt, and morpholine salt. Examples of the acid addition salt include mineral acid salts such as hydrochloride, sulfate, and nitrate, and organic acid salts such as methanesulfonate, paratoluenesulfonate, citrate, and oxalate. Examples of amino acid salts include glycine salts. However, the salt of the compound according to the present invention is not limited to these.
一般式(1)で表される本発明の化合物は、置換基の種類に応じて1個または2個以上の不斉炭素を有する場合があり、エナンチオマーまたはジアステレオマーなどの立体異性体が存在する場合がある。純粋な形態の立体異性体、立体異性体の任意の混合物、ラセミ体などはいずれも本発明の範囲に包含される。
The compound of the present invention represented by the general formula (1) may have one or more asymmetric carbons depending on the type of substituent, and there are stereoisomers such as enantiomers or diastereomers. There is a case. Pure forms of stereoisomers, any mixture of stereoisomers, racemates, and the like are all within the scope of the present invention.
一般式(1)で表される本発明の化合物またはその塩は、水和物または溶媒和物として存在する場合もあるが、これらの物質はいずれも本発明の技術的範囲に包含される。溶媒和物を形成する溶媒の種類は特に限定されないが、例えば、エタノール、アセトン、イソプロパノールなどの溶媒が挙げられる。
The compound of the present invention represented by the general formula (1) or a salt thereof may exist as a hydrate or a solvate, and any of these substances is included in the technical scope of the present invention. Although the kind of solvent which forms a solvate is not specifically limited, For example, solvents, such as ethanol, acetone, isopropanol, are mentioned.
なお、本発明に係るニトロベンゼン化合物またはその塩は、生体内環境であるpH7.4(好ましくはpH7.0~8.0)の条件下において非イオン性の状態で存在するものであることが好ましい。このような条件を満たす化合物であれば、細胞膜透過性に特に優れることから、後述するような生細胞に対して用いられる蛍光プローブとして特に有用である。
The nitrobenzene compound or a salt thereof according to the present invention is preferably present in a nonionic state under the condition of pH 7.4 (preferably pH 7.0 to 8.0) which is an in vivo environment. . A compound satisfying such conditions is particularly useful as a fluorescent probe used for living cells as described later because it is particularly excellent in cell membrane permeability.
一般式(1)で表される本発明の化合物は、例えば、従来公知の文献(J Am Chem Soc. 2008, 130(44):14533-14543(非特許文献1))に記載の手法を参照しつつ、合成することが可能である。また、本明細書の実施例の欄には、一般式(1)で表される本発明の化合物に包含される代表的化合物についての製造方法が具体的に示されており、当業者は本明細書の開示を参照し、また、必要に応じて本願出願時の技術常識を参酌することで出発原料や試薬、反応条件などを適宜選択することにより、一般式(1)に包含される任意の化合物を容易に製造することができる。
For the compound of the present invention represented by the general formula (1), for example, refer to a method described in a conventionally known document (J Am Chem Soc. 2008, 130 (44): 14533-14543 (Non-patent Document 1)). However, it is possible to synthesize. In addition, in the Examples column of this specification, production methods for typical compounds included in the compound of the present invention represented by the general formula (1) are specifically shown. Any one included in the general formula (1) can be selected by appropriately selecting starting materials, reagents, reaction conditions and the like by referring to the disclosure of the specification and taking into account technical common sense at the time of filing the application as necessary. This compound can be easily produced.
一般式(1)で表される本発明の化合物は、グルタチオン-S-トランスフェラーゼ(GST)P1測定用の蛍光プローブとして使用することができる。本発明の化合物は、中性領域(例えばpH5~9の範囲)では実質的に無蛍光である。一方、還元型グルタチオン(GSH)およびグルタチオン-S-トランスフェラーゼ(GST)P1の存在下では、本発明の化合物におけるベンゼン環(の2位または4位)に結合しているニトロ基(-NO2基)が脱離するとともにこの位置がグルタチオン化され、強蛍光性の化合物となる。例えば、一般式(1)で表される化合物またはその塩は、中性領域において例えば490nm程度の励起光を照射した場合にはほとんど蛍光を発しないが、上記のようにグルタチオン化された化合物は同じ条件下において極めて強い蛍光(例えば、蛍光波長510nm)を発する性質を有している。そして、この反応はGSTP1のみに対して選択的に起こり、他のGST分子種が存在してもこの反応は進行しない。したがって、本発明の化合物をGSTP1測定用の蛍光プローブとして使用することにより、GSTP1の存在を、蛍光強度の変化に基づいて選択的に測定することが可能になる。なお、一般に「蛍光プローブ」とは、特定のタンパク質、細胞、または組織などに特異的に結合または分布して蛍光を発することにより、特定のタンパク質、細胞、または組織の観察を容易にすることができる物質を意味する。通常、「蛍光プローブ」といった場合は、その物質自体が蛍光を発する物質をいうが、本発明では、それ自体蛍光を発しないが、分解などにより蛍光を発するようになる前駆物質もまた、「蛍光プローブ」の概念に含まれるものとする。
The compound of the present invention represented by the general formula (1) can be used as a fluorescent probe for measuring glutathione-S-transferase (GST) P1. The compounds of the present invention are substantially non-fluorescent in the neutral region (eg, in the range of pH 5-9). On the other hand, in the presence of reduced glutathione (GSH) and glutathione-S-transferase (GST) P1, the nitro group (—NO 2 group) bonded to the benzene ring (the 2-position or 4-position) of the compound of the present invention. ) Is desorbed and glutathione is converted to a strong fluorescent compound at this position. For example, the compound represented by the general formula (1) or a salt thereof hardly emits fluorescence when irradiated with excitation light of, for example, about 490 nm in the neutral region, but the compound that is glutathione as described above is It has the property of emitting extremely intense fluorescence (for example, fluorescence wavelength 510 nm) under the same conditions. This reaction occurs selectively only with respect to GSTP1, and this reaction does not proceed even if other GST molecular species are present. Therefore, by using the compound of the present invention as a fluorescent probe for GSTP1 measurement, the presence of GSTP1 can be selectively measured based on the change in fluorescence intensity. In general, a “fluorescent probe” refers to facilitating observation of a specific protein, cell, or tissue by specifically binding or distributing to a specific protein, cell, or tissue and emitting fluorescence. It means a substance that can be made. In general, the term “fluorescent probe” refers to a substance that emits fluorescence, but in the present invention, a precursor that does not emit fluorescence itself but becomes fluorescent due to decomposition or the like is also referred to as “fluorescence probe”. It shall be included in the concept of “probe”.
ここで、GSTP1は、前立腺がんを除くほぼ全てのがん細胞で過剰発現していることが知られている。このため、本発明に係るGSTP1測定用蛍光プローブを用いてGSTP1の過剰発現を捉えることにより、がん細胞を検出することが可能である。例えば、GSTP1の活性を検出可能な本発明に係る蛍光プローブを生検組織に塗布することでGSTP1活性を指標としたがんの有無の評価が可能である。すなわち、本発明に係るGSTP1測定用蛍光プローブは、がん細胞検出用のプローブとして利用可能であり、がん細胞またはがん組織の検出用組成物のほか、がん診断用組成物やがん診断用キットにおいて、さらにはがんの検出、判定、または診断方法においても使用することができる。なお、がんの検出、判定、または診断方法はin vitroで行われる方法であってもよいし、ex vivoまたはin vivoで行われる方法であってもよい。
Here, it is known that GSTP1 is overexpressed in almost all cancer cells except prostate cancer. For this reason, it is possible to detect cancer cells by capturing the overexpression of GSTP1 using the fluorescent probe for measuring GSTP1 according to the present invention. For example, it is possible to evaluate the presence or absence of cancer using GSTP1 activity as an index by applying a fluorescent probe according to the present invention capable of detecting GSTP1 activity to a biopsy tissue. That is, the fluorescent probe for measuring GSTP1 according to the present invention can be used as a probe for detecting cancer cells. In addition to a composition for detecting cancer cells or cancer tissue, a composition for cancer diagnosis or cancer It can also be used in diagnostic kits, and in cancer detection, determination, or diagnostic methods. The cancer detection, determination, or diagnosis method may be a method performed in vitro, or a method performed ex vivo or in vivo.
本発明に係る化合物、蛍光プローブ、または検出もしくは診断用組成物は、プレパラート、ガラスボトムディッシュやスライドガラス、マルチウェルプレートなど、生体イメージングの手法において一般的に用いられる観察容器に保持した生体試料に対して作用させることができるが、国際公開第2011/149032号パンフレットなどに記載の生体試料固定装置に保持した生体試料に対して作用させることもできる。すなわち、本発明の他の形態によれば、本発明に係る化合物、蛍光プローブまたは検出もしくは診断用組成物、並びに生体試料固定装置を含むがん診断用キットが提供される。保持された生体試料に対して、本発明に係る化合物、蛍光プローブ、あるいは検出もしくは診断用組成物、またはその溶液を加えることにより接触させ、所定の時間インキュベートした後に、蛍光顕微鏡やマイクロプレートリーダーを用いて励起光を生体試料に照射し、生じた蛍光を検出することができ、これを通じて蛍光を発する細胞をがん細胞と判定することができる。本発明では、試料の取得の容易性の観点から、生体試料の好ましい一例は血液であり、この場合において好ましくは、血液から得られた細胞群である。がんを患う患者から採取された血液の細胞群には、大量の血球細胞および少数のがん細胞が含まれているが、本発明に係る化合物、蛍光プローブ、または検出もしくは診断用組成物を用いることにより、大量の細胞の中からがん細胞を精度よく検出することが可能になる。これにより、被験者の血液細胞中にがん細胞が存在した場合には、当該被験者ががんを患っていると判定または診断することができる。別法では、インキュベート後に、フローサイトメトリーや蛍光顕微鏡による画像取得とそれに続くマイクロピペットによる細胞分取技法を用いて、がん細胞数の計測およびがん細胞の取得を行うこともできる。被験者の血液細胞中のがん細胞数を計測することにより、CTなどの画像診断では発見不可能な微小な固形がんの存在を診断することが可能となり、これによりがんの早期診断も可能になる。さらに、被験者の所定体積の血液中の血液細胞におけるがん細胞数を一定期間ごとに計測することにより、被験者に対する外科手術、放射線治療などによる局所治療、または化学療法などによる全身治療、または分子標的薬の投与などによる治療の効果を判定することが可能となる。また、被験者の血液細胞中のがん細胞を検出後、取得することにより、がん細胞に対して別途解析手法を適用することが可能となり、遺伝子解析、発現解析、局在解析などの性状解析が可能となる。なお、生体試料の由来は血液に特に制限されず、血液以外の生体由来の試料であってもよいし、非生体由来の試料であってもよい。血液以外の生体由来の試料の種類は特に制限されないが、例えば、リンパ液、髄液その他の体液;細胞抽出物(ホモジネート)などが挙げられる。
The compound, fluorescent probe, or detection or diagnostic composition according to the present invention is applied to a biological sample held in an observation container generally used in a biological imaging technique such as a preparation, a glass bottom dish, a slide glass, or a multiwell plate. Although it can be made to act on, it can also be made to act on the biological sample held in the biological sample fixing device described in International Publication No. 2011/149032 pamphlet or the like. That is, according to another aspect of the present invention, there is provided a cancer diagnostic kit including the compound according to the present invention, a fluorescent probe or a detection or diagnostic composition, and a biological sample fixing device. The held biological sample is brought into contact by adding the compound according to the present invention, a fluorescent probe, a detection or diagnostic composition, or a solution thereof, and incubated for a predetermined time, and then a fluorescence microscope or a microplate reader is used. It is possible to irradiate a biological sample with excitation light and detect the generated fluorescence, and through this, a cell emitting fluorescence can be determined as a cancer cell. In the present invention, from the viewpoint of easy sample acquisition, a preferred example of the biological sample is blood, and in this case, a group of cells obtained from blood is preferable. A group of blood cells collected from a patient suffering from cancer contains a large amount of blood cells and a small number of cancer cells, but the compound, fluorescent probe, or detection or diagnostic composition according to the present invention is used. By using it, cancer cells can be accurately detected from a large number of cells. Thereby, when a cancer cell exists in a test subject's blood cell, it can determine or diagnose that the said test subject has cancer. Alternatively, after incubation, the number of cancer cells and the acquisition of cancer cells can be performed using image acquisition by flow cytometry or fluorescence microscopy, followed by cell sorting using a micropipette. By measuring the number of cancer cells in a subject's blood cells, it is possible to diagnose the presence of minute solid cancers that cannot be detected by diagnostic imaging such as CT, thereby enabling early diagnosis of cancer. become. Furthermore, by measuring the number of cancer cells in blood cells in a predetermined volume of blood for each subject over a period of time, local treatment such as surgery, radiation therapy, etc. for the subject, systemic treatment such as chemotherapy, or molecular target It becomes possible to determine the effect of treatment such as administration of a drug. In addition, by detecting cancer cells in the blood cells of a subject and obtaining them, it becomes possible to apply a separate analysis method to the cancer cells and analyze properties such as gene analysis, expression analysis, and localization analysis. Is possible. The origin of the biological sample is not particularly limited to blood, and it may be a biological sample other than blood or a non-biological sample. The kind of the sample derived from a living body other than blood is not particularly limited, and examples thereof include lymph, cerebrospinal fluid and other body fluids; cell extract (homogenate) and the like.
本発明に係るがん細胞またはがん組織の検出用組成物、並びにがん診断用組成物は、生体イメージングの他に、手術または検査において、手術もしくは検査前または手術もしくは検査中に本発明に係るがん細胞またはがん組織の検出用組成物を非経口投与することにより適用するか、または肉眼下または鏡視下における手術野の一部または全体に本発明に係る組成物を噴霧、塗布または注入などの方法により適用し、数十秒から数分後に励起光を適用部位に照射することにより、がん細胞またはがん組織を検出するために用いられてもよい。本発明に係る検出用または診断用組成物が適用された部位にがん組織が含まれる場合には、その組織が蛍光を発することから、その蛍光を発している部位ががん組織であると特定することができ、そこを含めた周囲組織と共に切除をすることが可能になる。ここで、「手術」とは、例えば開創を伴う開頭手術、開胸手術、もしくは開腹手術、または皮膚手術などのほか、胃内視鏡、大腸内視鏡、腹腔鏡、または胸腔鏡などの鏡視下手術などを含めて、がんの治療のために適用される任意の手術を包含する。これにより、がんを切除する外科治療において、がんの形態や触覚に頼って決定されていたがん組織の範囲を、より明確に精度良く決定することができ、切除範囲の確定が容易になる。また、「検査」の用語は、胃内視鏡や大腸内視鏡などの内視鏡を用いた検査、および検査に伴う切除や採取などの処置のほか、生体から分離・採取された組織に対して行う検査などを包含する。内視鏡を用いた検査に用いた場合、がん組織が蛍光を発することにより、がん組織の特定が極めて容易になる。内視鏡検査においてがん組織が確認できた場合には、その組織について検査切除や治療的な切除を行うこともできる。手術や検査といった用語は最も広義に解釈しなければならず、いかなる意味においても限定的に解釈してはならない。
The composition for detecting cancer cells or cancer tissue and the composition for cancer diagnosis according to the present invention is applied to the present invention in addition to in vivo imaging, in surgery or examination, before surgery or examination, or during surgery or examination. The composition for detecting cancer cells or cancer tissue is applied by parenteral administration, or the composition according to the present invention is sprayed or applied to a part or the whole of the surgical field under the naked eye or under the microscope. Alternatively, it may be used for detecting cancer cells or cancer tissue by applying by a method such as injection and irradiating the application site with excitation light after several tens of seconds to several minutes. When cancer tissue is contained in the site to which the detection or diagnostic composition according to the present invention is applied, the tissue emits fluorescence. Therefore, the site emitting the fluorescence is cancer tissue. It can be identified, and it can be excised with the surrounding tissue including it. Here, “surgery” refers to, for example, a craniotomy, a thoracotomy, a laparotomy, or a skin operation with a wound, and a mirror such as a gastroscope, a colonoscope, a laparoscope, or a thoracoscope Includes any surgery applied for the treatment of cancer, including visual surgery. This makes it possible to more clearly and accurately determine the range of cancer tissue that has been determined by relying on the morphology and tactile sensation of the cancer in surgical treatment to remove the cancer, making it easy to determine the extent of the removal. Become. The term “examination” refers to examinations using endoscopes such as gastroscopy and colonoscopy, and procedures such as excision and collection associated with examinations, as well as to tissues separated and collected from living organisms. This includes inspections that are performed on these. When used in an examination using an endoscope, the cancer tissue emits fluorescence, so that the cancer tissue can be identified extremely easily. When a cancer tissue can be confirmed by endoscopy, it can be subjected to examination resection or therapeutic resection. Terms such as surgery and examination must be interpreted in the broadest sense and not in any way limited.
本発明に係るがん細胞またはがん組織の検出用組成物、並びにがん診断用組成物の適用濃度は、特に限定されないが、がん組織の存在が疑われる組織に対して、例えば、1~1000μM程度の濃度の溶液を適用することができる。組成物のpHについては、例えばpH7.0~7.5の範囲で使用することが好ましい。本発明の検出用組成物及び診断用組成物としては、上述した本発明に係る化合物(またはその塩)をそのまま用いてもよいが、必要に応じて、試薬の調製に通常用いられる添加剤を配合してもよい。例えば生理的環境で試薬を用いるための添加剤として、溶解補助剤、pH調整剤、緩衝剤、等張化剤などの添加剤を用いることができ、これらの配合量は当業者に適宜選択可能である。これらの組成物は、一般的には粉末形態の混合物、凍結乾燥物、顆粒、錠剤、液剤など任意の形態の組成物として提供されるが、使用時に注射用滅菌水や、適宜の緩衝液に溶解して適用すればよい。
The application concentration of the composition for detecting cancer cells or cancer tissue and the composition for cancer diagnosis according to the present invention is not particularly limited. A solution having a concentration of about 1000 μM can be applied. The pH of the composition is preferably used in the range of, for example, pH 7.0 to 7.5. As the detection composition and diagnostic composition of the present invention, the above-described compound (or a salt thereof) according to the present invention may be used as it is. However, if necessary, additives usually used for the preparation of reagents are used. You may mix | blend. For example, additives such as solubilizers, pH adjusters, buffers, and isotonic agents can be used as additives for using the reagent in a physiological environment, and the amount of these can be selected as appropriate by those skilled in the art. It is. These compositions are generally provided as a composition in any form such as a mixture in powder form, a lyophilized product, granules, tablets, liquids, etc., but it is used in sterile water for injection or an appropriate buffer at the time of use. What is necessary is just to melt | dissolve and apply.
本発明の他の形態によれば、本発明に係る化合物、蛍光プローブ、または検出用もしくは診断用組成物を用いたがん細胞またはがん組織の検出方法が提供される。当該検出方法では、本発明に係る化合物、蛍光プローブ、または検出もしくは診断用組成物を、細胞または組織に適用し、適用後の細胞または組織に対して所定の励起光を照射することにより、細胞または組織における蛍光を検出することを含む。好ましくはかかる方法は、血液中におけるがん細胞を検出する方法であり、その場合、血液中の細胞は、プレパラートなどの観察容器に固定されていてもよいし、上で説明した生体試料固定装置により固定された診断チップであってもよい。一方で、このような検出方法を、生体の組織に適用して、手術時におけるがん組織の確定診断に用いることもできる。その場合の適用方法としては、細胞または組織に対して噴霧または塗布することにより適用してもよいし、注射や輸液により適用されてもよい。
According to another aspect of the present invention, there is provided a method for detecting cancer cells or cancer tissues using the compound, fluorescent probe, or detection or diagnostic composition according to the present invention. In the detection method, the compound, the fluorescent probe, or the detection or diagnostic composition according to the present invention is applied to the cell or tissue, and the cell or tissue after application is irradiated with a predetermined excitation light, thereby Or detecting fluorescence in the tissue. Preferably, such a method is a method for detecting cancer cells in the blood, in which case the cells in the blood may be fixed to an observation container such as a preparation, or the biological sample fixing apparatus described above. It may be a diagnostic chip fixed by. On the other hand, such a detection method can be applied to a living tissue and used for a definitive diagnosis of cancer tissue at the time of surgery. As an application method in that case, it may be applied by spraying or applying to cells or tissues, or may be applied by injection or infusion.
本発明のさらに他の形態によれば、本発明に係るがん細胞またはがん組織の検出方法を用いて、がんの切除領域を決定し、当該領域を切除する工程を含む、手術・治療方法に関してもよい。
According to still another aspect of the present invention, surgery / treatment including the steps of determining a cancer excision region using the cancer cell or cancer tissue detection method according to the present invention and excising the region. It may be related to the method.
本発明に係るがん細胞の検出方法は、がんの判定または診断方法に用いることができる。すなわち、本発明に係るがん細胞の検出方法により、指標となる蛍光よりも高い蛍光が検出された場合に、がんが存在すると判定または診断することができる。ここで、判定方法とは、指標との比較をすることにより、医師をはじめとした医療従事者による判断を含まずに特定する方法をいう。例えば指標となる蛍光として、蛍光を有する細胞を選択することができ、この場合、蛍光を有する細胞が検出された場合に、対象ががんを有すると決定することができる。別の形態では、蛍光強度や蛍光を有する細胞の数を指標とすることにより、がんの重篤度を判定することもできる。
The cancer cell detection method according to the present invention can be used in a cancer determination or diagnosis method. That is, when the method for detecting cancer cells according to the present invention detects fluorescence higher than the fluorescence serving as an index, it can be determined or diagnosed that cancer is present. Here, the determination method refers to a method of specifying without including a determination by a medical worker including a doctor by comparing with an index. For example, a fluorescence cell can be selected as the fluorescence serving as an index. In this case, when a fluorescence cell is detected, it can be determined that the subject has cancer. In another embodiment, the severity of cancer can be determined by using the fluorescence intensity or the number of cells having fluorescence as an index.
本明細書において、「がん組織」の用語はがん細胞を含む任意の組織を意味している。「組織」の用語は、臓器の一部または全体を含めて最も広義に解釈することができ、いかなる意味においても限定的に解釈してはならない。本発明に係るがん診断薬は、がん組織において特異的に強発現しているGSTP1の活性を検出する作用を有していることから、がん組織の中でも、GSTP1を高発現している組織が好ましく、このようながん組織は、前立腺がんの組織を除くほとんどのがん組織である。がんの例としては、例えば、大腸がん、乳がん、肺がん、食道がん、胃がん、肝臓がん、胆道がん、脾臓がん、腎がん、膀胱がん、子宮がん、卵巣がん、精巣がん、甲状腺がん、膵臓がん、脳腫瘍、造血器腫瘍などが挙げられるが、これらのがん種に限定されることを意図するものではない。また、後述する実施例の欄において実証されているように、本発明に係る蛍光プローブを用いることで、GSTP1遺伝子のプロモーター領域の脱メチル化に基づくGSTP1タンパク質発現の有無を検出することが可能である。ここで、正常上皮細胞においてはGSTP1が発現しているが、がん化によってGSTP1遺伝子のプロモーター領域のCpG部分がメチル化されることでGSTP1の発現が見られなくなることが知られている。したがって、本発明に係る蛍光プローブをそのような系へ適用することができれば、蛍光の有無を指標として、前立腺がん細胞(GSTP1が過剰発現していない)の検出を行うことも可能である。
In this specification, the term “cancer tissue” means any tissue containing cancer cells. The term “tissue” can be interpreted in the broadest sense, including part or all of an organ, and should not be limitedly interpreted in any way. Since the cancer diagnostic agent according to the present invention has an action of detecting the activity of GSTP1 that is specifically strongly expressed in cancer tissues, it highly expresses GSTP1 among cancer tissues. Tissues are preferred, and such cancer tissues are most cancer tissues except prostate cancer tissues. Examples of cancer include, for example, colorectal cancer, breast cancer, lung cancer, esophageal cancer, stomach cancer, liver cancer, biliary tract cancer, spleen cancer, kidney cancer, bladder cancer, uterine cancer, and ovarian cancer. Testicular cancer, thyroid cancer, pancreatic cancer, brain tumor, hematopoietic tumor, and the like, but are not intended to be limited to these cancer types. Further, as demonstrated in the Examples section described later, by using the fluorescent probe according to the present invention, it is possible to detect the presence or absence of GSTP1 protein expression based on demethylation of the promoter region of the GSTP1 gene. is there. Here, although GSTP1 is expressed in normal epithelial cells, it is known that the expression of GSTP1 is not observed when the CpG part of the promoter region of the GSTP1 gene is methylated by canceration. Therefore, if the fluorescent probe according to the present invention can be applied to such a system, it is also possible to detect prostate cancer cells (GSTP1 is not overexpressed) using the presence or absence of fluorescence as an index.
以下、実施例を用いて本発明の好ましい実施形態についてより詳細に説明するが、本発明の技術的範囲が下記の実施例によって限定されるわけではない。
Hereinafter, preferred embodiments of the present invention will be described in more detail using examples, but the technical scope of the present invention is not limited by the following examples.
[GSTP1選択的な基質の探索]
本実験では、GSTP1選択的な蛍光プローブを構築するにあたり、いくつかのニトロベンゼン誘導体を対象として、GSTP1選択的な基質を探索した。 [Search for GSTP1-selective substrate]
In this experiment, in constructing a GSTP1-selective fluorescent probe, GSTP1-selective substrates were searched for several nitrobenzene derivatives.
本実験では、GSTP1選択的な蛍光プローブを構築するにあたり、いくつかのニトロベンゼン誘導体を対象として、GSTP1選択的な基質を探索した。 [Search for GSTP1-selective substrate]
In this experiment, in constructing a GSTP1-selective fluorescent probe, GSTP1-selective substrates were searched for several nitrobenzene derivatives.
ここで、上述したようにヒトの細胞質型GSTにはAlpha、Mu、Piなど7種類のクラスが存在するが、本実験ではこれらのうち生体内の発現量が多く論文としても多くの報告があるGSTA1、GSTM1、GSTP1の3種類の細胞質型GSTを用いてアッセイを行うことにより、各種ニトロベンゼン誘導体のGSTの基質としての反応性および選択性を評価した。非特許文献1では、ニトロベンゼン誘導体においてニトロ基(高い電子求引性を有する)がグルタチオン(弱い電子供与性を有する)へと置換されると吸収スペクトルが大きく変化することを利用して、アッセイを行っている。ここではまず、非特許文献1と同様の手法を用いて、非特許文献1で提案されているGST活性検出蛍光プローブ(DNAT-Me)のGST基質部位である以下の化合物(A)(3,4-ジニトロベンズアニリド(3,4-NNBA))を基準物質として合成した。また、合成原料を変更することにより、化合物(A)と同様の手法により以下の化合物(B)~(G)を合成した。
Here, as described above, human cytoplasmic GST has seven classes such as Alpha, Mu, Pi, etc., but in this experiment, there are many reports in the paper because of the high expression level in vivo. The reactivity and selectivity of various nitrobenzene derivatives as GST substrates were evaluated by performing assays using three types of cytoplasmic GSTs, GSTA1, GSTM1, and GSTP1. In Non-Patent Document 1, an assay is performed using the fact that an absorption spectrum changes greatly when a nitro group (having high electron withdrawing property) is replaced with glutathione (having weak electron donating property) in a nitrobenzene derivative. Is going. Here, first, the following compound (A) (3, which is the GST substrate site of the GST activity detection fluorescent probe (DNAT-Me) proposed in Non-Patent Document 1 is used using the same method as in Non-Patent Document 1. 4-Dinitrobenzanilide (3,4-NNBA)) was synthesized as a reference substance. Further, the following compounds (B) to (G) were synthesized in the same manner as the compound (A) by changing the synthesis raw material.
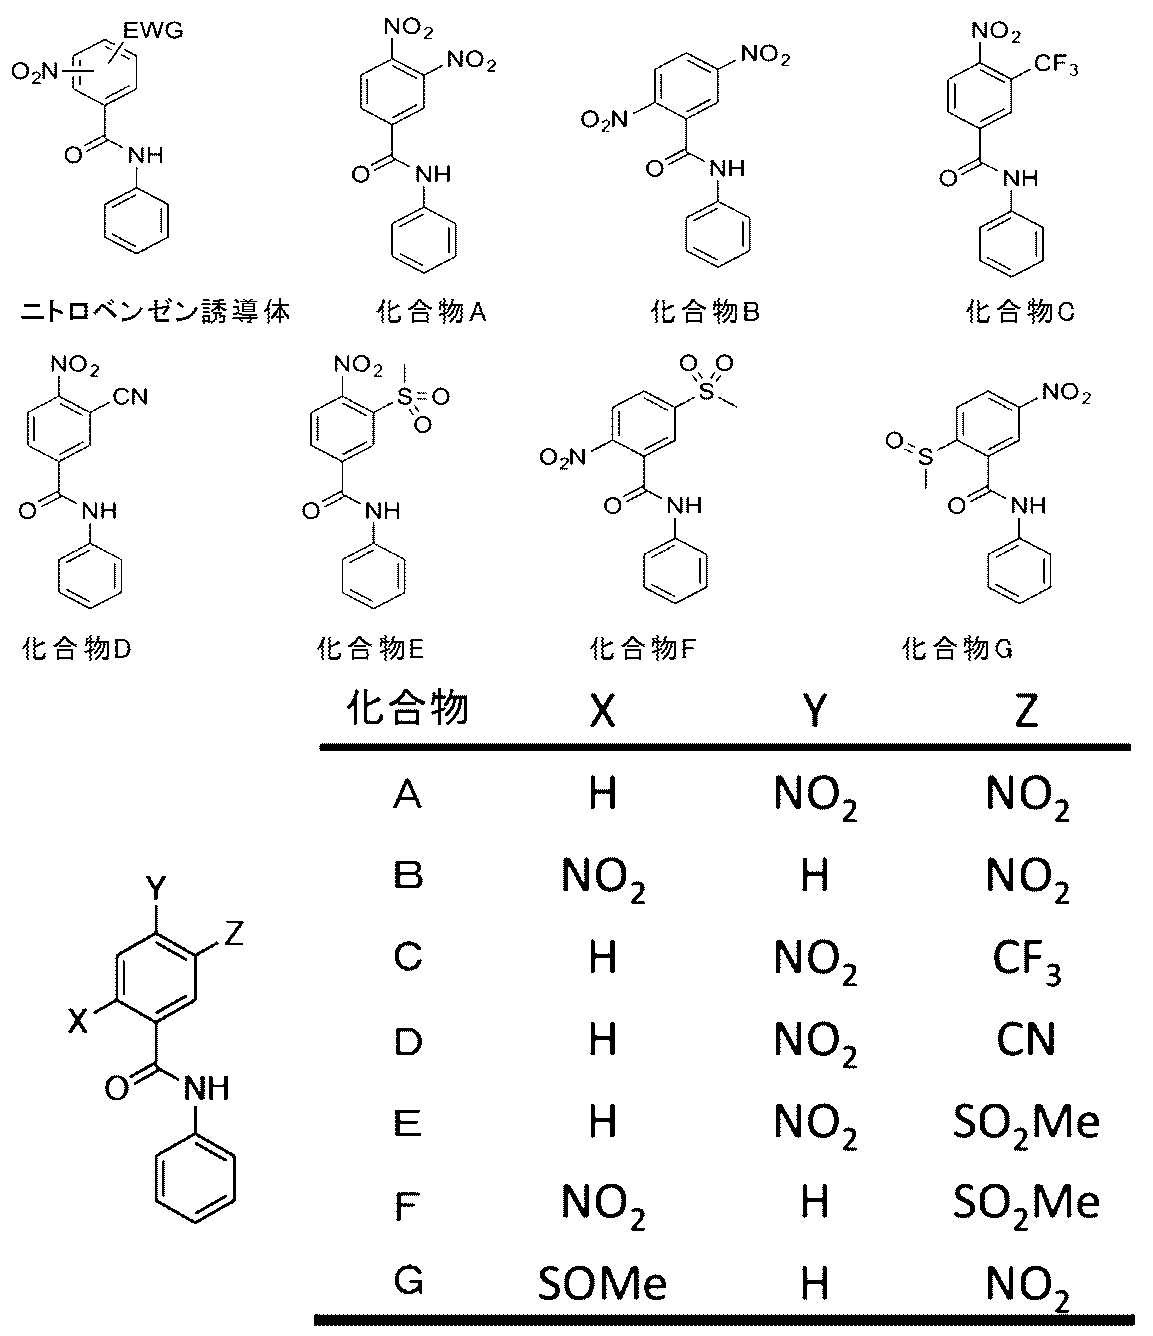
なお、ここでは、安息香酸誘導体を出発物質とした、化合物(F)の合成スキーム(下記の反応スキーム1)、化合物(G)の合成スキーム(下記の反応スキーム2)、および化合物(D)の合成スキーム(下記の反応スキーム3)について説明する。その後、化合物(B)および化合物(C)の合成方法についても、説明する。
Note that here, a synthesis scheme of the compound (F) (the following reaction scheme 1), a synthesis scheme of the compound (G) (the following reaction scheme 2), and a compound (D) using a benzoic acid derivative as a starting material. A synthesis scheme (the following reaction scheme 3) will be described. Then, the synthesis | combining method of a compound (B) and a compound (C) is also demonstrated.
[反応スキーム1]
[Reaction scheme 1]

(化合物(a)の合成;5-メチルチオ-2-ニトロ安息香酸)
5-フルオロ-2-ニトロ安息香酸(305mg,1.7mmol),ナトリウムメタンチオラート(620mg,8.8mmol)をイソプロパノール(10mL)に懸濁し、室温で30分間撹拌した。反応溶液に1N HClを加えて反応を止め、酢酸エチルで分液し、1N HClで2回、飽和食塩水で1回洗浄した。有機層を無水硫酸マグネシウムで乾燥させ、酢酸エチルを減圧下留去した。酢酸エチル-ヘキサンで再結晶させて、目的化合物を得た(246mg,収率70%)。 (Synthesis of compound (a); 5-methylthio-2-nitrobenzoic acid)
5-Fluoro-2-nitrobenzoic acid (305 mg, 1.7 mmol) and sodium methanethiolate (620 mg, 8.8 mmol) were suspended in isopropanol (10 mL) and stirred at room temperature for 30 minutes. 1N HCl was added to the reaction solution to stop the reaction, and the mixture was partitioned with ethyl acetate, washed twice with 1N HCl and once with saturated brine. The organic layer was dried over anhydrous magnesium sulfate, and ethyl acetate was distilled off under reduced pressure. Recrystallization from ethyl acetate-hexane gave the target compound (246 mg, yield 70%).
(化合物(a)の機器データ)
1H-NMR(400MHz,Acetone-d6)δ:7.96(1H,dd,J=7.5,1.6Hz),7.58-7.56(2H,m),2.65(3H,s)
13C-NMR(100MHz,Acetone-d6)δ:166.5,148.5,145.1,130.0,127.9,125.9,125.4,14.7。 (Equipment data of compound (a))
1 H-NMR (400 MHz, Acetone-d 6 ) δ: 7.96 (1H, dd, J = 7.5, 1.6 Hz), 7.58-7.56 (2H, m), 2.65 ( 3H, s)
13 C-NMR (100 MHz, Acetone-d 6 ) δ: 166.5, 148.5, 145.1, 130.0, 127.9, 125.9, 125.4, 14.7.
(化合物(b)の合成;5-メシル-2-ニトロ安息香酸)
5-メチルチオ-2-ニトロ安息香酸(a)(97mg,0.47mmol),30% H2O2(4mL,39mmol)をアセトニトリル(4mL)に懸濁し、泡が出るまでリン酸三カリウムを加え、室温で20分間撹拌した。反応溶液に酢酸エチルを加え、1N HClで2回、飽和食塩水で1回洗浄した。有機層を無水硫酸マグネシウムで乾燥させ、酢酸エチルを減圧下留去した。酢酸エチル-ヘキサンで再結晶させて、目的化合物を得た(79mg,収率68%)。 (Synthesis of Compound (b); 5-Mesyl-2-nitrobenzoic acid)
5-Methylthio-2-nitrobenzoic acid (a) (97 mg, 0.47 mmol), 30% H 2 O 2 (4 mL, 39 mmol) is suspended in acetonitrile (4 mL), and tripotassium phosphate is added until bubbles appear. And stirred for 20 minutes at room temperature. Ethyl acetate was added to the reaction solution, and the mixture was washed twice with 1N HCl and once with saturated brine. The organic layer was dried over anhydrous magnesium sulfate, and ethyl acetate was distilled off under reduced pressure. Recrystallization from ethyl acetate-hexane gave the target compound (79 mg, yield 68%).
(化合物(b)の機器データ)
1H-NMR(400MHz,Acetone-d6)δ:8.47(1H,d,J=2.3Hz),8.38(1H,dd,J=8.5,2.1Hz),8.20(1H,d,J=8.2Hz),3.32(3H,s)
13C-NMR(100MHz,Acetone-d6)δ:164.3,152.9,145.5,133.0,130.7,128.0,125.9,43.9
LRMS(EI+);246。 (Equipment data of compound (b))
1 H-NMR (400 MHz, Acetone-d 6 ) δ: 8.47 (1H, d, J = 2.3 Hz), 8.38 (1H, dd, J = 8.5, 2.1 Hz), 8. 20 (1H, d, J = 8.2 Hz), 3.32 (3H, s)
13 C-NMR (100 MHz, Acetone-d 6 ) δ: 164.3, 152.9, 145.5, 133.0, 130.7, 128.0, 125.9, 43.9
LRMS (EI <+> ); 246.
(化合物(F)の合成;5-メシル-2-ニトロ安息香酸アニリド)
5-メシル-2-ニトロ安息香酸(b)(27mg,0.11mmol),WSCD・HCl(50mg,0.26mmol),アニリン(15.2μL,0.17mmol)をアセトニトリル(5mL)に懸濁し、室温で15分間撹拌した。反応溶液に酢酸エチルを加え、0.1N HClで2回、飽和食塩水で1回洗浄した。有機層を無水硫酸マグネシウムで乾燥させ、酢酸エチルを減圧下留去した。酢酸エチル-ヘキサンで再結晶させて、目的化合物を得た(21mg,収率58%)。 (Synthesis of Compound (F); 5-Mesyl-2-nitrobenzoic acid anilide)
5-mesyl-2-nitrobenzoic acid (b) (27 mg, 0.11 mmol), WSCD · HCl (50 mg, 0.26 mmol), aniline (15.2 μL, 0.17 mmol) were suspended in acetonitrile (5 mL), Stir at room temperature for 15 minutes. Ethyl acetate was added to the reaction solution, which was washed twice with 0.1N HCl and once with saturated brine. The organic layer was dried over anhydrous magnesium sulfate, and ethyl acetate was distilled off under reduced pressure. Recrystallization from ethyl acetate-hexane gave the target compound (21 mg, yield 58%).
(化合物(F)の機器データ)
1H-NMR(400MHz,Acetone-d6)δ:8.36-8.29(3H,m),7.74(2H,d,J=8.2Hz),7.38(2H,t,J=7.5Hz),7.16(2H,t,J=7.3Hz),3.32(3H,s)
13C-NMR(100MHz,Acetone-d6)δ:163.2,151.1,146.1,139.5,134.3,130.9,129.7,129.1,126.4,125.3,120.7,43.8
HRMS(ESI-TOF)m/z calcd for C14H12N2O5SNa[M+Na]+:323.0367,found:343.0367(+0.0mmu)。 (Equipment data of compound (F))
1 H-NMR (400 MHz, Acetone-d 6 ) δ: 8.36-8.29 (3H, m), 7.74 (2H, d, J = 8.2 Hz), 7.38 (2H, t, J = 7.5 Hz), 7.16 (2H, t, J = 7.3 Hz), 3.32 (3H, s)
13 C-NMR (100 MHz, Acetone-d 6 ) δ: 163.2, 151.1, 146.1, 139.5, 134.3, 130.9, 129.7, 129.1, 126.4 125.3, 120.7, 43.8
HRMS (ESI-TOF) m / z calcd for C 14 H 12 N 2O 5 SNa [M + Na] +: 323.0367, found: 343.0367 (+ 0.0mmu).
1H-NMR(400MHz,Acetone-d6)δ:8.36-8.29(3H,m),7.74(2H,d,J=8.2Hz),7.38(2H,t,J=7.5Hz),7.16(2H,t,J=7.3Hz),3.32(3H,s)
13C-NMR(100MHz,Acetone-d6)δ:163.2,151.1,146.1,139.5,134.3,130.9,129.7,129.1,126.4,125.3,120.7,43.8
HRMS(ESI-TOF)m/z calcd for C14H12N2O5SNa[M+Na]+:323.0367,found:343.0367(+0.0mmu)。 (Equipment data of compound (F))
1 H-NMR (400 MHz, Acetone-d 6 ) δ: 8.36-8.29 (3H, m), 7.74 (2H, d, J = 8.2 Hz), 7.38 (2H, t, J = 7.5 Hz), 7.16 (2H, t, J = 7.3 Hz), 3.32 (3H, s)
13 C-NMR (100 MHz, Acetone-d 6 ) δ: 163.2, 151.1, 146.1, 139.5, 134.3, 130.9, 129.7, 129.1, 126.4 125.3, 120.7, 43.8
HRMS (ESI-TOF) m / z calcd for C 14 H 12 N 2
(化合物(c)の合成;5-メシル-2-メチルチオ安息香酸アニリド)
5-メシル-2-ニトロ安息香酸アニリド(F)(46mg,0.14mmol),ナトリウムメタンチオラート(100mg,1.4mmol)をジメチルスルホキシド(5mL)に懸濁し、室温で10分間撹拌した。反応溶液に酢酸エチルを加え、1N HClで2回、飽和食塩水で1回洗浄した。有機層を無水硫酸マグネシウムで乾燥させ、酢酸エチルを減圧下留去した。酢酸エチル-ヘキサンで再結晶させて、目的化合物を得た(34mg,収率73%)。 (Synthesis of Compound (c); 5-Mesyl-2-methylthiobenzoic acid anilide)
5-Mesyl-2-nitrobenzoic acid anilide (F) (46 mg, 0.14 mmol) and sodium methanethiolate (100 mg, 1.4 mmol) were suspended in dimethyl sulfoxide (5 mL) and stirred at room temperature for 10 minutes. Ethyl acetate was added to the reaction solution, and the mixture was washed twice with 1N HCl and once with saturated brine. The organic layer was dried over anhydrous magnesium sulfate, and ethyl acetate was distilled off under reduced pressure. Recrystallization from ethyl acetate-hexane gave the target compound (34 mg, 73% yield).
(化合物(c)の機器データ)
1H-NMR(400MHz,DMSO-d6)δ7.98(1H,d,J=1.8Hz),7.95(1H,dd,J=8.2,1.8Hz),7.69(2H,d,J=7.8Hz),7.62(1H,d,J=8.7Hz),7.36(2H,t,J=8.0Hz),7.12(1H,t,J=7.3),3.25(3H,s),2.52(3H,s)
13C-NMR(100MHz,DMSO-d6)δ:164.8,145.5,138.7,136.1,135.1,128.8,128.4,125.9,125.6,124.0,119.9,43.6,14.8
HRMS(ESI-TOF)m/z calcd for C15H15NO3S2Na[M+Na]+:344.0391,found:344.0393(+0.2mmu)。 (Equipment data of compound (c))
1 H-NMR (400 MHz, DMSO-d 6 ) δ 7.98 (1H, d, J = 1.8 Hz), 7.95 (1H, dd, J = 8.2, 1.8 Hz), 7.69 ( 2H, d, J = 7.8 Hz), 7.62 (1H, d, J = 8.7 Hz), 7.36 (2H, t, J = 8.0 Hz), 7.12 (1H, t, J = 7.3), 3.25 (3H, s), 2.52 (3H, s)
13 C-NMR (100 MHz, DMSO-d 6 ) δ: 164.8, 145.5, 138.7, 136.1, 135.1, 128.8, 128.4, 125.9, 125.6 124.0, 119.9, 43.6, 14.8
HRMS (ESI-TOF) m / z calcd for C 15H 15 NO 3 S 2 Na [M + Na] +: 344.0391, found: 344.0393 (+ 0.2mmu).
1H-NMR(400MHz,DMSO-d6)δ7.98(1H,d,J=1.8Hz),7.95(1H,dd,J=8.2,1.8Hz),7.69(2H,d,J=7.8Hz),7.62(1H,d,J=8.7Hz),7.36(2H,t,J=8.0Hz),7.12(1H,t,J=7.3),3.25(3H,s),2.52(3H,s)
13C-NMR(100MHz,DMSO-d6)δ:164.8,145.5,138.7,136.1,135.1,128.8,128.4,125.9,125.6,124.0,119.9,43.6,14.8
HRMS(ESI-TOF)m/z calcd for C15H15NO3S2Na[M+Na]+:344.0391,found:344.0393(+0.2mmu)。 (Equipment data of compound (c))
1 H-NMR (400 MHz, DMSO-d 6 ) δ 7.98 (1H, d, J = 1.8 Hz), 7.95 (1H, dd, J = 8.2, 1.8 Hz), 7.69 ( 2H, d, J = 7.8 Hz), 7.62 (1H, d, J = 8.7 Hz), 7.36 (2H, t, J = 8.0 Hz), 7.12 (1H, t, J = 7.3), 3.25 (3H, s), 2.52 (3H, s)
13 C-NMR (100 MHz, DMSO-d 6 ) δ: 164.8, 145.5, 138.7, 136.1, 135.1, 128.8, 128.4, 125.9, 125.6 124.0, 119.9, 43.6, 14.8
HRMS (ESI-TOF) m / z calcd for C 15
[反応スキーム2]
[Reaction scheme 2]

(化合物(d)の合成;2-メチルチオ-5-ニトロ安息香酸)
2-フルオロ-5-ニトロ安息香酸(235mg,1.3mmol)とナトリウムメタンチオラート(450mg,0.42mmol)をイソプロパノール(6mL)に懸濁し、室温で1時間撹拌した。反応溶液に酢酸エチルを加え、1N HClで2回、飽和食塩水で1回洗浄した。有機層を無水硫酸マグネシウムで乾燥させ、酢酸エチルを減圧下留去した。酢酸エチル-ヘキサンで再結晶させて、目的化合物を得た(173mg,収率64%)。 (Synthesis of compound (d); 2-methylthio-5-nitrobenzoic acid)
2-Fluoro-5-nitrobenzoic acid (235 mg, 1.3 mmol) and sodium methanethiolate (450 mg, 0.42 mmol) were suspended in isopropanol (6 mL) and stirred at room temperature for 1 hour. Ethyl acetate was added to the reaction solution, and the mixture was washed twice with 1N HCl and once with saturated brine. The organic layer was dried over anhydrous magnesium sulfate, and ethyl acetate was distilled off under reduced pressure. Recrystallization from ethyl acetate-hexane gave the target compound (173 mg, yield 64%).
(化合物(d)の機器データ)
1H-NMR(400MHz,Acetone-d6)δ:7.96(1H,dd,J=7.5,1.6Hz),7.58-7.56(2H,m),2.65(3H,s)
13C-NMR(100MHz,Acetone-d6)δ:166.5,148.5,145.1,130.0,127.9,125.9,125.4,14.7。 (Equipment data of compound (d))
1 H-NMR (400 MHz, Acetone-d 6 ) δ: 7.96 (1H, dd, J = 7.5, 1.6 Hz), 7.58-7.56 (2H, m), 2.65 ( 3H, s)
13 C-NMR (100 MHz, Acetone-d 6 ) δ: 166.5, 148.5, 145.1, 130.0, 127.9, 125.9, 125.4, 14.7.
(化合物(e)の合成;2-メチルスルフィニル-5-ニトロ安息香酸)
2-メチルスルチオ-5-ニトロ安息香酸(d)(97mg,0.47mmol),30%H2O2(4mL,39mmol)をアセトニトリル(1mL)に懸濁し、泡が出るまでリン酸三カリウムを加え、室温で30分間撹拌した。反応溶液に酢酸エチルを加え、1N HClで2回、飽和食塩水で1回洗浄した。有機層を無水硫酸マグネシウムで乾燥させ、酢酸エチルを減圧下留去した。酢酸エチル-ヘキサンで再結晶させて、目的化合物を得た(33mg,収率29%)。 (Synthesis of Compound (e); 2-Methylsulfinyl-5-nitrobenzoic acid)
2-Methylsulthio-5-nitrobenzoic acid (d) (97 mg, 0.47 mmol), 30% H 2 O 2 (4 mL, 39 mmol) is suspended in acetonitrile (1 mL), and tripotassium phosphate is added until bubbles appear. And stirred at room temperature for 30 minutes. Ethyl acetate was added to the reaction solution, and the mixture was washed twice with 1N HCl and once with saturated brine. The organic layer was dried over anhydrous magnesium sulfate, and ethyl acetate was distilled off under reduced pressure. Recrystallization from ethyl acetate-hexane gave the target compound (33 mg, yield 29%).
(化合物(e)の機器データ)
1H-NMR(400MHz,DMSO-d6)δ:8.69(1H,dd,J=8.5,2.5Hz),8.65(1H,d,J=2.7Hz),8.35(1H,d,J=8.7Hz),2.82(3H,s)
13C-NMR(100MHz,DMSO-d6)δ:165.0,157.5,148.6,129.1,127.9,125.8,125.2,43.7。 (Equipment data of compound (e))
1 H-NMR (400 MHz, DMSO-d 6 ) δ: 8.69 (1H, dd, J = 8.5, 2.5 Hz), 8.65 (1H, d, J = 2.7 Hz), 8. 35 (1H, d, J = 8.7 Hz), 2.82 (3H, s)
13 C-NMR (100 MHz, DMSO-d 6 ) δ: 165.0, 157.5, 148.6, 129.1, 127.9, 125.8, 125.2, 43.7.
(化合物(G)の合成;2-メチルスルフィニル-5-ニトロ安息香酸アニリド)
2-メチルスルフィニル-5-ニトロ安息香酸(e)(16.9mg,0.069mmol),WSCD・HCl(39.9mg,0.21mmol),アニリン(9.39μL,0.10mmol)をアセトニトリル(4mL)に懸濁し、室温で10分間撹拌した。反応溶液に酢酸エチルを加え、0.1N HClで2回、飽和食塩水で1回洗浄した。有機層を無水硫酸マグネシウムで乾燥させ、酢酸エチルを減圧下留去した。酢酸エチル-ヘキサンで再結晶させて、目的化合物を得た(11mg,収率49%)。 (Synthesis of Compound (G); 2-methylsulfinyl-5-nitrobenzoic acid anilide)
2-methylsulfinyl-5-nitrobenzoic acid (e) (16.9 mg, 0.069 mmol), WSCD.HCl (39.9 mg, 0.21 mmol), aniline (9.39 μL, 0.10 mmol) in acetonitrile (4 mL) ) And stirred at room temperature for 10 minutes. Ethyl acetate was added to the reaction solution, which was washed twice with 0.1N HCl and once with saturated brine. The organic layer was dried over anhydrous magnesium sulfate, and ethyl acetate was distilled off under reduced pressure. Recrystallization from ethyl acetate-hexane gave the target compound (11 mg, yield 49%).
(化合物(G)の機器データ)
1H-NMR(400MHz,DMSO-d6)δ:10.8(1H,s),8.56(1H,dd,J=8.2,2.3Hz),8.53(1H,d,J=1.8Hz),8.29(1H,d,J=8.2Hz),7.72-7.63(2H,m),7.43-7.32(2H,m),7.18-7.11(1H,m),3.48(3H,s)
13C-NMR(100MHz,DMSO-d6)δ:163.9,150.0,143.0,138.7,138.5,131.7,128.8,125.2,124.3,123.7,120.1,44.8
HRMS(ESI-TOF)m/z calcd for C14H12N2O4SNa[M+Na]+:327.0415,found:327.0423(+0.8mmu)。 (Equipment data of compound (G))
1 H-NMR (400 MHz, DMSO-d 6 ) δ: 10.8 (1H, s), 8.56 (1H, dd, J = 8.2, 2.3 Hz), 8.53 (1H, d, J = 1.8 Hz), 8.29 (1H, d, J = 8.2 Hz), 7.72-7.63 (2H, m), 7.43-7.32 (2H, m), 7. 18-7.11 (1H, m), 3.48 (3H, s)
13 C-NMR (100 MHz, DMSO-d 6 ) δ: 163.9, 150.0, 143.0, 138.7, 138.5, 131.7, 128.8, 125.2, 124.3 123.7, 120.1, 44.8
HRMS (ESI-TOF) m / z calcd for C 14 H 12 N 2O 4 SNa [M + Na] +: 327.0415, found: 327.0423 (+ 0.8mmu).
1H-NMR(400MHz,DMSO-d6)δ:10.8(1H,s),8.56(1H,dd,J=8.2,2.3Hz),8.53(1H,d,J=1.8Hz),8.29(1H,d,J=8.2Hz),7.72-7.63(2H,m),7.43-7.32(2H,m),7.18-7.11(1H,m),3.48(3H,s)
13C-NMR(100MHz,DMSO-d6)δ:163.9,150.0,143.0,138.7,138.5,131.7,128.8,125.2,124.3,123.7,120.1,44.8
HRMS(ESI-TOF)m/z calcd for C14H12N2O4SNa[M+Na]+:327.0415,found:327.0423(+0.8mmu)。 (Equipment data of compound (G))
1 H-NMR (400 MHz, DMSO-d 6 ) δ: 10.8 (1H, s), 8.56 (1H, dd, J = 8.2, 2.3 Hz), 8.53 (1H, d, J = 1.8 Hz), 8.29 (1H, d, J = 8.2 Hz), 7.72-7.63 (2H, m), 7.43-7.32 (2H, m), 7. 18-7.11 (1H, m), 3.48 (3H, s)
13 C-NMR (100 MHz, DMSO-d 6 ) δ: 163.9, 150.0, 143.0, 138.7, 138.5, 131.7, 128.8, 125.2, 124.3 123.7, 120.1, 44.8
HRMS (ESI-TOF) m / z calcd for C 14 H 12 N 2
[反応スキーム3]
[Reaction scheme 3]

(化合物(f)の合成;3-ブロモ-4-ニトロ安息香酸アニリド)
3-ブロモ-4-ニトロ安息香酸(2.18g,8.9mmol)と触媒量のDMFを塩化チオニル(15mL)に懸濁し、3時間加熱還流した。トルエンを加え、余剰の塩化チオニルを留去した。残渣のジクロロメタン懸濁液(10mL)に対して、アニリン(1.25g,14mmol)とトリエチルアミン(2.8g,28mmol)の溶解したジクロロメタン(5mL)を、氷上で滴下し、室温で1時間撹拌した。反応を1N HClで止め、ジクロロメタンを加えた。有機層を1N HClで3回、飽和食塩水で1回洗浄した。有機層を無水硫酸マグネシウムで乾燥させ、ジクロロメタンを留去した。ジクロロメタン-ヘキサンで再結晶させて、目的化合物を得た(1.47g,収率51%)。 (Synthesis of Compound (f); 3-Bromo-4-nitrobenzoic acid anilide)
3-Bromo-4-nitrobenzoic acid (2.18 g, 8.9 mmol) and a catalytic amount of DMF were suspended in thionyl chloride (15 mL) and heated to reflux for 3 hours. Toluene was added and excess thionyl chloride was distilled off. To a dichloromethane suspension (10 mL) of the residue, dichloromethane (5 mL) in which aniline (1.25 g, 14 mmol) and triethylamine (2.8 g, 28 mmol) were dissolved was added dropwise on ice and stirred at room temperature for 1 hour. . The reaction was quenched with 1N HCl and dichloromethane was added. The organic layer was washed 3 times with 1N HCl and once with saturated brine. The organic layer was dried over anhydrous magnesium sulfate and dichloromethane was distilled off. Recrystallization from dichloromethane-hexane gave the target compound (1.47 g, yield 51%).
(化合物(f)の機器データ)
1H-NMR(400MHz,DMSO-d6)δ:10.5(1H,s),8.42(1H,d,J=1.8Hz),8.17(1H,d,J=8.2Hz),8.12(1H,dd,J=8.2,1.8Hz),7.79-7.72(2H,m),7.43-7.33(2H,m),7.19-7.10(1H,m)
13C-NMR(100MHz,DMSO-d6)δ:162.5,151.1,139.3,138.5,133.6,128.7,128.6,125.5,124.3,120.5,113.0
HRMS(ESI-TOF)m/z calcd for C13H10BrN2O3[M+H]+:320.9875,found:320.9865(-1.0mmu)。 (Equipment data of compound (f))
1 H-NMR (400 MHz, DMSO-d 6 ) δ: 10.5 (1H, s), 8.42 (1H, d, J = 1.8 Hz), 8.17 (1H, d, J = 8. 2 Hz), 8.12 (1H, dd, J = 8.2, 1.8 Hz), 7.79-7.72 (2H, m), 7.43-7.33 (2H, m), 7. 19-7.10 (1H, m)
13 C-NMR (100 MHz, DMSO-d 6 ) δ: 162.5, 151.1, 139.3, 138.5, 133.6, 128.7, 128.6, 125.5, 124.3 120.5, 113.0
HRMS (ESI-TOF) m / z calcd for C 13H 10 BrN 2 O 3 [M + H] +: 320.9875, found: 320.9865 (-1.0mmu).
1H-NMR(400MHz,DMSO-d6)δ:10.5(1H,s),8.42(1H,d,J=1.8Hz),8.17(1H,d,J=8.2Hz),8.12(1H,dd,J=8.2,1.8Hz),7.79-7.72(2H,m),7.43-7.33(2H,m),7.19-7.10(1H,m)
13C-NMR(100MHz,DMSO-d6)δ:162.5,151.1,139.3,138.5,133.6,128.7,128.6,125.5,124.3,120.5,113.0
HRMS(ESI-TOF)m/z calcd for C13H10BrN2O3[M+H]+:320.9875,found:320.9865(-1.0mmu)。 (Equipment data of compound (f))
1 H-NMR (400 MHz, DMSO-d 6 ) δ: 10.5 (1H, s), 8.42 (1H, d, J = 1.8 Hz), 8.17 (1H, d, J = 8. 2 Hz), 8.12 (1H, dd, J = 8.2, 1.8 Hz), 7.79-7.72 (2H, m), 7.43-7.33 (2H, m), 7. 19-7.10 (1H, m)
13 C-NMR (100 MHz, DMSO-d 6 ) δ: 162.5, 151.1, 139.3, 138.5, 133.6, 128.7, 128.6, 125.5, 124.3 120.5, 113.0
HRMS (ESI-TOF) m / z calcd for C 13
(化合物(D)の合成;3ーシアノ-4-ニトロ安息香酸アニリド)
3-ブロモ-4-ニトロ安息香酸アニリド(805mg,2.5mmol)とシアン化ナトリウム(291mg,2.9mmol)をN-メチルピロリドンに溶解させて、150℃で3.5時間撹拌した。反応溶液を室温まで冷却し、水を加えて沈殿を濾取した。残渣をシリカゲルカラムクロマトグラフィー(ジクロロメタン)で精製し、目的化合物を得た(518mg,収率77%)。 (Synthesis of Compound (D); 3-Cyano-4-nitrobenzoic acid anilide)
3-Bromo-4-nitrobenzoic acid anilide (805 mg, 2.5 mmol) and sodium cyanide (291 mg, 2.9 mmol) were dissolved in N-methylpyrrolidone and stirred at 150 ° C. for 3.5 hours. The reaction solution was cooled to room temperature, water was added, and the precipitate was collected by filtration. The residue was purified by silica gel column chromatography (dichloromethane) to obtain the target compound (518 mg, yield 77%).
(化合物(D)の機器データ)
1H-NMR(400MHz,DMSO-d6)δ:10.66(1H,s),8.66(1H,d,J=1.8Hz),8.52(1H,d,J=8.7Hz),8.42(1H,dd,J=8.8,1.8Hz),7.80-7.72,(2H,m),7.44-7.35(2H,m),7.20-7.10(1H,m)
13C-NMR(100MHz,Acetone-d6)162.1,149.5,140.0,138.4,134.6,133.7,128.8,126.1,124.4,120.4,115.3,107.1
HRMS(ESI-TOF)m/z calcd for C14H10N3O3[M+H]+:268.0722,found:268.0714(-0.8mmu)。 (Equipment data of compound (D))
1 H-NMR (400 MHz, DMSO-d 6 ) δ: 10.66 (1H, s), 8.66 (1H, d, J = 1.8 Hz), 8.52 (1H, d, J = 8. 7 Hz), 8.42 (1H, dd, J = 8.8, 1.8 Hz), 7.80-7.72, (2H, m), 7.44-7.35 (2H, m), 7 .20-7.10 (1H, m)
13 C-NMR (100 MHz, Acetone-d 6 ) 162.1, 149.5, 140.0, 138.4, 134.6, 133.7, 128.8, 126.1, 124.4, 120. 4,115.3, 107.1
HRMS (ESI-TOF) m / z calcd for C 14 H 10 N 3 O 3 [M + H] + : 268.0722, found: 268.0714 (−0.8 mmu).
(化合物(B)の合成;2,5-ジニトロ安息香酸アニリド)
2,5-ジニトロ安息香酸(43mg,0.20mmol),WSCD・HCl(81mg,0.42mmol),アニリン(22.4μL,0.25mmol)をアセトニトリル(1mL)に懸濁し、室温で1時間撹拌した。反応溶液に酢酸エチルを加え、1N HClで3回、飽和食塩水で1回洗浄した。有機層を無水硫酸マグネシウムで乾燥させ、酢酸エチルを減圧下留去した。酢酸エチル-ヘキサンで再沈殿させて、目的化合物を得た(27mg,収率45%)。 (Synthesis of compound (B); 2,5-dinitrobenzoic acid anilide)
2,5-dinitrobenzoic acid (43 mg, 0.20 mmol), WSCD.HCl (81 mg, 0.42 mmol) and aniline (22.4 μL, 0.25 mmol) are suspended in acetonitrile (1 mL) and stirred at room temperature for 1 hour. did. Ethyl acetate was added to the reaction solution, and the mixture was washed 3 times with 1N HCl and once with saturated brine. The organic layer was dried over anhydrous magnesium sulfate, and ethyl acetate was distilled off under reduced pressure. Reprecipitation with ethyl acetate-hexane gave the target compound (27 mg, 45% yield).
(化合物(B)の機器データ)
1H-NMR(400MHz,DMSO-d6)δ:10.89(1H,s),8.62(1H,d,J=2.3Hz),8.55(1H,m,J=8.7,2.3Hz),8.36(1H,d,J=9.1Hz),7.66-7.64(2H,m),7.40-7.36(2H,m),7.17-7.15(1H,m)
13C-NMR(100MHz,DMSO-d6)δ:161.7,150.1,149.3,138.4,133.2,128.9,126.3,126.2,124.6,124.4,119.9。 (Equipment data of compound (B))
1 H-NMR (400 MHz, DMSO-d 6 ) δ: 10.89 (1 H, s), 8.62 (1 H, d, J = 2.3 Hz), 8.55 (1 H, m, J = 8. 7, 2.3 Hz), 8.36 (1 H, d, J = 9.1 Hz), 7.66-7.64 (2 H, m), 7.40-7.36 (2 H, m), 7. 17-7.15 (1H, m)
13 C-NMR (100 MHz, DMSO-d 6 ) δ: 161.7, 150.1, 149.3, 138.4, 133.2, 128.9, 126.3, 126.2, 124.6 124.4, 119.9.
(化合物(C)の合成;3-トリフルオロメチル-4-ニトロ安息香酸アニリド
3-トリフルオロメチル-4-ニトロ安息香酸(785mg,3.3mmol)と触媒量のDMFを塩化チオニル(3mL)に懸濁し、2時間加熱還流した。反応溶液を室温まで冷却し、トルエンを加えて余剰の塩化チオニルを共沸により留去した。残渣のジクロロメタン懸濁液(2mL)に対して、アニリン(305μL,3.3mmol)とトリエチルアミン(940μL,6.6mmol)の溶解したジクロロメタン(5mL)を、氷上で滴下し、室温で30分間撹拌した。反応を1N HClで止め、ジクロロメタンを加えた。有機層を1N HClで3回、飽和食塩水で1回洗浄した。有機層を無水硫酸マグネシウムで乾燥させ、ジクロロメタンを留去した。ジクロロメタン-ヘキサンで再結晶させて、目的化合物を得た(613mg,収率59%)。 (Synthesis of Compound (C); 3-trifluoromethyl-4-nitrobenzoic acid anilide 3-trifluoromethyl-4-nitrobenzoic acid (785 mg, 3.3 mmol) and a catalytic amount of DMF into thionyl chloride (3 mL) The reaction solution was cooled to room temperature, toluene was added, and excess thionyl chloride was distilled off azeotropically, and aniline (305 μL, 3.3 mmol) and triethylamine (940 μL, 6.6 mmol) dissolved in dichloromethane (5 mL) was added dropwise on ice and stirred for 30 minutes at room temperature.The reaction was quenched with 1N HCl and dichloromethane was added. The organic layer was dried with anhydrous magnesium sulfate and the dichloromethane was distilled off. Dichloromethane - was recrystallized with hexane to obtain the desired compound (613 mg, 59% yield).
3-トリフルオロメチル-4-ニトロ安息香酸(785mg,3.3mmol)と触媒量のDMFを塩化チオニル(3mL)に懸濁し、2時間加熱還流した。反応溶液を室温まで冷却し、トルエンを加えて余剰の塩化チオニルを共沸により留去した。残渣のジクロロメタン懸濁液(2mL)に対して、アニリン(305μL,3.3mmol)とトリエチルアミン(940μL,6.6mmol)の溶解したジクロロメタン(5mL)を、氷上で滴下し、室温で30分間撹拌した。反応を1N HClで止め、ジクロロメタンを加えた。有機層を1N HClで3回、飽和食塩水で1回洗浄した。有機層を無水硫酸マグネシウムで乾燥させ、ジクロロメタンを留去した。ジクロロメタン-ヘキサンで再結晶させて、目的化合物を得た(613mg,収率59%)。 (Synthesis of Compound (C); 3-trifluoromethyl-4-nitrobenzoic acid anilide 3-trifluoromethyl-4-nitrobenzoic acid (785 mg, 3.3 mmol) and a catalytic amount of DMF into thionyl chloride (3 mL) The reaction solution was cooled to room temperature, toluene was added, and excess thionyl chloride was distilled off azeotropically, and aniline (305 μL, 3.3 mmol) and triethylamine (940 μL, 6.6 mmol) dissolved in dichloromethane (5 mL) was added dropwise on ice and stirred for 30 minutes at room temperature.The reaction was quenched with 1N HCl and dichloromethane was added. The organic layer was dried with anhydrous magnesium sulfate and the dichloromethane was distilled off. Dichloromethane - was recrystallized with hexane to obtain the desired compound (613 mg, 59% yield).
(化合物(C)の機器データ)
1H-NMR(400MHz,DMSO-d6)δ:10.67(1H,s),8.50(1H,m,8.50-8.49),8.46(1H,dd,J=8.2,1.8Hz),8.33(1H,d,J=8.2Hz),7.79-7.71(2H,m),7.44-7.34(2H,m),7.20-7.11(1H,m)
13C-NMR(100MHz,DMSO-d6)δ:163.0,149.2,139.5,139.0,134.4,129.3,127.9,126.3,124.9,123.8,122.0,121.7,121.1
HRMS(ESI-TOF)m/z calcd for C14H10F3N2O3[M+H]+:311.0644,found:311.0636(-0.8mmu)。 (Equipment data of compound (C))
1 H-NMR (400 MHz, DMSO-d 6 ) δ: 10.67 (1H, s), 8.50 (1H, m, 8.50-8.49), 8.46 (1H, dd, J = 8.2, 1.8 Hz), 8.33 (1H, d, J = 8.2 Hz), 7.79-7.71 (2H, m), 7.44-7.34 (2H, m), 7.20-7.11 (1H, m)
13 C-NMR (100 MHz, DMSO-d 6 ) δ: 163.0, 149.2, 139.5, 139.0, 134.4, 129.3, 127.9, 126.3, 124.9, 123.8, 122.0, 121.7, 121.1
HRMS (ESI-TOF) m / z calcd for C 14 H 10 F 3 N 2 O 3 [M + H] +: 311.0644, found: 311.0636 (-0.8mmu).
(GST存在下における吸収スペクトルの変化の測定)
次いで、上記で合成した7種類のニトロベンゼン誘導体(化合物(A)~(G))をそれぞれ、5.0μg/mLの各GST分子種および1mM GSHの存在下、25℃にて30分間インキュベーションし、吸収スペクトルの変化を指標としたアッセイを行った。なお、本アッセイにおける各化合物の添加濃度は50μMとし、アッセイの溶媒としては100mMリン酸バッファー(pH7.4;DMSO0.1%を共溶媒として含む)を用いた。また、吸収スペクトルの測定には、紫外・可視分光光度計(V-550、日本分光株式会社製)を用いた。 (Measurement of change in absorption spectrum in the presence of GST)
Subsequently, the seven types of nitrobenzene derivatives (compounds (A) to (G)) synthesized above were each incubated at 25 ° C. for 30 minutes in the presence of 5.0 μg / mL of each GST molecular species and 1 mM GSH, An assay using the change in absorption spectrum as an index was performed. The addition concentration of each compound in this assay was 50 μM, and 100 mM phosphate buffer (pH 7.4; DMSO 0.1% included as a co-solvent) was used as the assay solvent. For the measurement of the absorption spectrum, an ultraviolet / visible spectrophotometer (V-550, manufactured by JASCO Corporation) was used.
結果を図1A~図1Gに示す。なお、これらの図において、(A)は各化合物の構造を示し、(B)は30分間のインキュベーション終了時点における吸収スペクトルを示し、(C)は各化合物の吸収波長(各図に記載)における吸光度の時間変化を示すグラフである。また、各図の(B)において、「Before」はGSHおよびGST添加前の吸収スペクトルであり、各図の(B)および(C)における「GSH」並びに「GSTA1」「GSTM1」および「GSTP1」は、GSHのみを添加した系並びにGSTA1、GSTM1およびGSTP1のいずれかを添加した系の結果をそれぞれ示す。
The results are shown in FIGS. 1A to 1G. In these figures, (A) shows the structure of each compound, (B) shows the absorption spectrum at the end of the 30 minute incubation, and (C) shows the absorption wavelength of each compound (described in each figure). It is a graph which shows the time change of a light absorbency. In (B) of each figure, “Before” is an absorption spectrum before addition of GSH and GST, and “GSH”, “GSTA1”, “GSTM1” and “GSTP1” in (B) and (C) of each figure. These show the result of the system which added only GSH and the system which added any of GSTA1, GSTM1, and GSTP1, respectively.
図1Aに示すように、化合物(A)はGSTの存在下において速やかに吸収スペクトルが変化したが、GSHのみが存在している酵素非存在下においても吸収スペクトルが変化した。また、GSTP1に対する選択性は示さなかった。
As shown in FIG. 1A, the absorption spectrum of compound (A) changed rapidly in the presence of GST, but the absorption spectrum also changed in the absence of the enzyme in which only GSH was present. Moreover, the selectivity with respect to GSTP1 was not shown.
図1Bに示すように、化合物(A)の位置異性体である化合物(B)は、GSHのみが存在している酵素非存在下における吸収スペクトル変化が遅いなど、化合物(A)に比べて反応性の低下が見られたが、GST分子種の選択性の傾向に変化は見られなかった。
As shown in FIG. 1B, compound (B), which is a positional isomer of compound (A), reacts more slowly than compound (A), such as a slow change in absorption spectrum in the absence of an enzyme in which only GSH is present. Although there was a decrease in sex, there was no change in the selectivity trend of GST molecular species.
図1Cに示すように、化合物(C)はGSTの有無により吸収スペクトルの変化を示さなかった(図1Cの(B))。ここで、GSTが触媒する芳香族求核置換反応では反応中間体であるマイゼンハイマー錯体の形成が律速段階であると考えられている。また、トリフルオロメチル(CF3)基のハメット定数は0.54であり、化合物(D)で用いられるシアノ基(0.66)や化合物(F)で用いられるメシル基(0.72)よりも小さい。このため、トリフルオロメチル基による反応中間体(マイゼンハイマー錯体)の安定化への寄与はシアノ基やメシル基よりも小さいため、グルタチオン化反応が進行しなかったものと考えられる。
As shown in FIG. 1C, the compound (C) showed no change in the absorption spectrum due to the presence or absence of GST ((B) in FIG. 1C). Here, in the aromatic nucleophilic substitution reaction catalyzed by GST, the formation of a meisenheimer complex as a reaction intermediate is considered to be a rate-determining step. Further, the Hammett constant of the trifluoromethyl (CF 3 ) group is 0.54, and the cyano group (0.66) used in the compound (D) and the mesyl group (0.72) used in the compound (F). Is also small. For this reason, since the contribution to the stabilization of the reaction intermediate (Meisenheimer complex) by the trifluoromethyl group is smaller than that of the cyano group or the mesyl group, it is considered that the glutathionation reaction did not proceed.
図1Dに示すように、化合物(D)はGSTP1存在下で290nmの吸光度の急速な上昇を示した。これに対し、GSTP1存在下以外の条件では、吸光度は時間とともに低下した。この違いはそれぞれの条件において異なる生成物が生成していることを示唆している。
As shown in FIG. 1D, compound (D) showed a rapid increase in absorbance at 290 nm in the presence of GSTP1. In contrast, the absorbance decreased with time under conditions other than the presence of GSTP1. This difference suggests that different products are produced under each condition.
図1Eに示すように、化合物(E)はGSTP1存在下で速やかに吸収スペクトルが変化した。一方、GSHとの反応による吸収の変化はほとんど見られなかった。
As shown in FIG. 1E, the absorption spectrum of compound (E) changed rapidly in the presence of GSTP1. On the other hand, almost no change in absorption due to reaction with GSH was observed.
図1Fに示すように、化合物(E)の位置異性体である化合物(F)は、GSTP1存在下で速やかに吸収スペクトルが変化し、かつ、GSTA1またはGSTM1の存在下では吸収スペクトルの変化を示さなかった。また、酵素非依存的なGSHとの反応もまったく見られなかった。このように、化合物(F)はGSTP1選択的な基質としてきわめて有望である。
As shown in FIG. 1F, compound (F), which is a positional isomer of compound (E), rapidly changes in the absorption spectrum in the presence of GSTP1, and shows a change in the absorption spectrum in the presence of GSTA1 or GSTM1. There wasn't. In addition, no reaction with enzyme-independent GSH was observed. Thus, compound (F) is extremely promising as a GSTP1-selective substrate.
図1Gに示すように、ベンゼン環の2位にメチルスルフィニル基(-SOCH3基)を有する化合物(G)は、いずれの条件においても吸収スペクトルの変化を示さなかった。ここで、メチルスルフィニル基のハメット定数は0.49であり、化合物(D)で用いられたシアノ基(0.66)や化合物(F)で用いられたメシル基(0.72)よりも小さい。このため、スルフィニル基による反応中間体(マイゼンハイマー錯体)の安定化への寄与はシアノ基やメシル基よりも小さいため、グルタチオン化反応が進行しなかったものと考えられる。なお、化合物(A)~(G)のそれぞれについて、各GST分子種の存在下での30分間のインキュベーション終了時点の極大吸収波長における吸光度(Abs)の値を、インキュベーション前の同じ波長における吸光度(Abs0)の値で除して得られた値(Abs/Abs0)を比較した結果を図1Hのグラフに示す。図1Hに示すように、化合物(D)~(F)ではGSTP1存在下におけるAbs/Abs0の値だけが大きい値を示した。
As shown in FIG. 1G, the compound (G) having a methylsulfinyl group (—SOCH 3 group) at the 2-position of the benzene ring did not change the absorption spectrum under any condition. Here, the Hammett constant of the methylsulfinyl group is 0.49, which is smaller than the cyano group (0.66) used in the compound (D) and the mesyl group (0.72) used in the compound (F). . For this reason, since the contribution to the stabilization of the reaction intermediate (Meisenheimer complex) by the sulfinyl group is smaller than that of the cyano group or the mesyl group, it is considered that the glutathionation reaction did not proceed. For each of the compounds (A) to (G), the absorbance (Abs) value at the maximum absorption wavelength at the end of the 30-minute incubation in the presence of each GST molecular species is expressed as the absorbance ( the result of comparison of abs 0 values divided by the value obtained by the) (abs / abs 0) shown in the graph of FIG. 1H. As shown in FIG. 1H, in the compounds (D) to (F), only the value of Abs / Abs 0 in the presence of GSTP1 showed a large value.
以上のことから、本実験において評価した化合物(A)~(G)のなかでは化合物(D)~(F)がGSTP1選択的な基質の候補となりうるものと結論付けた。これを一般化すれば、上記一般式(4)に示す構造において、以下の条件を満たすものであればGSTP1選択的な基質となりうるものと考えられる。
・EWG基が0.66以上0.78未満のハメット定数を有し、かつ共鳴効果を示す電子求引性基である;
・ベンゼン環に結合したニトロ(NO2)基はベンゼン環に結合したアミド結合に対してオルト位またはパラ位に位置する;および
・EWG基は、ニトロ(NO2)基に対してオルト位またはパラ位に位置する。 From the above, it was concluded that among the compounds (A) to (G) evaluated in this experiment, the compounds (D) to (F) can be candidates for GSTP1-selective substrates. If this is generalized, it can be considered that the structure shown in the general formula (4) can be a GSTP1-selective substrate as long as the following conditions are satisfied.
An electron withdrawing group in which the EWG group has a Hammett constant of 0.66 or more and less than 0.78 and exhibits a resonance effect;
The nitro (NO 2 ) group attached to the benzene ring is located in the ortho or para position relative to the amide bond attached to the benzene ring; and the EWG group is located in the ortho position relative to the nitro (NO 2 ) group or Located in the para position.
以下では、最も理想に近いGSTP1選択性の可能性を示した化合物(F)(2-ニトロ-5-メシル安息香酸アニリド)を用いて、さらなる実験を行った。
In the following, further experiments were carried out using the compound (F) (2-nitro-5-mesylbenzoic acid anilide) that showed the most ideal GSTP1 selectivity.
まず、化合物(F)がGSTP1存在下において実際にグルタチオン化されることを、HPLCおよびLC-MSによって解析した。具体的に、HPLCによる検討では、化合物(F)を100mMリン酸ナトリウム水溶液(pH7.4)中、5.0μg/mL GSTP1および1mM GSHの存在下、25℃にて30分間インキュベーションした反応液を、反応前のものと比較した。また、LC-MSによる検討では、反応後の反応液を解析した。ここで、HPLC解析の結果を図2(A)に示し、LC-MS解析の結果を図2(B)に示す。図2(A)に示すように、反応前(上段)には見られた化合物(F)のピークが反応後(下段)には消失し、保持時間がより短い新たな化合物が生成することが確認された。また、新たに生成した化合物の吸収スペクトルは図1Fに示したものと同じであったことから、本ピークが反応生成物であると考えられる。さらに、図2(B)に示すように、LC-MS解析によれば、反応生成物のピークはニトロ基がグルタチオン(GSH)に置換している化合物の分子量に相当することが確認された。
First, it was analyzed by HPLC and LC-MS that the compound (F) was actually glutathioneated in the presence of GSTP1. Specifically, in the examination by HPLC, a reaction solution obtained by incubating the compound (F) in a 100 mM sodium phosphate aqueous solution (pH 7.4) for 30 minutes at 25 ° C. in the presence of 5.0 μg / mL GSTP1 and 1 mM GSH. Compared with the previous one. Further, in the examination by LC-MS, the reaction solution after the reaction was analyzed. Here, the result of HPLC analysis is shown in FIG. 2A, and the result of LC-MS analysis is shown in FIG. 2B. As shown in FIG. 2 (A), the peak of the compound (F) seen before the reaction (upper) disappears after the reaction (lower), and a new compound having a shorter retention time may be generated. confirmed. Moreover, since the absorption spectrum of the newly produced | generated compound was the same as what was shown to FIG. 1F, this peak is considered to be a reaction product. Further, as shown in FIG. 2B, according to LC-MS analysis, it was confirmed that the peak of the reaction product corresponds to the molecular weight of the compound in which the nitro group is substituted with glutathione (GSH).
続いて、GSHとの反応に伴って化合物(F)からニトロ(NO2)基が脱離していることを、Griess法を用いて確認した。ここで、Griess法とは、亜硝酸イオンの検出・定量方法として知られており、酸性条件下でNO2
-、スルファニルアミド、1-ナフチルエチレンジアミンのジアゾカップリングを利用し、生成したアゾ化合物の吸光度を測定することで間接的にNO2
-を検出・定量する方法である。本実験では、化合物(F)を100mMリン酸ナトリウム水溶液(pH7.4)中、5.0μg/mL GSTP1および1mM GSHの存在下、25℃にて30分間インキュベーションした反応液に対して、亜硝酸イオンの定量を行った(反応機構を図3(A)に示す)。この際、絶対濃度については、別途調製した濃度既知のNO2
-を定量することで絶対濃度による検量線を作成し、反応によって生成した亜硝酸イオンを検量線法により定量した。その結果、図3(B)に示すように、用いた基質濃度とほぼ等濃度の亜硝酸イオンが反応液中に存在することが確認された。
Subsequently, it was confirmed using the Griess method that the nitro (NO 2 ) group was eliminated from the compound (F) with the reaction with GSH. Here, the Griess method is known as a method for detecting and quantifying nitrite ions, and uses a diazo coupling of NO 2 − , sulfanilamide, and 1-naphthylethylenediamine under acidic conditions to produce a azo compound. In this method, NO 2 − is indirectly detected and quantified by measuring absorbance. In this experiment, nitrite was added to a reaction solution obtained by incubating compound (F) in 100 mM aqueous sodium phosphate (pH 7.4) in the presence of 5.0 μg / mL GSTP1 and 1 mM GSH at 25 ° C. for 30 minutes. Ions were quantified (reaction mechanism is shown in FIG. 3A). At this time, for the absolute concentration, a calibration curve based on the absolute concentration was prepared by quantifying separately prepared NO 2 - having a known concentration, and nitrite ions generated by the reaction were quantified by the calibration curve method. As a result, as shown in FIG. 3B, it was confirmed that nitrite ions having a concentration almost equal to the substrate concentration used were present in the reaction solution.
以上の結果から、ニトロベンゼン誘導体である化合物(F)はGSTP1選択的な基質であることが示された。また、このことから、一般式(4)で表される化合物もまた、GSTP1選択的な基質として用いられうることが推認される。
From the above results, it was shown that the compound (F) which is a nitrobenzene derivative is a GSTP1-selective substrate. From this, it is presumed that the compound represented by the general formula (4) can also be used as a GSTP1-selective substrate.
[蛍光プローブの合成(1)]
ここでは、上述したスクリーニングによって得られたGSTP1選択的な基質である5-メシル-2-ニトロ安息香酸アニリドを反応部位として有する蛍光プローブを合成した。なお、本実験では、キサンテン環を蛍光団として有するTokyoGreen(TG;J. Am. Chem. Soc., 2005, 127, 4888-4894.)を母核として有する蛍光プローブを合成した(下記の反応スキーム4)。 [Synthesis of fluorescent probe (1)]
Here, a fluorescent probe having a reaction site of 5-mesyl-2-nitrobenzoic acid anilide, which is a GSTP1-selective substrate obtained by the above-described screening, was synthesized. In this experiment, a fluorescent probe having TokyoGreen (TG; J. Am. Chem. Soc., 2005, 127, 4888-4894.) Having a xanthene ring as a fluorophore was synthesized (the following reaction scheme). 4).
具体的には、まず出発原料である2-メチル-4-ニトロ安息香酸(1)をボラン錯体によりアルコールに還元し、生成物をヘキサン/酢酸エチル(10:1)混合溶媒より再結晶を行うことで2-メチル-4-ニトロベンジルアルコール(2)を収率81%で得た。次に、2-メチル-4-ニトロベンジルアルコールをシリカゲルと混合し、クロロクロム酸ピリジニウム(PCC)でアルデヒドに酸化した。不純物を取り除くために減圧下、シリカゲルにてろ過することにより、2-メチル-4-ニトロベンズアルデヒド(3)を単離した(収率91%)。3ステップ目として、2-メチル-4-ニトロベンズアルデヒド(3)とレゾルシノールをメタンスルホン酸中で加熱し、Friedel-Crafts型の縮合反応、脱水縮合および酸化反応を経て、2-メチル-4-ニトロTG(4)を合成した。硫化ナトリウムおよび硫化水素ナトリウムの水和物で2-メチル-4-ニトロTG(4)のニトロ基をアミノ基に還元し、4-アミノ-2-メチルTG(6)を得た(2工程で収率4%)。最後に、得られた4-アミノ-2-メチルTGのアミノ基に5-メシル-2-ニトロ安息香酸を導入すべく、縮合剤(1-エチル-3-(3-ジメチルアミノプロピル)カルボジイミド塩酸塩(EDC・HCl))とともにアセトニトリル中で反応させ、ヒドロキシ基にも導入された5-メシル-2-ニトロ安息香酸を水酸化ナトリウムで加水分解することにより最終生成物(8)(Ps-TG)を得た(収率50%)。
Specifically, the starting material 2-methyl-4-nitrobenzoic acid (1) is first reduced to an alcohol by a borane complex, and the product is recrystallized from a mixed solvent of hexane / ethyl acetate (10: 1). As a result, 2-methyl-4-nitrobenzyl alcohol (2) was obtained in a yield of 81%. Next, 2-methyl-4-nitrobenzyl alcohol was mixed with silica gel and oxidized to aldehyde with pyridinium chlorochromate (PCC). To remove impurities, 2-methyl-4-nitrobenzaldehyde (3) was isolated by filtration through silica gel under reduced pressure (yield 91%). As the third step, 2-methyl-4-nitrobenzaldehyde (3) and resorcinol are heated in methanesulfonic acid and subjected to Friedel-Crafts type condensation reaction, dehydration condensation and oxidation reaction, and then 2-methyl-4-nitro TG (4) was synthesized. Reduction of the nitro group of 2-methyl-4-nitro TG (4) to an amino group with hydrates of sodium sulfide and sodium hydrogen sulfide gave 4-amino-2-methyl TG (6) (in two steps). Yield 4%). Finally, in order to introduce 5-mesyl-2-nitrobenzoic acid into the amino group of the obtained 4-amino-2-methyl TG, a condensing agent (1-ethyl-3- (3-dimethylaminopropyl) carbodiimide hydrochloride Salt (EDC · HCl)) in acetonitrile and hydrolyzing 5-mesyl-2-nitrobenzoic acid also introduced into the hydroxy group with sodium hydroxide to give the final product (8) (Ps-TG) ) Was obtained (yield 50%).

なお、反応スキーム4に記載の化合物(1)~(4)および(6)は、非特許文献1において既知の化合物であることから、非特許文献1において報告された合成法に従って合成した。また、その他の化合物(7)~(9)および化合物(7)の合成中間体としての化合物(5)は、以下の手法により合成した。
Since compounds (1) to (4) and (6) described in Reaction Scheme 4 are known compounds in Non-Patent Document 1, they were synthesized according to the synthesis method reported in Non-Patent Document 1. The other compounds (7) to (9) and the compound (5) as a synthesis intermediate of the compound (7) were synthesized by the following method.
(化合物(8)の合成;N-(4-(6-ヒドロキシ-3-オキソ-3H-キサンテン-9-イル)-3-メチルフェニル)-5-(メチルスルホニル)-2-ニトロベンズアミド(Ps-TG))
(Synthesis of Compound (8); N- (4- (6-Hydroxy-3-oxo-3H-xanthen-9-yl) -3-methylphenyl) -5- (methylsulfonyl) -2-nitrobenzamide (Ps -TG))

2-メチル-4-アミノTG(6)(10.2mg,0.032mmol)、5-メシル-2-ニトロ安息香酸(15.6mg,0.064mmol)および1-エチル-3-(3-ジメチルアミノプロピル)カルボジイミド塩酸塩(EDC・HCl;12.5mg,0.065mmol)をジメチルホルムアミドに懸濁し、室温にて1時間撹拌した。反応液に対して酢酸エチルを加え、1N塩酸で3回、飽和食塩水で1回洗浄した。これを無水硫酸マグネシウムで乾燥させた後、ろ液を留去した。混合物をアセトニトリルに懸濁し、4℃において撹拌しながら室温で1N水酸化ナトリウム水溶液を加え、10分間反応させた。反応液をpH7.4、200mMのリン酸ナトリウム緩衝液によって中和し、HPLCの初期溶媒(下記)によって希釈し、分取HPLCによって精製した。分取HPLCでは移動相Aとして10mM酢酸アンモニウム緩衝液(pH7.0)、移動相Bとしてアセトニトリルを用い、20分間で組成比がA:B=90:10から10:90となるように組成比の勾配をかけ、流速9mL/minで溶出させた。溶出液中に含まれるアセトニトリルを減圧下で留去した後、残渣を酢酸エチルに懸濁し、0.1N塩酸で3回洗浄した後、無水硫酸マグネシウムで乾燥させた。酢酸エチルを留去して、目的化合物8.5mgを得た(収率50%)
(化合物(8)の機器データ)
1H-NMR(400MHz,DMSO-d6)δ7.56(2H,m),7.48(1H, dd,J=1.6,8.8),6.95(1H,s),6.86(1H,m),6.47 (1H,d,J=8.4),6.08(2H,d,J=9.2),5.77(4H,br),2.59(3H,s),1.20(3H,s)
13C-NMR(100MHz,DMSO-d6)δ163.3,159.1,150.1, 145.2,140.8,137.2,133.2,130.6,128.8,127.6,126.3,121.8,121.3,117.8,116.8,103.1,60.3,21.6,21.3,14.6
HRMS(ESI-TOF)m/z Found 545.1019 [M+H]+,calculated 545.1019 for C28H21N2O8S (+ 0.0 mmu)。 2-methyl-4-amino TG (6) (10.2 mg, 0.032 mmol), 5-mesyl-2-nitrobenzoic acid (15.6 mg, 0.064 mmol) and 1-ethyl-3- (3-dimethyl) Aminopropyl) carbodiimide hydrochloride (EDC · HCl; 12.5 mg, 0.065 mmol) was suspended in dimethylformamide and stirred at room temperature for 1 hour. Ethyl acetate was added to the reaction mixture, and the mixture was washed 3 times with 1N hydrochloric acid and once with saturated brine. After drying this with anhydrous magnesium sulfate, the filtrate was distilled off. The mixture was suspended in acetonitrile, 1N aqueous sodium hydroxide solution was added at room temperature with stirring at 4 ° C., and the mixture was allowed to react for 10 minutes. The reaction was neutralized with 200 mM sodium phosphate buffer, pH 7.4, diluted with HPLC initial solvent (below) and purified by preparative HPLC. In preparative HPLC, 10 mM ammonium acetate buffer (pH 7.0) is used as mobile phase A, acetonitrile is used as mobile phase B, and the composition ratio is such that the composition ratio becomes A: B = 90: 10 to 10:90 in 20 minutes. The elution was performed at a flow rate of 9 mL / min. After acetonitrile contained in the eluate was distilled off under reduced pressure, the residue was suspended in ethyl acetate, washed three times with 0.1N hydrochloric acid, and then dried over anhydrous magnesium sulfate. Ethyl acetate was distilled off to obtain 8.5 mg of the target compound (yield 50%).
(Equipment data of compound (8))
1 H-NMR (400 MHz, DMSO-d 6 ) δ 7.56 (2H, m), 7.48 (1H, dd, J = 1.6, 8.8), 6.95 (1H, s), 6 .86 (1H, m), 6.47 (1H, d, J = 8.4), 6.08 (2H, d, J = 9.2), 5.77 (4H, br), 2.59 (3H, s), 1.20 (3H, s)
13 C-NMR (100 MHz, DMSO-d 6 ) δ 163.3, 159.1, 150.1, 145.2, 140.8, 137.2, 133.2, 130.6, 128.8, 127. 6,126.3,121.8,121.3,117.8,116.8,103.1,60.3,21.6,21.3,14.6
HRMS (ESI-TOF) m / z Found 545.01019 [M + H] + , calculated 545.1019 for C 28 H 21 N 2 O 8 S (+0.0 mmu).
(化合物(7)の合成;9-(4-アミノ-2-メチルフェニル)-2,7-ジクロロ-6-ヒドロキシ-3H-キサンテン-3-オン(2-メチル-4-アミノ-2’,7’-ジクロロ-TokyoGreen)
(Synthesis of Compound (7); 9- (4-amino-2-methylphenyl) -2,7-dichloro-6-hydroxy-3H-xanthen-3-one (2-methyl-4-amino-2 ′, 7'-dichloro-TokyoGreen)

2-メチル-4-ニトロベンズアルデヒド(559mg,3.4mmol)およびクロロレゾルシノール(983mg,6.8mmol)をメタンスルホン酸3mLに懸濁し、1時間加熱還流した。室温に戻した後、水30mLを加えて生じた沈殿を濾取した後、水、酢酸エチルで洗浄した。固体を酢酸エチルに懸濁し、シリカゲルカラムクロマトグラフィー(シリカゲル60N、酢酸エチル/20%エタノール)にて精製して、化合物(5)(2-メチル-4-ニトロジクロロTG)の赤褐色の粗生成物を得た。これを水15mLに懸濁し、硫化ナトリウム九水和物(216mg,0.86mmol)および硫化ナトリウムn水和物(347mg)を加えて2時間加熱還流した。反応液を4℃に冷却し、濃塩酸を滴下し反応液を酸性にすることで生じた暗赤色の沈殿を濾取し、水で洗浄した。これを酢酸エチルに懸濁し、シリカゲルカラムクロマトグラフィーによって精製(移動相:酢酸エチル)して、目的化合物(4-アミノ-2-メチルジクロロTG)104mgを得た(収率8%)。
2-Methyl-4-nitrobenzaldehyde (559 mg, 3.4 mmol) and chlororesorcinol (983 mg, 6.8 mmol) were suspended in 3 mL of methanesulfonic acid and heated to reflux for 1 hour. After returning to room temperature, 30 mL of water was added and the resulting precipitate was collected by filtration and washed with water and ethyl acetate. The solid was suspended in ethyl acetate and purified by silica gel column chromatography (silica gel 60N, ethyl acetate / 20% ethanol) to obtain a reddish brown crude product of compound (5) (2-methyl-4-nitrodichloroTG). Got. This was suspended in 15 mL of water, sodium sulfide nonahydrate (216 mg, 0.86 mmol) and sodium sulfide n hydrate (347 mg) were added, and the mixture was heated to reflux for 2 hours. The reaction solution was cooled to 4 ° C., concentrated hydrochloric acid was added dropwise to acidify the reaction solution, and a dark red precipitate produced by filtration was collected by filtration and washed with water. This was suspended in ethyl acetate and purified by silica gel column chromatography (mobile phase: ethyl acetate) to obtain 104 mg of the target compound (4-amino-2-methyldichloroTG) (yield 8%).
(化合物(7)の機器データ)
1H-NMR(400MHz,DMSO-d6)δ7.10(2H,s),6.91(1H,d,J=8.2),6.75(2H,s),6.61(2H,m),1.87(3H,s)
13C-NMR(100MHz,DMSO-d6)δ151.4,150.2,136.4,130.2,128.4,117.7,115.5,115.3,111.5,103.9,79.2,19.5
HRMS(ESI-TOF)m/z Found 386.0351 [M+H]+, calculated 386.0351 for C20H14NO3Cl2 (-0.1 mmu)。 (Equipment data of compound (7))
1 H-NMR (400MHz, DMSO -d 6) δ7.10 (2H, s), 6.91 (1H, d, J = 8.2), 6.75 (2H, s), 6.61 (2H , M), 1.87 (3H, s)
13 C-NMR (100 MHz, DMSO-d 6 ) δ 151.4, 150.2, 136.4, 130.2, 128.4, 117.7, 115.5, 115.3, 111.5, 103. 9, 79.2, 19.5
HRMS (ESI-TOF) m / z Found 386.0351 [M + H] + , calculated 386.0351 for C 20 H 14 NO 3 Cl 2 (−0.1 mmu).
(化合物(9)の合成;N-(4-(2,7-ジクロロ-6-ヒドロキシ-3-オキソ-3H-キサンテン-9-イル)-3-メチルフェニル)-5-(メチルスルホニル)-2-ニトロベンズアミド(Ps-DCTG))
(Synthesis of Compound (9); N- (4- (2,7-Dichloro-6-hydroxy-3-oxo-3H-xanthen-9-yl) -3-methylphenyl) -5- (methylsulfonyl)- 2-Nitrobenzamide (Ps-DCTG))

2-メチル-4-ニトロ-ジクロロTG(5)(8.7mg,0.023mmol)、5-メシル-2-ニトロ安息香酸(12.2mg,0.050mmol)、および1-エチル-3-(3-ジメチルアミノプロピル)カルボジイミド塩酸塩(EDC・HCl;14.6mg,0.076mmol)をアセトニトリル1mL中にて20分間、室温にて撹拌した。反応溶液を酢酸エチルで希釈した後、有機層を0.1N塩酸で3回、飽和食塩水で1回洗浄し、無水硫酸マグネシウムによって乾燥させ、減圧下で留去した。これをアセトニトリル2mLに懸濁し、1N水酸化ナトリウム水溶液を氷上で加え、室温にて10分間反応させた。反応液を中和し、セミ分取HPLCによって精製した。分取HPLCでは移動相AおよびBとしてそれぞれ10mM酢酸アンモニウム緩衝液(pH7.0)、アセトニトリルを用い、20分間で組成比がA:B=90:10から10:90となるように組成比の勾配をかけ、流速9mL/minで溶出させた。溶出液中に含まれるアセトニトリルを減圧下で留去した後、残渣を酢酸エチルに懸濁し、0.1N塩酸で3回洗浄した後、無水硫酸マグネシウムで乾燥させて、目的化合物(Ps-DCTG)11.1mgを得た(収率79%)。
2-methyl-4-nitro-dichloroTG (5) (8.7 mg, 0.023 mmol), 5-mesyl-2-nitrobenzoic acid (12.2 mg, 0.050 mmol), and 1-ethyl-3- ( 3-Dimethylaminopropyl) carbodiimide hydrochloride (EDC · HCl; 14.6 mg, 0.076 mmol) was stirred in 1 mL of acetonitrile for 20 minutes at room temperature. After the reaction solution was diluted with ethyl acetate, the organic layer was washed 3 times with 0.1N hydrochloric acid and once with saturated brine, dried over anhydrous magnesium sulfate, and evaporated under reduced pressure. This was suspended in 2 mL of acetonitrile, 1N aqueous sodium hydroxide solution was added on ice, and the mixture was reacted at room temperature for 10 minutes. The reaction was neutralized and purified by semi-preparative HPLC. In preparative HPLC, 10 mM ammonium acetate buffer (pH 7.0) and acetonitrile were used as mobile phases A and B, respectively, and the composition ratio was changed from A: B = 90: 10 to 10:90 in 20 minutes. A gradient was applied and eluted at a flow rate of 9 mL / min. After the acetonitrile contained in the eluate was distilled off under reduced pressure, the residue was suspended in ethyl acetate, washed 3 times with 0.1N hydrochloric acid, and then dried over anhydrous magnesium sulfate to obtain the target compound (Ps-DCTG). 11.1 mg was obtained (yield 79%).
(化合物(9)の機器データ)
1H-NMR(400MHz,DMSO-d6)δ8.43(1H,d,J=1.8),8.40(1H,d,J=8.2),8.31(1H,dd,J=8.2,1.8),7.82(1H,s),7.75(1H,d,J=8.7),7.33(1H,d,J=8.2),7.01(2H,s),6.77(2H,s),3.42(3H,s),2.05(3H,s)
13C-NMR(100MHz,DMSO-d6)δ162.7,149.5,149.3,144.8,139.9,136.8,132.8,131.7,130.0,129.1,128.3,127.9,126.9,125.7,125.1,121.3,117.4,104.1,59.7,42.9,20.8,19.8,14.1
HRMS (ESI-TOF)m/z Found 613.0245 [M+H]+,caluculated 613.0239 for C28H19N2O8SCl2 (+0.6 mmu)。 (Equipment data of compound (9))
1 H-NMR (400 MHz, DMSO-d 6 ) δ 8.43 (1H, d, J = 1.8), 8.40 (1H, d, J = 8.2), 8.31 (1H, dd, J = 8.2, 1.8), 7.82 (1H, s), 7.75 (1H, d, J = 8.7), 7.33 (1H, d, J = 8.2), 7.01 (2H, s), 6.77 (2H, s), 3.42 (3H, s), 2.05 (3H, s)
13 C-NMR (100 MHz, DMSO-d 6 ) δ 162.7, 149.5, 149.3, 144.8, 139.9, 136.8, 132.8, 131.7, 130.0, 129. 1,128.3,127.9,126.9,125.7,125.1,121.3,117.4,104.1,59.7,42.9,20.8,19.8, 14.1
HRMS (ESI-TOF) m / z Found 613.0245 [M + H] + , calibrated 613.0239 for C 28 H 19 N 2 O 8 SCl 2 (+0.6 mmu).
[蛍光プローブの分光学的特性およびクラス選択性の評価(1)]
上記で合成した蛍光プローブPs-TG(化合物(8))およびPs-DCTG(化合物(9))の分光学的特性を評価した。また、これらの蛍光プローブについて、反応前後でのHPLC解析およびLC-MS解析により、GST存在下におけるGSHとの反応生成物の同定を行った。そして、GSHおよび各種GST存在下での蛍光強度上昇を指標として、GSTクラス選択的な反応性を評価した。 [Evaluation of spectroscopic characteristics and class selectivity of fluorescent probe (1)]
The spectroscopic characteristics of the fluorescent probes Ps-TG (compound (8)) and Ps-DCTG (compound (9)) synthesized above were evaluated. In addition, with respect to these fluorescent probes, reaction products with GSH in the presence of GST were identified by HPLC analysis and LC-MS analysis before and after the reaction. Then, GST class-selective reactivity was evaluated using the increase in fluorescence intensity in the presence of GSH and various GSTs as an index.
(Ps-TGの評価)
まず、2.5μMのPs-TG(化合物(8))を100mMリン酸バッファー(pH7.4;DMSO0.1%を共溶媒として含む)に溶解し、反応前の吸収スペクトルおよび蛍光スペクトルを測定した。なお、吸収スペクトルおよび蛍光スペクトルの測定には、それぞれ紫外・可視分光光度計(V-550、日本分光株式会社製)および蛍光分光光度計(RF-5300PC;株式会社島津製作所製)を用いた。また、2.5μMのPs-TGを1mMの還元型グルタチオン(GSH)および5μg/mLのグルタチオン-S-トランスフェラーゼ(GSTP1-1)を含む100mMリン酸バッファー(pH7.4;DMSO1%を共溶媒として含む)中、室温(25℃)にて撹拌しながら1日間反応させた。その後、上記と同様にして反応後の吸収スペクトルおよび蛍光スペクトルを測定した。 (Evaluation of Ps-TG)
First, 2.5 μM Ps-TG (compound (8)) was dissolved in 100 mM phosphate buffer (pH 7.4; DMSO 0.1% is included as a cosolvent), and the absorption spectrum and fluorescence spectrum before the reaction were measured. . For the measurement of the absorption spectrum and the fluorescence spectrum, an ultraviolet / visible spectrophotometer (V-550, manufactured by JASCO Corporation) and a fluorescence spectrophotometer (RF-5300PC; manufactured by Shimadzu Corporation) were used, respectively. Also, 2.5 μM Ps-TG was added to 100 mM phosphate buffer (pH 7.4;DMSO 1%) containing 1 mM reduced glutathione (GSH) and 5 μg / mL glutathione-S-transferase (GSTP1-1). Reaction) for 1 day with stirring at room temperature (25 ° C.). Thereafter, the absorption spectrum and fluorescence spectrum after the reaction were measured in the same manner as described above.
まず、2.5μMのPs-TG(化合物(8))を100mMリン酸バッファー(pH7.4;DMSO0.1%を共溶媒として含む)に溶解し、反応前の吸収スペクトルおよび蛍光スペクトルを測定した。なお、吸収スペクトルおよび蛍光スペクトルの測定には、それぞれ紫外・可視分光光度計(V-550、日本分光株式会社製)および蛍光分光光度計(RF-5300PC;株式会社島津製作所製)を用いた。また、2.5μMのPs-TGを1mMの還元型グルタチオン(GSH)および5μg/mLのグルタチオン-S-トランスフェラーゼ(GSTP1-1)を含む100mMリン酸バッファー(pH7.4;DMSO1%を共溶媒として含む)中、室温(25℃)にて撹拌しながら1日間反応させた。その後、上記と同様にして反応後の吸収スペクトルおよび蛍光スペクトルを測定した。 (Evaluation of Ps-TG)
First, 2.5 μM Ps-TG (compound (8)) was dissolved in 100 mM phosphate buffer (pH 7.4; DMSO 0.1% is included as a cosolvent), and the absorption spectrum and fluorescence spectrum before the reaction were measured. . For the measurement of the absorption spectrum and the fluorescence spectrum, an ultraviolet / visible spectrophotometer (V-550, manufactured by JASCO Corporation) and a fluorescence spectrophotometer (RF-5300PC; manufactured by Shimadzu Corporation) were used, respectively. Also, 2.5 μM Ps-TG was added to 100 mM phosphate buffer (pH 7.4;
Ps-TG(化合物(8))についての吸収スペクトルおよび蛍光スペクトルの測定結果を図4の(A)および(B)にそれぞれ示す。図4の(B)に示す結果からわかるように、Ps-TGは反応の前後で約60倍の蛍光強度上昇を示した(反応前後の蛍光量子収率はそれぞれ0.016および0.913であった)。また、図4(A)に示すように反応の前後において吸収スペクトルは変化せず、蛍光スペクトルのみが大きく変化した。これは、電子が基底状態から励起状態へと励起される過程には反応の前後で違いはないが、励起された電子の遷移過程に違いがあるためである。
The measurement results of the absorption spectrum and the fluorescence spectrum for Ps-TG (compound (8)) are shown in FIGS. 4A and 4B, respectively. As can be seen from the results shown in FIG. 4B, Ps-TG showed an increase in fluorescence intensity of about 60 times before and after the reaction (the fluorescence quantum yields before and after the reaction were 0.016 and 0.913, respectively). there were). Further, as shown in FIG. 4A, the absorption spectrum did not change before and after the reaction, and only the fluorescence spectrum changed greatly. This is because there is no difference in the process in which electrons are excited from the ground state to the excited state before and after the reaction, but there is a difference in the transition process of the excited electrons.
続いて、Ps-TGがグルタチオン化反応を受けることで強蛍光性を示すようになっていることを確認するために、HPLCおよびLC-MSによる解析を行った。具体的には、上記で吸収スペクトルおよび蛍光スペクトルを測定したサンプルを反応液としてHPLC測定を行った。HPLCによる分析には、ポンプとしてLC-10AT、吸収および蛍光検出器として、SPD-M20AおよびRF-10AxL(株式会社島津製作所製)、分離用カラムとしてIntersustain C18カラム(GLサイエンス社)から構成されたHPLCシステムを利用した。移動相としては、A液およびB液に10mM酢酸アンモニウム水溶液、アセトニトリルをそれぞれ用い、20分間でA:B=90:10から5:95の混合比を変化させ、流速は0.2mL/分の条件で分析を行った。
Subsequently, analysis by HPLC and LC-MS was performed to confirm that Ps-TG exhibited strong fluorescence by undergoing a glutathione reaction. Specifically, HPLC measurement was performed using the sample whose absorption spectrum and fluorescence spectrum were measured as described above as a reaction solution. The HPLC analysis consisted of LC-10AT as a pump, SPD-M20A and RF-10AxL (manufactured by Shimadzu Corporation) as absorption and fluorescence detectors, and an Interstain C18 column (GL Science) as a separation column. An HPLC system was utilized. As the mobile phase, 10 mM ammonium acetate aqueous solution and acetonitrile were used for liquid A and liquid B, respectively, and the mixing ratio was changed from A: B = 90: 10 to 5:95 in 20 minutes, and the flow rate was 0.2 mL / min. Analysis was performed under conditions.
HPLCによる解析結果を図4の(C)に示す。図4(C)に示す吸収クロマトグラムから、Ps-TGの保持時間は反応に伴って短くなっていた。また、対応する蛍光測定モードでは、Ps-TGに相当するピークはほぼ無蛍光であるのに対し、反応後は強蛍光性であった。
The analysis result by HPLC is shown in FIG. From the absorption chromatogram shown in FIG. 4C, the retention time of Ps-TG was shortened with the reaction. In the corresponding fluorescence measurement mode, the peak corresponding to Ps-TG was almost non-fluorescent, whereas it was strongly fluorescent after the reaction.
また、HPLC解析で確認できた強蛍光性ピークが実際にグルタチオン化された分子であることを確かめるため、反応生成物についてLC-MS解析を行った。具体的には、HPLC測定と同じ反応液をLC-MS解析に用いた。LC-MS解析には、ポンプとしてLC-10AT、吸収検出器としてSPD-M20A、MSとして四重極型質量分析計LCMS-2020(株式会社島津製作所製)、分離用カラムとしてInertsil ODS-3カラム(GLサイエンス社)から構成されたシステムを利用した。移動相としては、A液には10mM酢酸アンモニウム、B液にはアセトニトリルを用い、20分間でA:B=90:10から5:95の混合比を変化させ、流速は0.2mL/分の条件で分析を行った。
Also, LC-MS analysis was performed on the reaction product in order to confirm that the strong fluorescent peak confirmed by HPLC analysis was actually a glutathione molecule. Specifically, the same reaction solution as that for HPLC measurement was used for LC-MS analysis. For LC-MS analysis, LC-10AT as a pump, SPD-M20A as an absorption detector, quadrupole mass spectrometer LCMS-2020 (manufactured by Shimadzu Corporation) as MS, and Inertsil ODS-3 column as a separation column A system composed of (GL Science) was used. As the mobile phase, 10 mM ammonium acetate was used for liquid A, and acetonitrile was used for liquid B, and the mixing ratio was changed from A: B = 90: 10 to 5:95 in 20 minutes, and the flow rate was 0.2 mL / min. Analysis was performed under conditions.
LC-MSによる解析結果を図4(D)に示す。なお、図4(D)の上段は吸収クロマトグラムであり、下段は抽出イオンクロマトグラムである。図4(D)に示すように、LC-MS解析ではグルタチオン化生成物由来のMSピークが検出された(m/z=802.7±0.5)。以上のことから、Ps-TGのニトロ基がGSHに置換されることで、強蛍光性を持つ反応生成物が生じることが示された。そして、Ps-TGは、グルタチオン化に伴ってニトロ基が脱離することでD-PeT機構による消光が解除されるという分子設計通りに機能することが確認された。
The analysis result by LC-MS is shown in FIG. In addition, the upper stage of FIG.4 (D) is an absorption chromatogram, and a lower stage is an extraction ion chromatogram. As shown in FIG. 4D, an MS peak derived from a glutathione product was detected by LC-MS analysis (m / z = 802.7 ± 0.5). From the above, it was shown that a reaction product having strong fluorescence was generated by replacing the nitro group of Ps-TG with GSH. Then, it was confirmed that Ps-TG functions as a molecular design in which quenching by the D-PeT mechanism is released by detachment of the nitro group with glutathione formation.
次いで、Ps-TG(化合物(8))のGSTP1選択性を評価した。具体的に、上記で合成したPs-TGについて、3種類のGST(GSTA1-1、GSTM1-1、GSTP1-1)について異なる濃度のGSTを用いてGST活性を測定した場合の蛍光強度の経時的な変化を測定することで、特異活性を算出した。
Subsequently, the GSTP1 selectivity of Ps-TG (compound (8)) was evaluated. Specifically, with respect to Ps-TG synthesized above, the fluorescence intensity over time when GST activity was measured using GSTs of different concentrations for three types of GST (GSTA1-1, GSTM1-1, GSTP1-1). Specific activity was calculated by measuring various changes.
具体的には、1μMのPs-TGを100mMリン酸バッファー(pH7.4;DMSO 0.1%を共溶媒として含む)に溶解し、異なる濃度の各種GST(GSTA1-1;0.1~10.1μg/mL、GSTM1-1;0.4~10.1μg/mL、GSTP1-1;0.3~9.8μg/mL)の存在下、1mMの還元型グルタチオン(GSH)と室温(25℃)にて撹拌しながら反応させ、蛍光強度を30秒ごとに30分間記録した。なお、本実験における励起/蛍光波長は490/510nmとし、ネガティブコントロールとしてGSHのみを添加した系についても同様の実験を行った。また、本実験はマルチウェルプレートリーダー(SH-9000、コロナ電気株式会社)を用いて行った。
Specifically, 1 μM Ps-TG is dissolved in 100 mM phosphate buffer (pH 7.4; DMSO 0.1% is included as a co-solvent), and various concentrations of GST (GSTA1-1; 0.1 to 10) are dissolved. 0.1 μg / mL, GSTM1-1; 0.4 to 10.1 μg / mL, GSTP1-1; 0.3 to 9.8 μg / mL) in the presence of 1 mM reduced glutathione (GSH) and room temperature (25 ° C. ), And the fluorescence intensity was recorded every 30 seconds for 30 minutes. Note that the same experiment was performed for a system in which the excitation / fluorescence wavelength in this experiment was 490/510 nm and only GSH was added as a negative control. In addition, this experiment was performed using a multiwell plate reader (SH-9000, Corona Electric Co., Ltd.).
結果を図5に示す。図5(A)は、各種GSTの濃度を0.5μg/mLとしたときのPs-TGの蛍光強度の経時的な変化を示すグラフである。また、図5(B)は、Ps-TGの各種GSTとの反応初速度を、単位時間当たりの蛍光強度変化(ΔF.I./sec)として示すグラフである。図5の(A)および(B)に示すように、GSTの非存在下およびGSTA1の存在下では、1mM GSHによって蛍光強度の上昇は見られなかった。一方、GSTM1またはGSTP1の存在下では蛍光強度の上昇が見られ、単位時間当たりの蛍光強度変化(ΔF.I./sec)はそれぞれ0.9および7.1であった。その差は約8倍程度であり、高いGSTP1選択性を確認することができた。
The results are shown in FIG. FIG. 5 (A) is a graph showing the change over time in the fluorescence intensity of Ps-TG when the concentration of various GSTs is 0.5 μg / mL. FIG. 5B is a graph showing the initial reaction rate of Ps-TG with various GSTs as a change in fluorescence intensity per unit time (ΔF.I. / sec). As shown in FIGS. 5A and 5B, no increase in fluorescence intensity was observed with 1 mM GSH in the absence of GST and in the presence of GSTA1. On the other hand, an increase in fluorescence intensity was observed in the presence of GSTM1 or GSTP1, and changes in fluorescence intensity per unit time (ΔF.I. / sec) were 0.9 and 7.1, respectively. The difference was about 8 times, and high GSTP1 selectivity could be confirmed.
(Ps-DCTG)
続いて、Ps-DCTG(化合物(9))についても、上記と同様に評価を行ったところ、Ps-TG(化合物(8))と同様の結果が得られた(図6の(A)~(D)並びに図7の(A)および(B))。ここで、図6(B)に示す蛍光スペクトルから算出される反応の前後での蛍光量子収率はそれぞれ0.022および0.851であり、Ps-DCTGは反応前後で約40倍の蛍光強度の上昇を示した。図6(D)に示すLC-MS解析結果におけるm/zは870.7±0.5であった。さらに、図7(A)に示すように、1mM GSHのみの存在下またはGSHとGSTA1との共存下においてPs-DCTGの蛍光強度に変化は見られなかった。一方、GSHとGSTM1との共存下、およびGSHとGSTP1との共存下による反応初速度はそれぞれ3.7および12.1であった。その差は約3倍程度であり、Ps-TGと比較すると弱いもののPs-DCTGもまたGSTP1選択性を示すことが明らかとなった。なお、図7に示す測定における励起/蛍光波長は505/525nmとした。 (Ps-DCTG)
Subsequently, Ps-DCTG (compound (9)) was also evaluated in the same manner as described above, and the same results as Ps-TG (compound (8)) were obtained (FIG. 6 (A) to FIG. 6). (D) and (A) and (B) of FIG. Here, the fluorescence quantum yields before and after the reaction calculated from the fluorescence spectrum shown in FIG. 6 (B) are 0.022 and 0.851, respectively, and Ps-DCTG is about 40 times the fluorescence intensity before and after the reaction. Showed an increase. The m / z in the LC-MS analysis result shown in FIG. 6 (D) was 870.7 ± 0.5. Furthermore, as shown in FIG. 7A, no change was observed in the fluorescence intensity of Ps-DCTG in the presence of 1 mM GSH alone or in the presence of GSH and GSTA1. On the other hand, the initial reaction rates in the presence of GSH and GSTM1 and in the presence of GSH and GSTP1 were 3.7 and 12.1, respectively. The difference was about 3 times, and it was revealed that Ps-DCTG also showed GSTP1 selectivity although it was weaker than Ps-TG. The excitation / fluorescence wavelength in the measurement shown in FIG. 7 was set to 505/525 nm.
ここで、Ps-TGおよびPs-DCTGのそれぞれに対する各種GSTの比活性(Specific activity)を測定した結果を下記の表1に示す。
Here, the results of measuring specific activities (specific activities) of various GSTs with respect to each of Ps-TG and Ps-DCTG are shown in Table 1 below.

[蛍光プローブのGSHおよび各種還元活性種に対する反応性の評価(1)]
(Ps-TGのGSHに対する反応性)
従来のプローブ(DNAF-1,2、DNAT-Meおよび3,4-DNADCF)は、その反応性の高さゆえ、GSTP1の非存在下においてもGSHと非酵素的に反応し、蛍光強度の上昇を起こす。そこで、本実験では、このような特性がPs-TGにおいて改善しているかどうかを確かめるために、Ps-TGとGSHとの反応性を評価した。 [Evaluation of reactivity of fluorescent probe to GSH and various reducing active species (1)]
(Reactivity of Ps-TG to GSH)
Conventional probes (DNAF-1, 2, DNAT-Me and 3,4-DNADCF) react non-enzymatically with GSH even in the absence of GSTP1 due to their high reactivity, and increase in fluorescence intensity Wake up. Therefore, in this experiment, the reactivity of Ps-TG and GSH was evaluated in order to confirm whether or not such characteristics were improved in Ps-TG.
具体的には、2μMのPs-TGを100mMリン酸バッファー(pH7.4;DMSO 0.1%を共溶媒として含む)に溶解し、異なる濃度のGSH(0.625~20mM)の存在下、室温(25℃)にて30分間反応させた。そして、反応後の蛍光強度をマイクロプレートリーダーで測定した。本実験における励起/蛍光波長は490/510nmとし、ポジティブコントロール(GSH/GSTP1)として、2.0μg/mL GSTP1-1と反応させた。また、ネガティブコントロール(None)としては、GSTP1もGSHも添加せずに同様の実験を行った。なお、本実験はマルチウェルプレートリーダー(SH-9000、コロナ電気株式会社)を用いて行った。
Specifically, 2 μM Ps-TG was dissolved in 100 mM phosphate buffer (pH 7.4; DMSO 0.1% included as a co-solvent), and in the presence of different concentrations of GSH (0.625 to 20 mM), The reaction was allowed to proceed for 30 minutes at room temperature (25 ° C.). And the fluorescence intensity after reaction was measured with the microplate reader. In this experiment, the excitation / fluorescence wavelength was 490/510 nm, and it was reacted with 2.0 μg / mL GSTP1-1 as a positive control (GSH / GSTP1). As a negative control (None), the same experiment was performed without adding GSTP1 or GSH. This experiment was performed using a multiwell plate reader (SH-9000, Corona Electric Co., Ltd.).
結果を図8に示す。図8に示すように、Ps-TGは、細胞内の生理的濃度(0.5~10mM)を超える濃度のGSHともほとんど反応しないことがわかる。これは、Ps-TGの蛍光強度の上昇には、GSH存在下でのGSTP1の活性が必要であることを意味する。
The results are shown in FIG. As shown in FIG. 8, it can be seen that Ps-TG hardly reacts with GSH at a concentration exceeding the intracellular physiological concentration (0.5 to 10 mM). This means that the activity of GSTP1 in the presence of GSH is required to increase the fluorescence intensity of Ps-TG.
(Ps-TGの各種還元活性種に対する反応性)
細胞内には、ニトロ基との反応性があることが予想される酸化還元活性種が多数存在している。そこで、本実験では、これらの酸化還元活性種およびその関連物質について、Ps-TGとの反応性を評価した。 (Reactivity of Ps-TG to various reducing active species)
There are many redox-active species that are expected to be reactive with nitro groups in cells. Therefore, in this experiment, the reactivity with Ps-TG was evaluated for these redox active species and related substances.
具体的には、2μMのPs-TGを100mMリン酸バッファー(pH7.4;DMSO 0.1%を共溶媒として含む)に溶解し、1mMの様々な酸化還元活性種の存在下、室温(25℃)にて30分間反応させた。その後、反応後の蛍光強度をマイクロプレートリーダーで測定した。ここで、酸化還元活性種としては、ジチオスレイトール(DTT)、システイン、2-メルカプトエタノール(βME)、トリスルフィドナトリウム(Na2S3)、還元型および酸化型ニコチンアミドアデニンジヌクレオチド(NADHおよびNAD+)、還元型および酸化型ニコチンアミドアデニンジヌクレオチドリン酸(NADPHおよびNADP+)、アスコルビン酸(AA)を用いた。本実験における励起/蛍光波長は490/510nmとし、ポジティブコントロール(GSH/GSTP1)として、2.0μg/mlGSTP1-1と反応させた。また、ネガティブコントロール(None)としては、GSTP1もGSHも添加せずに同様の実験を行った。なお、本実験はマルチウェルプレートリーダー(SH-9000、コロナ電気株式会社)を用いて行った。
Specifically, 2 μM Ps-TG was dissolved in 100 mM phosphate buffer (pH 7.4; DMSO 0.1% was included as a cosolvent), and room temperature (25% in the presence of 1 mM of various redox active species). (C) for 30 minutes. Thereafter, the fluorescence intensity after the reaction was measured with a microplate reader. Here, the redox active species include dithiothreitol (DTT), cysteine, 2-mercaptoethanol (βME), sodium trisulfide (Na 2 S 3 ), reduced and oxidized nicotinamide adenine dinucleotide (NADH and NAD + ), reduced and oxidized nicotinamide adenine dinucleotide phosphate (NADPH and NADP + ), ascorbic acid (AA) were used. In this experiment, the excitation / fluorescence wavelength was 490/510 nm, and it was reacted with 2.0 μg / ml GSTP1-1 as a positive control (GSH / GSTP1). As a negative control (None), the same experiment was performed without adding GSTP1 or GSH. This experiment was performed using a multiwell plate reader (SH-9000, Corona Electric Co., Ltd.).
結果を図9に示す。図9に示すように、Ps-TGは、上記で示した酸化還元活性種とはほとんど反応しないことがわかる。このことから、Ps-TGは酸化還元活性種との反応による非特異的な蛍光強度の上昇を起こす恐れが少ない蛍光プローブであるといえる。
The results are shown in FIG. As shown in FIG. 9, it can be seen that Ps-TG hardly reacts with the redox active species shown above. From this, it can be said that Ps-TG is a fluorescent probe that is less likely to cause non-specific increase in fluorescence intensity due to reaction with redox active species.
[細胞イメージング(1)]
上記で作製した2種類の蛍光プローブ(Ps-TG、Ps-DCTG)を培養細胞へ適用し、細胞内においてGSTP1活性を検出することが可能か否かを調べた。なお、蛍光プローブの評価には内在的なGSTP1の発現がほとんど見られないヒト乳がん由来細胞であるMCF-7細胞を用いた。また、MCF-7細胞および後述するHT-1080細胞については、いずれも10%ウシ胎児血清(FBS)および1%ペニシリン-ストレプトマイシン-グルタミンを含むダルベッコ改変イーグル培地(DMEM)中、37℃にて5%CO2条件下で培養し、3~4日に1回継代しつつ培養した。 [Cell imaging (1)]
The two types of fluorescent probes (Ps-TG, Ps-DCTG) prepared above were applied to cultured cells, and it was examined whether it was possible to detect GSTP1 activity in the cells. For the evaluation of the fluorescent probe, MCF-7 cells, which are human breast cancer-derived cells in which the endogenous GSTP1 expression is hardly observed, were used. For MCF-7 cells and HT-1080 cells described later, 5% at 37 ° C. in Dulbecco's modified Eagle medium (DMEM) containing 10% fetal bovine serum (FBS) and 1% penicillin-streptomycin-glutamine. The cells were cultured under% CO 2 conditions and cultured while being passaged once every 3 to 4 days.
本実験ではまず、MCF-7細胞を35mmガラスボトムディッシュ(松波硝子工業株式会社)または8-ウェルチャンバー(IWAKI)に3.0×10⁵細胞/ディッシュまたは3.3×104細胞/ウェルとなるようにそれぞれ播種した。そして細胞が接着した後に、N末端が3xFLAGタグ化されたGSTP1をコードするcDNA(3xFLAG-GSTP1)が挿入された発現ベクターpIRES2-DsRed Express2/3xFLAG-GSTP1をトランスフェクション試薬Fugene6(プロメガ株式会社)により細胞内へ導入し、24時間後以降に実験に使用した。なお、pIRES2-DsRed Express2/3xFLAG-GSTP1ベクターでは、CMVプロモーターの下流において転写される1本のmRNAが3xFLAG-GSTP1およびDsRed Express2の両者のmRNA配列をもつ。そして、両配列の間にはInternal ribosomal entry site(IRES) が存在し、3xFLAG-GSTP1およびDsRed Express2のそれぞれのタンパク質が発現する。すなわち、当該ベクターを用いることにより、赤色蛍光タンパク質であるDsRed Express2が発する蛍光によって3xFLAG-GSTP1の発現を確認することができるのである。
In this experiment, first, MCF-7 cells were placed in a 35 mm glass bottom dish (Matsunami Glass Industrial Co., Ltd.) or an 8-well chamber (IWAKI) at 3.0 × 10 5 cells / dish or 3.3 × 10 4 cells / well. Each sowing was carried out. After the cells adhere, the expression vector pIRES2-DsRed Express2 / 3xFLAG-GSTP1 in which a cDNA (3xFLAG-GSTP1) encoding GSTP1 with 3xFLAG tag at the N-terminus is inserted is introduced by transfection reagent Fugene 6 (Promega Corporation). The cells were introduced into the cells and used for experiments after 24 hours. In the pIRES2-DsRed Express2 / 3xFLAG-GSTP1 vector, one mRNA transcribed downstream of the CMV promoter has both 3xFLAG-GSTP1 and DsRed Express2 mRNA sequences. Between these sequences, there is an internal ribosomal entry site (IRES), and 3xFLAG-GSTP1 and DsRed Express2 proteins are expressed. That is, by using this vector, the expression of 3xFLAG-GSTP1 can be confirmed by the fluorescence emitted by the red fluorescent protein DsRed Express2.
次いで、上記発現ベクターが導入されたMCF-7細胞にプローブを負荷することによりイメージング実験を行った。具体的には、上記ベクターが導入されたMCF-7細胞に対し、2.5μMのPs-TGまたはPs-DCTGを37℃、5%CO2条件下で5分間インキュベーションして、その後に共焦点レーザー走査型顕微鏡下で観察を行った。なお、本実験において、共焦点レーザー走査型顕微鏡としてはFLUOVIEW FV10i-DOC(オリンパス株式会社製)を用い、蛍光プローブの蛍光は波長473nmのLDレーザーにより励起させ、DsRed Express2の蛍光は波長584nmのLDレーザーにより励起させて、対応する蛍光スペクトルにおける蛍光画像を取得した。
Next, an imaging experiment was performed by loading a probe onto MCF-7 cells into which the expression vector was introduced. Specifically, 2.5 μM Ps-TG or Ps-DCTG was incubated for 5 minutes at 37 ° C. under 5% CO 2 on MCF-7 cells into which the above-described vector was introduced, and then confocal. Observation was performed under a laser scanning microscope. In this experiment, FLUOVIEW FV10i-DOC (manufactured by Olympus Corporation) was used as the confocal laser scanning microscope, the fluorescence of the fluorescent probe was excited by an LD laser having a wavelength of 473 nm, and the fluorescence of DsRed Express2 was an LD having a wavelength of 584 nm A fluorescence image in the corresponding fluorescence spectrum was obtained by excitation with a laser.
結果を図10に示す。ここで、図10の(A)および(C)はそれぞれ、Ps-TGおよびPs-DCTGの化学構造式である。また、図10の(B)および(D)はそれぞれ、各蛍光プローブを投与したMCF-7細胞のイメージング画像であり、左から蛍光プローブの蛍光;DsRedの蛍光;並びに、蛍光プローブの蛍光、DsRedの蛍光および白色像の重ね合わせ(Merge)を示すものである(スケールバーはいずれも20μmである)。図10に示すように、いずれの蛍光プローブを用いた場合であっても、DsRedの赤色蛍光を示す細胞では蛍光プローブ由来の緑色蛍光が観察された。これに対し、赤色蛍光を示さない細胞における緑色蛍光の強度は弱いものであった。このことから、GSTP1が発現した細胞において選択的に蛍光プローブの蛍光強度の上昇が起こっていることが示された。
The results are shown in FIG. Here, (A) and (C) in FIG. 10 are chemical structural formulas of Ps-TG and Ps-DCTG, respectively. 10 (B) and (D) are imaging images of MCF-7 cells to which each fluorescent probe was administered, respectively, from the left: fluorescence of the fluorescent probe; fluorescence of DsRed; and fluorescence of the fluorescent probe, DsRed (Merge) of the fluorescence and the white image (scale bars are both 20 μm). As shown in FIG. 10, regardless of which fluorescent probe was used, green fluorescence derived from the fluorescent probe was observed in cells showing red fluorescence of DsRed. On the other hand, the intensity of green fluorescence in cells that do not show red fluorescence was weak. This indicates that the fluorescence intensity of the fluorescent probe is selectively increased in cells in which GSTP1 is expressed.
ここで、図10に示す結果では、細胞内における蛍光強度が比較的小さく、細胞膜に強い蛍光が観察された。すなわち、いずれの蛍光プローブについても、細胞膜透過性がそれほど高くないことが示唆された。これは、生体内環境(pH7.4)においてこれらの蛍光プローブはアニオン性を示して十分な脂溶性を有しない結果、細胞膜を透過しにくいものと考えられた。
Here, in the results shown in FIG. 10, the fluorescence intensity in the cells was relatively small, and strong fluorescence was observed in the cell membrane. That is, it was suggested that none of the fluorescent probes has a high cell membrane permeability. This was considered that these fluorescent probes showed anionic property and did not have sufficient fat solubility in the in vivo environment (pH 7.4), and as a result, it was difficult to permeate the cell membrane.
[蛍光プローブの合成(2)]
続いて、上記で作製した蛍光プローブの細胞膜透過性を向上させることを目的として、さらなる誘導体化を試みた。ここでは具体的に、上記で作製した蛍光プローブ(Ps-TG、Ps-DCTG)をより脂溶性の高い化学構造へと改変すべく、蛍光団を構成するキサンテン環のフェノール性ヒドロキシ基をアセチル化した化合物を合成した(下記の反応スキーム2)。なお、Ps-TG(化合物(8))およびPs-DCTG(化合物(9))のそれぞれに対応するアセチル化化合物を、以下では「Ps-TAc」(化合物(10))および「Ps-DCTAc」(化合物(11))とも称する。 [Synthesis of fluorescent probe (2)]
Subsequently, further derivatization was attempted for the purpose of improving the cell membrane permeability of the fluorescent probe prepared above. Here, specifically, the phenolic hydroxy group of the xanthene ring constituting the fluorophore is acetylated in order to modify the fluorescent probe (Ps-TG, Ps-DCTG) prepared above into a more lipophilic chemical structure. Was synthesized (reaction scheme 2 below). The acetylated compounds corresponding to each of Ps-TG (compound (8)) and Ps-DCTG (compound (9)) are hereinafter referred to as “Ps-TAc” (compound (10)) and “Ps-DCTAc”. Also referred to as (compound (11)).
続いて、上記で作製した蛍光プローブの細胞膜透過性を向上させることを目的として、さらなる誘導体化を試みた。ここでは具体的に、上記で作製した蛍光プローブ(Ps-TG、Ps-DCTG)をより脂溶性の高い化学構造へと改変すべく、蛍光団を構成するキサンテン環のフェノール性ヒドロキシ基をアセチル化した化合物を合成した(下記の反応スキーム2)。なお、Ps-TG(化合物(8))およびPs-DCTG(化合物(9))のそれぞれに対応するアセチル化化合物を、以下では「Ps-TAc」(化合物(10))および「Ps-DCTAc」(化合物(11))とも称する。 [Synthesis of fluorescent probe (2)]
Subsequently, further derivatization was attempted for the purpose of improving the cell membrane permeability of the fluorescent probe prepared above. Here, specifically, the phenolic hydroxy group of the xanthene ring constituting the fluorophore is acetylated in order to modify the fluorescent probe (Ps-TG, Ps-DCTG) prepared above into a more lipophilic chemical structure. Was synthesized (

(化合物(10)の合成;9-(2-メチル-4-(5-(メチルスルホニル)-2-ニトロベンズアミド)フェニル)-3-オキソ-3H-キサンテン-6-イルアセテート(Ps-TAc))
(Synthesis of Compound (10); 9- (2-Methyl-4- (5- (methylsulfonyl) -2-nitrobenzamido) phenyl) -3-oxo-3H-xanthen-6-yl acetate (Ps-TAc) )

Ps-TG(8)(2.1mg,0.0039mmol)および塩化アセチル(0.6μL,0.008mmol)を懸濁させたテトラヒドロフラン2mLに対して、4℃条件下でN,N’-ジイソプロピルエチルアミン(DIEPA)(1.4μL,0.008mmol)を滴下し、氷上において2時間撹拌した。反応液に酢酸エチルを加えた後、有機層を1N塩酸で3回洗浄し、無水硫酸マグネシウムによって乾燥させた。減圧下、有機層を留去し、シリカゲルクロマトグラフィー(ヘキサン/酢酸エチル=1:2)によって精製して、目的化合物0.5mgを得た(収率22%)。
N, N′-diisopropylethylamine was added at a temperature of 4 ° C. to 2 mL of tetrahydrofuran in which Ps-TG (8) (2.1 mg, 0.0039 mmol) and acetyl chloride (0.6 μL, 0.008 mmol) were suspended. (DIEPA) (1.4 μL, 0.008 mmol) was added dropwise and stirred on ice for 2 hours. After adding ethyl acetate to the reaction solution, the organic layer was washed 3 times with 1N hydrochloric acid and dried over anhydrous magnesium sulfate. The organic layer was distilled off under reduced pressure and purified by silica gel chromatography (hexane / ethyl acetate = 1: 2) to obtain 0.5 mg of the target compound (yield 22%).
(化合物(10)の機器データ)
1H-NMR(400MHz,DMSO-d6)δ8.40(1H,d,J=8.7),8.39(1H,d,J=1.8,),8.31(1H,dd),7.80(1H,s,J=8.2),7.71(2H,m),7.50(1H,d,J=18),7.33(1H, d,J=8.2),7.12(1H,d,J=4.1),6.98(1H,d,J=9.6),6.49(1H,dd,J=9.6,1.8),6.27(1H,d,J=2.3),3.42(3H,s),2.32(3H,s),2.06(3H,s)
13C-NMR(100MHz,DMSO-d6)δ184.4,168.7,162.7,158.1,154.2,152.4,149.5,147.5,144.8,139.6,136.8,132.9,130.8,130.5,130.8,130.1,13.0,129.1,128.2,127.6,125.8,121.2,119.9,119.2,118.1,117.5,110.5,105.2,29.0,20.9,19.5
HRMS(ESI-TOF)m/z Found 587.1128 [M+H]+,calculated 587.1124 for C30H23N2O9S(+0.4 mmu)。 (Equipment data of compound (10))
1 H-NMR (400 MHz, DMSO-d 6 ) δ 8.40 (1H, d, J = 8.7), 8.39 (1H, d, J = 1.8,), 8.31 (1H, dd ), 7.80 (1H, s, J = 8.2), 7.71 (2H, m), 7.50 (1H, d, J = 18), 7.33 (1H, d, J = 8) .2), 7.12 (1H, d, J = 4.1), 6.98 (1H, d, J = 9.6), 6.49 (1H, dd, J = 9.6, 1.. 8), 6.27 (1H, d, J = 2.3), 3.42 (3H, s), 2.32 (3H, s), 2.06 (3H, s)
13 C-NMR (100 MHz, DMSO-d 6 ) δ 184.4, 168.7, 162.7, 158.1, 154.2, 152.4, 149.5, 147.5, 144.8, 139. 6, 136.8, 132.9, 130.8, 130.5, 130.8, 130.1, 13.0, 129.1, 128.2, 127.6, 125.8, 121.2, 119.9, 119.2, 118.1, 117.5, 110.5, 105.2, 29.0, 20.9, 19.5
HRMS (ESI-TOF) m / z Found 587.1128 [M + H] + , calculated 587.1124 for C 30 H 23 N 2 O 9 S (+0.4 mmu).
(化合物(11)の合成;2,7-ジクロロ-9-(2-メチル-4-(5-(メチルスルホニル)-2-ニトロベンズアミド)フェニル)-3-オキソ-3H-キサンテン-6-イルアセテート(Ps-DCTAc))
(Synthesis of Compound (11); 2,7-Dichloro-9- (2-methyl-4- (5- (methylsulfonyl) -2-nitrobenzamido) phenyl) -3-oxo-3H-xanthen-6-yl Acetate (Ps-DCTAc))

Ps-DCTG(5.1mg,0.0083mmol)および塩化アセチル(1.2μl,0.017mmol)を含むテトラヒドロフラン2mLに対して、N,N’-ジイソプロピルエチルアミン(3.0μL,0.017mmol)を氷上で加え、4℃にて2時間撹拌した。反応溶液に酢酸エチルを加えた後、有機層を1N塩酸で3回、飽和食塩水で1回洗浄し、無水硫酸マグネシウムで乾燥させた。シリカゲルクロマトグラフィー(ヘキサン/酢酸エチル=1:2)により精製して、目的化合物(Ps-DCTAc)1.2mgを得た(22%)。
To 2 mL of tetrahydrofuran containing Ps-DCTG (5.1 mg, 0.0083 mmol) and acetyl chloride (1.2 μl, 0.017 mmol), N, N′-diisopropylethylamine (3.0 μL, 0.017 mmol) was added on ice. And stirred at 4 ° C. for 2 hours. After adding ethyl acetate to the reaction solution, the organic layer was washed 3 times with 1N hydrochloric acid and once with saturated brine, and dried over anhydrous magnesium sulfate. Purification by silica gel chromatography (hexane / ethyl acetate = 1: 2) gave 1.2 mg (22%) of the target compound (Ps-DCTAc).
(化合物(11)の機器データ)
1H-NMR(400MHz,DMSO-d6)δ8.42(1H,d,J=1.6),8.40(1H,s),8.33(1H,m),7.84(2H,s),7.77(1H,d,J=8.0),7.36(1H,d,J=8.4),7.14(2H,d,J=8.8),6.53(1H,s),3.42(3H,s),2.39(3H,s),2.09(3H,s)
13C-NMR(100MHz,DMSO-d6)δ172.5,168.4,163.3,158.1,151.6,150.0,148.2,145.3,130.7,130.5,128.8,128.3,128.2,126.3,123.3,121.8,120.9,118.0,113.9,105.6,60.3,43.4,21.6,21.3,20.1
HRMS(ESI-TOF)m/z Found 655.0349 [M+H]+,caluculated 655.0345 for C30H21N2O9SCl2 (+0.4 mmu)。 (Equipment data of compound (11))
1 H-NMR (400 MHz, DMSO-d 6 ) δ 8.42 (1H, d, J = 1.6), 8.40 (1H, s), 8.33 (1H, m), 7.84 (2H , S), 7.77 (1H, d, J = 8.0), 7.36 (1H, d, J = 8.4), 7.14 (2H, d, J = 8.8), 6 .53 (1H, s), 3.42 (3H, s), 2.39 (3H, s), 2.09 (3H, s)
13 C-NMR (100 MHz, DMSO-d 6 ) δ 172.5, 168.4, 163.3, 158.1, 151.6, 150.0, 148.2, 145.3, 130.7, 130. 5,128.8,128.3,128.2,126.3,123.3,121.8,120.9,118.0,113.9,105.6,60.3,43.4 21.6, 21.3, 20.1
HRMS (ESI-TOF) m / z Found 655.0349 [M + H] + , calibrated 655.0345 for C 30 H 21 N 2 O 9 SCl 2 (+0.4 mmu).
[蛍光プローブの分光学的特性およびクラス選択性の評価(2)]
上記で合成したアセチル化蛍光プローブPs-TAc(化合物(10))およびPs-DCTAc(化合物(11))の分光学的特性を評価した。 [Evaluation of spectroscopic characteristics and class selectivity of fluorescent probe (2)]
The spectroscopic characteristics of the acetylated fluorescent probes Ps-TAc (compound (10)) and Ps-DCTAc (compound (11)) synthesized above were evaluated.
具体的には、まず、Ps-TAc(化合物(10))について、上記と同様の手法により吸収スペクトルを測定した。その結果、図11(A)に記載の「反応前」の吸収スペクトルで示すように、Ps-TAcは波長450nmおよび490nmにピークをもつ吸収スペクトルを示した。これは、蛍光団を構成するキサンテン環のフェノール性ヒドロキシ基がアセチル基によって保護されているためであると考えられる。
Specifically, first, an absorption spectrum of Ps-TAc (compound (10)) was measured by the same method as described above. As a result, Ps-TAc showed absorption spectra having peaks at wavelengths of 450 nm and 490 nm, as shown by the “pre-reaction” absorption spectrum shown in FIG. This is considered to be because the phenolic hydroxy group of the xanthene ring constituting the fluorophore is protected by an acetyl group.
続いて、Ps-TAcを10μMの濃度で含む100mMリン酸バッファー(pH7.4;DMSO0.1%を共溶媒として含む)溶液に、10μg/mLのブタ肝臓エステラーゼ(PLE)または1mMの還元型グルタチオン(GSH)を添加し、室温(25℃)にて撹拌しながら60分間反応させた。ここで、PLEを添加した系について反応後に測定した吸収スペクトルが図11(A)の「反応後」のスペクトルである。また、GSH添加系およびPLE添加系の双方について、反応の間、波長490nmでの吸光度を経時的に記録した。これにより得られた結果を図11(B)に示す。図11(B)に示すように、ブタ肝臓エステラーゼ(PLE)の添加によってPs-TAcの吸収スペクトルは速やかに変化し、60分経過後には上述した図4(A)と同様の吸収スペクトルを示した。このことから、蛍光団を構成するキサンテン環のフェノール性ヒドロキシ基とアセチル基とからなるエステル結合がPLEの作用によって加水分解され、フェノール性ヒドロキシ基が露出した(すなわち、Ps-TAcはPs-TCへと変換された)ものと考えられる。また、図11(B)に示すように、この変化は細胞内に比較的高濃度で(通常は1~10mM程度の量で)存在する還元型GSHの作用(エステル結合の開裂作用)によっても進行することが確認された。このため、本発明に係る一般式(2)で表される蛍光プローブのうち、フェノール性ヒドロキシ基がアシル化されたもの(置換基R2がアシル基であるもの;Ps-TAcやPs-DCTAcなど)は、細胞内エステラーゼ活性が低い細胞においても、還元型GSHの作用によって酵素活性非依存的に、対応するフェノール性ヒドロキシ基含有蛍光プローブ(置換基R2が水素原子であるもの)へと変換されることが期待される。なお、Ps-DCTAcについても同様の実験を行った結果、図11の(A)および(B)に示すのと同様の結果が得られた。
Subsequently, 10 μg / mL porcine liver esterase (PLE) or 1 mM reduced glutathione was added to a 100 mM phosphate buffer (pH 7.4; DMSO 0.1% co-solvent) solution containing Ps-TAc at a concentration of 10 μM. (GSH) was added and allowed to react for 60 minutes with stirring at room temperature (25 ° C.). Here, the absorption spectrum measured after the reaction for the system to which PLE was added is the spectrum after “reaction” in FIG. Also, for both the GSH addition system and the PLE addition system, the absorbance at a wavelength of 490 nm was recorded over time during the reaction. The results obtained thereby are shown in FIG. As shown in FIG. 11 (B), the absorption spectrum of Ps-TAc changes rapidly by addition of porcine liver esterase (PLE), and after 60 minutes, the same absorption spectrum as in FIG. 4 (A) described above is shown. It was. From this, the ester bond composed of the phenolic hydroxy group and acetyl group of the xanthene ring constituting the fluorophore was hydrolyzed by the action of PLE to expose the phenolic hydroxy group (that is, Ps-TAc is Ps-TC). It is thought that it was converted to As shown in FIG. 11B, this change is also caused by the action of reduced GSH (ester bond cleavage action) present in cells at a relatively high concentration (usually in an amount of about 1 to 10 mM). Confirmed to proceed. Therefore, among the fluorescent probes represented by the general formula (2) according to the present invention, those in which the phenolic hydroxy group is acylated (substituent R 2 is an acyl group; Ps-TAc or Ps-DCTAc) Etc.), even in cells with low intracellular esterase activity, the corresponding phenolic hydroxy group-containing fluorescent probe (substituent R 2 is a hydrogen atom) becomes independent of the enzyme activity by the action of reduced GSH. Expected to be converted. As a result of conducting the same experiment for Ps-DCTAc, the same results as shown in FIGS. 11A and 11B were obtained.
以上の結果から、Ps-TAcおよびPs-DCTAcは、生細胞に添加されると、図12に示すような機構によってまず細胞膜を透過して細胞内へ取り込まれ、その後に細胞内に存在するエステラーゼの加水分解作用を受けて脱アセチル化されて、対応するアルコール(Ps-TGやPs-DCTG)へと変換される。そして、Ps-TGやPs-DCTGはGSTP1選択的な蛍光プローブであることから、取り込まれた細胞内にGSTP1が存在すれば、その作用によりグルタチオン化を受けて強い蛍光を発するものと推定される。
From the above results, when Ps-TAc and Ps-DCTAc are added to living cells, they are first permeated through the cell membrane by the mechanism shown in FIG. 12 and then taken into the cells, and then the esterase present in the cells. Is hydrolyzed and deacetylated, and converted to the corresponding alcohol (Ps-TG or Ps-DCTG). Since Ps-TG and Ps-DCTG are GSTP1-selective fluorescent probes, it is presumed that if GSTP1 is present in the incorporated cells, it will undergo glutathione action and emit strong fluorescence. .
[細胞イメージング(2)]
上記で作製した2種類のアセチル化蛍光プローブ(Ps-TAc、Ps-DCTAc)について、上述した「細胞イメージング(1)」と同様の発現ベクターpIRES2-DsRed Express2を用いた手法により3種類のGST分子種(GSTP1、GSTM1、GSTA1)のそれぞれを発現させたMCF-7細胞へ適用した際の細胞イメージングを行った。 [Cell imaging (2)]
For the two types of acetylated fluorescent probes (Ps-TAc, Ps-DCTAc) prepared above, three types of GST molecules were obtained by a technique using the expression vector pIRES2-DsRed Express2 similar to “Cell Imaging (1)” described above. Cell imaging was performed when applied to MCF-7 cells in which each of the species (GSTP1, GSTM1, GSTA1) was expressed.
具体的には、上述した発現ベクターpIRES2-DsRed Express2を用いて3種類のGST分子種(GSTP1、GSTM1、GSTA1)のそれぞれをN末端が3xFLAGタグ化されたcDNAとして発現させたMCF-7細胞に対し、2.5μMのPs-TAcまたはPs-DCTAcを37℃、5%CO2条件下で5分間インキュベーションした後に、共焦点レーザー走査型顕微鏡を用いて観察を行った。その結果得られた画像から、GSTの発現を示すDsRed発現細胞(赤色蛍光あり)を+、非発現細胞を-として、それぞれの細胞における蛍光プローブ由来の緑色蛍光の蛍光強度を算出した。
Specifically, using the above-described expression vector pIRES2-DsRed Express2, each of three types of GST molecular species (GSTP1, GSTM1, GSTA1) was expressed in MCF-7 cells expressed as 3xFLAG-tagged cDNA at the N-terminus. In contrast, 2.5 μM Ps-TAc or Ps-DCTAc was incubated at 37 ° C. under 5% CO 2 for 5 minutes, and then observed using a confocal laser scanning microscope. From the images obtained as a result, the fluorescence intensity derived from the fluorescent probe in each cell was calculated from DsRed expressing cells (with red fluorescence) showing GST expression as + and non-expressing cells as −.
結果を図13に示す。ここで、図13の(A)はPs-TAcの化学構造式であり、(B)はイメージング画像(スケールバーはいずれも40μmである)であり、(C)は各種GSTが発現しているDsRedの発現細胞(+)および非発現細胞(-)における緑色蛍光の蛍光強度を比較したグラフである。同様に、図13の(D)はPs-DCTAcの化学構造式であり、(E)はイメージング画像(スケールバーはいずれも40μmである)であり、(F)は各種GSTが発現しているDsRedの発現細胞(+)および非発現細胞(-)における緑色蛍光の蛍光強度を比較したグラフである。
The results are shown in FIG. Here, (A) in FIG. 13 is a chemical structural formula of Ps-TAc, (B) is an imaging image (the scale bars are all 40 μm), and (C) shows various GSTs. It is the graph which compared the fluorescence intensity of the green fluorescence in the expression cell (+) and non-expression cell (-) of DsRed. Similarly, (D) in FIG. 13 is a chemical structural formula of Ps-DCTAc, (E) is an imaging image (the scale bars are all 40 μm), and (F) expresses various GSTs. It is the graph which compared the fluorescence intensity of the green fluorescence in the expression cell (+) and non-expression cell (-) of DsRed.
図13に示すように、GSTP1発現細胞において強い緑色蛍光が検出されたことから、Ps-TAcおよびPs-DCTAcは細胞内におけるGSTP1活性を選択的に検出していることが示された。なお、Ps-TAcとPs-DCTAcとのシグナル/バックグラウンド比を比較すると、Ps-TAcの方が高い結果となった。したがって、以下の検討では、Ps-TAcを用いて実験を行った。
As shown in FIG. 13, strong green fluorescence was detected in GSTP1-expressing cells, indicating that Ps-TAc and Ps-DCTAc selectively detected GSTP1 activity in the cells. When the signal / background ratio between Ps-TAc and Ps-DCTAc was compared, Ps-TAc gave a higher result. Therefore, in the following examination, an experiment was conducted using Ps-TAc.
続いて、細胞質型GSTおよびミトコンドリア型GSTの各種分子種をMCF-7細胞に発現させ、蛍光プローブ(Ps-TAc)のGSTP1選択性を評価した。具体的には、上記と同様の手法により、異なる8クラス18種類のGSTのそれぞれを組み込んだpIRES2-DsRed Express2/3xFLAG-GSTをMCF-7細胞へトランスフェクションした。
Subsequently, various molecular species of cytoplasmic GST and mitochondrial GST were expressed in MCF-7 cells, and the GSTP1 selectivity of the fluorescent probe (Ps-TAc) was evaluated. Specifically, MCF-7 cells were transfected with pIRES2-DsRed Express2 / 3xFLAG-GST incorporating each of eight different 18 classes of GST by the same method as described above.
次いで、各GST分子種の発現をウエスタンブロッティングにより確認した。具体的には、等量のタンパク質(GST発現MCF-7細胞由来)をSDS-ポリアクリルアミド(PAGE)ゲル電気泳動(12.5%ポリアクリルアミド)によって分離した後、ポリフッ化ビニリデン(PVDF)メンブレンに転写した。そして、0.1%ポンソーS染色液(株式会社ビークル製)にてPVDFメンブレン上へのタンパク転写を確認した後、3%スキムミルクを含むTBS-T(0.1%Tween-20を含むトリス緩衝液)中、室温にて1時間振盪した。TBS-Tで3回(各5分間)洗浄した後、一次抗体として抗FLAG-M2マウスIgG抗体(希釈倍率1:5000、シグマアルドリッチジャパン合同会社)または抗β-アクチンウサギIgG抗体(希釈倍率1:4000、生物医学研究所)を含むTBS-T(5%ウシ血清アルブミン(BSA)を含む)中、4℃にて一晩振盪した。TBS-Tで3回(各5分間)洗浄して余分な抗体を取り除いた後、二次抗体として西洋ワサビペルオキシダーゼ(HRP)結合抗マウスIgG抗体または西洋ワサビペルオキシダーゼ(HRP)結合抗ウサギIgG抗体(両者ともに希釈倍率1:2500、プロメガ株式会社)を含むTBS-T(5%BSA含む)中にて室温で1時間振盪した。目的タンパク質の検出は、ルミノールおよび過酸化水素を含む発光試薬を用いた化学発光法により、冷却CCDカメラシステムImageQuant LAS4000(富士フイルム株式会社製)を用いて行った。
Next, the expression of each GST molecular species was confirmed by Western blotting. Specifically, an equal amount of protein (derived from GST-expressing MCF-7 cells) was separated by SDS-polyacrylamide (PAGE) gel electrophoresis (12.5% polyacrylamide) and then applied to a polyvinylidene fluoride (PVDF) membrane. Transcribed. After confirming protein transfer onto the PVDF membrane with 0.1% Ponceau S staining solution (manufactured by Vehicle Corporation), TBS-T containing 3% skim milk (Tris buffer containing 0.1% Tween-20) In the liquid) at room temperature for 1 hour. After washing 3 times with TBS-T (5 minutes each), anti-FLAG-M2 mouse IgG antibody (dilution ratio 1: 5000, Sigma-Aldrich Japan GK) or anti-β-actin rabbit IgG antibody (dilution ratio 1) was used as the primary antibody. : 4000, Laboratory of Biomedical Research) (in 5% bovine serum albumin (BSA)) and shaken overnight at 4 ° C. After washing with TBS-T three times (each for 5 minutes) to remove excess antibody, horseradish peroxidase (HRP) -conjugated anti-mouse IgG antibody or horseradish peroxidase (HRP) -conjugated anti-rabbit IgG antibody (secondary antibody) Both were shaken at room temperature for 1 hour in TBS-T (containing 5% BSA) containing a dilution ratio of 1: 2500 (Promega Corporation). The target protein was detected using a cooled CCD camera system ImageQuant LAS4000 (manufactured by FUJIFILM Corporation) by a chemiluminescence method using a luminescent reagent containing luminol and hydrogen peroxide.
上記のようにして行ったウエスタンブロッティングの結果を図14に示す。図14に示すように、いずれのGST分子種を発現させたMCF-7細胞においても、目的のGSTタンパク質が発現していることが確認された。
FIG. 14 shows the result of Western blotting performed as described above. As shown in FIG. 14, it was confirmed that the target GST protein was expressed in MCF-7 cells in which any GST molecular species was expressed.
続いて、DsRed Express2の赤色蛍光を示す細胞において確かにGSTタンパク質が発現していることを確かめるため、蛍光免疫染色を行った。具体的には、各GST分子種を発現させたMCF-7細胞を4%パラホルムアルデヒドPBS溶液中、室温にて15分間固定した。その後、0.1%TritonX-100を含むPBS溶液で30分間処理することにより、細胞膜透過処理を施した。そして、抗体バッファー(1%ウシ血清アルブミン(BSA)、0.1%TritonX-100および0.1%アジ化ナトリウムを含むPBS)中、室温にて1時間インキュベーションした後、抗FLAG-M2マウスIgG抗体(希釈倍率1:500、シグマアルドリッチジャパン合同会社)を加え、4℃にて一晩インキュベーションした。細胞をPBSで5分間インキュベートして洗浄して、余分な一次抗体を除去した(合計5回)。次いで、細胞をAlexaFluor(登録商標)647ラベルされた抗マウスIgGヤギ抗体(希釈倍率1:1000、アブカム株式会社)を含む抗体バッファー中、室温にて1時間インキュベーションした後、PBSで5分間インキュベートして洗浄して、余分な二次抗体を除去した(合計5回)。そして、細胞を褪色防止用封入剤であるProLong Gold(登録商標)Antifade Reagent(4’,6-ジアミジノ-2-フェニルインドール(DAPI)含有)(サーモフィッシャーサイエンティフィック社)に封入した。そして、共焦点レーザー走査型顕微鏡下で観察を行った。なお、本実験において、共焦点レーザー走査型顕微鏡としてはFLUOVIEW FV1000(オリンパス株式会社製)を用いた。また、本実験において、DAPI、DsRedおよびAlexaFluor647の各蛍光色素について、それぞれ405nm、583nm、および635nmの波長のレーザー光を用いて励起し、対応したフィルタセットを用いて検出を行った。
Subsequently, fluorescent immunostaining was performed in order to confirm that the GST protein was certainly expressed in cells showing red fluorescence of DsRed Express2. Specifically, MCF-7 cells expressing each GST molecular species were fixed in 4% paraformaldehyde PBS solution at room temperature for 15 minutes. Thereafter, the membrane was permeabilized by treatment with a PBS solution containing 0.1% Triton X-100 for 30 minutes. After incubation for 1 hour at room temperature in antibody buffer (PBS containing 1% bovine serum albumin (BSA), 0.1% Triton X-100 and 0.1% sodium azide), anti-FLAG-M2 mouse IgG Antibody (dilution ratio 1: 500, Sigma-Aldrich Japan LLC) was added and incubated overnight at 4 ° C. Cells were incubated with PBS for 5 minutes and washed to remove excess primary antibody (total 5 times). Next, the cells were incubated for 1 hour at room temperature in an antibody buffer containing AlexaFluor (registered trademark) 647-labeled anti-mouse IgG goat antibody (dilution ratio 1: 1000, Abcam Inc.), and then incubated with PBS for 5 minutes. To remove excess secondary antibody (5 times in total). Then, the cells were encapsulated in ProLong Gold (registered trademark) Antifade Reagent (containing 4 ', 6-diamidino-2-phenylindole (DAPI)) (Thermo Fisher Scientific), which is an antifade encapsulant. And it observed under the confocal laser scanning microscope. In this experiment, FLUOVIEW FV1000 (manufactured by Olympus Corporation) was used as the confocal laser scanning microscope. Further, in this experiment, the DAPI, DsRed, and AlexaFluor 647 fluorescent dyes were excited using laser beams having wavelengths of 405 nm, 583 nm, and 635 nm, respectively, and detection was performed using a corresponding filter set.
結果を図15に示す。ここで、図15において、「DAPI」、「DsRed」、「Alexa647」はそれぞれの蛍光色素による発光を撮影した画像であり、「Merge」はこれらの重ね合わせ画像である。図15に示すように、赤色蛍光を示したすべての細胞において3xFLAG-GSTが発現していることが確認された。
The results are shown in FIG. Here, in FIG. 15, “DAPI”, “DsRed”, and “Alexa647” are images obtained by photographing light emission by the respective fluorescent dyes, and “Merge” is an overlapping image of these. As shown in FIG. 15, it was confirmed that 3xFLAG-GST was expressed in all the cells showing red fluorescence.
続いて、上記で各種GST分子種のいずれかを発現させたMCF-7細胞に対してPs-TAcをインキュベーション後、落射蛍光顕微鏡を用いて蛍光イメージングを行った。具体的には、各種GST分子種のそれぞれを3xFLAGタグ化されたcDNAとして発現させたMCF-7細胞に対し、2.5μMのPs-TAcを37℃、5%CO2条件下で5分間インキュベーションした後に、落射型蛍光顕微鏡IX80(オリンパス株式会社)を用いた観察によって行った。なお、プローブ由来の蛍光およびDsRed由来の蛍光は、それぞれU-MNIBAフィルタセット(励起波長:470~495nm、蛍光波長:510~550nm)およびU-MWIGフィルタセット(励起波長:530~550nm、蛍光波長:575nm以上)を用いて観察した。
Subsequently, Ps-TAc was incubated on MCF-7 cells expressing any of the various GST molecular species as described above, and then fluorescence imaging was performed using an epifluorescence microscope. Specifically, 2.5 μM Ps-TAc was incubated for 5 minutes at 37 ° C. and 5% CO 2 on MCF-7 cells expressing each of various GST molecular species as 3 × FLAG-tagged cDNA. After that, observation was performed using an epifluorescence microscope IX80 (Olympus Corporation). The fluorescence derived from the probe and the fluorescence derived from DsRed are respectively U-MNIBA filter set (excitation wavelength: 470 to 495 nm, fluorescence wavelength: 510 to 550 nm) and U-MWIG filter set (excitation wavelength: 530 to 550 nm, fluorescence wavelength). : 575 nm or more).
結果を図16に示す。ここで、図16の「FITC」は蛍光プローブ(Ps-TAc)由来の緑色蛍光の画像であり、「DsRed」はDsRed由来の赤色蛍光の画像であり、「Merge」はこれらの重ね合わせ画像である(スケールバーはいずれも20μmである)。また、GSTP1発現細胞の観察画像を拡大したものを図17(A)に示し、各画像における緑色蛍光の強度を各GST発現細胞間で定量化したグラフを図17(B)に示す(測定に用いた細胞数は20個である)。図16および図17に示すように、GSTP1発現細胞のみにおいて蛍光プローブ由来の緑色蛍光が観察され、その他のGST分子種を発現している細胞では緑色蛍光は観察されなかった。このことから、本発明に係る蛍光プローブ(Ps-TAc)は高いGTSP1選択性を示すことが確認された。
Results are shown in FIG. Here, “FITC” in FIG. 16 is an image of green fluorescence derived from a fluorescent probe (Ps-TAc), “DsRed” is an image of red fluorescence derived from DsRed, and “Merge” is an overlay image of these. Yes (both scale bars are 20 μm). In addition, an enlarged observation image of GSTP1-expressing cells is shown in FIG. 17A, and a graph in which the intensity of green fluorescence in each image is quantified between the GST-expressing cells is shown in FIG. The number of cells used is 20). As shown in FIGS. 16 and 17, green fluorescence derived from the fluorescent probe was observed only in the GSTP1-expressing cells, and no green fluorescence was observed in the cells expressing other GST molecular species. From this, it was confirmed that the fluorescent probe (Ps-TAc) according to the present invention exhibits high GTSP1 selectivity.
ところで、MCF-7細胞においてはGSTP1遺伝子のプロモーター領域がメチル化されており、これによってGSTP1の発現が低いことが知られている。そこで、DNAメチルトランスフェラーゼ阻害剤として利用されている5-アザシチジンを用いてMCF-7細胞を処理することによりGSTP1を発現させ、このようにして発現したGSTP1の活性をPS-TAcを用いて捕えることが可能であるかどうかを検証した。
By the way, it is known that the promoter region of the GSTP1 gene is methylated in MCF-7 cells, and thus the expression of GSTP1 is low. Thus, GSTP1 is expressed by treating MCF-7 cells with 5-azacytidine, which is used as a DNA methyltransferase inhibitor, and the activity of GSTP1 thus expressed is captured using PS-TAc. Was verified to be possible.
具体的には、MCF-7細胞を播種した翌日に、培地をベヒクルまたは5μMの5-アザシチジンを含む培地へと交換した。そして、この培地交換から3日後に0.25%トリプシン-EDTAによって細胞を剥がし、1.0×10⁵細胞/ディッシュとなるように35mmガラスボトムディッシュに細胞を播種して、5-アザシチジン処理からの時間が96時間を超えるまで静置した。その後、細胞培養用培地を除去し、PBS(日水製薬株式会社)で細胞を2回洗浄し、2.5μMの蛍光プローブ(Ps-TAc)および10μg/mLの蛍光色素Hoechst33258(DNAに結合するため生細胞の核を染色可能である)を含むHanks’ Balanced Salt Solution(HBSS,ハンクス平衡塩溶液)(和光純薬工業株式会社)を加え、37℃にて20分間インキュベーションした。プローブ溶液を除去し、PBSで細胞を1回洗浄した後、再びHBSSを加えて共焦点レーザー走査型顕微鏡により観察を行った。なお、共焦点レーザー走査型顕微鏡としてはFLUOVIEW FV10i-DOC(オリンパス株式会社製)を用い、蛍光プローブの蛍光は波長473nmのLDレーザーにより励起させ、Hoechst33258の蛍光は波長405nmのLDレーザーにより励起させて、対応する蛍光スペクトルにおける蛍光画像を取得した。
Specifically, the day after the seeding of MCF-7 cells, the medium was changed to a medium containing vehicle or 5 μM 5-azacytidine. Three days after this medium change, the cells were detached with 0.25% trypsin-EDTA, and the cells were seeded on a 35 mm glass bottom dish so as to be 1.0 × 10 5 cells / dish. Was allowed to stand for more than 96 hours. Thereafter, the medium for cell culture is removed, the cells are washed twice with PBS (Nissui Pharmaceutical Co., Ltd.), and 2.5 μM fluorescent probe (Ps-TAc) and 10 μg / mL fluorescent dye Hoechst33258 (binding to DNA) Therefore, Hanks' Balanced Salt Solution (HBSS, Hank's Balanced Salt Solution) (Wako Pure Chemical Industries, Ltd.) was added and incubated at 37 ° C. for 20 minutes. After removing the probe solution and washing the cells once with PBS, HBSS was added again and observation was performed with a confocal laser scanning microscope. As a confocal laser scanning microscope, FLUOVIEW FV10i-DOC (manufactured by Olympus Corporation) was used. The fluorescence of the fluorescent probe was excited by an LD laser having a wavelength of 473 nm, and the fluorescence of Hoechst 33258 was excited by an LD laser having a wavelength of 405 nm. , Fluorescence images in the corresponding fluorescence spectrum were acquired.
結果を図18に示す。ここで、図18(A)は上記の処理を施したMCF-7細胞のイメージング画像であり、図18(B)はコントロール群および5-アザシチジン投与群のそれぞれからランダムに抽出した60個ずつの細胞における蛍光強度の分布を示す図である。図18に示すように、コントロール群では蛍光プローブに由来する強蛍光性の細胞が観察されなかったのに対し、5-アザシチジン投与群では非常に高い蛍光強度を示す細胞が観察された。この結果は、5-アザシチジンの投与によってDNAメチルトランスフェラーゼが阻害され、MCF-7細胞におけるGSTP1遺伝子のプロモーター領域のメチル化が解除される結果、GSTP1遺伝子の発現が誘導されたことによるものと推定された。
Results are shown in FIG. Here, FIG. 18 (A) is an imaging image of MCF-7 cells subjected to the above-described processing, and FIG. 18 (B) shows 60 images randomly extracted from each of the control group and the 5-azacytidine administration group. It is a figure which shows distribution of the fluorescence intensity in a cell. As shown in FIG. 18, strong fluorescent cells derived from the fluorescent probe were not observed in the control group, whereas cells having very high fluorescence intensity were observed in the 5-azacytidine administration group. This result is presumed to be due to the induction of GSTP1 gene expression as a result of the inhibition of DNA methyltransferase by administration of 5-azacytidine and the demethylation of the promoter region of the GSTP1 gene in MCF-7 cells. It was.
そこで、この仮説を検証することを目的として、5μMの5-アザシチジンを培地中へ加えて処理したMCF-7細胞に対して、さらにsiRNAを投与することでRNAi(RNA干渉)を行い、GSTP1の発現を抑制することを試みた。具体的には、上記で強蛍光性の細胞が観察された5-アザシチジン投与群のMCF-7細胞に対し、30pmolのコントロールsiRNAまたはGSTP1 siRNA(インビトロジェン社製)のそれぞれを4μLのLipofectamineTM RNAiMAX Transfection Reagent(サーモフィッシャーサイエンティフィック社)を用いて細胞へ導入した。siRNAの導入から24時間後以降、細胞を0.25%トリプシン-EDTAによって剥がし、全細胞を6~10mLのDMEMに懸濁し、35mmガラスボトムディッシュに再播種して、再播種からさらに24時間後以降に上記と同様の手法により共焦点レーザー走査型顕微鏡を用いて観察を行った。
Therefore, for the purpose of verifying this hypothesis, RNAi (RNA interference) was performed by further administering siRNA to MCF-7 cells treated with 5 μM 5-azacytidine added to the medium, and GSTP1 An attempt was made to suppress expression. Specifically, 4 μL of Lipofectamine ™ RNAiMAX Transfection of 30 pmol of control siRNA or GSTP1 siRNA (manufactured by Invitrogen) was compared to MCF-7 cells in the 5-azacytidine administration group in which strong fluorescent cells were observed as described above. The cells were introduced into the cells using Reagent (Thermo Fisher Scientific). After 24 hours from the introduction of siRNA, the cells are detached with 0.25% trypsin-EDTA, all the cells are suspended in 6-10 mL of DMEM, reseeded in a 35 mm glass bottom dish, and further 24 hours after reseeding. Thereafter, observation was performed using a confocal laser scanning microscope in the same manner as described above.
結果を図19に示す。ここで、図19(A)は上記の処理を施したMCF-7細胞のイメージング画像であり、このうち「Merge(×10)」は「Merge」画像の10倍拡大画像である。また、図19(B)はコントロールsiRNA投与群およびGSTP1 siRNA投与群のそれぞれからランダムに抽出した60個ずつの細胞における蛍光強度の分布を示す図である。図19に示すように、GSTP1 siRNA投与群においては、蛍光プローブ(Ps-TAc)由来の蛍光強度の顕著な減少が観察された。このことから、本発明に係る蛍光プローブ(Ps-TAc)を用いることで、GSTP1遺伝子のプロモーター領域の脱メチル化に基づくGSTP1タンパク質発現の有無を検出することが可能であることが示された。なお、正常上皮細胞においてはGSTP1が発現しているが、がん化によってGSTP1遺伝子のプロモーター領域のCpG部分がメチル化されることでGSTP1の発現が見られなくなることが知られている。したがって、本発明に係る蛍光プローブをそのような系へ適用することができれば、蛍光の有無を指標として、前立腺がん細胞(GSTP1が過剰発現していない)の検出を行うことも可能であると考えられる。
The results are shown in FIG. Here, FIG. 19A is an imaging image of MCF-7 cells subjected to the above-described processing, and “Merge (× 10)” is a 10-fold enlarged image of the “Merge” image. FIG. 19B is a graph showing the distribution of fluorescence intensity in 60 cells randomly extracted from each of the control siRNA administration group and the GSTP1 siRNA administration group. As shown in FIG. 19, in the GSTP1 siRNA administration group, a significant decrease in the fluorescence intensity derived from the fluorescent probe (Ps-TAc) was observed. From this, it was shown that the presence or absence of GSTP1 protein expression based on demethylation of the promoter region of the GSTP1 gene can be detected by using the fluorescent probe (Ps-TAc) according to the present invention. In addition, although GSTP1 is expressed in normal epithelial cells, it is known that expression of GSTP1 is not observed when the CpG part of the promoter region of the GSTP1 gene is methylated by canceration. Therefore, if the fluorescent probe according to the present invention can be applied to such a system, it is possible to detect prostate cancer cells (GSTP1 is not overexpressed) using the presence or absence of fluorescence as an index. Conceivable.
さらに、がん細胞に発現する内在性のGSTP1の発現を可視化することが可能かどうか評価することを目的として、GSTP1を発現している繊維芽肉腫由来細胞であるHT1080細胞に対して本発明に係る蛍光プローブ(PS-TAc)を適用した。この際、GSTP1特異性を調べることを目的として、上記と同様にsiRNAをトランスフェクションして、HT1080細胞においてもGSTP1がノックダウンされるかどうかの確認も併せて行った。
Furthermore, for the purpose of evaluating whether it is possible to visualize the expression of endogenous GSTP1 expressed in cancer cells, the present invention is applied to HT1080 cells which are fibroblastoma-derived cells expressing GSTP1. Such a fluorescent probe (PS-TAc) was applied. At this time, for the purpose of examining GSTP1 specificity, siRNA was transfected in the same manner as described above, and it was also confirmed whether GSTP1 was knocked down in HT1080 cells.
具体的には、6ウェルプレートに2.0×10⁵細胞/ウェルとなるようにHT1080細胞を播種した翌日、30pmolのコントロールsiRNAまたはGSTP1 siRNA(インビトロジェン社製)のそれぞれを4μLのLipofectamineTM RNAiMAX Transfection Reagent(サーモフィッシャーサイエンティフィック社)を用いて細胞へ導入した。siRNAの導入から24時間後以降、細胞を0.25%トリプシン-EDTAによって剥がし、全細胞を6~10mLのDMEMに懸濁し、35mmガラスボトムディッシュに再播種して、再播種からさらに24時間後以降に上記と同様の手法により共焦点レーザー走査型顕微鏡を用いて観察を行った。また、やはり上記と同様の手法により、ウエスタンブロッティングによってGSTP1のノックダウンを確認した。
Specifically, the day after HT1080 cells were seeded in a 6-well plate at 2.0 × 10 5 cells / well, 30 μmol of control siRNA or GSTP1 siRNA (manufactured by Invitrogen) was added to each 4 μL of Lipofectamine ™ RNAiMAX Transfection. The cells were introduced into the cells using Reagent (Thermo Fisher Scientific). After 24 hours from the introduction of siRNA, the cells are detached with 0.25% trypsin-EDTA, all the cells are suspended in 6-10 mL of DMEM, reseeded in a 35 mm glass bottom dish, and further 24 hours after reseeding. Thereafter, observation was performed using a confocal laser scanning microscope in the same manner as described above. Furthermore, GSTP1 knockdown was confirmed by Western blotting using the same method as described above.
結果を図20に示す。ここで、図20(A)はウエスタンブロッティングの結果を示す電気泳動写真である。また、図20(B)は上記の処理を施したHT1080細胞のイメージング画像であり、このうち「Merge(wide field)」は「Merge」画像の6倍拡大画像である。さらに、図20(C)はコントロールsiRNA投与群およびGSTP1 siRNA投与群のそれぞれからランダムに抽出した60個ずつの細胞における蛍光強度の分布を示す図である。そして、図20(D)はコントロールsiRNAおよびGSTP1 siRNAをそれぞれ投与した細胞群におけるPs-TAcの投与前並びに投与後6分、10分および15分経過後のイメージング画像(merge(wide field)に対応)である。図20(A)に示す結果から、HT1080細胞において発現している内因性GSTP1の活性もまた、GSTP1 siRNAの投与によってノックダウンを受けることが確認された。また、図20の(B)および(C)に示すように、HT1080細胞においても、コントロールsiRNA投与群では蛍光プローブ(Ps-TAc)由来の蛍光が観察され、この蛍光はGSTP1 siRNAの投与によって大きく減弱した。さらに、図20(D)に示すように、本発明の蛍光プローブ(Ps-TAc)の投与によって蛍光強度は時間依存的な上昇を示したが、その一方でGSTP1 siRNAの投与により、この蛍光強度の上昇は抑制された。
The results are shown in FIG. Here, FIG. 20A is an electrophoretogram showing the results of Western blotting. FIG. 20B is an imaging image of the HT1080 cell subjected to the above-described processing. Among these, “Merge (wide field)” is a 6-fold enlarged image of the “Merge” image. Furthermore, FIG. 20 (C) is a diagram showing the distribution of fluorescence intensity in 60 cells randomly extracted from each of the control siRNA administration group and the GSTP1 siRNA administration group. FIG. 20 (D) corresponds to imaging images (merge (wide field)) before administration of Ps-TAc and after 6 minutes, 10 minutes and 15 minutes after administration in the cell groups administered with control siRNA and GSTP1 siRNA, respectively. ). From the results shown in FIG. 20 (A), it was confirmed that the activity of endogenous GSTP1 expressed in HT1080 cells was also knocked down by administration of GSTP1 siRNA. As shown in FIGS. 20B and 20C, also in the HT1080 cells, fluorescence derived from the fluorescent probe (Ps-TAc) was observed in the control siRNA administration group, and this fluorescence was greatly increased by administration of GSTP1 siRNA. Attenuated. Furthermore, as shown in FIG. 20 (D), the fluorescence intensity increased with time depending on the administration of the fluorescent probe (Ps-TAc) of the present invention. On the other hand, the fluorescence intensity increased with the administration of GSTP1 siRNA. The rise in was suppressed.
以上の結果から、本発明に係る蛍光プローブ(Ps-TAcなど)は、内在的にGSTP1を発現するがん細胞においても、その活性を検出することが可能な蛍光プローブであることが確認された。
From the above results, it was confirmed that the fluorescent probe (Ps-TAc and the like) according to the present invention is a fluorescent probe capable of detecting the activity even in cancer cells that endogenously express GSTP1. .
続いて、Ps-TAcが様々ながん細胞のGSTP1活性を捉えることができるか、また、GSTP1の発現の有無を評価できるか明らかとするために、Ps-TAcを各種がん細胞へ投与し、共焦点レーザー顕微鏡にて観察した。
Subsequently, Ps-TAc was administered to various cancer cells in order to clarify whether Ps-TAc can capture the GSTP1 activity of various cancer cells and evaluate the presence or absence of GSTP1 expression. Observed with a confocal laser microscope.
具体的には、まず、細胞を10μg/mLのHoechst 33258を含むハンクス緩衝液中、37℃にて、20分間培養した。その後、培地を取り除き、リン酸ナトリウム緩衝液にて、細胞を洗浄した。続いて、2μMのPs-TAcを含むハンクス緩衝液を加え、さらに15分間室温で培養した後、共焦点レーザー顕微鏡(オリンパス)において、蛍光イメージングを行った。共焦点レーザー走査型顕微鏡としてはFLUOVIEW FV10i-DOC(オリンパス株式会社製)を用い、Hoechst 33258の蛍光は波長405nmのLDレーザー、蛍光プローブの蛍光は波長473nmのLDレーザーにより励起させ、それぞれ対応する蛍光スペクトルにおける蛍光画像を取得した。本実験では、GSTP1陽性細胞として、HCT116、HT29(大腸がん細胞)、HuCCT1(胆管がん細胞)、DU145(前立腺がん細胞)、HT1080(線維肉腫細胞)を用い、また、GSTP1陰性細胞として、MCF7(乳がん細胞)およびLNCaP(前立腺がん細胞)を用いた。
Specifically, first, the cells were cultured for 20 minutes at 37 ° C. in Hank's buffer containing 10 μg / mL Hoechst 33258. Thereafter, the medium was removed, and the cells were washed with a sodium phosphate buffer. Subsequently, Hank's buffer containing 2 μM Ps-TAc was added, and further incubated at room temperature for 15 minutes, followed by fluorescence imaging with a confocal laser microscope (Olympus). As a confocal laser scanning microscope, FLUOVIEW FV10i-DOC (manufactured by Olympus Corporation) was used. The fluorescence of Hoechst 33258 was excited by an LD laser having a wavelength of 405 nm, and the fluorescence of the fluorescent probe was excited by an LD laser having a wavelength of 473 nm. A fluorescence image in the spectrum was acquired. In this experiment, HCT116, HT29 (colon cancer cell), HuCCT1 (bile duct cancer cell), DU145 (prostate cancer cell), HT1080 (fibrosarcoma cell) are used as GSTP1-positive cells, and GSTP1-negative cells are used. MCF7 (breast cancer cells) and LNCaP (prostate cancer cells) were used.
結果を図21に示す。なお、図21に示す写真のうち、各細胞に対応する上段の写真は蛍光画像であり、下段の写真は白色光(BF)画像であり、ともに共焦点レーザー顕微鏡を用いて撮像したものである。図21に示すように、細胞種によって蛍光強度、蛍光性生成物の細胞内分布などが異なるものの、本実験において用いた全てのGSTP1発現細胞で、細胞内において蛍光を確認することができた。一方、GSTP1非発現細胞では、蛍光強度上昇が見られなかった。
The results are shown in FIG. Of the photographs shown in FIG. 21, the upper photograph corresponding to each cell is a fluorescent image, and the lower photograph is a white light (BF) image, both taken using a confocal laser microscope. . As shown in FIG. 21, although the fluorescence intensity and the intracellular distribution of the fluorescent product differ depending on the cell type, fluorescence could be confirmed in all the GSTP1-expressing cells used in this experiment. On the other hand, no increase in fluorescence intensity was observed in cells not expressing GSTP1.
[蛍光プローブの合成(3)]
上記とは異なる蛍光団を有する蛍光プローブの作製を試みた(下記の反応スキーム6)。 [Synthesis of fluorescent probe (3)]
An attempt was made to produce a fluorescent probe having a fluorophore different from the above (reaction scheme 6 below).
上記とは異なる蛍光団を有する蛍光プローブの作製を試みた(下記の反応スキーム6)。 [Synthesis of fluorescent probe (3)]
An attempt was made to produce a fluorescent probe having a fluorophore different from the above (

(化合物(g)の合成;2-(4-アミノフェニル)-6-ブロモ-1H-ベンゾ[デ]イソキノリン-1,3(2H)-ジオン)
4-ブロモ-1,8-ナフタル酸無水物(505.3mg,1.8mmol)と1,4-ジアミノベンゼン(247.2mg,2.3mmol)をエタノール(6.0mL)に懸濁させ、10時間加熱還流を行なった。反応液を室温まで冷却し、沈殿を濾取し、目的化合物を収率91%(609.8mg,1.6mmol)で得た。 (Synthesis of Compound (g); 2- (4-Aminophenyl) -6-bromo-1H-benzo [de] isoquinoline-1,3 (2H) -dione)
4-Bromo-1,8-naphthalic anhydride (505.3 mg, 1.8 mmol) and 1,4-diaminobenzene (247.2 mg, 2.3 mmol) were suspended in ethanol (6.0 mL) and 10 Refluxing was performed for a period of time. The reaction solution was cooled to room temperature, and the precipitate was collected by filtration to obtain the target compound in 91% yield (609.8 mg, 1.6 mmol).
(化合物(g)の機器データ)
1H-NMR(400MHz,DMSO-d6)δ8.53(2H,d,J=8.2),8.29(1H,d,J=7.8),8.20(1H,d,J=7.8),7.98(1H,t,J=8.0),6.94(2H,dd,J=6.6,2.1),6.64(2H,dd,J=6.6,2.1),5.26(2H,s)
13C-NMR(100MHz,DMSO-d6)δ163.4,163.7,148.6,132.5,131.5,131.3,130.9,129.8,129.1,128.9,128.8,128.6,123.4,122.7,113.7
HRMS(ESI-TOF) m/z calcd for C18H12N2O2Br[M+H]+:367.0082,found;367.0078(-0.4mmu)。 (Equipment data of compound (g))
1 H-NMR (400 MHz, DMSO-d 6 ) δ 8.53 (2H, d, J = 8.2), 8.29 (1H, d, J = 7.8), 8.20 (1H, d, J = 7.8), 7.98 (1H, t, J = 8.0), 6.94 (2H, dd, J = 6.6, 2.1), 6.64 (2H, dd, J = 6.6, 2.1), 5.26 (2H, s)
13 C-NMR (100 MHz, DMSO-d 6 ) δ 163.4, 163.7, 148.6, 132.5, 131.5, 131.3, 130.9, 129.8, 129.1, 128. 9, 128.8, 128.6, 123.4, 122.7, 113.7
HRMS (ESI-TOF) m / z calcd for C 18 H 12 N 2O 2 Br [M + H] +: 367.0082, found; 367.0078 (-0.4mmu).
1H-NMR(400MHz,DMSO-d6)δ8.53(2H,d,J=8.2),8.29(1H,d,J=7.8),8.20(1H,d,J=7.8),7.98(1H,t,J=8.0),6.94(2H,dd,J=6.6,2.1),6.64(2H,dd,J=6.6,2.1),5.26(2H,s)
13C-NMR(100MHz,DMSO-d6)δ163.4,163.7,148.6,132.5,131.5,131.3,130.9,129.8,129.1,128.9,128.8,128.6,123.4,122.7,113.7
HRMS(ESI-TOF) m/z calcd for C18H12N2O2Br[M+H]+:367.0082,found;367.0078(-0.4mmu)。 (Equipment data of compound (g))
1 H-NMR (400 MHz, DMSO-d 6 ) δ 8.53 (2H, d, J = 8.2), 8.29 (1H, d, J = 7.8), 8.20 (1H, d, J = 7.8), 7.98 (1H, t, J = 8.0), 6.94 (2H, dd, J = 6.6, 2.1), 6.64 (2H, dd, J = 6.6, 2.1), 5.26 (2H, s)
13 C-NMR (100 MHz, DMSO-d 6 ) δ 163.4, 163.7, 148.6, 132.5, 131.5, 131.3, 130.9, 129.8, 129.1, 128. 9, 128.8, 128.6, 123.4, 122.7, 113.7
HRMS (ESI-TOF) m / z calcd for C 18 H 12 N 2
(化合物(h)の合成;2-(4-アミノフェニル)-6-(アゼチジン-1-イル)-1H-ベンゾ[デ]イソキノリン-1,3(2H)-ジオン)
化合物(g)(200.0mg,0.54mmol)とアゼチジン塩酸塩(153.1mg,1.6mmol)と炭酸セシウム(562.4mg,1.7mmol)をジメチルスルホキシド(3.0mL)に懸濁させ、80℃で8時間撹拌した。反応液を室温まで冷却し、水(100mL)に注ぎ、沈殿を濾取し、目的化合物を収率92%で得た。 (Synthesis of Compound (h); 2- (4-aminophenyl) -6- (azetidin-1-yl) -1H-benzo [de] isoquinoline-1,3 (2H) -dione)
Compound (g) (200.0 mg, 0.54 mmol), azetidine hydrochloride (153.1 mg, 1.6 mmol) and cesium carbonate (562.4 mg, 1.7 mmol) were suspended in dimethyl sulfoxide (3.0 mL). , And stirred at 80 ° C. for 8 hours. The reaction solution was cooled to room temperature, poured into water (100 mL), and the precipitate was collected by filtration to obtain the target compound in a yield of 92%.
(化合物(h)の機器データ)
1H-NMR(400MHz,DMSO-d6)δ8.41(2H,td,J=7.9,1.1),8.20(1H,d,J=8.7),7.62(1H,dd,J=8.2,7.3),6.86(2H,dd,J=6.6,2.1),6.61(2H,dd,J=6.6,2.1),6.50(1H,d,J=8.7),5.20(2H,s),4.50(4H,t,J=7.3),2.53(2H,s)
13C-NMR(100MHz,DMSO-d6)δ164.2,163.4,152.3,148.2,132.8,130.8,130.3,129.2,124.3,124.0,122.3,120.3,113.7,108.9,106.1,55.2,40.1,16.5
HRMS(ESI-TOF) m/z calcd for C21H18N3O2[M+H]+:344.1399,found;344.1394(-0.5mmu)。 (Equipment data of compound (h))
1 H-NMR (400 MHz, DMSO-d 6 ) δ 8.41 (2H, td, J = 7.9, 1.1), 8.20 (1H, d, J = 8.7), 7.62 ( 1H, dd, J = 8.2, 7.3), 6.86 (2H, dd, J = 6.6, 2.1), 6.61 (2H, dd, J = 6.6, 2. 1), 6.50 (1H, d, J = 8.7), 5.20 (2H, s), 4.50 (4H, t, J = 7.3), 2.53 (2H, s)
13 C-NMR (100 MHz, DMSO-d 6 ) δ 164.2, 163.4, 152.3, 148.2, 132.8, 130.8, 130.3, 129.2, 124.3, 124. 0, 122.3, 120.3, 113.7, 108.9, 106.1, 55.2, 40.1, 16.5
HRMS (ESI-TOF) m / z calcd for C 21 H 18 N 3 O 2 [M + H] + : 344.1399, found; 344.1394 (−0.5 mmu).
(Ps-Naphの合成;N-(4-(6-アゼチジン-1-イル)-1,3-ジオキソ-1H-ベンゾ[デ]イソキノリン-2(3H)-イル)フェニル)-5-(メチルスルホニル)-2-ニトロベンズアミド)
化合物(h)(9.6mg,0.028mmol)と5-メシル-2-ニトロ安息香酸(4.9mg,0.023mmol)、WSCD・HCl(7.4mg,0.039mmol)をアセトニトリル(2mL)とクロロホルム(2mL)の混合溶媒に懸濁し、室温にて2時間撹拌した。反応溶液に酢酸エチルを加え、0.1N HClで2回、飽和炭酸水素ナトリウムで1回、飽和食塩水で1回洗浄した。有機層を無水硫酸マグネシウムで乾燥させ、酢酸エチルを減圧下留去した。残渣をアセトニトリル(3mL)に溶解させて、水(10mL)に滴下し、沈殿を濾取した。得られた固体をシリカゲルカラムクロマトグラフィー(クロロホルム/酢酸エチル=4:1)で精製し、目的化合物(Ps-Naph)を収率20%で得た(2.6mg,0.0046mmol)。 (Synthesis of Ps-Naph; N- (4- (6-azetidin-1-yl) -1,3-dioxo-1H-benzo [de] isoquinolin-2 (3H) -yl) phenyl) -5- (methyl Sulfonyl) -2-nitrobenzamide)
Compound (h) (9.6 mg, 0.028 mmol), 5-mesyl-2-nitrobenzoic acid (4.9 mg, 0.023 mmol), WSCD.HCl (7.4 mg, 0.039 mmol) in acetonitrile (2 mL) And chloroform (2 mL), and the mixture was stirred at room temperature for 2 hours. Ethyl acetate was added to the reaction solution, and the mixture was washed twice with 0.1 N HCl, once with saturated sodium bicarbonate, and once with saturated brine. The organic layer was dried over anhydrous magnesium sulfate, and ethyl acetate was distilled off under reduced pressure. The residue was dissolved in acetonitrile (3 mL) and added dropwise to water (10 mL), and the precipitate was collected by filtration. The obtained solid was purified by silica gel column chromatography (chloroform / ethyl acetate = 4: 1) to obtain the target compound (Ps-Naph) in a yield of 20% (2.6 mg, 0.0046 mmol).
(Ps-Naphの機器データ)
1H-NMR(400MHz,CD3CN)δ9.17(1H,s),8.51-8.44(2H,m),8.35(1H,d,J=0.9),8.31(1H,d,J=8.7),8.26-8.22(2H,m),7.78(2H,d,J=6.9),7.31(2H,d,J=8.2),6.50(1H,d,J=8.2),4.55(4H,t,J=7.5),2.54(2H,quin)
HRMS(ESI-TOF) m/z calcd for C29H23N4O7S[M+H]+:571.1287,found;571.1288(+0.1mmu)。 (Ps-Naph device data)
1 H-NMR (400 MHz, CD 3 CN) δ 9.17 (1H, s), 8.51-8.44 (2H, m), 8.35 (1H, d, J = 0.9), 8. 31 (1H, d, J = 8.7), 8.26-8.22 (2H, m), 7.78 (2H, d, J = 6.9), 7.31 (2H, d, J = 8.2), 6.50 (1H, d, J = 8.2), 4.55 (4H, t, J = 7.5), 2.54 (2H, quin)
HRMS (ESI-TOF) m / z calcd for C 29 H 23 N 4 O 7 S [M + H] +: 571.1287, found; 571.1288 (+ 0.1mmu).
[蛍光プローブの分光学的特性の評価(3)]
まず、2.5μMのPs-Naph(図22の(A))を100mMリン酸バッファー(pH7.4;DMSO 0.1%を共溶媒として含む)に溶解し、反応前の蛍光スペクトルを測定した。なお、蛍光スペクトルの測定には、蛍光分光光度計(RF-5300PC;株式会社島津製作所製)を用いた。また、2.5μMのPs-Naphを1mMの還元型グルタチオン(GSH)および3μg/mLのグルタチオン-S-トランスフェラーゼ(GSTP1-1)を含む100mMリン酸バッファー(pH7.4;DMSO 1%を共溶媒として含む)中、室温(25℃)にて撹拌しながら2時間反応させた。その後、上記と同様にして反応後の蛍光スペクトルを測定した。 [Evaluation of spectroscopic characteristics of fluorescent probe (3)]
First, 2.5 μM Ps-Naph ((A) in FIG. 22) was dissolved in 100 mM phosphate buffer (pH 7.4; DMSO 0.1% as a cosolvent), and the fluorescence spectrum before the reaction was measured. . For measurement of the fluorescence spectrum, a fluorescence spectrophotometer (RF-5300PC; manufactured by Shimadzu Corporation) was used. In addition, 100 mM phosphate buffer (pH 7.4;DMSO 1%) containing 2.5 μM Ps-Naph containing 1 mM reduced glutathione (GSH) and 3 μg / mL glutathione-S-transferase (GSTP1-1) For 2 hours with stirring at room temperature (25 ° C.). Thereafter, the fluorescence spectrum after the reaction was measured in the same manner as described above.
まず、2.5μMのPs-Naph(図22の(A))を100mMリン酸バッファー(pH7.4;DMSO 0.1%を共溶媒として含む)に溶解し、反応前の蛍光スペクトルを測定した。なお、蛍光スペクトルの測定には、蛍光分光光度計(RF-5300PC;株式会社島津製作所製)を用いた。また、2.5μMのPs-Naphを1mMの還元型グルタチオン(GSH)および3μg/mLのグルタチオン-S-トランスフェラーゼ(GSTP1-1)を含む100mMリン酸バッファー(pH7.4;DMSO 1%を共溶媒として含む)中、室温(25℃)にて撹拌しながら2時間反応させた。その後、上記と同様にして反応後の蛍光スペクトルを測定した。 [Evaluation of spectroscopic characteristics of fluorescent probe (3)]
First, 2.5 μM Ps-Naph ((A) in FIG. 22) was dissolved in 100 mM phosphate buffer (pH 7.4; DMSO 0.1% as a cosolvent), and the fluorescence spectrum before the reaction was measured. . For measurement of the fluorescence spectrum, a fluorescence spectrophotometer (RF-5300PC; manufactured by Shimadzu Corporation) was used. In addition, 100 mM phosphate buffer (pH 7.4;
Ps-Naphについての蛍光スペクトルの測定結果を図22の(B)に示す。図22の(B)に示す結果からわかるように、Ps-Naphは反応の前後で555nmにおいて約25倍の蛍光強度上昇を示した。
The measurement result of the fluorescence spectrum for Ps-Naph is shown in FIG. As can be seen from the results shown in FIG. 22 (B), Ps-Naph showed a fluorescence intensity increase of about 25 times at 555 nm before and after the reaction.
[蛍光プローブの合成(4)]
上記とはさらに異なる蛍光団を有する蛍光プローブの作製を試みた(下記の反応スキーム7)。 [Synthesis of fluorescent probe (4)]
An attempt was made to produce a fluorescent probe having a fluorophore different from the above (reaction scheme 7 below).
上記とはさらに異なる蛍光団を有する蛍光プローブの作製を試みた(下記の反応スキーム7)。 [Synthesis of fluorescent probe (4)]
An attempt was made to produce a fluorescent probe having a fluorophore different from the above (reaction scheme 7 below).

(化合物(i)の合成;5(6)-アミノフルオレセイン)
4-ニトロフタル酸無水物(1.02g,5.3mmol)とレゾルシノール(1.32g,12.0mmol)をメタンスルホン酸(10mL)に懸濁し、80℃にて一晩撹拌した。反応液を室温まで冷却し、氷水に注いだ。氷上にて、10N NaOHを用いて、その懸濁液のpHを14にして沈殿を溶解させた後、濃塩酸を用いて、その溶液のpHを3にし、生成した沈殿を回収した。硫化ナトリウム9水和物(2.42g)を溶解した精製水(40mL)に沈殿を溶解させて、60℃にて2時間撹拌した。反応溶液を室温まで冷却し、飽和リン酸二水素ナトリウム水溶液に注いだ。酢酸エチルで分液し、飽和リン酸二水素ナトリウム水溶液で2回、飽和食塩水で1回洗浄した。有機層を無水硫酸マグネシウムで乾燥させ、酢酸エチルを減圧下留去した。残渣をシリカゲルカラムクロマトグラフィー(クロロホルム/メタノール=1:2から1:1)で精製し、目的化合物(5,6-異性体混合物)を収率78%(1.43g,4.12mmol)で得た。 (Synthesis of Compound (i); 5 (6) -Aminofluorescein)
4-Nitrophthalic anhydride (1.02 g, 5.3 mmol) and resorcinol (1.32 g, 12.0 mmol) were suspended in methanesulfonic acid (10 mL) and stirred at 80 ° C. overnight. The reaction solution was cooled to room temperature and poured into ice water. On ice, 10N NaOH was used to adjust the pH of the suspension to 14, and the precipitate was dissolved. Then, the pH of the solution was adjusted to 3 using concentrated hydrochloric acid, and the generated precipitate was collected. The precipitate was dissolved in purified water (40 mL) in which sodium sulfide nonahydrate (2.42 g) was dissolved, and the mixture was stirred at 60 ° C. for 2 hours. The reaction solution was cooled to room temperature and poured into a saturated aqueous solution of sodium dihydrogen phosphate. The solution was separated with ethyl acetate, and washed twice with a saturated aqueous sodium dihydrogen phosphate solution and once with a saturated saline solution. The organic layer was dried over anhydrous magnesium sulfate, and ethyl acetate was distilled off under reduced pressure. The residue was purified by silica gel column chromatography (chloroform / methanol = 1: 2 to 1: 1) to obtain the target compound (5,6-isomer mixture) in 78% yield (1.43 g, 4.12 mmol). It was.
(化合物(i)の機器データ)
1H-NMR(400MHz,DMSO-d6)δ7.55(1H,d,J=8.2),6.97(1H,d,J=1.8),6.94(1H,dd,J=8.5,2.1),6.85(1H,d,J=8.2),6.73(1H,dd,J=8.2,1.8),6.65-6.62(6H,m),6.59(2H,d,J=8.7),6.57-6.50(4H,m),6.24(2H,s),6.08(1H,d,J=1.8),5.73(2H,s)
13C-NMR(100MHz,DMSO-d6)δ169.4,169.0,159.2,159.1,156.3,155.5,151.9,151.5,150.5,139.7,129.0,129.0,127.5,125.9,124.1,121.7,115.4,112.5,112.4,112.1,110.7,110.6,106.1,105.5,102.1,102.0,82.7,80.6
HRMS(ESI-TOF) m/z calcd for C20H14NO5[M+H]+:348.0872,found;348.0868(-0.4mmu)。 (Equipment data of compound (i))
1 H-NMR (400 MHz, DMSO-d 6 ) δ 7.55 (1H, d, J = 8.2), 6.97 (1H, d, J = 1.8), 6.94 (1H, dd, J = 8.5, 2.1), 6.85 (1H, d, J = 8.2), 6.73 (1H, dd, J = 8.2, 1.8), 6.65-6. .62 (6H, m), 6.59 (2H, d, J = 8.7), 6.57-6.50 (4H, m), 6.24 (2H, s), 6.08 (1H) , D, J = 1.8), 5.73 (2H, s)
13 C-NMR (100 MHz, DMSO-d 6 ) δ 169.4, 169.0, 159.2, 159.1, 156.3, 155.5, 151.9, 151.5, 150.5, 139. 7, 129.0, 129.0, 127.5, 125.9, 124.1, 121.7, 115.4, 112.5, 112.4, 112.1, 110.7, 110.6, 106.1, 105.5, 102.1, 102.0, 82.7, 80.6
HRMS (ESI-TOF) m / z calcd for C 20 H 14 NO 5 [M + H] + : 348.0872, found; 348.0868 (−0.4 mmu).
(化合物(j)の合成;5(6)-アミノフルオレセインジアセテート)
化合物(i)(5,6-異性体混合物)(222.2mg,0.64mmol)、無水酢酸(121μL,1.28mmol)、DIEA(223μL,1.28mmol)をDMF(2.0mL)に溶解させ、4℃にて2時間攪拌した。反応溶液を酢酸エチルと飽和リン酸二水素ナトリウム水溶液で分液し、飽和リン酸二水素ナトリウム水溶液で2回、飽和食塩水で1回洗浄した。有機層を無水硫酸マグネシウムで乾燥させ、酢酸エチルを減圧下留去した。残渣をシリカゲルカラムクロマトグラフィー(ヘキサン/酢酸エチル=1:2)で精製し、目的化合物(5,6-異性体混合物)を収率73%(202.8mg,0.47mmol)で得た。 (Synthesis of Compound (j); 5 (6) -Aminofluorescein Diacetate)
Compound (i) (5,6-isomer mixture) (222.2 mg, 0.64 mmol), acetic anhydride (121 μL, 1.28 mmol), DIEA (223 μL, 1.28 mmol) dissolved in DMF (2.0 mL) The mixture was stirred at 4 ° C. for 2 hours. The reaction solution was partitioned between ethyl acetate and saturated aqueous sodium dihydrogen phosphate, and washed twice with saturated aqueous sodium dihydrogen phosphate and once with saturated brine. The organic layer was dried over anhydrous magnesium sulfate, and ethyl acetate was distilled off under reduced pressure. The residue was purified by silica gel column chromatography (hexane / ethyl acetate = 1: 2) to obtain the target compound (5,6-isomer mixture) in a yield of 73% (202.8 mg, 0.47 mmol).
(化合物(j)の機器データ)
1H-NMR(400MHz,CDCl3)δ7.74(1H,d,J=8.2),7.46(1H,d,J=1.4),7.18(1H,dd,J=8.2,1.8),7.06(2H,d,J=2.3),7.04(2H,d,J=2.3),6.99(1H,d,J=8.2),6.95(2H,d,J=8.7),6.86(2H,d,J=8.7),6.82(2H,d,J=2.3),6.80(2H,d,J=2.3),6.78(1H,d,J=2.3),6.76(1H,dd,J=8.2,1.8),6.23(1H,d,J=2.3),2.31(6H,s),2.30(6H,s)
13C-NMR(100MHz,CDCl3)δ169.4,169.0,168.9,168.9,156.3,153.0,151.9,151.8,151.6,151.3,129.1,127.8,126.8,125.0,124.4,117.6,117.0,116.7,116.5,115.0,110.3,110.1,107.5,81.8,80.2,77.3,77.0,76.7,21.1
HRMS(ESI-TOF) m/z calcd for C24H18NO7[M+H]+:432.1083,found;432.1083(+0.0mmu)。 (Equipment data of compound (j))
1 H-NMR (400 MHz, CDCl 3 ) δ 7.74 (1H, d, J = 8.2), 7.46 (1H, d, J = 1.4), 7.18 (1H, dd, J = 8.2, 1.8), 7.06 (2H, d, J = 2.3), 7.04 (2H, d, J = 2.3), 6.99 (1H, d, J = 8) .2), 6.95 (2H, d, J = 8.7), 6.86 (2H, d, J = 8.7), 6.82 (2H, d, J = 2.3), 6 .80 (2H, d, J = 2.3), 6.78 (1H, d, J = 2.3), 6.76 (1H, dd, J = 8.2, 1.8), 6. 23 (1H, d, J = 2.3), 2.31 (6H, s), 2.30 (6H, s)
13 C-NMR (100 MHz, CDCl 3 ) δ 169.4, 169.0, 168.9, 168.9, 156.3, 153.0, 151.9, 151.8, 151.6, 151.3, 129.1, 127.8, 126.8, 125.0, 124.4, 117.6, 117.0, 116.7, 116.5, 115.0, 110.3, 110.1, 107. 5,81.8,80.2,77.3,77.0,76.7,21.1
HRMS (ESI-TOF) m / z calcd for C 24 H 18 NO 7 [M + H] +: 432.1083, found; 432.1083 (+ 0.0mmu).
(化合物(k)の合成;5-(5-(メチルスルホニル)-2-ニトロベンズアミド)-3-オキソ-3H-スピロ[イソベンゾフラン-1,9’-キサンテン]-3’,6’-ジイルジアセテート)
化合物(j)(5,6-異性体混合物)(100.6mg,0.23mmol)、5-メシル-2-ニトロ安息香酸(44.9mg,0.21mmol)、WSCD・HCl(52.1mg,0.27mmol)をアセトニトリルに懸濁させ、室温で1時間攪拌した。反応溶液を酢酸エチルと飽和リン酸二水素ナトリウム水溶液で分液し、飽和リン酸二水素ナトリウム水溶液で2回、飽和食塩水で1回洗浄した。有機層を無水硫酸マグネシウムで乾燥させ、酢酸エチルを減圧下留去した。残渣をシリカゲルカラムクロマトグラフィー(ヘキサン/酢酸エチル=1:2)で精製し、目的化合物を収率42%(64.4mg,0.098mmol)で得た。 (Synthesis of Compound (k); 5- (5- (Methylsulfonyl) -2-nitrobenzamide) -3-oxo-3H-spiro [isobenzofuran-1,9′-xanthene] -3 ′, 6′-diyl Diacetate)
Compound (j) (5,6-isomer mixture) (100.6 mg, 0.23 mmol), 5-mesyl-2-nitrobenzoic acid (44.9 mg, 0.21 mmol), WSCD · HCl (52.1 mg, 0.27 mmol) was suspended in acetonitrile and stirred at room temperature for 1 hour. The reaction solution was partitioned between ethyl acetate and saturated aqueous sodium dihydrogen phosphate, and washed twice with saturated aqueous sodium dihydrogen phosphate and once with saturated brine. The organic layer was dried over anhydrous magnesium sulfate, and ethyl acetate was distilled off under reduced pressure. The residue was purified by silica gel column chromatography (hexane / ethyl acetate = 1: 2) to obtain the target compound in a yield of 42% (64.4 mg, 0.098 mmol).
(化合物(k)の機器データ)
1H-NMR(400MHz,DMSO-d6)δ11.41(1H,s),8.46-8.39(3H,m),8.33(1H,dd,J=8.5,2.1),7.92(1H,dd,J=8.2,1.8),7.45(1H,d,J=8.2),7.29(2H,d,J=1.4),6.94-6.70(4H,m),3.42(3H,s),2.29(6H,s)
13C-NMR(100MHz,DMSO-d6)δ169.4,169.0,168.9,168.9,156.3,153.0,151.9,151.8,151.6,151.3,129.1,127.8,126.8,125.0,124.4,117.6,117.0,116.7,116.5,115.0,110.3,110.1,107.5,81.8,80.2,77.3,77.0,76.7,21.1
HRMS(ESI-TOF) m/z calcd for C32H23N2O12S[M+H]+:659.0972,found;659.0974(+0.2mmu)。 (Equipment data of compound (k))
1 H-NMR (400 MHz, DMSO-d 6 ) δ 11.41 (1H, s), 8.46-8.39 (3H, m), 8.33 (1H, dd, J = 8.5, 2. 1), 7.92 (1H, dd, J = 8.2, 1.8), 7.45 (1H, d, J = 8.2), 7.29 (2H, d, J = 1.4) ), 6.94-6.70 (4H, m), 3.42 (3H, s), 2.29 (6H, s)
13 C-NMR (100 MHz, DMSO-d 6 ) δ 169.4, 169.0, 168.9, 168.9, 156.3, 153.0, 151.9, 151.8, 151.6, 151. 3, 129.1, 127.8, 126.8, 125.0, 124.4, 117.6, 117.0, 116.7, 116.5, 115.0, 110.3, 110.1, 107.5, 81.8, 80.2, 77.3, 77.0, 76.7, 21.1
HRMS (ESI-TOF) m / z calcd for C 32 H 23 N 2 O 12 S [M + H] +: 659.0972, found; 659.0974 (+ 0.2mmu).
(Ps-FLの合成;N-(3’,6’-ジヒドロキシ-3-オキソ-3H-スピロ[イソベンゾフラン-1,9’-キサンテン]-5-イル)-5-(メチルスルホニル)-2-ニトロベンズアミド)
化合物(k)(14mg,0.021mmol)を1N NaOH(0.5mL)とジメチルスルホキシド(1.0mL)に溶解させて室温にて5分間攪拌した。反応液をpH7.4、200mMのリン酸ナトリウム緩衝液によって中和し、分取HPLCによって精製した。分取HPLCでは移動相Aとして10mM酢酸アンモニウム緩衝液(pH7.0)を用い、移動相Bとしてアセトニトリルを用いて、20分間で組成比がA:B=90:10から10:90となるよう組成比のグラジエントをかけ、流速9mL/minで溶出させた。溶出液中に含まれるアセトニトリルを減圧下、留去した後、残渣を酢酸エチルに懸濁し、0.1N塩酸で3回洗浄した後、無水硫酸ナトリウムで乾燥させた。酢酸エチルを減圧下留去し、目的化合物(Ps-FL)を収率63%で得た(7.5mg,0.013mmol)
(Ps-FLの機器データ)
1H-NMR(400MHz,10%MeOD in CDCl3)δ8.33(1H,d,J=1.8),8.26(1H,d,J=1.8),8.23-8.12(4H,m),7.16(1H,d,J=8.7),8.23-8.12(4H,m),6.72(2H,dd,J=8.7,2.3)
HRMS(ESI-TOF) m/z calcd for C28H19N2O10S[M+H]+:575.0760,found;575.0757(-0.3mmu)
[蛍光プローブの分光学的特性の評価(4)]
まず、2μMのPs-FL(図23の(A))を100mMリン酸バッファー(pH7.4;DMSO0.1%を共溶媒として含む)に溶解し、反応前の蛍光スペクトルを測定した。なお、蛍光スペクトルの測定には、蛍光分光光度計(RF-5300PC;株式会社島津製作所製)を用いた。また、2μMのPs-FLを1mMの還元型グルタチオン(GSH)および3μg/mLのグルタチオン-S-トランスフェラーゼ(GSTP1-1)を含む100mMリン酸バッファー(pH7.4;DMSO 1%を共溶媒として含む)中、室温(25℃)にて撹拌しながら2時間反応させた。その後、上記と同様にして反応後の蛍光スペクトルを測定した。 (Synthesis of Ps-FL; N- (3 ′, 6′-dihydroxy-3-oxo-3H-spiro [isobenzofuran-1,9′-xanthen] -5-yl) -5- (methylsulfonyl) -2 -Nitrobenzamide)
Compound (k) (14 mg, 0.021 mmol) was dissolved in 1N NaOH (0.5 mL) and dimethyl sulfoxide (1.0 mL), and the mixture was stirred at room temperature for 5 minutes. The reaction was neutralized with pH 7.4, 200 mM sodium phosphate buffer and purified by preparative HPLC. In preparative HPLC, 10 mM ammonium acetate buffer (pH 7.0) is used as mobile phase A, and acetonitrile is used as mobile phase B, so that the composition ratio becomes A: B = 90: 10 to 10:90 in 20 minutes. A gradient of the composition ratio was applied, and elution was performed at a flow rate of 9 mL / min. Acetonitrile contained in the eluate was distilled off under reduced pressure. The residue was suspended in ethyl acetate, washed three times with 0.1N hydrochloric acid, and then dried over anhydrous sodium sulfate. Ethyl acetate was distilled off under reduced pressure to obtain the target compound (Ps-FL) in a yield of 63% (7.5 mg, 0.013 mmol).
(Ps-FL device data)
1 H-NMR (400 MHz, 10% MeOD in CDCl 3 ) δ 8.33 (1H, d, J = 1.8), 8.26 (1H, d, J = 1.8), 8.23-8. 12 (4H, m), 7.16 (1 H, d, J = 8.7), 8.23-8.12 (4H, m), 6.72 (2H, dd, J = 8.7, 2 .3)
HRMS (ESI-TOF) m / z calcd for C 28 H 19 N 2 O 10 S [M + H] + : 575.0760, found; 575.0757 (−0.3 mmu)
[Evaluation of spectroscopic characteristics of fluorescent probe (4)]
First, 2 μM Ps-FL (FIG. 23A) was dissolved in 100 mM phosphate buffer (pH 7.4; DMSO 0.1% as a co-solvent), and the fluorescence spectrum before the reaction was measured. For measurement of the fluorescence spectrum, a fluorescence spectrophotometer (RF-5300PC; manufactured by Shimadzu Corporation) was used. In addition, 100 mM phosphate buffer (pH 7.4;DMSO 1%) containing 2 μM Ps-FL containing 1 mM reduced glutathione (GSH) and 3 μg / mL glutathione-S-transferase (GSTP1-1) as a cosolvent ) Was allowed to react for 2 hours with stirring at room temperature (25 ° C.). Thereafter, the fluorescence spectrum after the reaction was measured in the same manner as described above.
化合物(k)(14mg,0.021mmol)を1N NaOH(0.5mL)とジメチルスルホキシド(1.0mL)に溶解させて室温にて5分間攪拌した。反応液をpH7.4、200mMのリン酸ナトリウム緩衝液によって中和し、分取HPLCによって精製した。分取HPLCでは移動相Aとして10mM酢酸アンモニウム緩衝液(pH7.0)を用い、移動相Bとしてアセトニトリルを用いて、20分間で組成比がA:B=90:10から10:90となるよう組成比のグラジエントをかけ、流速9mL/minで溶出させた。溶出液中に含まれるアセトニトリルを減圧下、留去した後、残渣を酢酸エチルに懸濁し、0.1N塩酸で3回洗浄した後、無水硫酸ナトリウムで乾燥させた。酢酸エチルを減圧下留去し、目的化合物(Ps-FL)を収率63%で得た(7.5mg,0.013mmol)
(Ps-FLの機器データ)
1H-NMR(400MHz,10%MeOD in CDCl3)δ8.33(1H,d,J=1.8),8.26(1H,d,J=1.8),8.23-8.12(4H,m),7.16(1H,d,J=8.7),8.23-8.12(4H,m),6.72(2H,dd,J=8.7,2.3)
HRMS(ESI-TOF) m/z calcd for C28H19N2O10S[M+H]+:575.0760,found;575.0757(-0.3mmu)
[蛍光プローブの分光学的特性の評価(4)]
まず、2μMのPs-FL(図23の(A))を100mMリン酸バッファー(pH7.4;DMSO0.1%を共溶媒として含む)に溶解し、反応前の蛍光スペクトルを測定した。なお、蛍光スペクトルの測定には、蛍光分光光度計(RF-5300PC;株式会社島津製作所製)を用いた。また、2μMのPs-FLを1mMの還元型グルタチオン(GSH)および3μg/mLのグルタチオン-S-トランスフェラーゼ(GSTP1-1)を含む100mMリン酸バッファー(pH7.4;DMSO 1%を共溶媒として含む)中、室温(25℃)にて撹拌しながら2時間反応させた。その後、上記と同様にして反応後の蛍光スペクトルを測定した。 (Synthesis of Ps-FL; N- (3 ′, 6′-dihydroxy-3-oxo-3H-spiro [isobenzofuran-1,9′-xanthen] -5-yl) -5- (methylsulfonyl) -2 -Nitrobenzamide)
Compound (k) (14 mg, 0.021 mmol) was dissolved in 1N NaOH (0.5 mL) and dimethyl sulfoxide (1.0 mL), and the mixture was stirred at room temperature for 5 minutes. The reaction was neutralized with pH 7.4, 200 mM sodium phosphate buffer and purified by preparative HPLC. In preparative HPLC, 10 mM ammonium acetate buffer (pH 7.0) is used as mobile phase A, and acetonitrile is used as mobile phase B, so that the composition ratio becomes A: B = 90: 10 to 10:90 in 20 minutes. A gradient of the composition ratio was applied, and elution was performed at a flow rate of 9 mL / min. Acetonitrile contained in the eluate was distilled off under reduced pressure. The residue was suspended in ethyl acetate, washed three times with 0.1N hydrochloric acid, and then dried over anhydrous sodium sulfate. Ethyl acetate was distilled off under reduced pressure to obtain the target compound (Ps-FL) in a yield of 63% (7.5 mg, 0.013 mmol).
(Ps-FL device data)
1 H-NMR (400 MHz, 10% MeOD in CDCl 3 ) δ 8.33 (1H, d, J = 1.8), 8.26 (1H, d, J = 1.8), 8.23-8. 12 (4H, m), 7.16 (1 H, d, J = 8.7), 8.23-8.12 (4H, m), 6.72 (2H, dd, J = 8.7, 2 .3)
HRMS (ESI-TOF) m / z calcd for C 28 H 19 N 2 O 10 S [M + H] + : 575.0760, found; 575.0757 (−0.3 mmu)
[Evaluation of spectroscopic characteristics of fluorescent probe (4)]
First, 2 μM Ps-FL (FIG. 23A) was dissolved in 100 mM phosphate buffer (pH 7.4; DMSO 0.1% as a co-solvent), and the fluorescence spectrum before the reaction was measured. For measurement of the fluorescence spectrum, a fluorescence spectrophotometer (RF-5300PC; manufactured by Shimadzu Corporation) was used. In addition, 100 mM phosphate buffer (pH 7.4;
Ps-FLについての蛍光スペクトルの測定結果を図23の(B)に示す。図23の(B)に示す結果からわかるように、Ps-FLは反応の前後で515nmにおいて約150倍の蛍光強度上昇を示した。
The measurement result of the fluorescence spectrum for Ps-FL is shown in FIG. As can be seen from the results shown in FIG. 23B, Ps-FL showed a fluorescence intensity increase of about 150 times at 515 nm before and after the reaction.
[蛍光プローブの合成(5)]
上記とはさらに異なる蛍光団を有する蛍光プローブの作製を試みた(下記の反応スキーム8)。 [Synthesis of fluorescent probe (5)]
An attempt was made to produce a fluorescent probe having a fluorophore different from the above (reaction scheme 8 below).
上記とはさらに異なる蛍光団を有する蛍光プローブの作製を試みた(下記の反応スキーム8)。 [Synthesis of fluorescent probe (5)]
An attempt was made to produce a fluorescent probe having a fluorophore different from the above (

(化合物(l)の合成;2-(8-ヒドロキシ-2,3,6,7-テトラヒドロ-1H,5H-ピリド[3,2,1-ij]キノリン-9-カルボニル)-5(6)-ニトロ安息香酸)
4-ニトロフタル酸無水物(257.1mg,1.3mmol)と8-ヒドロキシジュロリジン(252.3mg,1.3mmol)をトルエン(20mL)に懸濁し、100℃で3時間撹拌した後、加熱還流を行い、一晩撹拌した。反応液を室温まで冷却し、溶液に酢酸エチルを加え、飽和食塩水で3回洗浄した。有機層を無水硫酸マグネシウムで乾燥させ、酢酸エチルを減圧下留去した。残渣をシリカゲルカラムクロマトグラフィー(ヘキサン/酢酸エチル=1:2,0.5%酢酸)で精製し、目的化合物(5,6-異性体混合物)を収率67.6%(343.6mg,0.899mmol)で得た。 (Synthesis of Compound (l); 2- (8-Hydroxy-2,3,6,7-tetrahydro-1H, 5H-pyrido [3,2,1-ij] quinoline-9-carbonyl) -5 (6) -Nitrobenzoic acid)
4-Nitrophthalic anhydride (257.1 mg, 1.3 mmol) and 8-hydroxyjulolidine (252.3 mg, 1.3 mmol) were suspended in toluene (20 mL), stirred at 100 ° C. for 3 hours, and then heated to reflux. And stirred overnight. The reaction mixture was cooled to room temperature, ethyl acetate was added to the solution, and the mixture was washed 3 times with saturated brine. The organic layer was dried over anhydrous magnesium sulfate, and ethyl acetate was distilled off under reduced pressure. The residue was purified by silica gel column chromatography (hexane / ethyl acetate = 1: 2,0.5% acetic acid) to obtain the target compound (5,6-isomer mixture) in a yield of 67.6% (343.6 mg, 0). 899 mmol).
(化合物(l)の機器データ)
1H-NMR(400MHz,DMSO-d6)δ8.86(1H,d,J=2.3),8.36(1H,dd,J=8.7,2.3),8.27(1H,dd,8.7,2.3),8.17(1H,d,8.7),8.11(1H,d,J=2.3),7.45(1H,d,J=8.2),6.33(1H,s),6.27(1H,s),3.28-3.15(8H,m),2.64(4H,t,J=6.2),2.40(4H,q,J=6.7),1.94-1.84(4H,m),1.84-1.74(4H,m)
13C-NMR(100MHz,DMSO-d6)δ195.5,194.9,174.0,166.0,165.4,160.2,160.1,149.6,149.5,149.1,147.6,146.5,142.3,134.9,131.9,130.8,129.8,129.7,129.2,126.4,125.8,123.5,122.9,113.3,113.3,108.3,108.3,105.4,105.4,60.5,50.1,49.7,49.4,49.2,49.0,48.8,48.6,48.3,27.0,21.3,20.8,20.6,20.3,19.6,13.9
HRMS(ESI-TOF) m/z calcd for C20H19N2O6[M+H]+:383.1243,found;383.1241(-0.2mmu)。 (Equipment data of compound (l))
1 H-NMR (400 MHz, DMSO-d 6 ) δ 8.86 (1H, d, J = 2.3), 8.36 (1H, dd, J = 8.7, 2.3), 8.27 ( 1H, dd, 8.7, 2.3), 8.17 (1H, d, 8.7), 8.11 (1H, d, J = 2.3), 7.45 (1H, d, J = 8.2), 6.33 (1H, s), 6.27 (1H, s), 3.28-3.15 (8H, m), 2.64 (4H, t, J = 6.2) ), 2.40 (4H, q, J = 6.7), 1.94-1.84 (4H, m), 1.84-1.74 (4H, m)
13 C-NMR (100 MHz, DMSO-d 6 ) δ 195.5, 194.9, 174.0, 166.0, 165.4, 160.2, 160.1, 149.6, 149.5, 149. 1, 147.6, 146.5, 142.3, 134.9, 131.9, 130.8, 129.8, 129.7, 129.2, 126.4, 125.8, 123.5, 122.9, 113.3, 113.3, 108.3, 108.3, 105.4, 105.4, 60.5, 50.1, 49.7, 49.4, 49.2, 49. 0, 48.8, 48.6, 48.3, 27.0, 21.3, 20.8, 20.6, 20.3, 19.6, 13.9
HRMS (ESI-TOF) m / z calcd for C 20 H 19 N 2 O 6 [M + H] +: 383.1243, found; 383.1241 (-0.2mmu).
(Ps-jRhodの合成;N-(12-ヒドロキシ-3’-オキソ-2,3,6,7-テトラヒドロ-1H,3’H,5H-スピロ[クロメノ[2,3-f]ピリド[3,2,1-ij]キノリン-9,1’-イソベンゾフラン]-5’-イル)-5-(メチルスルホニル)-2-ニトロベンズアミド)
化合物(l)(5,6-異性体混合物)(203.8mg,0.53mmol)とレゾルシノール(66.7mg,0.606mmol)をメタンスルホン酸(0.5mL)とトリフルオロ酢酸(0.5mL)に溶解させて、80℃で一晩撹拌した。反応溶液を室温まで冷却し、10N NaOHを用いて、pH2~3にした。クロロホルムで分液し、飽和リン酸二水素ナトリウム水溶液で3回、飽和食塩水で1回洗浄した。有機層を無水硫酸マグネシウムで乾燥させ、酢酸エチルを減圧下留去した。残渣をシリカゲルカラムクロマトグラフィー(クロロホルム/メタノール=5:1)で粗精製した。得られた固体(115.2mg)、硫化ナトリウム9水和物(272.0mg,3.48mmol)を水(10mL)に溶解させ、60℃で1時間撹拌した。反応溶液を室温まで冷却し、飽和リン酸二水素ナトリウム水溶液を用いてpH4にした。酢酸エチルで分液し、飽和リン酸二水素ナトリウム水溶液で3回、飽和食塩水で1回洗浄した。有機層を無水硫酸マグネシウムで乾燥させ、酢酸エチルを減圧下留去した。残渣をシリカゲルカラムクロマトグラフィー(クロロホルム/メタノール=4:1から1:1)で粗精製し、化合物(m)を得た。 (Synthesis of Ps-jRhod; N- (12-hydroxy-3′-oxo-2,3,6,7-tetrahydro-1H, 3′H, 5H-spiro [chromeno [2,3-f] pyrido [3 , 2,1-ij] quinoline-9,1′-isobenzofuran] -5′-yl) -5- (methylsulfonyl) -2-nitrobenzamide)
Compound (l) (5,6-isomer mixture) (203.8 mg, 0.53 mmol), resorcinol (66.7 mg, 0.606 mmol), methanesulfonic acid (0.5 mL) and trifluoroacetic acid (0.5 mL) ) And stirred at 80 ° C. overnight. The reaction solution was cooled to room temperature and brought to pH 2-3 with 10N NaOH. The solution was separated with chloroform and washed three times with a saturated aqueous sodium dihydrogen phosphate solution and once with a saturated saline solution. The organic layer was dried over anhydrous magnesium sulfate, and ethyl acetate was distilled off under reduced pressure. The residue was roughly purified by silica gel column chromatography (chloroform / methanol = 5: 1). The obtained solid (115.2 mg) and sodium sulfide nonahydrate (272.0 mg, 3.48 mmol) were dissolved in water (10 mL) and stirred at 60 ° C. for 1 hour. The reaction solution was cooled to room temperature and adjusted topH 4 using saturated aqueous sodium dihydrogen phosphate solution. The mixture was separated with ethyl acetate, and washed three times with a saturated aqueous sodium dihydrogen phosphate solution and once with a saturated saline solution. The organic layer was dried over anhydrous magnesium sulfate, and ethyl acetate was distilled off under reduced pressure. The residue was roughly purified by silica gel column chromatography (chloroform / methanol = 4: 1 to 1: 1) to obtain compound (m).
化合物(l)(5,6-異性体混合物)(203.8mg,0.53mmol)とレゾルシノール(66.7mg,0.606mmol)をメタンスルホン酸(0.5mL)とトリフルオロ酢酸(0.5mL)に溶解させて、80℃で一晩撹拌した。反応溶液を室温まで冷却し、10N NaOHを用いて、pH2~3にした。クロロホルムで分液し、飽和リン酸二水素ナトリウム水溶液で3回、飽和食塩水で1回洗浄した。有機層を無水硫酸マグネシウムで乾燥させ、酢酸エチルを減圧下留去した。残渣をシリカゲルカラムクロマトグラフィー(クロロホルム/メタノール=5:1)で粗精製した。得られた固体(115.2mg)、硫化ナトリウム9水和物(272.0mg,3.48mmol)を水(10mL)に溶解させ、60℃で1時間撹拌した。反応溶液を室温まで冷却し、飽和リン酸二水素ナトリウム水溶液を用いてpH4にした。酢酸エチルで分液し、飽和リン酸二水素ナトリウム水溶液で3回、飽和食塩水で1回洗浄した。有機層を無水硫酸マグネシウムで乾燥させ、酢酸エチルを減圧下留去した。残渣をシリカゲルカラムクロマトグラフィー(クロロホルム/メタノール=4:1から1:1)で粗精製し、化合物(m)を得た。 (Synthesis of Ps-jRhod; N- (12-hydroxy-3′-oxo-2,3,6,7-tetrahydro-1H, 3′H, 5H-spiro [chromeno [2,3-f] pyrido [3 , 2,1-ij] quinoline-9,1′-isobenzofuran] -5′-yl) -5- (methylsulfonyl) -2-nitrobenzamide)
Compound (l) (5,6-isomer mixture) (203.8 mg, 0.53 mmol), resorcinol (66.7 mg, 0.606 mmol), methanesulfonic acid (0.5 mL) and trifluoroacetic acid (0.5 mL) ) And stirred at 80 ° C. overnight. The reaction solution was cooled to room temperature and brought to pH 2-3 with 10N NaOH. The solution was separated with chloroform and washed three times with a saturated aqueous sodium dihydrogen phosphate solution and once with a saturated saline solution. The organic layer was dried over anhydrous magnesium sulfate, and ethyl acetate was distilled off under reduced pressure. The residue was roughly purified by silica gel column chromatography (chloroform / methanol = 5: 1). The obtained solid (115.2 mg) and sodium sulfide nonahydrate (272.0 mg, 3.48 mmol) were dissolved in water (10 mL) and stirred at 60 ° C. for 1 hour. The reaction solution was cooled to room temperature and adjusted to
得られた化合物(m)(11mg)、5-メシル-2-ニトロ安息香酸(14mg,0.057mmol),WSCD・HCl(14mg,0.072mmol)をアセトニトリル(3mL)に懸濁し、室温で45分間攪拌した。反応溶液に1N NaOH(3mL)を加えて室温で5分間攪拌した。1N HClでpHを3にして酢酸エチルを加えて分液し、飽和リン酸二水素ナトリウム水溶液で3回、飽和食塩水で1回洗浄した。酢酸エチルを減圧下留去し、残渣をシリカゲルカラムクロマトグラフィー(クロロホルム/メタノール=3:1から1:1)で精製した。残渣をジメチルスルホキシド(200μL)とアセトニトリル(200μL)の混合溶媒に溶解させて、酢酸アンモニウム緩衝液(pH7.0,4.0mL)を加えて、分取HPLCによって精製した。分取HPLCでは移動相Aとして10mM酢酸アンモニウム緩衝液(pH7.0)を用い、移動相Bとしてアセトニトリルを用いて、20分間で組成比がA:B=90:10から10:90となるよう組成比のグラジエントをかけ、流速9mL/minで溶出させた。溶出液中に含まれるアセトニトリルを減圧下、留去した後、残渣を酢酸エチルに懸濁し、飽和リン酸二水素ナトリウム水溶液加えた。酢酸エチルで2回分液し、有機層を無水硫酸ナトリウムで乾燥させた。酢酸エチルを減圧下留去し、目的化合物(Ps-jRhod)を得た(1.6mg,0.0025mmol)。
The obtained compound (m) (11 mg), 5-mesyl-2-nitrobenzoic acid (14 mg, 0.057 mmol), WSCD · HCl (14 mg, 0.072 mmol) were suspended in acetonitrile (3 mL), and the mixture was stirred at room temperature. Stir for minutes. 1N NaOH (3 mL) was added to the reaction solution, and the mixture was stirred at room temperature for 5 minutes. The pH was adjusted to 3 with 1N HCl, and ethyl acetate was added for liquid separation, followed by washing three times with a saturated sodium dihydrogen phosphate aqueous solution and once with a saturated saline solution. Ethyl acetate was distilled off under reduced pressure, and the residue was purified by silica gel column chromatography (chloroform / methanol = 3: 1 to 1: 1). The residue was dissolved in a mixed solvent of dimethyl sulfoxide (200 μL) and acetonitrile (200 μL), added with ammonium acetate buffer (pH 7.0, 4.0 mL), and purified by preparative HPLC. In preparative HPLC, 10 mM ammonium acetate buffer (pH 7.0) is used as mobile phase A, and acetonitrile is used as mobile phase B, so that the composition ratio becomes A: B = 90: 10 to 10:90 in 20 minutes. A gradient of the composition ratio was applied, and elution was performed at a flow rate of 9 mL / min. After acetonitrile contained in the eluate was distilled off under reduced pressure, the residue was suspended in ethyl acetate, and saturated aqueous sodium dihydrogen phosphate was added. Liquid separation was performed twice with ethyl acetate, and the organic layer was dried over anhydrous sodium sulfate. Ethyl acetate was distilled off under reduced pressure to obtain the target compound (Ps-jRhod) (1.6 mg, 0.0025 mmol).
(Ps-jRhodの機器データ)
HRMS(ESI-TOF) m/z calcd for C34H28N3O9S[M+H]+:654.1546,found;654.1548(+0.2mmu)。 (Ps-jRhod equipment data)
HRMS (ESI-TOF) m / z calcd for C 34 H 28 N 3 O 9 S [M + H] +: 654.1546, found; 654.1548 (+ 0.2mmu).
HRMS(ESI-TOF) m/z calcd for C34H28N3O9S[M+H]+:654.1546,found;654.1548(+0.2mmu)。 (Ps-jRhod equipment data)
HRMS (ESI-TOF) m / z calcd for C 34 H 28 N 3 O 9 S [M + H] +: 654.1546, found; 654.1548 (+ 0.2mmu).
[蛍光プローブの分光学的特性の評価(5)]
まず、2μMのPs-jRhod(図24の(A))を100mMリン酸バッファー(pH7.4;DMSO 0.1%を共溶媒として含む)に溶解し、反応前の蛍光スペクトルを測定した。なお、蛍光スペクトルの測定には、蛍光分光光度計(RF-5300PC;株式会社島津製作所製)を用いた。また、2μMのPs-jRhodを1mMの還元型グルタチオン(GSH)および3μg/mLのグルタチオン-S-トランスフェラーゼ(GSTP1-1)を含む100mMリン酸バッファー(pH7.4;DMSO1%を共溶媒として含む)中、室温(25℃)にて撹拌しながら2時間反応させた。その後、上記と同様にして反応後の蛍光スペクトルを測定した。 [Evaluation of spectroscopic characteristics of fluorescent probe (5)]
First, 2 μM Ps-jRhod (FIG. 24A) was dissolved in 100 mM phosphate buffer (pH 7.4; DMSO 0.1% was included as a cosolvent), and the fluorescence spectrum before the reaction was measured. For measurement of the fluorescence spectrum, a fluorescence spectrophotometer (RF-5300PC; manufactured by Shimadzu Corporation) was used. In addition, 100 mM phosphate buffer (pH 7.4;DMSO 1% included as a co-solvent) containing 2 μM Ps-jRhod 1 mM reduced glutathione (GSH) and 3 μg / mL glutathione-S-transferase (GSTP1-1) The reaction was allowed to proceed for 2 hours with stirring at room temperature (25 ° C.). Thereafter, the fluorescence spectrum after the reaction was measured in the same manner as described above.
まず、2μMのPs-jRhod(図24の(A))を100mMリン酸バッファー(pH7.4;DMSO 0.1%を共溶媒として含む)に溶解し、反応前の蛍光スペクトルを測定した。なお、蛍光スペクトルの測定には、蛍光分光光度計(RF-5300PC;株式会社島津製作所製)を用いた。また、2μMのPs-jRhodを1mMの還元型グルタチオン(GSH)および3μg/mLのグルタチオン-S-トランスフェラーゼ(GSTP1-1)を含む100mMリン酸バッファー(pH7.4;DMSO1%を共溶媒として含む)中、室温(25℃)にて撹拌しながら2時間反応させた。その後、上記と同様にして反応後の蛍光スペクトルを測定した。 [Evaluation of spectroscopic characteristics of fluorescent probe (5)]
First, 2 μM Ps-jRhod (FIG. 24A) was dissolved in 100 mM phosphate buffer (pH 7.4; DMSO 0.1% was included as a cosolvent), and the fluorescence spectrum before the reaction was measured. For measurement of the fluorescence spectrum, a fluorescence spectrophotometer (RF-5300PC; manufactured by Shimadzu Corporation) was used. In addition, 100 mM phosphate buffer (pH 7.4;
Ps-jRhodについての蛍光スペクトルの測定結果を図24の(B)に示す。図24の(B)に示す結果からわかるように、Ps-jRhodは反応の前後で565nmにおいて約75倍の蛍光強度上昇を示した。
The measurement result of the fluorescence spectrum for Ps-jRhod is shown in FIG. As can be seen from the results shown in FIG. 24 (B), Ps-jRhod showed an approximately 75-fold increase in fluorescence intensity at 565 nm before and after the reaction.
Claims (14)
- 下記一般式(1):

式中、Lは蛍光団を表し、EWG基は0.66以上0.78未満のハメット定数を有する電子求引性基を表し、ベンゼン環に結合したニトロ(NO2)基はベンゼン環に結合したアミド結合に対してオルト位またはパラ位に位置し、前記EWG基は、前記ニトロ(NO2)基に対してオルト位またはパラ位に位置している、
で表されるニトロベンゼン誘導体またはその塩。 The following general formula (1):
In the formula, L represents a fluorophore, an EWG group represents an electron withdrawing group having a Hammett constant of 0.66 or more and less than 0.78, and a nitro (NO 2 ) group bonded to the benzene ring is bonded to the benzene ring. In the ortho or para position relative to the amide bond, and the EWG group is in the ortho or para position relative to the nitro (NO 2 ) group,
Or a salt thereof. - 前記EWG基は、メシル基またはシアノ基である、請求項1に記載のニトロベンゼン誘導体またはその塩。 The nitrobenzene derivative or a salt thereof according to claim 1, wherein the EWG group is a mesyl group or a cyano group.
- 前記蛍光団は、クマリン、TokyoGreen、TokyoMagenta、およびSingaporeGreenからなる群から選択される母核を有するものである、請求項1または2に記載のニトロベンゼン誘導体またはその塩。 The nitrobenzene derivative or a salt thereof according to claim 1 or 2, wherein the fluorophore has a mother nucleus selected from the group consisting of coumarin, TokyoGreen, TokyoMagenta, and SingaporeGreen.
- 前記Lは、下記一般式(2):

式中、R1は、置換もしくは非置換の炭素数1~20のアルキル基、置換もしくは非置換の炭素数1~20のアルコキシ基、またはアミド基(-C(=O)NH2基)を表し、nは0~4の整数を表し、R2は水素原子または置換もしくは非置換の炭素数2~20のアシル基を表し、X1およびX2は、それぞれ独立して、水素原子またはハロゲン原子を表す、
で表される、請求項1~3のいずれか1項に記載のニトロベンゼン誘導体またはその塩。 The L is represented by the following general formula (2):
In the formula, R 1 represents a substituted or unsubstituted alkyl group having 1 to 20 carbon atoms, a substituted or unsubstituted alkoxy group having 1 to 20 carbon atoms, or an amide group (—C (═O) NH 2 group). N represents an integer of 0 to 4, R 2 represents a hydrogen atom or a substituted or unsubstituted acyl group having 2 to 20 carbon atoms, and X 1 and X 2 each independently represent a hydrogen atom or a halogen atom Represents an atom,
The nitrobenzene derivative or a salt thereof according to any one of claims 1 to 3, represented by: - 下記一般式(3):

式中、R1は、置換もしくは非置換の炭素数1~20のアルキル基、置換もしくは非置換の炭素数1~20のアルコキシ基、またはアミド基(-C(=O)NH2基)を表し、nは0~4の整数を表し、R2は水素原子または置換もしくは非置換の炭素数2~20のアシル基を表し、X1およびX2は、それぞれ独立して、水素原子またはハロゲン原子を表す、
で表される、請求項4に記載のニトロベンゼン誘導体またはその塩。 The following general formula (3):
In the formula, R 1 represents a substituted or unsubstituted alkyl group having 1 to 20 carbon atoms, a substituted or unsubstituted alkoxy group having 1 to 20 carbon atoms, or an amide group (—C (═O) NH 2 group). N represents an integer of 0 to 4, R 2 represents a hydrogen atom or a substituted or unsubstituted acyl group having 2 to 20 carbon atoms, and X 1 and X 2 each independently represent a hydrogen atom or a halogen atom Represents an atom,
The nitrobenzene derivative of Claim 4 represented by these, or its salt. - 前記R2は置換もしくは非置換の炭素数2~20のアシル基である、請求項4または5に記載のニトロベンゼン誘導体またはその塩。 6. The nitrobenzene derivative or a salt thereof according to claim 4, wherein R 2 is a substituted or unsubstituted acyl group having 2 to 20 carbon atoms.
- 請求項1~6のいずれか1項に記載のニトロベンゼン誘導体またはその塩を含む、グルタチオン-S-トランスフェラーゼP1測定用蛍光プローブ。 A fluorescent probe for measuring glutathione-S-transferase P1, comprising the nitrobenzene derivative according to any one of claims 1 to 6 or a salt thereof.
- 請求項7に記載のグルタチオン-S-トランスフェラーゼP1測定用蛍光プローブを含む、がん細胞またはがん組織の検出用組成物。 A composition for detecting cancer cells or cancer tissue, comprising the fluorescent probe for measuring glutathione-S-transferase P1 according to claim 7.
- 請求項7に記載のグルタチオン-S-トランスフェラーゼP1測定用蛍光プローブを含む、がん診断用組成物。 A cancer diagnostic composition comprising the fluorescent probe for measuring glutathione-S-transferase P1 according to claim 7.
- 請求項7に記載のグルタチオン-S-トランスフェラーゼP1測定用蛍光プローブまたは請求項8に記載の検出用組成物を組織に適用する工程と、
適用後の前記組織に対して励起光を照射する工程と、
前記組織からの蛍光を検出する工程と、
含む、がん細胞またはがん組織の検出方法。 Applying the glutathione-S-transferase P1 measuring fluorescent probe according to claim 7 or the detection composition according to claim 8 to a tissue;
Irradiating the tissue after application with excitation light;
Detecting fluorescence from the tissue;
A method for detecting cancer cells or cancer tissues. - 請求項7に記載のグルタチオン-S-トランスフェラーゼP1測定用蛍光プローブまたは請求項8に記載の検出用組成物を、生体から採取した血液中の細胞と接触させる工程と、
前記細胞に対して励起光を照射する工程と、
前記細胞からの蛍光を検出する工程と、
を含む、血液中におけるがん細胞の検出方法。 Contacting the fluorescent probe for measuring glutathione-S-transferase P1 according to claim 7 or the detection composition according to claim 8 with cells in blood collected from a living body;
Irradiating the cells with excitation light;
Detecting fluorescence from the cells;
A method for detecting cancer cells in blood, comprising: - 請求項7に記載のグルタチオン-S-トランスフェラーゼP1測定用蛍光プローブまたは請求項8に記載の検出用組成物と、
生体試料固定装置と、
を含む、がん診断用キット。 The fluorescent probe for measuring glutathione-S-transferase P1 according to claim 7 or the composition for detection according to claim 8,
A biological sample fixing device;
A diagnostic kit for cancer. - 下記一般式(4):

式中、EWG基は0.66以上0.78未満のハメット定数を有する電子求引性基を表し、ベンゼン環に結合したニトロ(NO2)基はベンゼン環に結合したアミド結合に対してオルト位またはパラ位に位置し、前記EWG基は、前記ニトロ(NO2)基に対してオルト位またはパラ位に位置し、R1は、置換もしくは非置換の炭素数1~20のアルキル基、置換もしくは非置換の炭素数1~20のアルコキシ基、またはアミド基(-C(=O)NH2基)を表し、mは0~5の整数を表す、
で表されるニトロベンゼン誘導体またはその塩。 The following general formula (4):
In the formula, the EWG group represents an electron withdrawing group having a Hammett constant of 0.66 or more and less than 0.78, and the nitro (NO 2 ) group bonded to the benzene ring is ortho to the amide bond bonded to the benzene ring. The EWG group is located in the ortho or para position with respect to the nitro (NO 2 ) group, and R 1 is a substituted or unsubstituted alkyl group having 1 to 20 carbon atoms, Represents a substituted or unsubstituted alkoxy group having 1 to 20 carbon atoms, or an amide group (—C (═O) NH 2 group), and m represents an integer of 0 to 5.
Or a salt thereof. - 下記一般式(5)~(7):

式中、R1は、置換もしくは非置換の炭素数1~20のアルキル基、置換もしくは非置換の炭素数1~20のアルコキシ基、またはアミド基(-C(=O)NH2基)を表し、mは0~5の整数を表す、
からなる群から選択されるニトロベンゼン誘導体またはその塩。 The following general formulas (5) to (7):
In the formula, R 1 represents a substituted or unsubstituted alkyl group having 1 to 20 carbon atoms, a substituted or unsubstituted alkoxy group having 1 to 20 carbon atoms, or an amide group (—C (═O) NH 2 group). M represents an integer of 0 to 5,
A nitrobenzene derivative selected from the group consisting of:
Priority Applications (1)
| Application Number | Priority Date | Filing Date | Title |
|---|---|---|---|
| JP2019507026A JP7140398B2 (en) | 2017-03-24 | 2018-03-23 | Nitrobenzene derivative or salt thereof and uses thereof |
Applications Claiming Priority (2)
| Application Number | Priority Date | Filing Date | Title |
|---|---|---|---|
| JP2017-059526 | 2017-03-24 | ||
| JP2017059526 | 2017-03-24 |
Publications (1)
| Publication Number | Publication Date |
|---|---|
| WO2018174253A1 true WO2018174253A1 (en) | 2018-09-27 |
Family
ID=63584559
Family Applications (1)
| Application Number | Title | Priority Date | Filing Date |
|---|---|---|---|
| PCT/JP2018/011736 WO2018174253A1 (en) | 2017-03-24 | 2018-03-23 | Nitrobenzene derivative or salt thereof, and use of same |
Country Status (2)
| Country | Link |
|---|---|
| JP (1) | JP7140398B2 (en) |
| WO (1) | WO2018174253A1 (en) |
Cited By (4)
| Publication number | Priority date | Publication date | Assignee | Title |
|---|---|---|---|---|
| CN109776390A (en) * | 2019-01-24 | 2019-05-21 | 滨州医学院 | It is a kind of for detecting the preparation method and application of glutathione sulfydryl transferase fluorescent molecular probe |
| CN114577929A (en) * | 2022-02-14 | 2022-06-03 | 北京优量云产业计量技术创新研究院有限公司 | Method for measuring reduced glutathione |
| WO2023132337A1 (en) * | 2022-01-06 | 2023-07-13 | 国立大学法人大阪大学 | Fluorescent staining method |
| CN118027054A (en) * | 2023-12-25 | 2024-05-14 | 浙江鑫科医疗科技有限公司 | Preparation process of high-purity 5-amide fluorescein |
Citations (2)
| Publication number | Priority date | Publication date | Assignee | Title |
|---|---|---|---|---|
| KR20120053861A (en) * | 2010-11-18 | 2012-05-29 | 한국과학기술원 | Methods for the preparation of carbon nanotubes covalentely modified by poly(aryleneether)s |
| JP2016108264A (en) * | 2014-12-04 | 2016-06-20 | 学校法人東京薬科大学 | Fluorescein derivative or salt of the same, fluorescent probe for measuring glutathione-s-transferase, and method for measuring glutathione-s-transferase activity using probe |
Family Cites Families (1)
| Publication number | Priority date | Publication date | Assignee | Title |
|---|---|---|---|---|
| CN106281304B (en) * | 2015-05-15 | 2019-02-26 | 武汉大学 | A kind of fluorescence probe and preparation method thereof that can be used for malonaldehyde in living cells and be imaged |
-
2018
- 2018-03-23 WO PCT/JP2018/011736 patent/WO2018174253A1/en active Application Filing
- 2018-03-23 JP JP2019507026A patent/JP7140398B2/en active Active
Patent Citations (2)
| Publication number | Priority date | Publication date | Assignee | Title |
|---|---|---|---|---|
| KR20120053861A (en) * | 2010-11-18 | 2012-05-29 | 한국과학기술원 | Methods for the preparation of carbon nanotubes covalentely modified by poly(aryleneether)s |
| JP2016108264A (en) * | 2014-12-04 | 2016-06-20 | 学校法人東京薬科大学 | Fluorescein derivative or salt of the same, fluorescent probe for measuring glutathione-s-transferase, and method for measuring glutathione-s-transferase activity using probe |
Non-Patent Citations (4)
| Title |
|---|
| DATABASE REGISTRY 2 May 1987 (1987-05-02), retrieved from STN Database accession no. RN 107943-45-3 * |
| FUJIKAWA YUUTA ET AL.: "Development and application of fluorescent probe for detecting glutathione S-transferase (GST) activity", GLUTATHIONE S-TRANSFERASE(GST), vol. 6, 30 May 2008 (2008-05-30), pages 50 - 51 * |
| FUJIKAWA YUUTA ET AL.: "Development of fluorescent probe for detecting GST activity", THE JAPAN SOCIETY FOR ANALYTICAL CHEMISTRY, vol. 56, 5 September 2007 (2007-09-05), pages 325 * |
| FUJITA, Y. ET AL.: "Design and Synthesis of Highly Sensitive Fluorogenic Substrates for Glutathione S-Transferase and Application for Activity Imaging in Living Cells", J. AM. CHEM. SOC., vol. 130, no. 44, 2008, pages 14533 - 14543, XP055608874, ISSN: 0002-7863, DOI: 10.1021/ja802423n * |
Cited By (5)
| Publication number | Priority date | Publication date | Assignee | Title |
|---|---|---|---|---|
| CN109776390A (en) * | 2019-01-24 | 2019-05-21 | 滨州医学院 | It is a kind of for detecting the preparation method and application of glutathione sulfydryl transferase fluorescent molecular probe |
| CN109776390B (en) * | 2019-01-24 | 2022-04-12 | 滨州医学院 | Preparation method and application of fluorescence molecular probe for detecting glutathione mercaptotransferase |
| WO2023132337A1 (en) * | 2022-01-06 | 2023-07-13 | 国立大学法人大阪大学 | Fluorescent staining method |
| CN114577929A (en) * | 2022-02-14 | 2022-06-03 | 北京优量云产业计量技术创新研究院有限公司 | Method for measuring reduced glutathione |
| CN118027054A (en) * | 2023-12-25 | 2024-05-14 | 浙江鑫科医疗科技有限公司 | Preparation process of high-purity 5-amide fluorescein |
Also Published As
| Publication number | Publication date |
|---|---|
| JP7140398B2 (en) | 2022-09-21 |
| JPWO2018174253A1 (en) | 2020-01-30 |
Similar Documents
| Publication | Publication Date | Title |
|---|---|---|
| Zeng et al. | A distinctive mitochondrion-targeting, in situ-activatable near-infrared fluorescent probe for visualizing sulfur dioxide derivatives and their fluctuations in vivo | |
| Li et al. | A mitochondria-targeted two-photon fluorogenic probe for the dual-imaging of viscosity and H 2 O 2 levels in Parkinson's disease models | |
| Gebremedhin et al. | Development of a red-light emission hypoxia-sensitive two-photon fluorescent probe for in vivo nitroreductase imaging | |
| JP7140398B2 (en) | Nitrobenzene derivative or salt thereof and uses thereof | |
| JP5795963B2 (en) | Cancer diagnostics | |
| Kim et al. | COX-2 targeting indomethacin conjugated fluorescent probe | |
| More et al. | Molecular design of fluorescent pH sensors based on reduced rhodol by structure-pKa relationship for imaging of lysosome | |
| Shu et al. | Synthesis and evaluation of a novel fluorescent chemosensor for glutathione based on a rhodamine B and N-[4-(carbonyl) phenyl] maleimide conjugate and its application in living cell imaging | |
| Yang et al. | Imaging of formaldehyde in live cells and daphnia magna via Aza-Cope reaction utilizing fluorescence probe with large stokes shifts | |
| Kruschel et al. | Isoquinolinequinone N-oxides as anticancer agents effective against drug resistant cell lines | |
| Gurram et al. | Near-infrared fluorescent probe for fast track of cyclooxygenase-2 in Golgi apparatus in cancer cells | |
| Zhang et al. | A near-infrared fluorescent probe for the ratiometric detection and living cell imaging of β-galactosidase | |
| Bao et al. | NIR absorbing DICPO derivatives applied to wide range of pH and detection of glutathione in tumor | |
| KR101261791B1 (en) | A fluorescent turn-on probe for the detection of alkaline phosphatase activity in living cells | |
| Xia et al. | Imaging and inhibiting cyclooxygenase-2 using aspirin-based fluorescent reporter for the treatment of breast cancer | |
| Huang et al. | The design of a novel near-infrared fluorescent HDAC inhibitor and image of tumor cells | |
| WO2021125831A2 (en) | Luminescent probe compound for cancer cell detection, and luminescent sensor for cancer cell detection comprising same | |
| Lu et al. | Log P analyzation-based discovery of GSH activated biotin-tagged fluorescence probe for selective colorectal cancer imaging | |
| Sun et al. | Fluorescent and theranostic probes for imaging nicotinamide phosphoribosyl transferase (NAMPT) | |
| KR101510319B1 (en) | A theranostic drug delivery system for cancer cells | |
| WO2019168199A1 (en) | Fluorescent probe for detecting carboxypeptidase activity | |
| WO2021177060A1 (en) | Fluorescent probe which becomes substrate of lat1 | |
| EP3551637B1 (en) | A compound for the detection of hno in biological systems | |
| WO2018105667A1 (en) | Fluorescent probe for aldh3a1 detection | |
| Liu et al. | Sequential activation strategy of triazinyl resorufin for high selectivity fluorescence GSH detection |
Legal Events
| Date | Code | Title | Description |
|---|---|---|---|
| 121 | Ep: the epo has been informed by wipo that ep was designated in this application |
Ref document number: 18772597 Country of ref document: EP Kind code of ref document: A1 |
|
| ENP | Entry into the national phase |
Ref document number: 2019507026 Country of ref document: JP Kind code of ref document: A |
|
| NENP | Non-entry into the national phase |
Ref country code: DE |
|
| 122 | Ep: pct application non-entry in european phase |
Ref document number: 18772597 Country of ref document: EP Kind code of ref document: A1 |