WO2018168806A1 - 情報処理装置、方法及びプログラム - Google Patents
情報処理装置、方法及びプログラム Download PDFInfo
- Publication number
- WO2018168806A1 WO2018168806A1 PCT/JP2018/009578 JP2018009578W WO2018168806A1 WO 2018168806 A1 WO2018168806 A1 WO 2018168806A1 JP 2018009578 W JP2018009578 W JP 2018009578W WO 2018168806 A1 WO2018168806 A1 WO 2018168806A1
- Authority
- WO
- WIPO (PCT)
- Prior art keywords
- blood pressure
- information processing
- series data
- time
- unit
- Prior art date
- Legal status (The legal status is an assumption and is not a legal conclusion. Google has not performed a legal analysis and makes no representation as to the accuracy of the status listed.)
- Ceased
Links
Images


Classifications
-
- A—HUMAN NECESSITIES
- A61—MEDICAL OR VETERINARY SCIENCE; HYGIENE
- A61B—DIAGNOSIS; SURGERY; IDENTIFICATION
- A61B5/00—Measuring for diagnostic purposes; Identification of persons
- A61B5/72—Signal processing specially adapted for physiological signals or for diagnostic purposes
- A61B5/7235—Details of waveform analysis
- A61B5/7264—Classification of physiological signals or data, e.g. using neural networks, statistical classifiers, expert systems or fuzzy systems
-
- A—HUMAN NECESSITIES
- A61—MEDICAL OR VETERINARY SCIENCE; HYGIENE
- A61B—DIAGNOSIS; SURGERY; IDENTIFICATION
- A61B5/00—Measuring for diagnostic purposes; Identification of persons
- A61B5/02—Detecting, measuring or recording for evaluating the cardiovascular system, e.g. pulse, heart rate, blood pressure or blood flow
- A61B5/021—Measuring pressure in heart or blood vessels
- A61B5/02108—Measuring pressure in heart or blood vessels from analysis of pulse wave characteristics
-
- A—HUMAN NECESSITIES
- A61—MEDICAL OR VETERINARY SCIENCE; HYGIENE
- A61B—DIAGNOSIS; SURGERY; IDENTIFICATION
- A61B5/00—Measuring for diagnostic purposes; Identification of persons
- A61B5/02—Detecting, measuring or recording for evaluating the cardiovascular system, e.g. pulse, heart rate, blood pressure or blood flow
- A61B5/021—Measuring pressure in heart or blood vessels
- A61B5/022—Measuring pressure in heart or blood vessels by applying pressure to close blood vessels, e.g. against the skin; Ophthalmodynamometers
-
- A—HUMAN NECESSITIES
- A61—MEDICAL OR VETERINARY SCIENCE; HYGIENE
- A61B—DIAGNOSIS; SURGERY; IDENTIFICATION
- A61B5/00—Measuring for diagnostic purposes; Identification of persons
- A61B5/68—Arrangements of detecting, measuring or recording means, e.g. sensors, in relation to patient
- A61B5/6801—Arrangements of detecting, measuring or recording means, e.g. sensors, in relation to patient specially adapted to be attached to or worn on the body surface
- A61B5/6813—Specially adapted to be attached to a specific body part
- A61B5/6824—Arm or wrist
-
- A—HUMAN NECESSITIES
- A61—MEDICAL OR VETERINARY SCIENCE; HYGIENE
- A61B—DIAGNOSIS; SURGERY; IDENTIFICATION
- A61B5/00—Measuring for diagnostic purposes; Identification of persons
- A61B5/74—Details of notification to user or communication with user or patient; User input means
- A61B5/742—Details of notification to user or communication with user or patient; User input means using visual displays
Definitions
- the present invention relates to an information processing apparatus, method, and program that use continuously measured biological information.
- Blood pressure surge (or simply “surge”).
- Blood pressure information (for example, the number of occurrences of surge per unit time) related to a surge generated in a patient is considered to be useful for diagnosis and treatment of sleep apnea syndrome (SAS), for example.
- SAS sleep apnea syndrome
- ABPM “Ambulatory” Blood “Pressure” Monitor
- ABPM is a monitor that wears an arm band on the upper arm and always carries a small automatic sphygmomanometer, which regularly measures and records blood pressure (see, for example, Japanese Patent Application Laid-Open No. 2004-261442).
- the blood pressure measuring device described in Japanese Patent Application Laid-Open No. 2004-261442 or Japanese Patent Application Laid-Open No. 2007-282668 is suitable for detecting blood pressure fluctuations within a day or week, but continuously within a day. Therefore, it seems difficult to catch a blood pressure surge.
- the present invention has been made paying attention to the above circumstances, and an object of the present invention is to provide an information processing apparatus, method, and program capable of classifying blood pressure surge characteristics based on blood pressure information, which is one of biological information. .
- a first aspect of the present invention is an information processing apparatus, which is based on characteristic points and characteristic amounts that characterize a blood pressure surge from time-series data of blood pressure values that change in conjunction with a heartbeat.
- a blood pressure surge is classified into one or more patterns and one of the classified patterns is selected, a waveform corresponding to the selected pattern is displayed, or the waveform is And a display unit indicating which period of the series data corresponds.
- the second aspect of the present invention further includes a creating unit that creates a numerical value that characterizes each of the classified patterns.
- the third aspect of the present invention further includes a visualization unit that visualizes and displays the time-series data.
- the fourth aspect of the present invention further includes a viewpoint receiving unit that receives a viewpoint for classifying the patterns.
- the fifth aspect of the present invention further includes a target receiving unit that receives a desired target from the classified patterns.
- blood pressure surges are classified into one or more patterns from time series data of blood pressure values that change in conjunction with heartbeats, based on feature points and feature quantities that characterize blood pressure surges,
- a waveform corresponding to the selected pattern is displayed, or by indicating which period of the time series data the waveform corresponds to
- the characteristics of the classified pattern can be differentiated quantitatively, and the quantitatively different points can be easily grasped. be able to.
- the time series data is visualized and displayed, it is possible to visually see where in the time series data there is a blood pressure surge period. As a result, the occurrence time and occurrence frequency of the blood pressure surge can be easily grasped.
- the viewpoint for classifying the patterns since the viewpoint for classifying the patterns is accepted, the viewpoint for classification can be set by the user. Therefore, since the patterns can be classified according to the viewpoint desired by the user, it is possible to meet the demands of doctors or patients.
- the period of the waveform and blood pressure value time series data regarding the blood pressure surge that is the desired object is present. Can be easily confirmed.
- each aspect of the present invention it is possible to provide an information processing apparatus, method, and program capable of classifying blood pressure surge characteristics based on blood pressure information that is one of biological information.
- FIG. 1 is a block diagram illustrating an information processing system according to an embodiment.
- FIG. 2 is a block diagram showing a blood pressure measurement device included in the information processing system of FIG.
- FIG. 3 is a diagram illustrating an example in which the information processing system of FIG. 1 is worn on the wrist. 4 is a cross-sectional view of the wrist to which the information processing system of FIG. 3 is attached.
- FIG. 5 is a diagram illustrating an example of the arrangement of the sensors in FIGS. 2 to 4.
- FIG. 6 is a diagram illustrating an example of a characteristic amount of a blood pressure surge.
- FIG. 7 is a diagram showing a temporal change in pressure of a pressure pulse wave for each heartbeat and one of the pulse waves.
- FIG. 1 is a block diagram illustrating an information processing system according to an embodiment.
- FIG. 2 is a block diagram showing a blood pressure measurement device included in the information processing system of FIG.
- FIG. 3 is a diagram illustrating an example in which the information processing system of FIG. 1
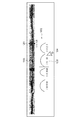
- FIG. 8 is a diagram showing time-series data of overnight blood pressure values and continuous time-series data in which occurrence of a blood pressure surge is recognized.
- FIG. 9 is a block diagram illustrating details of the information processing apparatus in the information processing system according to the embodiment.
- FIG. 10 is a diagram illustrating another example of the characteristic amount of the blood pressure surge.
- FIG. 11 is a diagram illustrating an example in which the data visualization unit in FIG. 9 visualizes time-series data, and the summary creation unit creates a summary of blood pressure surge patterns and displays it on the display unit.
- FIG. 12 is a diagram illustrating an example of a pattern displayed by the selected pattern waveform display unit illustrated in FIG. 9 and a position of the selected pattern displayed by the selected pattern position display unit.
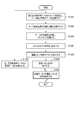
- FIG. 13 is a flowchart illustrating an example of the operation of the information processing system of FIG.
- FIG. 14 is a diagram illustrating an example of the implementation of the information processing system of FIG. 1 or FIG.
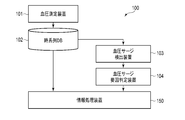
- FIG. 1 is a functional block diagram of an information processing system 100.
- a blood pressure measurement device 101 that measures blood pressure that changes in conjunction with a heartbeat
- DB time-series database
- DB blood pressure surge detection device
- a blood pressure surge factor determination device 104 and an information processing device 150 are shown.
- These devices 103, 104, and 105 may be in the same device and have different functions, or may be different devices or different functions.
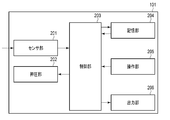
- FIG. 2 is a functional block diagram of the blood pressure measurement apparatus 101. As an example, the tonometry method is employed to measure blood pressure that changes in conjunction with heartbeats for each heartbeat.
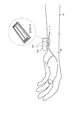
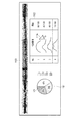
- FIG. 3 is an image diagram in which the information processing system 100 is worn, and is a schematic perspective view of the palm as viewed from the side (the direction in which fingers are aligned when the hands are spread).
- FIG. 3 shows an example in which the pressure pulse wave sensors are arranged in two rows across the radial artery. In FIG. 3, it seems that the information processing system 100 is only placed on the arm on the palm side of the arm, but the information processing system 100 is actually wrapped around the arm.
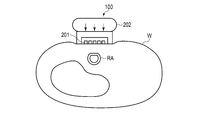
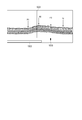
- FIG. 4 is a cross-sectional view of the information processing system 100 and the wrist W at the position of the sensor unit 201 in a state where the information processing system 100 is worn on the wrist.
- FIG. 4 also shows that the radial artery RA is pressed against the information processing system 100 and the upper part thereof is flattened.
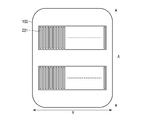
- FIG. 5 is a view of the information processing system 100 as viewed from the side in contact with the living body, and the sensor units 201 are arranged in parallel in two rows on the contacting surface.
- a plurality of sensors are arranged in a direction B that intersects the direction A in which the radial artery extends in a state where the information processing system 100 is attached to the wrist W.
- the information processing system 100 includes a blood pressure measurement device 101, a time series DB 102, a blood pressure surge detection device 103, a blood pressure surge factor determination device 104, and an information processing device 150, as shown in FIG.
- the information processing system 100 is, for example, in a ring shape, wound around a wrist or the like like a bracelet, and measures blood pressure from biological information. As shown in FIGS. 2 and 3, the information processing system 100 is arranged such that the sensor unit 201 (for example, a pressure pulse wave sensor) is positioned on the radial artery. The information processing system 100 is preferably arranged according to the height of the heart.
- the blood pressure measuring device 101 measures the pressure pulse wave pressure for each heartbeat that changes in conjunction with the heartbeat by, for example, the tonometry method.
- the tonometry method is a method of determining a blood pressure by measuring a pressure pulse wave by compressing a blood vessel with a pressure sensor (for example, a pressure pulse wave sensor). Considering a circular tube with a uniform blood vessel thickness, the blood pressure in the blood vessel and the external pressure of the blood vessel (blood pressure) The relational expression with the pressure of the pressure pulse wave can be derived. Under the condition that the blood vessel is compressed on the pressing surface in this relational expression, the pressure of the pressure pulse wave can be approximated to be equal to the blood pressure by approximating the radius of the outer wall and the inner wall of the blood vessel. Therefore, hereinafter, it is assumed that the pressure pulse wave has the same value as the blood pressure. As a result, the blood pressure measurement device 101 measures the blood pressure value of the living body to be worn for each heartbeat.
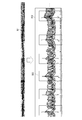
- the time series DB 102 stores time series data of blood pressure values measured by the blood pressure measurement device 101. That is, the blood pressure value for each heartbeat measured by the blood pressure measurement device 101 is recorded along with the time. For example, as shown in FIG. 8, the time series DB 102 stores time series data 801 of blood pressure values of about 30,000 heartbeats overnight. This time-series data of blood pressure values may include several hundred blood pressure surges overnight. In a period 802 obtained by enlarging a certain period of the time series data 801, several blood pressure surges 803 are seen as shown in the lower part of FIG.
- the blood pressure surge detector 103 detects a blood pressure surge from the time-series data of blood pressure values.
- the blood pressure surge detection device 103 detects a blood pressure surge based on the feature points and feature amounts of the waveform. Details will be described later with reference to FIG.
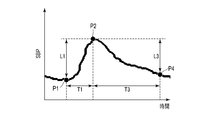
- the blood pressure surge feature amount corresponds to the blood pressure values at points P1, P2, and P4 shown in FIG.
- the quantities shown in FIG. 6 include L1, L3, T1, and T3.
- L1 is the difference between the blood pressure value at the peak point P2 of the blood pressure surge and the blood pressure value at the start point P1 of the blood pressure surge.
- L3 is the difference between the blood pressure value at the peak point P2 of the blood pressure surge and the blood pressure value at the end point P4 of the blood pressure surge.
- T1 is the difference between the time at the peak point P2 of the blood pressure surge and the time at the start point P1 of the blood pressure surge, and is referred to as a rise time.
- T3 is the difference between the time at the peak point P2 of the blood pressure surge and the time at the end point P4 of the blood pressure surge, and is referred to as a descent time.
- a waveform that typically satisfies a blood pressure surge is specified as a blood pressure surge.
- the conditions for blood pressure surge are strictly defined.
- the information processing system 100 according to this embodiment can be applied to any condition that causes a blood pressure surge by simply replacing the condition that causes a blood pressure surge described here with another condition.
- the following conditions may be considered as conditions in which a part of the time series data of blood pressure values becomes a typical blood pressure surge.
- the following conditions are expressed by changes in the value of systolic blood pressure (SBP).
- SBP systolic blood pressure
- the blood pressure value time-series data may be smoothed and processed into, for example, a continuously smooth differentiable curve.
- a curve representing time-series data of blood pressure values has been smoothed so as to be smooth and differentiable.
- the peak point P2 having the maximum value in the SBP time-series data is selected. Usually, a plurality of peak points P2 are found. Next, a minimum point P1 having a minimum value in time before the peak point P2 is searched, and when the minimum point P2 is found, for example, the process proceeds to the next condition. It is determined whether the difference L1 between the blood pressure value of P2 and the blood pressure value of P1 is larger than a certain threshold value (for example, 20 mmHg). If it is smaller, it is determined that there is no blood pressure surge.
- a certain threshold value for example, 20 mmHg
- the blood pressure surge detection device 103 regards points P1 to P4 as blood pressure surges.
- the blood pressure surge factor determination device 104 analyzes the characteristic amount of the blood pressure surge detected by the blood pressure surge detection device 103 and determines the cause of each blood pressure surge. Factors of the blood pressure surge include sleep apnea syndrome (SAS), REM (rapid eye movement) sleep state, and arousal reaction.
- SAS sleep apnea syndrome
- REM rapid eye movement
- the information processing device 150 stores the detection results of the blood pressure surge detected and determined by the blood pressure surge detection device 103 and the blood pressure surge factor determination device 104, and regarding the blood pressure surge according to an input such as a user's request from these detection results. Information to the user.
- the information about the blood pressure surge includes, for example, a summary of blood pressure surge classification, the number of classified blood pressure surge cases, representative cases, feature amount statistics, and the like. Further, for example, the information processing apparatus 150 displays the characteristics of the selected pattern for each blood pressure surge pattern using these pieces of information, and displays where a certain pattern is located in a huge amount of data. Details will be described later with reference to FIG.
- the blood pressure measurement device 101 includes a sensor unit 201, a pressing unit 202, a control unit 203, a storage unit 204, an operation unit 205, and an output unit 206.
- the sensor unit 201 detects a pressure pulse wave that changes in conjunction with the heartbeat.
- the sensor unit 201 detects a pressure pulse wave for each heartbeat.
- the sensor unit 201 includes a sensor for detecting pressure, and is arranged on the palm side as shown in FIG. 3 and is usually arranged in one or more rows in the extending direction of the arm as shown in FIG. Is done.
- each column of the sensor array including a plurality of sensors a plurality of (for example, 46) sensors are arranged so as to intersect (substantially orthogonal) the arm extending direction.
- the pressing unit 202 includes a pump, a valve, a pressure sensor, and an air bag. When the air bag swells the sensor portion of the sensor unit 201, it can press the wrist with an appropriate pressure to increase the sensitivity of the sensor. Air is introduced into the air bag by a pump and a valve, the pressure sensor detects the pressure in the air bag, and the control unit 203 monitors and controls to adjust to an appropriate pressure.
- the control unit 203 performs overall control of the blood pressure measurement device 101, receives pulse wave time-series data from the sensor unit 201, converts this data into blood pressure value time-series data, and stores the data in the storage unit 204.
- the storage unit 204 stores time-series data of blood pressure values, and passes desired data in response to a request from the control unit 203.
- the operation unit 205 receives input from a user or the like from a keyboard, a mouse, a microphone, or the like, or receives an instruction from an external server or the like by wire or wireless.
- the output unit 206 receives time-series data of blood pressure values stored in the storage unit 204 via the control unit 203 and passes it to the outside of the blood pressure measurement device 101.
- the information processing system 100 is arranged on the palm side of the wrist as shown in FIGS. 3 and 4, and the sensor unit 201 of the blood pressure measuring device 101 is arranged on the radial artery RA. As shown by the arrows in FIG. 4, the pressing unit 202 presses the sensor unit 201 against the wrist W, and the radial artery RA is compressed. Although not shown in FIGS. 3 and 4, the information processing system 100 has an annular shape and measures blood pressure by wrapping around a wrist or the like like a bracelet.
- FIG. 5 shows a surface of the sensor unit 201 on the side in contact with the wrist W.
- the sensor unit 201 includes one or more (two in this example) sensor arrays, and each of the sensor arrays has a plurality of sensors arranged in the direction B.
- the direction B is a direction that intersects the direction A in which the radial artery extends in a state where the information processing system 100 is attached to the measurement subject.
- direction A and direction B may be orthogonal.
- 46 sensors referred to as having 46 channels
- the sensor is given a channel number.
- the arrangement of the sensors is not limited to the example shown in FIG.
- Each sensor measures pressure and generates pressure data.
- a piezoelectric element that converts pressure into an electrical signal can be used.
- a pressure waveform as shown in FIG. 7 is obtained as pressure data.
- the measurement result of the pressure pulse wave is generated based on pressure data output from one sensor (active channel) adaptively selected from the sensors.
- the maximum value in the waveform of the pressure pulse wave for one heartbeat corresponds to SBP
- the minimum value in the waveform of the pressure pulse wave for one heartbeat corresponds to diastolic blood pressure (DBP).
- DBP diastolic blood pressure
- the blood pressure data can include pressure data output from each sensor together with the measurement result of the pressure pulse wave.
- the information processing system 100 may calculate time-series data of blood pressure values from the measurement result of pressure pulse waves, and output time-series data of blood pressure values instead of the measurement results of pulse waves.
- FIG. 7 shows time-series data of blood pressure calculated from the pressure pulse wave pressure when the pressure pulse wave pressure for each heartbeat is measured.
- FIG. 7 shows a blood pressure waveform 700 based on one of the pressure pulse waves.
- the blood pressure based on the pressure pulse wave is detected for each heartbeat as a waveform as shown in FIG. 7, and the blood pressure based on each pressure pulse wave is continuously detected.
- a waveform 700 in FIG. 7 is a blood pressure waveform based on a pressure pulse wave of one heartbeat, and a pressure value of 701 corresponds to SBP and a pressure value of 702 corresponds to DBP.
- the SBP 703 and the DBP 704 of the blood pressure waveform usually vary for each heartbeat.
- the sensor unit 201 detects, for example, a pulse wave of the radial artery that passes through the measurement site (for example, the left wrist) as a change in pressure (tonometry method).
- a pulse wave of the radial artery that passes through the measurement site (for example, the left wrist)
- the present invention is not limited to this.
- Each of the sensor units 201 includes a light emitting element that irradiates light toward an artery passing through a corresponding portion of the measurement site, and a light receiving element that receives reflected light (or transmitted light) of the light. May be detected as a change in volume (photoelectric method).
- each of the sensor units 201 may include a piezoelectric sensor in contact with the measurement site, and may detect distortion due to the pressure of the artery passing through the corresponding portion of the measurement site as a change in electrical resistance ( Piezoelectric method). Furthermore, each of the sensor units 201 includes a transmitting element that transmits a radio wave (transmitted wave) toward an artery that passes through a corresponding portion of the measurement site, and a receiving element that receives a reflected wave of the radio wave. The change in the distance between the artery and the sensor due to the pulse wave may be detected as a phase shift between the transmitted wave and the reflected wave (radiation method). It should be noted that other methods may be applied as long as a physical quantity capable of calculating blood pressure can be observed.
- FIG. 9 shows details of the information processing apparatus 150. It includes a blood pressure surge detection result DB 901, a classification viewpoint reception unit 902, a pattern classification unit 903, a summary creation unit 904, a confirmation target pattern reception unit 905, a data visualization unit 906, a selection pattern position display unit 907, and a selection pattern waveform display unit 908. It is out.
- the blood pressure surge detection result DB 901 stores the results of the blood pressure surge detection device 103 and the blood pressure surge factor determination device 104. That is, the blood pressure surge detection result DB 901 stores the characteristic amount of the blood pressure surge and the cause of the blood pressure surge for each detected blood pressure surge.
- the classification viewpoint reception unit 902 receives an instruction from the user regarding classification of blood pressure surges.
- the instructions from this user include, for example, the degree of risk of blood pressure surge, the cause of blood pressure surge, and the shape of blood pressure waveform.
- the risk is the risk of developing a cerebrocardiovascular event.
- the pattern classification unit 903 classifies the blood pressure surge detection result stored in the blood pressure surge detection result DB 901 in the shape of the blood pressure waveform in accordance with an instruction from the classification viewpoint reception unit 902.
- the pattern is classified by unsupervised clustering. Note that one surge blood pressure waveform may belong to a plurality of patterns.
- the summary creation unit 904 creates, for example, the statistics of the number of cases (events) belonging to each pattern (for example, the number of surges), surge, and feature amount for each pattern.
- the confirmation target pattern receiving unit 905 receives an instruction from the user regarding the confirmation target of the pattern that the user wants to confirm details for each pattern classified by the pattern classification unit 903.
- the selected pattern waveform display unit 908 displays the blood pressure waveform of the pattern selected by the user in the confirmation target pattern receiving unit 905 on a monitor or the like.
- the data visualization unit 906 displays time-series data for a desired period from the time-series data stored in the time-series DB 102 in a format that allows the user to confirm.
- the data visualization unit 906 visualizes and displays time-series data of blood pressure values for one night from bedtime to waking up, for example.
- the data visualization unit 906 graphs time-series data of blood pressure values on the monitor or the like, with the time from bedtime to wake-up time as the horizontal axis and the blood pressure value as the vertical axis.
- the blood pressure waveform of one surge belongs to multiple patterns, when creating a summary or visualizing the data, it may belong to multiple patterns, or be separated into one of the patterns. May belong to.
- the selected pattern position display unit 907 displays where the selected pattern that the user wants to confirm in the confirmation target pattern receiving unit 905 is located in the time series data visualized by the data visualization unit 906.
- the characteristic point of the blood pressure surge may correspond to an arbitrary point on the continuous curve of the time series data of the blood pressure value, but typically, the blood pressure surge start point P1, the blood pressure surge peak point P2, and the blood pressure surge end point There is P4.
- a point P3 between P2 and P4, which is set based on P1 and P2 may be used as a feature point.
- the characteristic amount of the blood pressure surge is determined by, for example, (1) the time difference between the characteristic points, (2) the fluctuation amount of the blood pressure value between the characteristic points, and (3) the envelope that connects (smoothly) the systolic blood pressure value.
- the pressure pulse wave feature amount includes, for example, the AI (Augmentation Index ratio of the reflected wave to the ejection wave), the time difference between the maximum value point and the minimum value point of the pressure pulse wave, the blood pressure value difference, and the like.
- the data visualization unit 906 visualizes, for example, the time series data 1103 of the blood pressure value overnight from the time series DB 102 on a monitor. Along with the time-series data 1103, for example, the ratio 1101 created by the summary creation unit 904 and the representative case and number 1102 of patterns are displayed on the monitor.
- the ratio 1101 is, for example, the ratio of the number of blood pressure surges corresponding to the representative case with respect to the total number of blood pressure surges in the time series data 1103.
- the pattern classification unit 903 may calculate and display the average of blood pressure surge variation, standard deviation, and the like for each pattern corresponding to the representative case as well as the ratio 1101.
- the representative case and number 1102 are the figure (or feature amount) of the representative case, the total number of blood pressure surges, and the number of patterns corresponding to the representative case.
- the relationship between the pattern selected by the selected pattern waveform display unit 908 and the time-series data 1103 will be described with reference to FIG.
- the screen transitions to the screen of FIG.
- a plurality of surges belonging to 1 are displayed (1202).
- the plurality of surges corresponding to this pattern may also display time information (for example, date / time, “1/11 1:35” in FIG. 12) when the surges occurred. That is, the time of all surges corresponding to the pattern selected by the user is displayed, and the position is displayed on the time series data. Further, for example, all surges corresponding to the patterns in FIG.
- the patterns 1102 may be displayed on the time-series data 1103 in different colors for each pattern.
- the user selects one of the displayed surges 1202 (here, the surge 1203 is selected), and the selection pattern position display unit 907 indicates the position 1201 of the surge 1203 in the time series data 1103 on the monitor. For example, when the user moves (or selects) the cursor to a desired surge, the position of the surge in the time series data 1103 is shown. For example, when the user moves the cursor over a desired surge, the location where the desired surge exists on the time axis of the time series data 1103 is highlighted.
- the blood pressure surge detection device 103 detects a blood pressure surge from the time series data of the blood pressure values stored in the time series DB 102, and the blood pressure surge detection result DB 901 is detected in the blood pressure surge detection result DB 901 together with the blood pressure surge factor determined by the blood pressure surge factor determination device 104.
- the result data is stored (step S1301).
- the classification viewpoint reception unit 902 receives a viewpoint for classifying the blood pressure surge detection result (step S1302). Specifically, for example, a viewpoint is selected using a user interface.
- the pattern classifying unit 903 classifies the blood pressure surge detection result based on the viewpoint selected by the classification viewpoint accepting unit 902, and stores it as a pattern (step S1303).
- the summary creation unit 904 creates a summary for each pattern patterned by the pattern classification unit 903 (step S1304).
- the confirmation target pattern receiving unit 905 receives a pattern that is a target confirmed by the user from among a plurality of patterns in the summary created in step S1304 (step S1305).
- the selected pattern waveform display unit 908 displays all the waveforms of the representative pattern desired by the user (step S1306).
- the data visualization unit 906 visualizes long-term data (for example, overnight sleep data) from the time-series data of blood pressure values stored in the time-series DB 102 (step S1307).
- step S1306 The position in the time series data 1103 of all the waveforms of the representative pattern desired by the user displayed in step S1306 is displayed (step S1308).
- a specific waveform for example, when the mouse is over the waveform
- the position of the waveform in the time-series data 1103 is highlighted and immediately recognized by the user.
- the information processing device 150 and the blood pressure measurement device 101 may be separate.
- the information processing apparatus 150 includes a CPU 1401, ROM 1402, RAM 1403, auxiliary storage device 1404, input device 1405, output device 1406, and blood pressure measurement device 101, which are connected to each other via a bus system 1407.
- the above-described functions of the information processing apparatus 150 can be realized by the CPU 1401 reading and executing a program stored in a computer-readable recording medium (ROM 1402).
- the RAM 1403 is used as a work memory by the CPU 1401.
- the auxiliary storage device 1404 includes, for example, a hard disk drive (HDD) or a solid state drive (SDD), and is used as the time series DB 102 and the blood pressure surge detection result DB 901, and may further store a program.
- HDD hard disk drive
- SDD solid state drive
- the input device 1405 includes, for example, a keyboard, a mouse, and a microphone, and accepts an operation from the user.
- the input device 1405 includes an operation button for causing the blood pressure measurement device 101 to start measurement, an operation button for performing calibration, and an operation button for starting or stopping communication.
- the output device 1406 includes, for example, a display device such as a liquid crystal display device and a speaker.
- the information processing device 150 transmits and receives signals to and from other computers using, for example, a communication device, and receives measurement data from, for example, a blood pressure measurement device.
- the communication device often uses a communication method capable of exchanging data with each other at a short distance, for example, using a short-range wireless communication method, specifically, Bluetooth (registered trademark), Transform Jet (registered trademark), There are communication systems such as ZigBee (registered trademark) and IRDA (registered trademark).
- Bluetooth registered trademark
- Transform Jet registered trademark
- ZigBee registered trademark
- IRDA registered trademark
- a program for executing operations performed by the pattern classification unit 903, the summary creation unit 904, and the data visualization unit 906 may be stored in the ROM 1402 or the auxiliary storage device 1404, and the CPU 1401 may execute the program.
- the program may be stored in a server or the like different from the information processing system 100, and a CPU such as the server may execute the program.
- the pressure pulse wave time series data (or blood pressure value time series data) measured by the blood pressure measurement device 101 can be transmitted to the server and processed by the server to obtain the reliability. In this case, since processing is performed by the server, the processing speed may increase.
- the apparatus parts of the pattern classification unit 903, the summary creation unit 904, and the data visualization unit 906 can be removed from the information processing system 100, the size and mass of the information processing system 100 are reduced and the sensor can be accurately measured. It can be easily arranged. As a result, the burden on the user is reduced, and accurate biological information can be easily measured.
- the apparatus of the present invention can be realized by a computer and a program, and can be recorded on a recording medium or provided through a network.
- Each of the above devices and their device portions can be implemented with either a hardware configuration or a combined configuration of hardware resources and software.
- As the software of the combined configuration a program for causing the computer to realize the functions of each device by being installed in a computer from a network or a computer-readable recording medium in advance and executed by a processor of the computer is used.
- the present invention is not limited to the above-described embodiment as it is, and can be embodied by modifying the constituent elements without departing from the scope of the invention in the implementation stage. Further, various inventions can be formed by appropriately combining a plurality of constituent elements disclosed in the embodiment. For example, some components may be deleted from all the components shown in the embodiment. Furthermore, you may combine suitably the component covering different embodiment.
- An information processing apparatus comprising a hardware processor and a memory coupled to the hardware processor,
- the hardware processor is From the time series data of blood pressure values that change in conjunction with the heart rate, classify the blood pressure surge into one or more patterns based on the feature points and features that characterize the blood pressure surge, When one of the classified patterns is selected, a waveform corresponding to the selected pattern is displayed, or is configured to indicate which period of the time-series data the waveform corresponds to Information processing device.
- (Appendix 2) Using at least one hardware processor, classify the blood pressure surge into one or more patterns from the time series data of blood pressure values that change in conjunction with the heartbeat, based on the feature points and feature quantities that characterize the blood pressure surge, When one of the classified patterns is selected using at least one hardware processor, a waveform corresponding to the selected pattern is displayed, or in which period of the time-series data the waveform is An information processing method comprising indicating whether it corresponds.
Landscapes
- Health & Medical Sciences (AREA)
- Life Sciences & Earth Sciences (AREA)
- Engineering & Computer Science (AREA)
- Physics & Mathematics (AREA)
- Biophysics (AREA)
- General Health & Medical Sciences (AREA)
- Veterinary Medicine (AREA)
- Public Health (AREA)
- Animal Behavior & Ethology (AREA)
- Surgery (AREA)
- Molecular Biology (AREA)
- Medical Informatics (AREA)
- Heart & Thoracic Surgery (AREA)
- Pathology (AREA)
- Biomedical Technology (AREA)
- Cardiology (AREA)
- Physiology (AREA)
- Artificial Intelligence (AREA)
- Vascular Medicine (AREA)
- Evolutionary Computation (AREA)
- Signal Processing (AREA)
- Psychiatry (AREA)
- Mathematical Physics (AREA)
- Computer Vision & Pattern Recognition (AREA)
- Fuzzy Systems (AREA)
- Ophthalmology & Optometry (AREA)
- Measuring Pulse, Heart Rate, Blood Pressure Or Blood Flow (AREA)
Priority Applications (3)
| Application Number | Priority Date | Filing Date | Title |
|---|---|---|---|
| CN201880017125.1A CN110402103A (zh) | 2017-03-15 | 2018-03-12 | 信息处理装置、方法以及程序 |
| DE112018001382.0T DE112018001382T5 (de) | 2017-03-15 | 2018-03-12 | Informationsverarbeitungsvorrichtung, verfahren und programm |
| US16/561,506 US12029590B2 (en) | 2017-03-15 | 2019-09-05 | Blood pressure surge pattern detection system |
Applications Claiming Priority (2)
| Application Number | Priority Date | Filing Date | Title |
|---|---|---|---|
| JP2017050066A JP6766708B2 (ja) | 2017-03-15 | 2017-03-15 | 情報処理装置、方法及びプログラム |
| JP2017-050066 | 2017-03-15 |
Related Child Applications (1)
| Application Number | Title | Priority Date | Filing Date |
|---|---|---|---|
| US16/561,506 Continuation US12029590B2 (en) | 2017-03-15 | 2019-09-05 | Blood pressure surge pattern detection system |
Publications (1)
| Publication Number | Publication Date |
|---|---|
| WO2018168806A1 true WO2018168806A1 (ja) | 2018-09-20 |
Family
ID=63522115
Family Applications (1)
| Application Number | Title | Priority Date | Filing Date |
|---|---|---|---|
| PCT/JP2018/009578 Ceased WO2018168806A1 (ja) | 2017-03-15 | 2018-03-12 | 情報処理装置、方法及びプログラム |
Country Status (5)
| Country | Link |
|---|---|
| US (1) | US12029590B2 (enExample) |
| JP (1) | JP6766708B2 (enExample) |
| CN (1) | CN110402103A (enExample) |
| DE (1) | DE112018001382T5 (enExample) |
| WO (1) | WO2018168806A1 (enExample) |
Cited By (2)
| Publication number | Priority date | Publication date | Assignee | Title |
|---|---|---|---|---|
| JP2020130533A (ja) * | 2019-02-18 | 2020-08-31 | オムロンヘルスケア株式会社 | 血圧レベル変化検出装置、血圧レベル変化検出方法、およびプログラム |
| JP2020156601A (ja) * | 2019-03-25 | 2020-10-01 | オムロンヘルスケア株式会社 | 血圧関連情報表示装置、血圧関連情報表示方法、およびプログラム |
Families Citing this family (4)
| Publication number | Priority date | Publication date | Assignee | Title |
|---|---|---|---|---|
| US10422637B1 (en) * | 2016-06-10 | 2019-09-24 | Facebook Technologies, Llc | Wave reflection deformation sensing apparatus |
| JP7267055B2 (ja) * | 2019-03-25 | 2023-05-01 | オムロンヘルスケア株式会社 | 血圧関連情報表示装置、血圧関連情報表示方法、およびプログラム |
| JP7253419B2 (ja) * | 2019-03-25 | 2023-04-06 | オムロンヘルスケア株式会社 | 血圧関連情報表示装置、血圧関連情報表示方法、およびプログラム |
| CN118779710B (zh) * | 2024-09-09 | 2024-12-13 | 杭州泽进科技有限公司 | 一种多模态异构体征数据建构方法及系统 |
Citations (6)
| Publication number | Priority date | Publication date | Assignee | Title |
|---|---|---|---|---|
| JPH0951880A (ja) * | 1995-08-15 | 1997-02-25 | Nec Corp | 不整脈リコール波形表示方法及び表示装置 |
| JP2005000409A (ja) * | 2003-06-12 | 2005-01-06 | Omron Healthcare Co Ltd | 心電計および心電波形表示方法 |
| US20070156201A1 (en) * | 2005-12-29 | 2007-07-05 | Cvrx, Inc. | Hypertension treatment device and method for mitigating rapid changes in blood pressure |
| JP2009028441A (ja) * | 2007-07-30 | 2009-02-12 | Omron Healthcare Co Ltd | 生体情報測定装置、生体情報表示方法、および表示プログラム |
| JP2015216970A (ja) * | 2014-05-14 | 2015-12-07 | オムロンヘルスケア株式会社 | 血圧関連情報表示装置およびプログラム |
| JP2016202345A (ja) * | 2015-04-17 | 2016-12-08 | セイコーエプソン株式会社 | 生体情報処理システム、生体情報処理装置及び解析結果情報の生成方法 |
Family Cites Families (14)
| Publication number | Priority date | Publication date | Assignee | Title |
|---|---|---|---|---|
| EP0482242B1 (en) * | 1990-10-26 | 1994-12-14 | Hewlett-Packard GmbH | Method and apparatus for automatic blood pressure monitoring |
| EP0642760B1 (en) * | 1993-04-02 | 1999-02-10 | Osachi Co., Ltd | Electronic blood pressure measuring instrument |
| JP4025220B2 (ja) | 2003-03-03 | 2007-12-19 | ▲苅▼尾 七臣 | 血圧計および心血管系疾病リスク分析プログラム |
| US7248915B2 (en) * | 2004-02-26 | 2007-07-24 | Nokia Corporation | Natural alarm clock |
| JP2007282668A (ja) | 2006-04-12 | 2007-11-01 | Omron Healthcare Co Ltd | 血圧計、血圧測定システムおよび測定データ処理プログラム |
| US20080200819A1 (en) * | 2007-02-20 | 2008-08-21 | Lynn Lawrence A | Orthostasis detection system and method |
| EP2162059B1 (en) * | 2007-06-12 | 2021-01-13 | Sotera Wireless, Inc. | Vital sign monitor and method for measuring blood pressure using optical, electrical, and pressure waveforms |
| US20100017225A1 (en) * | 2008-07-18 | 2010-01-21 | WAVi | Diagnostician customized medical diagnostic apparatus using a digital library |
| EP2568876A4 (en) * | 2010-05-14 | 2014-09-03 | Ct For Dev Of Advanced Computing | DIAGNOSTIC CLASSIFICATIONS OF WAVEFORM DATA OF PULSE SIGNALS |
| EP2668896B1 (en) * | 2011-01-24 | 2014-12-17 | Act Medical Service Co., Ltd. | Blood vessel pulse-wave measuring system |
| CN104042200B (zh) * | 2014-06-24 | 2016-02-17 | 北京航空航天大学 | 一种逐拍动脉血压的无创监测装置及其方法 |
| US20160302736A1 (en) * | 2015-04-17 | 2016-10-20 | Seiko Epson Corporation | Biological information processing system, biological information processing device, and method for generating analysis result information |
| WO2017136772A1 (en) * | 2016-02-03 | 2017-08-10 | Angilytics Inc. | Non-invasive and non-occlusive blood pressure monitoring devices and methods |
| JP7267055B2 (ja) * | 2019-03-25 | 2023-05-01 | オムロンヘルスケア株式会社 | 血圧関連情報表示装置、血圧関連情報表示方法、およびプログラム |
-
2017
- 2017-03-15 JP JP2017050066A patent/JP6766708B2/ja active Active
-
2018
- 2018-03-12 DE DE112018001382.0T patent/DE112018001382T5/de active Pending
- 2018-03-12 CN CN201880017125.1A patent/CN110402103A/zh active Pending
- 2018-03-12 WO PCT/JP2018/009578 patent/WO2018168806A1/ja not_active Ceased
-
2019
- 2019-09-05 US US16/561,506 patent/US12029590B2/en active Active
Patent Citations (6)
| Publication number | Priority date | Publication date | Assignee | Title |
|---|---|---|---|---|
| JPH0951880A (ja) * | 1995-08-15 | 1997-02-25 | Nec Corp | 不整脈リコール波形表示方法及び表示装置 |
| JP2005000409A (ja) * | 2003-06-12 | 2005-01-06 | Omron Healthcare Co Ltd | 心電計および心電波形表示方法 |
| US20070156201A1 (en) * | 2005-12-29 | 2007-07-05 | Cvrx, Inc. | Hypertension treatment device and method for mitigating rapid changes in blood pressure |
| JP2009028441A (ja) * | 2007-07-30 | 2009-02-12 | Omron Healthcare Co Ltd | 生体情報測定装置、生体情報表示方法、および表示プログラム |
| JP2015216970A (ja) * | 2014-05-14 | 2015-12-07 | オムロンヘルスケア株式会社 | 血圧関連情報表示装置およびプログラム |
| JP2016202345A (ja) * | 2015-04-17 | 2016-12-08 | セイコーエプソン株式会社 | 生体情報処理システム、生体情報処理装置及び解析結果情報の生成方法 |
Cited By (7)
| Publication number | Priority date | Publication date | Assignee | Title |
|---|---|---|---|---|
| JP2020130533A (ja) * | 2019-02-18 | 2020-08-31 | オムロンヘルスケア株式会社 | 血圧レベル変化検出装置、血圧レベル変化検出方法、およびプログラム |
| JP7127571B2 (ja) | 2019-02-18 | 2022-08-30 | オムロンヘルスケア株式会社 | 血圧レベル変化検出装置、血圧レベル変化検出方法、およびプログラム |
| JP2020156601A (ja) * | 2019-03-25 | 2020-10-01 | オムロンヘルスケア株式会社 | 血圧関連情報表示装置、血圧関連情報表示方法、およびプログラム |
| WO2020195616A1 (ja) * | 2019-03-25 | 2020-10-01 | オムロンヘルスケア株式会社 | 血圧関連情報表示装置、血圧関連情報表示方法、およびプログラム |
| CN113613554A (zh) * | 2019-03-25 | 2021-11-05 | 欧姆龙健康医疗事业株式会社 | 血压关联信息显示装置、血压关联信息显示方法以及程序 |
| JP7256049B2 (ja) | 2019-03-25 | 2023-04-11 | オムロンヘルスケア株式会社 | 血圧関連情報表示装置、血圧関連情報表示方法、およびプログラム |
| CN113613554B (zh) * | 2019-03-25 | 2024-09-13 | 欧姆龙健康医疗事业株式会社 | 血压关联信息显示装置、血压关联信息显示方法以及程序 |
Also Published As
| Publication number | Publication date |
|---|---|
| CN110402103A (zh) | 2019-11-01 |
| JP6766708B2 (ja) | 2020-10-14 |
| US12029590B2 (en) | 2024-07-09 |
| JP2018153232A (ja) | 2018-10-04 |
| DE112018001382T5 (de) | 2019-11-21 |
| US20190388037A1 (en) | 2019-12-26 |
Similar Documents
| Publication | Publication Date | Title |
|---|---|---|
| WO2018168806A1 (ja) | 情報処理装置、方法及びプログラム | |
| US20140257124A1 (en) | Atrial fibrillation analyzer and program | |
| JP2014171660A (ja) | 心房細動解析装置、心房細動解析システム、心房細動解析方法およびプログラム | |
| CN105361858B (zh) | 一种血压数据处理的方法及可穿戴设备 | |
| JP2016158806A5 (enExample) | ||
| US20190387986A1 (en) | Blood pressure measurement apparatus, method, and program | |
| JP2016202346A (ja) | 生体情報処理システム、生体情報処理装置及び解析結果情報の生成方法 | |
| JP6547838B2 (ja) | 診断支援装置、診断支援方法、診断支援プログラム | |
| WO2018168807A1 (ja) | 血圧測定装置、方法及びプログラム | |
| JP6060563B2 (ja) | 心房細動判定装置、心房細動判定方法およびプログラム | |
| US20210386305A1 (en) | Apparatus and method for estimating blood pressure | |
| JP6668606B2 (ja) | 生体情報処理システム、生体情報処理装置及び解析結果情報の生成方法 | |
| US12186060B2 (en) | Blood pressure-related information display device, blood pressure-related information display method, and computer-readable recording medium | |
| KR20240095929A (ko) | 오실로메트릭 신호를 이용한 심혈관 건강 상태 추출 장치 및 방법 | |
| CN116369860A (zh) | 一种皮肤状态的监测系统及方法 | |
| US12186112B2 (en) | Blood pressure-related display device, blood pressure-related information display method, and computer-readable recording medium | |
| US20220071495A1 (en) | Blood pressure-related information display device, blood pressure-related information display method, and a non-transitory computer-readable computer medium | |
| US20230181103A1 (en) | Apparatus and method for evaluating obstructive sleep apnea with ppg signal | |
| WO2020170826A1 (ja) | 血圧関連情報処理装置、血圧関連情報処理方法、およびプログラム | |
| Labat et al. | Wearable Blood Pressure Monitoring System-Case Study of Multiplatform Applications for Medical Use | |
| US20250359768A1 (en) | Device and method for automatic and repetitive measurement of blood pressure in smart blood pressure monitors | |
| JP2020156608A5 (enExample) | ||
| WO2020170858A1 (ja) | 血圧レベル変化検出装置、血圧レベル変化検出方法、およびプログラム |
Legal Events
| Date | Code | Title | Description |
|---|---|---|---|
| 121 | Ep: the epo has been informed by wipo that ep was designated in this application |
Ref document number: 18768641 Country of ref document: EP Kind code of ref document: A1 |
|
| 122 | Ep: pct application non-entry in european phase |
Ref document number: 18768641 Country of ref document: EP Kind code of ref document: A1 |