WO2018083952A1 - 磁気共鳴イメージング装置および酸素摂取率算出方法 - Google Patents
磁気共鳴イメージング装置および酸素摂取率算出方法 Download PDFInfo
- Publication number
- WO2018083952A1 WO2018083952A1 PCT/JP2017/036826 JP2017036826W WO2018083952A1 WO 2018083952 A1 WO2018083952 A1 WO 2018083952A1 JP 2017036826 W JP2017036826 W JP 2017036826W WO 2018083952 A1 WO2018083952 A1 WO 2018083952A1
- Authority
- WO
- WIPO (PCT)
- Prior art keywords
- distribution
- image
- oxygen
- uptake rate
- oxygen uptake
- Prior art date
Links
Images


Classifications
-
- A—HUMAN NECESSITIES
- A61—MEDICAL OR VETERINARY SCIENCE; HYGIENE
- A61B—DIAGNOSIS; SURGERY; IDENTIFICATION
- A61B5/00—Measuring for diagnostic purposes; Identification of persons
- A61B5/145—Measuring characteristics of blood in vivo, e.g. gas concentration, pH value; Measuring characteristics of body fluids or tissues, e.g. interstitial fluid, cerebral tissue
- A61B5/14542—Measuring characteristics of blood in vivo, e.g. gas concentration, pH value; Measuring characteristics of body fluids or tissues, e.g. interstitial fluid, cerebral tissue for measuring blood gases
-
- A—HUMAN NECESSITIES
- A61—MEDICAL OR VETERINARY SCIENCE; HYGIENE
- A61B—DIAGNOSIS; SURGERY; IDENTIFICATION
- A61B5/00—Measuring for diagnostic purposes; Identification of persons
- A61B5/0033—Features or image-related aspects of imaging apparatus classified in A61B5/00, e.g. for MRI, optical tomography or impedance tomography apparatus; arrangements of imaging apparatus in a room
- A61B5/004—Features or image-related aspects of imaging apparatus classified in A61B5/00, e.g. for MRI, optical tomography or impedance tomography apparatus; arrangements of imaging apparatus in a room adapted for image acquisition of a particular organ or body part
- A61B5/0042—Features or image-related aspects of imaging apparatus classified in A61B5/00, e.g. for MRI, optical tomography or impedance tomography apparatus; arrangements of imaging apparatus in a room adapted for image acquisition of a particular organ or body part for the brain
-
- A—HUMAN NECESSITIES
- A61—MEDICAL OR VETERINARY SCIENCE; HYGIENE
- A61B—DIAGNOSIS; SURGERY; IDENTIFICATION
- A61B5/00—Measuring for diagnostic purposes; Identification of persons
- A61B5/05—Detecting, measuring or recording for diagnosis by means of electric currents or magnetic fields; Measuring using microwaves or radio waves
- A61B5/055—Detecting, measuring or recording for diagnosis by means of electric currents or magnetic fields; Measuring using microwaves or radio waves involving electronic [EMR] or nuclear [NMR] magnetic resonance, e.g. magnetic resonance imaging
-
- A—HUMAN NECESSITIES
- A61—MEDICAL OR VETERINARY SCIENCE; HYGIENE
- A61B—DIAGNOSIS; SURGERY; IDENTIFICATION
- A61B5/00—Measuring for diagnostic purposes; Identification of persons
- A61B5/145—Measuring characteristics of blood in vivo, e.g. gas concentration, pH value; Measuring characteristics of body fluids or tissues, e.g. interstitial fluid, cerebral tissue
- A61B5/1455—Measuring characteristics of blood in vivo, e.g. gas concentration, pH value; Measuring characteristics of body fluids or tissues, e.g. interstitial fluid, cerebral tissue using optical sensors, e.g. spectral photometrical oximeters
- A61B5/14551—Measuring characteristics of blood in vivo, e.g. gas concentration, pH value; Measuring characteristics of body fluids or tissues, e.g. interstitial fluid, cerebral tissue using optical sensors, e.g. spectral photometrical oximeters for measuring blood gases
-
- G—PHYSICS
- G01—MEASURING; TESTING
- G01R—MEASURING ELECTRIC VARIABLES; MEASURING MAGNETIC VARIABLES
- G01R33/00—Arrangements or instruments for measuring magnetic variables
- G01R33/20—Arrangements or instruments for measuring magnetic variables involving magnetic resonance
- G01R33/44—Arrangements or instruments for measuring magnetic variables involving magnetic resonance using nuclear magnetic resonance [NMR]
- G01R33/443—Assessment of an electric or a magnetic field, e.g. spatial mapping, determination of a B0 drift or dosimetry
-
- G—PHYSICS
- G01—MEASURING; TESTING
- G01R—MEASURING ELECTRIC VARIABLES; MEASURING MAGNETIC VARIABLES
- G01R33/00—Arrangements or instruments for measuring magnetic variables
- G01R33/20—Arrangements or instruments for measuring magnetic variables involving magnetic resonance
- G01R33/44—Arrangements or instruments for measuring magnetic variables involving magnetic resonance using nuclear magnetic resonance [NMR]
- G01R33/48—NMR imaging systems
- G01R33/54—Signal processing systems, e.g. using pulse sequences ; Generation or control of pulse sequences; Operator console
- G01R33/543—Control of the operation of the MR system, e.g. setting of acquisition parameters prior to or during MR data acquisition, dynamic shimming, use of one or more scout images for scan plane prescription
-
- G—PHYSICS
- G01—MEASURING; TESTING
- G01R—MEASURING ELECTRIC VARIABLES; MEASURING MAGNETIC VARIABLES
- G01R33/00—Arrangements or instruments for measuring magnetic variables
- G01R33/20—Arrangements or instruments for measuring magnetic variables involving magnetic resonance
- G01R33/44—Arrangements or instruments for measuring magnetic variables involving magnetic resonance using nuclear magnetic resonance [NMR]
- G01R33/48—NMR imaging systems
- G01R33/54—Signal processing systems, e.g. using pulse sequences ; Generation or control of pulse sequences; Operator console
- G01R33/56—Image enhancement or correction, e.g. subtraction or averaging techniques, e.g. improvement of signal-to-noise ratio and resolution
- G01R33/5602—Image enhancement or correction, e.g. subtraction or averaging techniques, e.g. improvement of signal-to-noise ratio and resolution by filtering or weighting based on different relaxation times within the sample, e.g. T1 weighting using an inversion pulse
-
- G—PHYSICS
- G01—MEASURING; TESTING
- G01R—MEASURING ELECTRIC VARIABLES; MEASURING MAGNETIC VARIABLES
- G01R33/00—Arrangements or instruments for measuring magnetic variables
- G01R33/20—Arrangements or instruments for measuring magnetic variables involving magnetic resonance
- G01R33/44—Arrangements or instruments for measuring magnetic variables involving magnetic resonance using nuclear magnetic resonance [NMR]
- G01R33/48—NMR imaging systems
- G01R33/54—Signal processing systems, e.g. using pulse sequences ; Generation or control of pulse sequences; Operator console
- G01R33/56—Image enhancement or correction, e.g. subtraction or averaging techniques, e.g. improvement of signal-to-noise ratio and resolution
- G01R33/5608—Data processing and visualization specially adapted for MR, e.g. for feature analysis and pattern recognition on the basis of measured MR data, segmentation of measured MR data, edge contour detection on the basis of measured MR data, for enhancing measured MR data in terms of signal-to-noise ratio by means of noise filtering or apodization, for enhancing measured MR data in terms of resolution by means for deblurring, windowing, zero filling, or generation of gray-scaled images, colour-coded images or images displaying vectors instead of pixels
-
- G—PHYSICS
- G06—COMPUTING; CALCULATING OR COUNTING
- G06T—IMAGE DATA PROCESSING OR GENERATION, IN GENERAL
- G06T1/00—General purpose image data processing
-
- G—PHYSICS
- G01—MEASURING; TESTING
- G01N—INVESTIGATING OR ANALYSING MATERIALS BY DETERMINING THEIR CHEMICAL OR PHYSICAL PROPERTIES
- G01N24/00—Investigating or analyzing materials by the use of nuclear magnetic resonance, electron paramagnetic resonance or other spin effects
- G01N24/08—Investigating or analyzing materials by the use of nuclear magnetic resonance, electron paramagnetic resonance or other spin effects by using nuclear magnetic resonance
-
- G—PHYSICS
- G01—MEASURING; TESTING
- G01R—MEASURING ELECTRIC VARIABLES; MEASURING MAGNETIC VARIABLES
- G01R33/00—Arrangements or instruments for measuring magnetic variables
- G01R33/20—Arrangements or instruments for measuring magnetic variables involving magnetic resonance
- G01R33/44—Arrangements or instruments for measuring magnetic variables involving magnetic resonance using nuclear magnetic resonance [NMR]
- G01R33/48—NMR imaging systems
- G01R33/4818—MR characterised by data acquisition along a specific k-space trajectory or by the temporal order of k-space coverage, e.g. centric or segmented coverage of k-space
- G01R33/4824—MR characterised by data acquisition along a specific k-space trajectory or by the temporal order of k-space coverage, e.g. centric or segmented coverage of k-space using a non-Cartesian trajectory
-
- G—PHYSICS
- G01—MEASURING; TESTING
- G01R—MEASURING ELECTRIC VARIABLES; MEASURING MAGNETIC VARIABLES
- G01R33/00—Arrangements or instruments for measuring magnetic variables
- G01R33/20—Arrangements or instruments for measuring magnetic variables involving magnetic resonance
- G01R33/44—Arrangements or instruments for measuring magnetic variables involving magnetic resonance using nuclear magnetic resonance [NMR]
- G01R33/48—NMR imaging systems
- G01R33/50—NMR imaging systems based on the determination of relaxation times, e.g. T1 measurement by IR sequences; T2 measurement by multiple-echo sequences
-
- G—PHYSICS
- G01—MEASURING; TESTING
- G01R—MEASURING ELECTRIC VARIABLES; MEASURING MAGNETIC VARIABLES
- G01R33/00—Arrangements or instruments for measuring magnetic variables
- G01R33/20—Arrangements or instruments for measuring magnetic variables involving magnetic resonance
- G01R33/44—Arrangements or instruments for measuring magnetic variables involving magnetic resonance using nuclear magnetic resonance [NMR]
- G01R33/48—NMR imaging systems
- G01R33/54—Signal processing systems, e.g. using pulse sequences ; Generation or control of pulse sequences; Operator console
- G01R33/56—Image enhancement or correction, e.g. subtraction or averaging techniques, e.g. improvement of signal-to-noise ratio and resolution
- G01R33/561—Image enhancement or correction, e.g. subtraction or averaging techniques, e.g. improvement of signal-to-noise ratio and resolution by reduction of the scanning time, i.e. fast acquiring systems, e.g. using echo-planar pulse sequences
- G01R33/5615—Echo train techniques involving acquiring plural, differently encoded, echo signals after one RF excitation, e.g. using gradient refocusing in echo planar imaging [EPI], RF refocusing in rapid acquisition with relaxation enhancement [RARE] or using both RF and gradient refocusing in gradient and spin echo imaging [GRASE]
- G01R33/5616—Echo train techniques involving acquiring plural, differently encoded, echo signals after one RF excitation, e.g. using gradient refocusing in echo planar imaging [EPI], RF refocusing in rapid acquisition with relaxation enhancement [RARE] or using both RF and gradient refocusing in gradient and spin echo imaging [GRASE] using gradient refocusing, e.g. EPI
-
- G—PHYSICS
- G01—MEASURING; TESTING
- G01R—MEASURING ELECTRIC VARIABLES; MEASURING MAGNETIC VARIABLES
- G01R33/00—Arrangements or instruments for measuring magnetic variables
- G01R33/20—Arrangements or instruments for measuring magnetic variables involving magnetic resonance
- G01R33/44—Arrangements or instruments for measuring magnetic variables involving magnetic resonance using nuclear magnetic resonance [NMR]
- G01R33/48—NMR imaging systems
- G01R33/54—Signal processing systems, e.g. using pulse sequences ; Generation or control of pulse sequences; Operator console
- G01R33/56—Image enhancement or correction, e.g. subtraction or averaging techniques, e.g. improvement of signal-to-noise ratio and resolution
- G01R33/561—Image enhancement or correction, e.g. subtraction or averaging techniques, e.g. improvement of signal-to-noise ratio and resolution by reduction of the scanning time, i.e. fast acquiring systems, e.g. using echo-planar pulse sequences
- G01R33/5615—Echo train techniques involving acquiring plural, differently encoded, echo signals after one RF excitation, e.g. using gradient refocusing in echo planar imaging [EPI], RF refocusing in rapid acquisition with relaxation enhancement [RARE] or using both RF and gradient refocusing in gradient and spin echo imaging [GRASE]
- G01R33/5617—Echo train techniques involving acquiring plural, differently encoded, echo signals after one RF excitation, e.g. using gradient refocusing in echo planar imaging [EPI], RF refocusing in rapid acquisition with relaxation enhancement [RARE] or using both RF and gradient refocusing in gradient and spin echo imaging [GRASE] using RF refocusing, e.g. RARE
Definitions
- the present invention relates to a magnetic resonance imaging (MRI) technology.
- the present invention relates to an image processing technique for calculating in-vivo oxygen amount characteristics using acquired images.
- the magnetic resonance imaging apparatus is a noninvasive medical diagnostic imaging apparatus using a nuclear magnetic resonance phenomenon in which hydrogen nuclei (protons) placed in a static magnetic field resonate with a high frequency magnetic field having a specific frequency. Since the nuclear magnetic resonance signal changes depending on various physical properties such as proton density and relaxation time, it is possible to evaluate not only the morphology and material evaluation of the lesion, but also the metabolism and blood perfusion of living tissues. At present, it is attempted to predict the therapeutic effect and prognosis by applying this to the evaluation of cerebral ischemic disease and tumor.
- Diagnosis and severity diagnosis of cerebral ischemic disease and tumors can be performed in the tissue by oxygen imaging such as Oxygen Extraction Fraction (OEF) and oxygen saturation within the tumor (StO 2 : Tissue Oxygen Saturation). It is clinically important to assess oxygen metabolism.
- OEF Oxygen Extraction Fraction
- StO 2 Tissue Oxygen Saturation
- PTT Positron Emission Tomography
- FMISO F-labeled fluoroisonidazole
- the PET inspection has a problem in that the inspection time is long and there is radiation exposure.
- the MRI examination has a feature that the burden on the patient can be reduced because the imaging time is short and there is no radiation exposure.
- Several methods have been proposed for calculating the oxygen uptake rate using MRI.
- blood signals in capillaries of living tissue are measured by a plurality of TEs using a speed selective pre-pulse sequence and a spin echo sequence.
- the T2 value of the blood signal is calculated by signal fitting from the measured signal intensities of a plurality of TEs.
- the oxygen uptake rate of the living tissue is calculated using the relationship between the oxygen saturation of the blood acquired separately and the T2 value of the blood signal (see, for example, Patent Document 1).
- Another method is to calculate the oxygen uptake rate from the change in magnetic susceptibility in the living body.
- a method for capturing a change in magnetic susceptibility reflecting the oxygen uptake rate there is a method using a quantitative magnetic susceptibility mapping (QSM) method.
- QSM is a technique for calculating a local magnetic field change caused by a magnetic susceptibility difference between tissues from a phase distribution of MR images and estimating a magnetic susceptibility distribution based on a relational expression between the magnetic field and the magnetic susceptibility.
- a method of calculating the oxygen uptake rate using QSM for example, there is a method of paying attention to only the vein of the magnetic susceptibility distribution calculated by the QSM method and calculating the oxygen saturation in the vein from the magnetic susceptibility (for example, Non-patent document 1).
- caffeine is administered to the subject, and before and after that, the cerebral blood flow (CBF) and the magnetic susceptibility distribution are calculated using an ASL (Arterial Spin Labeling) method and a QSM method, respectively.
- ASL Arterial Spin Labeling
- OEF oxygen metabolism rate
- Patent Document 1 has an advantage that the oxygen uptake rate in the brain parenchyma can be calculated because the T2 value of the blood signal in the capillary of the living tissue is calculated.
- the T2 value of blood changes nonlinearly with the blood composition such as the hematocrit value, there is a problem that it is difficult to calculate the oxygen uptake rate from the T2 value of blood.
- Non-Patent Document 1 has an advantage of high accuracy since the oxygen uptake rate is calculated from the magnetic susceptibility of the vein using the QSM method. However, since only the oxygen uptake rate of venous blood is calculated, there is a problem that the oxygen uptake rate in the brain parenchyma cannot be calculated.
- Non-Patent Document 2 has the advantage that the oxygen uptake rate in the brain parenchyma can be calculated using the QSM method, there is a problem that a load of administering caffeine to the subject has to be given. In addition, there is a problem that the accuracy of the oxygen uptake rate to be calculated is reduced in diseases in which CMRO 2 changes before and after caffeine administration.
- the present invention has been made in view of the above circumstances.
- OEF oxygen uptake rate
- the brain parenchyma can be obtained by simple processing without giving a load such as caffeine administration.
- An object of the present invention is to provide a technique for calculating the OEF in the brain.
- the present invention calculates a physical property value image having a physical property value reflecting an oxygen amount characteristic such as an oxygen uptake rate as a pixel value from a complex image generated from a nuclear magnetic resonance signal. Then, after the calculated physical property value image is separated into at least two types of tissues and any one of the tissue separated images is converted into oxygen amount characteristics, the pixel value of an arbitrary pixel and the average value of surrounding pixels are substantially equal. Based on the above condition, the oxygen amount characteristic distribution for the target region is estimated.
- the MRI apparatus of the present invention includes a transmitter that transmits a high-frequency magnetic field pulse to a subject arranged in a static magnetic field, a receiver that receives a nuclear magnetic resonance signal generated by the subject, and a gradient magnetic field in the static magnetic field.
- a measurement unit having a gradient magnetic field generation unit for providing, a measurement control unit for controlling the operation of the measurement unit according to a preset imaging sequence, and a calculator for performing an operation on the received nuclear magnetic resonance signal,
- An image reconstruction unit that generates a complex image from a nuclear magnetic resonance signal acquired at least one echo time, and a physical property value distribution that calculates a physical property value image having a physical property value reflecting an oxygen amount characteristic as a pixel value
- the tissue separation unit that separates the physical property value image of the target region into at least two types of tissues and generates a plurality of tissue separation images, and each of the plurality of tissue separation images.
- the oxygen amount characteristic conversion unit that converts the physical property value into the oxygen amount characteristic and the tissue separation image after the pixel value is converted into the oxygen amount characteristic
- the pixel value of an arbitrary pixel and the average value of surrounding pixels are substantially
- an oxygen amount characteristic distribution estimating unit that estimates an oxygen amount characteristic distribution of the target region based on a condition of being equal.
- the oxygen content characteristic includes either oxygen uptake rate or oxygen saturation.
- the oxygen amount characteristic distribution in the brain including the brain parenchyma can be calculated by simple processing without giving a load such as caffeine administration to the subject, and diagnostic accuracy is improved.
- FIG. 3B is an external view of a magnetic resonance imaging apparatus with enhanced openness according to an embodiment of the present invention. It is a block diagram which shows schematic structure of the MRI apparatus in embodiment of this invention.
- (A), (b) is a functional block diagram of a computer common to each embodiment, respectively. The figure which shows the flow of processing by the computer of FIG. The figure which shows an example of the pulse sequence used for acquiring the data for complex images The figure which shows the flow of the oxygen uptake rate distribution calculation process in 1st embodiment.
- the figure explaining the tissue separation process in 1st embodiment (A)-(c) is a figure which shows the distribution calculated by each process of 1st embodiment, respectively.
- adopted by 2nd embodiment The figure which shows the flow of the oxygen uptake rate distribution calculation process in 3rd embodiment.
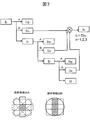
- FIG. 1A to FIG. 1C are external views of an MRI apparatus.
- FIG. 1A shows a horizontal magnetic field type MRI apparatus 100 using a tunnel magnet that generates a static magnetic field with a solenoid coil.
- FIG. 1B shows a hamburger type (open type) vertical magnetic field type MRI apparatus 120 in which magnets are separated into upper and lower sides in order to enhance the feeling of opening.
- FIG. 1C shows an MRI apparatus 130 that uses the same tunnel-type magnet as that in FIG. 1A, shortens the depth of the magnet, and tilts it obliquely to enhance the feeling of opening.
- any of these MRI apparatuses having the appearance can be used.
- various known MRI apparatuses can be used regardless of the form and type of the apparatus.
- the MRI apparatus 100 is representative.
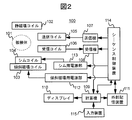
- FIG. 2 is a functional configuration diagram of the MRI apparatus 100 of the present embodiment.
- the MRI apparatus 100 includes a static magnetic field generation apparatus including a static magnetic field coil 102 that generates a static magnetic field in a space where a subject 101 is placed, and a shim coil 104 that adjusts a static magnetic field distribution.
- a transmission high-frequency coil 105 that transmits a high-frequency magnetic field to the measurement region of the subject 101 (hereinafter simply referred to as a transmission coil), and a reception high-frequency coil 106 that receives a nuclear magnetic resonance signal generated from the subject 101 (hereinafter referred to as a transmission coil).
- a gradient magnetic field coil 103 that applies a gradient magnetic field in each of the x direction, the y direction, and the z direction, and a transmitter 107 , A receiver 108, a computer 109, a gradient magnetic field power supply unit 112, a shim power supply unit 113, and a sequence control device 114.
- the elements other than the computer 109 (and the sequence control device 114) are collectively referred to as a measurement unit.
- the static magnetic field generator includes a normal conducting or superconducting static magnetic field coil 102, a static magnetic field generating magnet, and the like, and each MRI shown in FIGS. 1 (a), 1 (b), and 1 (c).
- a normal conducting or superconducting static magnetic field coil 102 a static magnetic field generating magnet, and the like, and each MRI shown in FIGS. 1 (a), 1 (b), and 1 (c).
- various forms are adopted.
- the transmission coil 105 and the transmitter 107 function as a transmission unit, and a high-frequency magnetic field is emitted from the transmission coil by transmitting a high-frequency signal generated by the transmitter 107 to the transmission coil 105.
- the receiving coil 106 and the receiver 18 function as a receiving unit, and the nuclear magnetic resonance signal detected by the receiving coil 106 is sent to the computer 109 through the receiver 108.
- FIG. 2 shows a case where separate transmission coils 105 and reception coils 106 are used, the transmission coil 105 and the reception coil 106 may be configured as a single coil.
- the gradient magnetic field coil 103 and the shim coil 104 are driven by a gradient magnetic field power source 112 and a shim power source 113, respectively.
- the gradient magnetic field coil 103 and the gradient magnetic field power supply unit 112 function as a gradient magnetic field generation unit.
- the sequence controller 114 controls the operations of the gradient magnetic field power supply unit 112 that is a drive power supply for the gradient coil 103, the shim power supply unit 113 that is the drive power supply for the shim coil 104, the transmitter 107, and the receiver 108. Controls the application of a gradient magnetic field, a high-frequency magnetic field, and the reception of a nuclear magnetic resonance signal.
- the control time chart is called a pulse sequence, is preset according to measurement, and is stored in a storage device or the like included in the computer 109 described later.
- a pulse sequence for generating a nuclear magnetic resonance signal including the influence of a predetermined physical property value of a subject is stored.
- the predetermined physical property value is a physical property value reflecting the oxygen amount characteristic of the subject, and is, for example, magnetic susceptibility, R 2 *, or “difference R ′ between R 2 * and R 2 ”.
- R 2 and R 2 * are the reciprocal of the true lateral relaxation time T 2 and the reciprocal of the apparent lateral relaxation time T 2 * , respectively, and can be calculated using a plurality of echo signals having different TEs.
- R 2 * (T 2 * ) is calculated using a gradient echo
- R 2 (T 2 ) is calculated using a spin echo.
- the computer 109 controls the overall operation of the MRI apparatus 100 and performs various arithmetic processes on the received nuclear magnetic resonance signal. In the present embodiment, a complex image, a physical property value distribution, an oxygen uptake rate distribution, and the like of an arbitrary echo time are generated.
- the computer 109 is an information processing apparatus including a CPU, a memory, a storage device, and the like, and a display 110, an external storage device 111, an input device 115, and the like are connected to the computer 109.
- the display 110 is an interface for displaying the results obtained by the arithmetic processing to the operator.
- the input device 115 is an interface for an operator to input conditions, parameters, and the like necessary for measurement and arithmetic processing performed in the present embodiment. For example, the user can input measurement parameters such as the number of echoes to be measured, echo time, and echo interval via the input device 115.
- the external storage device 111 together with the storage device inside the computer 109, holds data used for various types of arithmetic processing executed by the computer 109, data obtained by the arithmetic processing, input conditions, parameters, and the like.
- the computer 109 includes a measurement control unit 310 that measures a nuclear magnetic resonance signal (echo signal) generated from a subject in response to irradiation with a high-frequency magnetic field pulse as a complex signal, and a measurement control unit.
- An image reconstruction unit 320 that reconstructs a complex image having pixel values of complex numbers from complex signals measured by 310, and an oxygen uptake rate distribution calculation that calculates an oxygen uptake rate distribution from the complex image reconstructed by the image reconstruction unit 320.
- Part 330 Details of the oxygen uptake rate distribution calculation unit 330 will be described later.
- the functions of the respective units of the computer 109 described above are realized by the CPU loading and executing a program (software) held by the storage device.
- Various data used for the processing of each function and various data generated during the processing are stored in the storage device or the external storage device 111.
- at least one of the various functions realized by the computer 109 is an information processing apparatus independent of the MRI apparatus 100 and is realized by an information processing apparatus capable of transmitting and receiving data to and from the MRI apparatus 100. It may be.
- all or some of the functions may be realized by hardware such as ASIC (Application Specific Integrated Circuit) or FPGA (Field-programmable gate array).
- FIG. 4 shows the flow of operation.
- the measurement control unit 310 controls the sequence control device 114 in accordance with a predetermined pulse sequence, and measures an echo signal having a predetermined echo time (step S1001).
- the image reconstruction unit 320 reconstructs the complex image I by arranging the obtained echo signal in the k space and performing Fourier transform (step S1002).
- the oxygen uptake rate distribution calculation unit 330 calculates a physical property value distribution reflecting the oxygen uptake rate from the complex image, and performs an oxygen uptake rate distribution calculation process for calculating the oxygen uptake rate distribution from the physical property value distribution (step S1003).
- the physical property value image (also referred to as physical property distribution) is separated into a plurality of tissues (tissue separation process). That is, the complex image that is the basis of the physical property value image is an image that targets a desired subject region, for example, the head (brain), and the physical property value image also represents the physical property value of this region.
- the subject region includes a plurality of different tissues, for example, brain parenchyma and blood vessels in the case of the brain.
- the physical property value image is separated into physical property value images for different tissues using the pixel values.
- the separated physical property value image is a tissue separation image.
- the tissue separation process includes a case where a desired single tissue is separated from other tissues, and a plurality of tissue separation images may not necessarily be obtained. Thereafter, a process of converting the pixel value from the physical property value to the oxygen amount characteristic is performed on one of the tissue separation images (conversion process). As a result, oxygen content characteristics can be obtained for the separated tissue.
- conversion process that is, the value of the oxygen amount characteristic
- the oxygen amount characteristic of the subject region of interest is estimated, and an oxygen amount characteristic distribution is obtained. Correction for improving accuracy, for example, partial volume effect correction is performed as necessary.
- step S1004 the calculated oxygen uptake rate distribution is displayed on the display 110 (step S1004).
- an image calculated in the course of the oxygen uptake rate distribution calculation process is displayed on the display 110 as needed in addition to the oxygen uptake rate distribution calculated in step S1003. May be.
- the oxygen uptake rate distribution calculation unit 330 includes a physical property value distribution calculation unit 331 that calculates a physical property value distribution reflecting the oxygen uptake rate from the complex image I, and the calculated physical property value distribution.
- a tissue separation unit 332 that calculates a tissue separation image separated into at least two types of biological tissues, and an oxygen uptake rate conversion unit 333 that converts any of the tissue separation images into pixel values corresponding to the oxygen uptake rate;
- the tissue separation image includes an oxygen uptake rate distribution estimation unit 334 that estimates an oxygen uptake rate distribution based on a condition that a pixel value of an arbitrary pixel and an average value of surrounding pixels are substantially equal.
- the oxygen uptake rate distribution calculation unit 330 may include a correction unit that corrects the estimated oxygen uptake rate distribution calculated by the oxygen uptake rate distribution estimation unit 334.
- the oxygen uptake rate distribution calculation unit 330 corrects the oxygen uptake rate reduced by the partial volume based on the condition that the average value of the oxygen uptake rate of any vein and the oxygen uptake rate of the entire brain is substantially equal.
- a partial volume effect correction unit 335 for obtaining a final oxygen uptake rate distribution.
- the target site (region) is the brain and the oxygen uptake rate distribution of the brain (substantial) is obtained as the oxygen amount characteristic distribution.
- the configuration of the computer 109 in this embodiment is the same as that shown in FIG. 3, but in this embodiment, the physical property value distribution calculation unit 331 in FIG. 3 is replaced with a magnetic susceptibility distribution calculation unit.
- a magnetic susceptibility distribution is calculated as a physical property value, and an oxygen uptake rate distribution is calculated from the magnetic susceptibility distribution.
- tissue separation process veins are separated into other tissues and the vein distribution is calculated.
- the measurement control unit 310 operates the sequence control device 114 in accordance with a pulse sequence set based on a parameter input by the user via the input device 115, and a nuclear magnetic resonance signal (echo) of a predetermined echo time (TE). Signal).
- the sequence control device 114 performs measurement by controlling the measurement unit in accordance with an instruction from the measurement control unit 310. In this embodiment, an echo signal having an arbitrary echo time is obtained.
- a pulse sequence used for measurement by the measurement control unit 310 will be described.
- a GrE (Gradient Echo) pulse sequence is used.
- the image obtained by this GrE-based pulse sequence reflects the oxygen uptake rate of the living tissue sensitively.
- FIG. 5 shows an RSSG (RF-soiled-Steady-state Acquisition with Ground Gradient-Echo) -Multicho sequence 550 as an example of a GrE pulse sequence.
- RF, Gs, Gp, and Gr represent a high-frequency magnetic field, a slice gradient magnetic field, a phase encoding gradient magnetic field, and a readout gradient magnetic field, respectively.
- the slice gradient magnetic field pulse 501 is applied and a high frequency magnetic field (RF) pulse 502 is irradiated to excite magnetization of a predetermined slice in the subject 101.
- RF magnetic field
- a slice encode gradient magnetic field pulse 503 and a phase encode gradient magnetic field pulse 504 for adding position information in the slice direction and the phase encode direction to the magnetization phase are applied.
- readout gradient magnetic field pulse 505 After applying a readout gradient magnetic field pulse 505 for dephasing that disperses the phase of nuclear magnetization in the pixel, readout gradient magnetic field pulses 506, 507, 508, and 509 for adding position information in the readout direction are applied. While measuring nuclear magnetic resonance signals (echo) 510, 511, 512 and 513, respectively. Finally, a re-phase slice encode gradient magnetic field pulse 514 and a phase encode gradient magnetic field pulse 515 for converging the phase of the nuclear magnetization dephased by the slice encode gradient magnetic field pulse 503 and the phase encode gradient magnetic field pulse 504 are applied.
- the measurement control unit 310 performs the above procedure on the intensity of the slice encode gradient magnetic field pulses 503 and 514 (slice encode number ks) and the phase encode gradient magnetic field pulses 504 and 515 (phase encode number kp) and the phase of the RF pulse 502. Is repeatedly executed at a repetition time TR, and an echo necessary for obtaining one image is measured for each echo time. At this time, in order to eliminate the influence of the transverse magnetization remaining after the previous excitation, the phase of the RF pulse 502 is increased by a predetermined amount, for example, 117 degrees. In FIG. 5, the numbers below the hyphen indicate the number of repetitions.
- a Flow Compensation gradient magnetic field pulse that compensates for the influence of a flow such as a blood flow may be applied to each axis.
- Each measured echo is arranged in a three-dimensional k space (memory space) with kr, kp, and ks as coordinate axes. At this time, one echo occupies one line parallel to the kr axis in the k space.
- the absolute value image obtained by the RSSG sequence 550 is a T1 (longitudinal relaxation time) weighted image when the TE is short, and a T2 * weighted image reflecting the phase dispersion in the pixel when the TE is long.
- the RSSG sequence 550 illustrated in FIG. 5 is one of Cartesian imaging that acquires data parallel to the coordinate axis of the k space.
- the k space data acquisition method is arbitrary, for example, a rotational shape in the k space.
- non-Cartesian imaging such as a radial scan for acquiring data may be used.
- an image is obtained for each echo of the multi-echoes 510 to 513 having different TEs, but an echo planer type k-space scanning method (multi-echo echo planar imaging method) that gives different encoding to each echo may be used.
- one complex image may be measured using a sequence for measuring one TE echo.
- the image reconstruction unit 320 calculates a complex image I by performing Fourier transform on the echo signal of the echo time TE arranged in the k-space in step S1001.
- the oxygen uptake rate distribution calculation unit 330 calculates the oxygen uptake rate distribution from the complex image I reconstructed by the image reconstruction unit 320.
- the oxygen uptake rate distribution is an image of the amount of oxygen consumed by the living tissue.
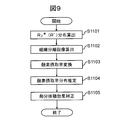
- the physical property value distribution calculation unit 331 first calculates a magnetic susceptibility distribution from the complex image I (S1101).
- the tissue separation unit 332 separates the calculated magnetic susceptibility distribution for at least two types of biological tissues, and calculates a tissue separation image (magnetic susceptibility distribution for each tissue) (S1102).
- the oxygen uptake rate conversion unit 333 converts the pixel value (susceptibility) of any of the tissue separation images into a pixel value corresponding to the oxygen uptake rate (S1103).
- the oxygen uptake rate distribution of the entire target region is estimated based on the condition that the pixel value of an arbitrary pixel and the average value of surrounding pixels are substantially equal (S1104). Correction is performed to increase the accuracy of the estimated oxygen uptake rate distribution as necessary, and a final oxygen uptake rate distribution is obtained (S1105). For example, partial volume effect correction processing is performed. This correction is a process for correcting an error based on the difference between the size of the pixel of the image to be processed and the size of the tissue that contributes to the magnetic susceptibility for each pixel used for estimating the oxygen uptake rate. The oxygen uptake rate decreased by the partial volume is corrected based on the condition that the oxygen uptake rate of an arbitrary vein and the average value of the oxygen uptake rate of the entire brain are substantially equal to the uptake rate distribution.
- the magnetic susceptibility distribution calculator 331 calculates the magnetic susceptibility distribution from the measured phase information (phase image) of the complex image I using the QSM method.
- a method for calculating the magnetic susceptibility distribution using the QSM method is known, and an outline thereof will be described here.
- a local magnetic field change caused by a magnetic susceptibility difference between living tissues is calculated from a phase image captured by the Gradient Echo (GrE) method.
- GrE Gradient Echo
- ⁇ (r) a relative magnetic field change (magnetic field distribution) caused by a magnetic susceptibility difference between tissues
- equation (1) ⁇ (r) represents a phase image
- ⁇ represents a nuclear nuclear magnetic rotation ratio
- B 0 represents a static magnetic field strength
- TE represents an echo time.
- the magnetic field distribution ⁇ (r) is expressed by the following formula (2) using the in-vivo magnetic susceptibility distribution ⁇ (r) from the Maxwell equation regarding the static magnetic field.
- ⁇ represents an angle formed by the vector (r′ ⁇ r) and the static magnetic field direction
- d (r) represents a point dipole magnetic field.
- the magnetic field distribution ⁇ (r) is represented by a convolution integral of the magnetic susceptibility distribution ⁇ (r) and the point dipole magnetic field d (r). Therefore, the formula (2) is converted into the following formula (3) by performing Fourier transform on both sides of the formula (2).
- k (k x , k y , k z ) is a position vector in k space
- ⁇ (k) X (k)
- D (k) are magnetic field distributions ⁇ (r)
- the Fourier component X (k) of the magnetic susceptibility distribution can be calculated by dividing the Fourier component ⁇ (k) of the magnetic field distribution by the Fourier component D (k) of the point dipole magnetic field.
- X (k) cannot be directly calculated.
- the QSM method for estimating the magnetic susceptibility distribution from the magnetic field distribution due to the presence of the magic angle has been reduced to an ill-conditioned inverse problem, and several solutions have been proposed.
- a smoothing process is repeatedly performed on the magnetic susceptibility distribution calculated from the magnetic field distribution under a constraint condition based on the relational expression between the magnetic field and the magnetic susceptibility (Japanese Patent Application by the present inventors).
- the magnetic susceptibility distribution calculated by the TKD (Truncated-based K-space Division) method which calculates the magnetic susceptibility distribution by calculating the magnetic field distribution and the point dipole magnetic field in k space, and the TKD method.
- the magnetic susceptibility distribution calculation unit 331 of this embodiment calculates a quantitative magnetic susceptibility (QSM) distribution using these methods.
- the quantitative magnetic susceptibility distribution may be calculated using any method.
- tissue separation image calculation S1102
- the tissue separation unit 332 calculates a tissue separation image separated into at least two types of biological tissues from the calculated magnetic susceptibility distribution.
- the vein portion is extracted from the magnetic susceptibility distribution calculated by the physical property value distribution calculation unit 331, and the susceptibility distribution of the vein and the susceptibility distribution of other tissues are calculated.
- the morphological filter bank is a processing based on a morphological operation for extracting features from a given image by using an opening process or a top hat transform (for details, see IEICE Technical Report MI 2010-101 (2011-1)). The process is repeated by changing the size of the structural element used for the calculation. That is, as shown in FIG.
- the granular component is first separated from the calculated magnetic susceptibility distribution by top-hat transform using multiple linear structural elements in which the angles of the linear structural elements are three-dimensionally changed, and spherical structural elements are obtained.
- the venous component is separated by top-hat conversion by.
- the original image I 0 is separated into a granular component image I 1P , a blood vessel component image I 1v , and a smoothed image I 1 .
- the top-hat transform is performed again on the separated smoothed image I 1 using a plurality of structural elements whose sizes are increased, and is separated into a granular component image I 2P , a blood vessel component image I 2v , and a smoothed image I 2 .
- FIG. 7 illustrates the case where the number of repetitions is 3, the number of repetitions is arbitrary.
- the venous component is separated, so that the iron protein (ferritin) deposited tissues such as the pneumosphere, the red nucleus, and the substantia nigra which have a high magnetic susceptibility in the magnetic susceptibility distribution are removed.
- the susceptibility distribution of the vein can be calculated.
- the separation process is not limited to this method.
- a small region composed of a plurality of pixels is set in the magnetic susceptibility distribution (image), and the average value and standard deviation of the magnetic susceptibility in this small region are calculated, and the pixel value exceeding the range of average value + N ⁇ standard deviation is obtained.
- You may extract as a vein (N is arbitrary real numbers).
- filters such as a differential filter may be combined. Also, using the absolute value of the image acquired in step S1002 in FIG.
- a vein tissue may be separated to create a mask with the vein region set to 1 and the rest set to 0, and this mask may be applied to the magnetic susceptibility distribution.
- a method using the susceptibility distribution is preferable.
- the oxygen uptake rate conversion unit 333 converts any of the tissue separation images separated into at least two living tissues into an oxygen uptake rate.
- the susceptibility distribution of the vein is converted into an oxygen uptake rate. It is known that the magnetic susceptibility of a vein is proportional to the concentration of deoxyhemoglobin, that is, the oxygen uptake rate.
- oxygen uptake rate can be calculated using equation 4 (Jan Sedlacik other, "Validation of Quantitative Estimation of Tissue oxygen Extraction Fraction and Deoxygenated Blood Volume Fraction in Phantom and in Vivo Experiments by using MRI", Magnetic Resonance in Medicine, 2010, 63, pp. 910-921, see formula 6).
- the hematocrit value is said to be about 0.42 for normal men and 0.38 for normal women.
- magnetic susceptibility difference between the arteriovenous per unit hematocrit Derutakai do is known to be 0.18 ppm (CGS unit system). Therefore, if the magnetic susceptibility difference ⁇ v between the vein and the living tissue can be calculated, it can be converted into vein OEF.
- a value obtained for the subject from a blood test performed separately from the MRI test may be substituted.
- the oxygen uptake rate distribution estimation unit 334 is based on the constraint condition (first condition) that the pixel value of an arbitrary pixel and the average value of surrounding pixels are substantially equal in the vein susceptibility distribution converted into the oxygen uptake rate.
- first condition the constraint condition
- M is a mask (binary mask) in which the target area is 1 and the other areas (for example, areas such as the brain surface) are 0, and r is the radius of the local area that can be estimated to satisfy the first condition. If the spherical kernel of r is ⁇ and the delta function is ⁇ , it can be assumed that the oxygen uptake rate OEF t of the biological tissue (target region) does not change significantly within the radius r.
- the relational expression holds.
- the binary mask M can be created in advance from an absolute value image, and may be the same as the mask used for calculating the magnetic susceptibility distribution or may have a smaller range.
- Equation (5) can be rewritten as Equation (6) using the Fourier transform operator F and the inverse Fourier transform operator F ⁇ 1 .
- a constraint condition (second condition) that the local average value of the oxygen uptake rate OEF v of the vein and the local average value of the oxygen uptake rate OEF t of the living tissue are equal is added, and the formula (6) An oxygen uptake rate OEF t that satisfies the above is calculated. That is, “OEF t ” that minimizes the expression (7) is obtained.
- the first term represents the first condition and the second term represents the second condition.
- ⁇ represents a regularization parameter and is a parameter that controls the degree of influence of the constraint condition.
- the value of ⁇ is typically in the range of 0.1 to 10.0.
- the oxygen uptake rate OEF t of the living tissue is estimated by the minimization process shown in Expression (7), but the present invention is not limited to this method.
- the local average value and the oxygen uptake rate OEF v vein may be used smoothing processing by a Gaussian filter of oxygen uptake rate OEF v vein.
- the partial volume effect correction unit 335 performs partial volume effect correction on the oxygen uptake rate OEF t of the living tissue calculated in S1104.
- the vein oxygen uptake rate OEF v used to calculate the oxygen uptake rate OEF t of the living tissue in S1103 is a small value due to the partial volume effect due to other living tissues included in the pixel for veins smaller than the pixel size. (Partial volume effect). Therefore, it is necessary to correct the decrease in the oxygen uptake rate due to the partial volume effect. For this reason, the partial volume effect correction unit 335 first corrects the oxygen intake rate reduced by the partial volume effect based on the condition that the average value of the oxygen intake rate of any vein and the oxygen intake rate of the entire brain is equal. Correction coefficient (partial volume effect correction coefficient) is calculated.
- the arbitrary vein is preferably a vein that can be regarded as representing the oxygen uptake rate of the entire brain, and is a thick vein such as a sinus.
- the oxygen uptake rate OEF SSS of an arbitrary vein is selected, for example, by selecting one or a plurality of pixels corresponding to an arbitrary vein from an image (magnetic susceptibility distribution image) separated as a vein in the tissue separation process, and the conversion process S1103 Later oxygen uptake rates can be used.
- the partial volume effect correction unit 335 corrects the oxygen uptake rate of each pixel according to the equation (9) using the partial volume effect correction coefficient PVC that satisfies the equation (8). Thereby, the final oxygen uptake rate distribution OEF (i) corrected can be calculated.
- the above-described processes S1101 to S1105 complete the oxygen uptake rate distribution calculation process S1003 in FIG.
- the flow shown in FIG. 6 is an example, and part of the processing is omitted or the order is changed.
- the partial volume effect correction of FIG. 6 may be omitted, or the partial volume effect correction may be performed after calculating the tissue separation image or after converting the oxygen uptake rate.
- smoothing processing using a filter or the like may be performed as appropriate.
- FIG. 8 shows an example of an image obtained at each stage of the above processing S1101 to S1105.
- 8A and 8B are diagrams showing a brain oxygen uptake rate distribution calculated using the QSM method.
- FIG. 8A shows the magnetic susceptibility distribution calculated by the physical property value distribution calculation unit 331, and
- FIG. 8B shows the tissue.
- the vein susceptibility distribution calculated by the separation unit 332 and FIG. 8C are the finally calculated oxygen uptake rate distributions.
- the oxygen uptake rate distribution and the magnetic susceptibility distribution calculated by the oxygen uptake rate distribution calculation unit 330 can be displayed on the display 110 (FIG. 1). Alternatively, it may be stored as image data in the external storage device 111 and displayed on a desired display device.
- the display form is not particularly limited.
- the oxygen uptake rate distribution can be displayed as a contour line or a color map as shown in FIG.
- the oxygen uptake rate distribution in the brain including the brain parenchyma can be calculated by a simple process without applying a load such as caffeine administration, and the diagnostic accuracy Can be improved.
- a tissue separation image is created by separating a tissue, for example, a vein, using a magnetic susceptibility distribution that is linearly related to the oxygen uptake rate and capable of calculating the magnetic susceptibility with high accuracy. Since the rate is estimated, the oxygen uptake rate distribution can be calculated with high accuracy.
- the magnetic susceptibility distribution is used as a physical property value that reflects the oxygen uptake rate, but in this embodiment, in this embodiment, the apparent lateral relaxation as the physical property value distribution that reflects the oxygen uptake rate. Calculate the velocity (R 2 * ) distribution.
- the configurations of the computer 109 and the oxygen uptake rate calculation unit 330 are the same as those in the first embodiment, but the measurement control unit 310 measures echoes of two or more echo times, Control to acquire a plurality of different complex images. Further, processing contents of the physical property value distribution calculating unit 331 and the oxygen uptake rate converting unit 332 are different. Specifically, the physical property value distribution calculation unit 331 calculates an R 2 * distribution from complex images of a plurality of echo times, and the oxygen uptake rate conversion unit 332 calculates each pixel value of the R 2 * distribution as an oxygen uptake. Convert to rate. In the present embodiment, the property value distribution calculation unit 331 in FIG. 3 is read as an R 2 * distribution calculation unit.
- the measurement control unit 310 controls the measurement unit based on a GrE pulse sequence as shown in FIG. 5 and measures a plurality of echoes having different echo times (TE).
- FIG. 5 shows a multi-echo sequence for measuring a plurality of echoes having different TEs after one excitation, but imaging using a sequence for measuring one echo may be executed a plurality of times while changing the TE.
- the image reconstruction unit 320 reconstructs a complex image for each different TE from each echo.
- R 2 * distribution calculating unit 331 the echo time complex image I measured in (TE) (TE), to calculate the R 2 * distribution.
- TE complex image I
- the complex image I is an image including intensity information and phase information.
- an image having intensity information absolute value image
- R 2 * the signal intensity I (TE) at the echo time TE is expressed by Expression (10).
- the proton density distribution M 0 and the apparent lateral relaxation rate distribution R 2 * are obtained by performing the least square fitting of the pixel values of the pixels of the plurality of images having different TEs measured by the GrE method to the signal model of Expression (10). Each can be calculated. Since there are two unknowns in equation (10), the number of images with different TEs may be two or more, but the accuracy of fitting can be increased by increasing the number of images (number of echoes).
- the tissue separation unit 332 calculates a tissue separation image separated into at least two types of biological tissues from the calculated R 2 * distribution. Here extracts the vein from R 2 * distribution, separating and R 2 * Distribution of intravenously, R 2 * distribution otherwise.
- the method for extracting the R 2 * distribution of veins is the same as in the first embodiment. For example, a process using a morphological filter bank (FIG. 7) or a process for discriminating veins from local average values and standard deviations is adopted. can do.
- the oxygen uptake rate conversion unit 333 converts each pixel value (R 2 * value) of the vein R 2 * distribution separated in S1102 into an oxygen uptake rate.
- the R 2 * value of the vein is known to be proportional to the concentration of deoxyhemoglobin, that is, the rate of oxygen uptake (Xiang He et al. , Magnetic Resonance in Medicine, 2007, Vol. 57, pages 115-126).
- the oxygen uptake rate OEF is represented by Formula (11).
- ⁇ represents the nuclear magnetic rotation ratio
- B 0 represents the magnetic field strength.
- ⁇ represents the nuclear magnetic rotation ratio
- B 0 represents the magnetic field strength.
- R 2 is negligibly small compared to the R 2 * value.
- the approximate expression (12) is substituted for the expression (11), and the oxygen uptake rate OEF is calculated from the R 2 * value of the vein. Convert.
- the processing after the oxygen uptake rate conversion that is, the oxygen uptake rate distribution estimation (S1104) and the partial volume effect correction (S1105) are performed in the same manner as in the first embodiment.
- the transverse relaxation rate R 2 * from the brain parenchyma oxygen uptake rate of the apparent can be calculated. Also in this case, the oxygen uptake rate distribution as shown in FIG. 8C can be obtained, and can be appropriately displayed on the display 110 in any display form.
- the oxygen uptake rate is calculated by separating the tissue that can calculate the oxygen uptake rate with high accuracy, and thus the oxygen uptake rate distribution is obtained noninvasively and with high accuracy. be able to. Further, according to the present embodiment, by using the apparent transverse relaxation rate R 2 * as the characteristic value, it is possible to obtain information on a micro structure rather than the magnetic susceptibility distribution, and it is possible to improve the accuracy of tissue separation. As a result, the accuracy of oxygen uptake rate distribution calculation can be improved.
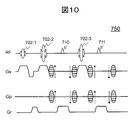
- the measurement control unit 310 acquires a plurality of spin echo (SE) images having different TEs using a pulse sequence for which R 2 is obtained in addition to the pulse sequence of FIG. Get the distribution.
- SE spin echo
- a Multi-echo SE sequence 750 to which inversion pulses 702-2 and 702-3 are added can be used. Although a detailed description of this sequence is omitted, in this sequence, a plurality of echoes 710 and 711 having different TEs are obtained as in the GrE sequence of FIG. These echoes are spin echoes that do not include the influence of static magnetic field inhomogeneity, and the sequence shown in FIG. 10 is repeated with different encoding amounts in the slice direction and the phase encoding direction, thereby generating a plurality of SE image data (k Spatial data) is obtained. The image reconstruction unit 320 reconstructs these image data and obtains a plurality of SE images having different TEs.
- the oxygen uptake rate calculation unit 330 calculates R 2 (physical property value distribution calculation) from a plurality of SE images using a signal attenuation equation similar to Equation (10), and calculates R 2 * and SE calculated from the GrE image. with R 2 calculated from the image can be calculated oxygen uptake rate OEF by equation (11) (oxygen uptake rate conversion). According to this modification, the time of the measurement step (FIG. 3: S1001) becomes long, but more accurate OEF can be calculated. Note that R 2 * and R 2 may be calculated using other pulse sequences, respectively.
- R 2 * is calculated from a plurality of images measured by changing the TE of the 2D GrE-EPI sequence a plurality of times
- R 2 is calculated from a plurality of images measured by changing the TE of the 2D SE-EPI sequence a plurality of times. May be.
- the physical property value distribution calculation unit 331 calculates the apparent lateral relaxation rate R 2 * as a characteristic reflecting the oxygen uptake rate.
- the transverse relaxation rate R 2 * apparent R 2 * and other tissues of the brain parenchyma R 2 * To separate.
- FIG. 11 shows a processing flow of the present embodiment.
- steps having the same contents as those in FIG. 9 are denoted by the same reference numerals, and detailed description thereof is omitted.
- the physical property value calculation unit (R 2 * distribution calculation unit) 331 uses the intensity information of a plurality of images having different TEs to calculate each pixel.
- the apparent lateral relaxation rate R 2 * is calculated to obtain an R 2 * distribution.
- R ′ R 2 * distribution
- the R 2 * distribution and the R ′ distribution will be representatively described as being obtained as the R 2 * distribution.
- Tissue separation image calculation S1102
- Tissue separating unit 332 extracts a vein from R 2 * distribution, to calculate the R 2 * distribution veins.
- the method for extracting the R 2 * distribution of the vein is the same as in the first embodiment. For example, a method of extracting a linear structure using a morphological filter bank for the R 2 * distribution or an absolute value image is used. Use techniques. Then, the difference between the original R 2 * Distribution and veins of R 2 * distribution, calculates R 2 * distribution in the brain parenchyma (called difference R 2 * distribution).
- This process may be performed only on a subject suspected of having ferritin deposition, or may be omitted.
- tissue separation image calculation S1102 when extracting the R 2 * distribution of the vein, as in the first embodiment, granularity is obtained by top-hat conversion using multiple linear structural elements in which the angles of the linear structural elements are three-dimensionally changed.
- the ferritin deposited tissue can be removed by subtracting the R 2 * distribution of the granular component from the original R 2 * distribution. .
- Subsequent oxygen uptake rate conversion (S1103), oxygen uptake rate distribution estimation (S1104), and partial volume effect correction (S1105) are performed in the same manner as in the second embodiment.
- the R 2 * distribution of the brain parenchyma for which the oxygen uptake rate is to be obtained is tissue-separated, and the oxygen uptake rate is calculated from the tissue separation image. Well, you can find the oxygen uptake rate.
- a binary mask is created in which R 2 * of ferritin deposited tissue is zero and the others are one.
- the oxygen uptake rate conversion is performed only for a region that is not masked (a region where the mask value is 1). Only in this unmasked region, the oxygen uptake rate distribution estimation (S1104) using the tissue separation image (oxygen uptake rate image) after the oxygen uptake rate conversion, and the partial volume effect correction may be performed. It is the same as the form.
- the embodiment of the function of the computer 109 of the MRI apparatus has been mainly described.
- the function of the computer 109 can capture image data acquired by the MRI apparatus via a wireless, wired, or portable medium.
- Any image processing apparatus that can be used can be realized by an image processing apparatus independent of the MRI apparatus, and such an image processing apparatus is also included in the present invention.
- SYMBOLS 100 MRI apparatus, 101: Subject, 102: Static magnetic field coil, 103: Gradient magnetic field coil, 104: Shim coil, 105: Transmission coil, 106: Reception coil, 107: Transmitter, 108: Receiver, 109: Calculator, 110: Display, 111: External storage device, 112: Power supply unit for gradient magnetic field, 113: Power supply unit for shim, 114: Sequence control device, 115: Input device, 120: MRI device, 130: MRI device, 310: Measurement control , 320: Image reconstruction unit, 330: Oxygen uptake rate distribution calculation unit, 331: Physical property value distribution calculation unit (magnetic susceptibility distribution calculation unit, R 2 * distribution calculation unit), 332: Tissue separation unit, 333: Oxygen uptake Rate conversion unit, 334: Oxygen uptake rate distribution estimation unit, 335: Partial volume effect correction unit
Abstract
MRIを用いて酸素摂取率分布を算出するにあたり、被験者に対してカフェイン投与などの負荷を与えず簡易な処理で脳実質を含む脳内の酸素摂取率分布を算出する技術を提供する。このため本発明のMRI装置は、核磁気共鳴信号の複素画像を計測し、計測した複素画像から、酸素摂取率を反映した物性値画像を算出する物性値分布を算出する。そして、算出した物性値分布を少なくとも2種類以上の組織毎の物性値分布(組織分離画像)に分離する。組織分離画像のいずれかを酸素摂取率に換算したのち、任意の画素の画素値とその周囲の画素の平均値が略等しいという条件に基づいて酸素摂取率分布を推定する。
Description
本発明は、磁気共鳴イメージング(MRI:Magnetic Resonance Imaging)技術に関する。特に、取得した画像を用いて生体内の酸素量特性を算出する画像処理技術に関する。
磁気共鳴イメージング装置は、静磁場内に置かれた水素原子核(プロトン)が特定の周波数の高周波磁場に共鳴する核磁気共鳴現象を利用した非侵襲な医用画像診断装置である。核磁気共鳴信号はプロトン密度や緩和時間など様々な物性値によって変化するため,病変の形態や物質的な評価のみならず,生体組織の代謝や血液灌流を評価できる可能性がある。現在はこれを脳虚血疾患や腫瘍の評価に応用することにより,治療効果や予後を予測することが試みられている。
脳虚血疾患および腫瘍の病態診断や重症度診断には,脳酸素摂取率(OEF:Oxygen Extraction Fraction)や腫瘍内の酸素飽和度 (StO2:Tissue Oxygen Saturation) などの酸素イメージングによる組織内の酸素代謝を評価することが臨床上重要である。現在の臨床における酸素代謝の評価は,15O標識ガスや18F標識 fluoromisonidazole (FMISO) 薬剤を用いたPositron Emission Tomography(PET)検査が至適基準となっている。しかしながら,PET検査は検査時間が長く放射線被曝があるという点が問題となっている。これに対し,MRI検査は撮像時間が短く放射線被曝がないため,患者の負担を軽減できるという特長がある。
MRIを用いて酸素摂取率を算出する方法はいくつか提案されている。その一つの方法として、速度選択プリパルスシーケンスとスピンエコーシーケンスを用いて、生体組織の毛細血管内の血液信号を複数のTEで計測する。計測した複数のTEの信号強度から血液信号のT2値を信号フィッティングにより算出する。そして、別途取得した血液の酸素飽和度と血液信号のT2値との関係を用いて、生体組織の酸素摂取率を算出する(例えば、特許文献1を参照)。
別の方法として、生体内の磁化率の変化から酸素摂取率を算出する方法がある。その中でも、酸素摂取率を反映した磁化率変化を捉える方法として、定量的磁化率マッピング (QSM:Quantitative Susceptibility Mapping) 法を用いた方法がある。QSMは,MR画像の位相分布から組織間の磁化率差によって生じる局所的な磁場変化を算出し、磁場と磁化率の関係式に基づいて磁化率分布を推定する手法である。
動脈血内のオキシヘモグロビンは、生体組織内で酸素が消費されると静脈血内でデオキシヘモグロビンに変化する。静脈血内のデオキシヘモグロビンの濃度に対して、静脈血の磁化率は線形に変化することが知られている。したがって、QSM法は、デオキシヘモグロビンの磁化率の変化から、生体組織内の酸素摂取率を算出できる。
QSMを用いて酸素摂取率を算出する方法には、例えば、QSM法で算出した磁化率分布の静脈のみに注目し、その磁化率から静脈内の酸素飽和度を算出する方法がある(例えば、非特許文献1参照)。また、被験者にカフェインを投与し、その前後でASL(Arterial Spin Labeling)法とQSM法を用いて脳血流量(CBF)と磁化率分布をそれぞれ算出する。そして、CBFとOEFの積であらわされる酸素代謝率(CMRO2)がカフェイン投与前後で変化しないという条件の下でカフェイン投与前後のOEFを算出する方法がある(例えば、非特許文献2参照)。
Audrey P. Fan他、 "Quantitative Oxygenation Venography from MRI Phase"、 Magnetic Resonance in Medicine、2014年、72巻、149-159頁
Jingwei Zhang他、 " Quantitative Mapping of Cerebral Metabolic Rate of Oxygen (CMRO2) Using Quantitative Susceptibility Mapping (QSM)"、 Magnetic Resonance in Medicine、2015年、74巻、945-952頁
特許文献1の方法は、生体組織の毛細血管における血液信号のT2値を算出するため、脳実質内の酸素摂取率を算出できるという利点がある。しかしながら、血液のT2値は、ヘマトクリット値などの血液の組成に対して非線形に変化するため、血液のT2値から酸素摂取率を算出することは困難であるという課題がある。
非特許文献1の方法は、QSM法を用いて静脈の磁化率から酸素摂取率を算出するため、精度が高いという利点がある。しかしながら、静脈血の酸素摂取率のみを算出するため、脳実質内の酸素摂取率を算出することができないという課題がある。
非特許文献2の方法は、QSM法を用いて脳実質内の酸素摂取率を算出できるという利点があるものの、被験者にカフェインを投与するという負荷を与えなければいけないという課題がある。また、カフェイン投与前後でCMRO2が変化する疾患では算出する酸素摂取率の精度が低下するという課題がある。
本発明は、上記事情に鑑みて成されたもので、MRIで得た画像を用いて酸素摂取率(OEF)を算出するにあたり、カフェイン投与などの負荷を与えず簡易な処理で脳実質を含む脳内のOEFを算出する技術を提供することを目的とする。
本発明は、核磁気共鳴信号から生成した複素画像から、酸素摂取率等の酸素量特性を反映した物性値を画素値とする物性値画像を算出する。そして、算出した物性値画像を少なくとも2種類以上の組織に分離し、組織分離画像のいずれかを酸素量特性に換算したのち、任意の画素の画素値とその周囲の画素の平均値が略等しいという条件に基づいて、目的とする領域についての酸素量特性分布を推定する。
すなわち本発明のMRI装置は、静磁場内に配置された被検体に高周波磁場パルスを送信する送信部、前記被検体が発生する核磁気共鳴信号を受信する受信部、及び、静磁場に傾斜磁場を与える傾斜磁場発生部を有する計測部と、予め設定した撮像シーケンスに従い、前記計測部の動作を制御する計測制御部と、前記受信した核磁気共鳴信号に演算を施す計算機と、を備え、前記計算機は、少なくとも1つのエコー時間で取得した核磁気共鳴信号からの複素画像を生成する画像再構成部と、酸素量特性を反映した物性値を画素値とする物性値画像を算出する物性値分布算出部と、対象領域の物性値画像を少なくとも2種類以上の組織に分離し、複数の組織分離画像を生成する組織分離部と、前記複数の組織分離画像のいずれかについて、各画素の前記物性値を酸素量特性に変換する酸素量特性変換部と、画素値を酸素量特性に変換した後の組織分離画像において、任意の画素の画素値とその周囲の画素の平均値が略等しいという条件に基づいて前記対象領域の酸素量特性分布を推定する酸素量特性分布推定部と、を有する。
酸素量特性は、酸素摂取率、酸素飽和度のいずれかを含む。
酸素量特性は、酸素摂取率、酸素飽和度のいずれかを含む。
MRIを用いて酸素量特性を算出するにあたり、被験者に対してカフェイン投与などの負荷を与えず簡易な処理で脳実質を含む脳内の酸素量特性分布を算出でき、診断精度が向上する。
まず、本発明が適用されるMRI装置の実施形態について説明する。
[MRI装置の外観]
図1(a)~図1(c)は、MRI装置の外観図である。図1(a)は、ソレノイドコイルで静磁場を生成するトンネル型磁石を用いた水平磁場方式のMRI装置100である。図1(b)は、開放感を高めるために磁石を上下に分離したハンバーガー型(オープン型)の垂直磁場方式のMRI装置120である。また、図1(c)は、図1(a)と同じトンネル型磁石を用い、磁石の奥行を短くし、かつ、斜めに傾けることによって、開放感を高めたMRI装置130である。
図1(a)~図1(c)は、MRI装置の外観図である。図1(a)は、ソレノイドコイルで静磁場を生成するトンネル型磁石を用いた水平磁場方式のMRI装置100である。図1(b)は、開放感を高めるために磁石を上下に分離したハンバーガー型(オープン型)の垂直磁場方式のMRI装置120である。また、図1(c)は、図1(a)と同じトンネル型磁石を用い、磁石の奥行を短くし、かつ、斜めに傾けることによって、開放感を高めたMRI装置130である。
本実施形態では、これらの外観を有するMRI装置のいずれを用いることもできる。但し、これらは一例であり、本実施形態のMRI装置はこれらの形態に限定されるものではない。本実施形態では、装置の形態やタイプを問わず、公知の各種のMRI装置を用いることができる。以下、特に区別する必要がない場合は、MRI装置100で代表する。
[MRI装置の構成]
図2は、本実施形態のMRI装置100の機能構成図である。本図に示すように、本実施形態のMRI装置100は、被検体101が置かれる空間に静磁場を生成する静磁場コイル102を備えた静磁場発生装置と、静磁場分布を調整するシムコイル104と、被検体101の計測領域に対し高周波磁場を送信する送信用高周波コイル105(以下、単に送信コイルという)と、被検体101から生じる核磁気共鳴信号を受信する受信用高周波コイル106(以下、単に受信コイルという)と、被検体101から生じる核磁気共鳴信号に位置情報を付加するために、x方向、y方向、z方向それぞれに傾斜磁場を印加する傾斜磁場コイル103と、送信機107と、受信機108と、計算機109と、傾斜磁場用電源部112と、シム用電源部113と、シーケンス制御装置114と、を備える。これら要素のうち、計算機109(及びシーケンス制御装置114)を除く要素を総括して計測部ともいう。
図2は、本実施形態のMRI装置100の機能構成図である。本図に示すように、本実施形態のMRI装置100は、被検体101が置かれる空間に静磁場を生成する静磁場コイル102を備えた静磁場発生装置と、静磁場分布を調整するシムコイル104と、被検体101の計測領域に対し高周波磁場を送信する送信用高周波コイル105(以下、単に送信コイルという)と、被検体101から生じる核磁気共鳴信号を受信する受信用高周波コイル106(以下、単に受信コイルという)と、被検体101から生じる核磁気共鳴信号に位置情報を付加するために、x方向、y方向、z方向それぞれに傾斜磁場を印加する傾斜磁場コイル103と、送信機107と、受信機108と、計算機109と、傾斜磁場用電源部112と、シム用電源部113と、シーケンス制御装置114と、を備える。これら要素のうち、計算機109(及びシーケンス制御装置114)を除く要素を総括して計測部ともいう。
静磁場発生装置は、常電導式或いは超電導式の静磁場コイル102、静磁場生成磁石などで構成され、図1(a)、図1(b)、図1(c)にそれぞれ示した各MRI装置100、120、130の構造に応じて、種々の形態のものが採用される。
送信コイル105と送信機107は送信部として機能し、送信機107が生成する高周波信号を送信コイル105に送信することにより送信コイルから高周波磁場が照射される。受信コイル106と受信機18は受信部として機能し、受信コイル106が検出した核磁気共鳴信号は受信機108を通して計算機109に送られる。なお、図2では、送信コイル105と受信コイル106とに別個のものを用いる場合を示しているが、送信コイル105と受信コイル106との機能を兼用する1つのコイルで構成してもよい。
傾斜磁場コイル103及びシムコイル104は、それぞれ傾斜磁場用電源部112及びシム用電源部113により駆動される。傾斜磁場コイル103と傾斜磁場用電源部112は傾斜磁場発生部として機能する。
シーケンス制御装置114は、傾斜磁場コイル103の駆動用電源である傾斜磁場用電源部112、シムコイル104の駆動用電源であるシム用電源部113、送信機107及び受信機108の動作を制御し、傾斜磁場、高周波磁場の印加および核磁気共鳴信号の受信のタイミングを制御する。制御のタイムチャートはパルスシーケンスと呼ばれ、計測に応じて予め設定され、後述する計算機109が備える記憶装置等に格納される。
本実施形態のMRI装置では、被検体の所定の物性値の影響を含む核磁気共鳴信号を発生させるパルスシーケンスが格納されている。所定の物性値は、被検体の酸素量特性を反映した物性値であり、例えば、磁化率やR2
*或いは「R2
*とR2との差R’」などである。R2及びR2
*は、それぞれ、真の横緩和時間T2の逆数、みかけの横緩和時間T2
*の逆数であり、TEの異なる複数のエコー信号を用いて算出することができる。一般にR2
*(T2
*)はグラディエントエコーを用いて、R2(T2)はスピンエコーを用いて算出される。
計算機109は、MRI装置100全体の動作を制御するとともに、受信した核磁気共鳴信号に対して様々な演算処理を行う。本実施形態では、任意のエコー時間の複素画像や物性値分布、酸素摂取率分布などを生成する。計算機109は、CPU、メモリ、記憶装置などを備える情報処理装置であり、計算機109にはディスプレイ110、外部記憶装置111、入力装置115などが接続される。
ディスプレイ110は、演算処理で得られた結果等をオペレータに表示するインタフェースである。入力装置115は、本実施形態で実施する計測や演算処理に必要な条件、パラメータ等をオペレータが入力するためのインタフェースである。ユーザーは、入力装置115を介して、例えば、計測するエコーの数や、エコー時間、エコー間隔などの計測パラメータを入力できる。外部記憶装置111は、計算機109内部の記憶装置とともに、計算機109が実行する各種の演算処理に用いられるデータ、演算処理により得られるデータ、入力された条件、パラメータ等を保持する。
上述した機能を実現する計算機109の構成例を図3(a)、(b)に示す。計算機109は、図3(a)に示すように、高周波磁場パルスの照射に応じて被検体から発生する核磁気共鳴信号(エコー信号)を複素信号として計測する計測制御部310と、計測制御部310が計測した複素信号から画素値が複素数である複素画像を再構成する画像再構成部320と、画像再構成部320が再構成した複素画像から酸素摂取率分布を算出する酸素摂取率分布算出部330とを備える。酸素摂取率分布算出部330の詳細は、後述する。
上述した計算機109の各部の機能は、記憶装置が保持するプログラム(ソフトウェア)を、CPUがメモリにロードして実行することにより実現される。各機能の処理に用いる各種のデータ、処理中に生成される各種のデータは、記憶装置あるいは外部記憶装置111に格納される。また、計算機109が実現する各種の機能のうち、少なくとも一つの機能は、MRI装置100とは独立した、情報処理装置であって、MRI装置100とデータの送受信が可能な情報処理装置により実現されていてもよい。さらに、全部または一部の機能は、ASIC(Application Specific Integrated Circuit)、FPGA(field-programmable gate array)などのハードウェアによって実現してもよい。
次に本実施形態のMRI装置(主として計算機109)の動作の概要を説明する。図4に動作の流れを示す。ここでは酸素量特性として酸素摂取率を算出する場合を例示する。
まず、計測制御部310は、予め定められたパルスシーケンスにしたがってシーケンス制御装置114を制御し、予め定めたエコー時間のエコー信号を計測する(ステップS1001)。その後、画像再構成部320は、得られたエコー信号を、k空間上に配置してフーリエ変換することにより、複素画像Iを再構成する(ステップS1002)。
酸素摂取率分布算出部330は、複素画像から酸素摂取率を反映した物性値分布を算出し、その物性値分布から酸素摂取率分布を算出する酸素摂取率分布算出処理を行う(ステップS1003)。
まず、計測制御部310は、予め定められたパルスシーケンスにしたがってシーケンス制御装置114を制御し、予め定めたエコー時間のエコー信号を計測する(ステップS1001)。その後、画像再構成部320は、得られたエコー信号を、k空間上に配置してフーリエ変換することにより、複素画像Iを再構成する(ステップS1002)。
酸素摂取率分布算出部330は、複素画像から酸素摂取率を反映した物性値分布を算出し、その物性値分布から酸素摂取率分布を算出する酸素摂取率分布算出処理を行う(ステップS1003)。
この酸素摂取率分布算出のステップS1003において、物性値画像(物性値分布ともいう)を、複数の組織に分離する(組織分離処理)。即ち物性値画像のもととなる複素画像は、所望の被検体領域、例えば頭部(脳)を対象とする画像であり、物性値画像もこの領域の物性値を表している。被検体領域には、複数の異なる組織、例えば脳であれば、脳実質、血管が含まれる。この処理では、物性値画像を、その画素値を用いて異なる組織毎の物性値画像に分離する。分離後の物性値画像を組織分離画像とする。なお組織分離処理は、所望の一つの組織をそれ以外の組織から分離する場合を含み、必ずしも複数の組織分離画像を得なくてもよい。その後、組織分離画像の一つについて、画素値を物性値から酸素量特性に変換する処理を行う(変換処理)。これにより分離した組織について酸素量特性が得られる。変換処理後の組織分離画像(すなわちその酸素量特性の値)を用いて、対象とする被検体領域の酸素量特性を推定し、酸素量特性分布を得る。必要に応じて精度を高めるための補正、例えば部分体積効果補正を行う。
その後、算出した酸素摂取率分布をディスプレイ110に表示する(ステップS1004)。なお、酸素摂取率分布をディスプレイ110に表示する際、必要に応じて、ステップS1003で算出した酸素摂取率分布のほか、酸素摂取率分布算出処理の過程によって算出される画像をディスプレイ110に表示してもよい。
これらの処理は、図3に示す酸素摂取率分布算出部330の各部により実現することができる。すなわち、図3(a)に示ように、酸素摂取率分布算出部330は、複素画像Iから酸素摂取率を反映した物性値分布を算出する物性値分布算出部331と、算出した物性値分布から、少なくとも2つ種類以上の生体組織に分離した組織分離画像を算出する組織分離部332と、組織分離画像のいずれかを酸素摂取率に対応する画素値に変換する酸素摂取率変換部333と、組織分離画像において、任意の画素の画素値とその周囲の画素の平均値が略等しいという条件に基づいて酸素摂取率分布を推定する酸素摂取率分布推定部334と、を備える。酸素摂取率分布算出部330は、図3(b)に示すように、酸素摂取率分布推定部334が算出した推定酸素摂取率分布に対して補正を行う補正部を備えていてもよい。図示する例では、酸素摂取率分布算出部330は、任意の静脈の酸素摂取率と脳全体の酸素摂取率の平均値が略等しいという条件に基づいて部分体積により低下した酸素摂取率を補正し、最終的な酸素摂取率分布を得る部分体積効果補正部335を備える。
以下、具体的な実施形態に基き、計算機109による処理を詳細に説明する。以下の実施形態では、対象部位(領域)が脳であり、酸素量特性分布として脳(実質)の酸素摂取率分布を求める場合を説明する。なお本実施形態における計算機109の構成は図3に示すものと同様であるが、本実施形態では、図3における物性値分布算出部331を磁化率分布算出部と読み替える。
<第一実施形態>
本実施形態では、物性値として磁化率分布を算出し、磁化率分布から酸素摂取率分布を算出する。また組織分離処理では、静脈とそれ以外の組織に分離し、静脈分布を算出する。以下、図4に示す処理フローを参照して、本実施形態の処理を説明する。
本実施形態では、物性値として磁化率分布を算出し、磁化率分布から酸素摂取率分布を算出する。また組織分離処理では、静脈とそれ以外の組織に分離し、静脈分布を算出する。以下、図4に示す処理フローを参照して、本実施形態の処理を説明する。
[計測:S1001]
計測制御部310は、入力装置115を介してユーザーが入力したパラメータに基づいて設定されるパルスシーケンスに従って、シーケンス制御装置114を動作させ、予め定めたエコー時間(TE)の核磁気共鳴信号(エコー信号)を取得する計測を実施する。シーケンス制御装置114は、計測制御部310からの指示に従って、計測部を制御して計測を行う。本実施形態では、任意の1つのエコー時間のエコー信号を得る。
計測制御部310は、入力装置115を介してユーザーが入力したパラメータに基づいて設定されるパルスシーケンスに従って、シーケンス制御装置114を動作させ、予め定めたエコー時間(TE)の核磁気共鳴信号(エコー信号)を取得する計測を実施する。シーケンス制御装置114は、計測制御部310からの指示に従って、計測部を制御して計測を行う。本実施形態では、任意の1つのエコー時間のエコー信号を得る。
ここで、計測制御部310が計測に用いるパルスシーケンスの例を説明する。本実施形態では、例えば、GrE(Gradient Echo)系のパルスシーケンスを用いる。このGrE系のパルスシーケンスで得られた画像は、生体組織の酸素摂取率を鋭敏に反映する。
図5に、GrE系のパルスシーケンスの一例として、RSSG(RF-spoiled-Steady-state Acquisition with Rewound Gradient-Echo)-Multiechoシーケンス550を示す。本図において、RF、Gs、Gp、Grはそれぞれ、高周波磁場、スライス傾斜磁場、位相エンコード傾斜磁場、リードアウト傾斜磁場を表す。
RSSGシーケンス550では、スライス傾斜磁場パルス501の印加とともに高周波磁場(RF)パルス502を照射し、被検体101内の所定のスライスの磁化を励起する。次いで磁化の位相にスライス方向および位相エンコード方向の位置情報を付加するためのスライスエンコード傾斜磁場パルス503および位相エンコード傾斜磁場パルス504を印加する。
画素内の核磁化の位相を分散させるディフェーズ用のリードアウト傾斜磁場パルス505を印加した後、リードアウト方向の位置情報を付加するためのリードアウト傾斜磁場パルス506、507、508、509を印加しながら核磁気共鳴信号(エコー)510、511、512、513をそれぞれ計測する。そして最後に、スライスエンコード傾斜磁場パルス503および位相エンコード傾斜磁場パルス504によってディフェーズされた核磁化の位相を収束させるリフェーズ用のスライスエンコード傾斜磁場パルス514および位相エンコード傾斜磁場パルス515を印加する。
計測制御部310は、以上の手順を、スライスエンコード傾斜磁場パルス503、514(スライスエンコード数ks)および位相エンコード傾斜磁場パルス504、515(位相エンコード数kp)の強度と、RFパルス502の位相とを変化させながら、繰り返し時間TRで繰り返し実行し、エコー時間毎に1枚の画像を得るために必要なエコーを計測する。このとき、前回の励起後に残っている横磁化の影響を除くために、RFパルス502の位相を所定量、例えば、117度ずつ増加させる。また、図5において、ハイフン以下の数字は、繰り返しの何回目であるかを示す。
なお、計測される各エコーにおいて、血流などの流れの影響を補償するFlow Compensation傾斜磁場パルスを各軸に印加してもよい。
計測された各エコーはkr、kp、ksを座標軸とする3次元のk空間上(メモリ空間)に配置される。このとき、一つのエコーはk空間上でkr軸に平行な1ラインを占める。このRSSGシーケンス550により得られる絶対値画像は、TEが短いエコーの場合はT1(縦緩和時間)強調画像、TEが長いエコーの場合は画素内の位相分散を反映したT2*強調画像となる。
なお図5に例示したRSSGシーケンス550は、k空間の座標軸に平行にデータを取得するカーテシアン撮像の一つであるが、k空間のデータ取得手法は、任意であり、例えば、k空間において回転状にデータを取得するラジアルスキャンなど、ノンカーテシアン撮像を用いてもよい。またここではTEの異なるマルチエコー510~513のエコー毎に画像を得ているが、各エコーに異なるエンコードを与えるエコープラナー型のk空間走査法(マルチエコーエコープラナーイメージング法)でもよい。さらに複数のエコー時間の複素画像を得るのではなく、一つのTEのエコーを計測するシーケンスを用いて、一つの複素画像を計測してもよい。
[画像再構成:S1002]
次に、画像再構成部320は、ステップS1001でk空間上に配置したエコー時間TEのエコー信号をフーリエ変換し、複素画像Iを算出する。
次に、画像再構成部320は、ステップS1001でk空間上に配置したエコー時間TEのエコー信号をフーリエ変換し、複素画像Iを算出する。
[酸素摂取率分布算出処理:S1003]
次に、酸素摂取率分布算出部330は、画像再構成部320が再構成した複素画像Iから、酸素摂取率分布を算出する。酸素摂取率分布は、生体組織が消費した酸素の量を画像化したものである。
次に、酸素摂取率分布算出部330は、画像再構成部320が再構成した複素画像Iから、酸素摂取率分布を算出する。酸素摂取率分布は、生体組織が消費した酸素の量を画像化したものである。
本実施形態における酸素摂取率分布算出部330の処理(S1003)の詳細を、図6を参照して説明する。この処理S1003では、図6に示すように、物性値分布算出部331が、まず、複素画像Iから、磁化率分布を算出する(S1101)。組織分離部332は、算出した磁化率分布を、少なくとも2種類の生体組織毎に分離し、組織分離画像(組織毎の磁化率分布)を算出する(S1102)。次いで、酸素摂取率換算部333が、組織分離画像のいずれかに対し、その画素値(磁化率)を酸素摂取率に対応する画素値に変換する(S1103)。その後、組織分離画像において、任意の画素の画素値とその周囲の画素の平均値が略等しいという条件に基づいて、対象とする領域全体の酸素摂取率分布を推定する(S1104)。必要に応じ推定した酸素摂取率分布の精度を高める補正を行い、最終的な酸素摂取率分布を得る(S1105)。例えば、部分体積効果補正処理を行う。この補正は、処理対象である画像の画素の大きさと、酸素摂取率推定に用いた画素毎の磁化率に寄与する組織の大きさとの違いに基づく誤差を補正する処理であり、算出した推定酸素摂取率分布に対して、任意の静脈の酸素摂取率と脳全体の酸素摂取率の平均値が略等しいという条件に基づいて部分体積により低下した酸素摂取率を補正する。
以下、本実施形態の酸素摂取率分布算出部330の各部が行う処理内容を詳述する。
[磁化率分布算出:S1101]
磁化率分布算出部331は、計測した複素画像Iの位相情報(位相画像)からQSM法を用いて磁化率分布を算出する。QSM法を用いた磁化率分布の算出手法は、公知であり、ここではその概略を説明する。
磁化率分布算出部331は、計測した複素画像Iの位相情報(位相画像)からQSM法を用いて磁化率分布を算出する。QSM法を用いた磁化率分布の算出手法は、公知であり、ここではその概略を説明する。
QSM法では、生体組織間の磁化率差によって生じる局所的な磁場変化を、Gradient Echo(GrE)法で撮像した位相画像から算出する。ここで、位置ベクトルをrとすると組織間の磁化率差によって生じる相対的な磁場変化(磁場分布)δ(r)は、以下の式(1)で表される。

式中、φ(r)は位相画像、γはプロトンの核磁気回転比、B0は静磁場強度、TEはエコー時間をそれぞれ表す。
また、磁場分布δ(r)は、静磁場に関するマクスウェル方程式より、生体内の磁化率分布χ(r)を用いて以下の式(2)で表される。

式(2)において、αは、ベクトル(r’-r)と静磁場方向とのなす角度、d(r)は、点ダイポール磁場をそれぞれ表す。
式(2)に示すように、磁場分布δ(r)は、磁化率分布χ(r)と点ダイポール磁場d(r)との畳み込み積分で表される。したがって、式(2)の両辺をフーリエ変換することにより、式(2)は以下の式(3)に変換される。

式(3)中、k=(kx、ky、kz)は、k空間上の位置ベクトル、Δ(k)、X(k)、D(k)は、磁場分布δ(r)、磁化率分布χ(r)、点ダイポール磁場d(r)のフーリエ成分をそれぞれ表す。
式(3)に示すように、磁化率分布のフーリエ成分X(k)は、磁場分布のフーリエ成分Δ(k)を点ダイポール磁場のフーリエ成分D(k)で除算することによって算出できる。しかしながら、式(3)は、D(k)=0近傍の領域において、その逆数が発散してしまうため、直接的にX(k)を算出することができない。
このD(k)=0となる領域はマジックアングルと呼ばれ、磁場方向に対しておよそ54.7°の2倍の頂角を持つ逆双円錐領域となる。マジックアングルの存在により磁場分布から磁化率分布を推定するQSM法は、不良条件逆問題(ill-conditioned inverse problem)に帰着され、いくつかの解法が提案されている。
その代表的な方法として、磁場と磁化率との関係式に基づく制約条件下で、磁場分布から算出した磁化率分布に対して平滑化処理を行うことを繰り返す方法(本発明者らによる特願2014-228843号記載の方法)や、磁場分布および点ダイポール磁場のk空間上の演算により磁化率分布を算出するTKD(Truncated-based K-space Division)法、TKD法で算出した磁化率分布と、閾値処理により微細構造を抽出した磁化率分布とを繰り返し演算により合成するIterative SWIM(Susceptibility Weighted Imaging and Mapping)法、正則化付き最小二乗法を用いたMEDI法(Morphology enabled dipole inversion)法がある。
本実施形態の磁化率分布算出部331は、これらの方法を用いて定量的磁化率(QSM)分布を算出する。本実施形態では、いずれの方法を用いて定量的磁化率分布を算出してもよい。
[組織分離画像算出:S1102]
組織分離部332は、算出した磁化率分布から、少なくとも2つ種類以上の生体組織に分離した組織分離画像を算出する。本実施形態では、物性値分布算出部331で算出した磁化率分布から静脈部分を抽出して、静脈の磁化率分布と、それ以外の組織の磁化率分布をそれぞれ算出する。
組織分離部332は、算出した磁化率分布から、少なくとも2つ種類以上の生体組織に分離した組織分離画像を算出する。本実施形態では、物性値分布算出部331で算出した磁化率分布から静脈部分を抽出して、静脈の磁化率分布と、それ以外の組織の磁化率分布をそれぞれ算出する。
磁化率分布を、組織毎の磁化率分布に分離する手法は、いくつかあり得るが、ここではモルフォロジーフィルタバンクを用いて静脈の磁化率分布を算出する手法を説明する。モルフォロジーフィルタバンクは、オープニング処理やトップハット変換を用いて所与の画像から特徴抽出するモルフォロジー演算を基礎とする処理であり(詳細はIEICE Technical Report MI2010-101(2011-1)を参照)、モルフォロジー演算に用いる構造要素のサイズを変えて、処理を繰り返す。即ち、図7に示すように、まず算出した磁化率分布に対して、直線構造要素の角度を三次元的に変えた多重直線構造要素によるトップハット変換により粒状成分を分離し、球形の構造要素によるトップハット変換により静脈成分を分離する。これにより元画像I0を、粒状成分画像I1P、血管成分画像I1v、平滑化画像I1に分離する。分離した平滑化画像I1に対して、サイズを大きくした複数の構造要素によるトップハット変換を再び実施し、粒状成分画像I2P、血管成分画像I2v、平滑化画像I2に分離する。この処理を、構造要素のサイズを大きくさせながら繰り返す。その後、各処理で分離した血管成分画像の和をとることにより構造要素のサイズの最大値に対応した直径以下の血管を抽出できる。なお図7では繰り返し回数が3回の場合を例示しているが、繰り返し回数は任意である。
本実施形態では、粒状成分を分祀した後、静脈成分を分離するので、磁化率分布において高磁化率となる淡蒼球や赤核、黒質などの鉄タンパク(フェリチン)沈着組織を取り除いた静脈の磁化率分布を算出することができる。
以上、モルフォロジーフィルタバンクを用いて静脈の磁化率分布とその他の組織の磁化率分布を分離する例を説明したが、分離処理はこの方法に限られない。例えば、磁化率分布(画像)に、複数の画素からなる小領域を設定し、この小領域における磁化率の平均値と標準偏差を算出し、平均値+N×標準偏差の範囲を超える画素値を静脈として抽出してもよい(Nは任意の実数)。また、微分フィルタなどの各種フィルタを組み合わせてもよい。また図4のステップS1002で取得した画像の絶対値を用いて、静脈組織を分離し、静脈領域を1、それ以外を0とするマスクを作成し、このマスクを磁化率分布に掛けてもよい。但し、毛細血管等の描出能は、絶対値画像よりも磁化率分布のほうが優れているため、磁化率分布を用いる手法が好適である。
[酸素摂取率変換:S1103]
酸素摂取率変換部333は、少なくとも2つの生体組織に分離した組織分離画像のうちのいずれかを酸素摂取率に変換する。本実施形態では、静脈の磁化率分布を酸素摂取率に変換する。静脈の磁化率は、デオキシヘモグロビンの濃度、すなわち酸素摂取率に比例することが知られている。即ち、静脈と生体組織との磁化率差をχv、ヘマトクリット(血液中に占める血球の体積の割合を示す数値)をHct、単位ヘマトクリットあたりの動静脈間の磁化率差をΔχdoとすると、酸素摂取率は式4を用いて算出することができる(Jan Sedlacik他、 ”Validation of Quantitative Estimation of Tissue Oxygen Extraction Fraction and Deoxygenated Blood Volume Fraction in Phantom and In Vivo Experiments by Using MRI”、 Magnetic Resonance in Medicine、2010年、63巻、910-921頁の式6を参照)。

酸素摂取率変換部333は、少なくとも2つの生体組織に分離した組織分離画像のうちのいずれかを酸素摂取率に変換する。本実施形態では、静脈の磁化率分布を酸素摂取率に変換する。静脈の磁化率は、デオキシヘモグロビンの濃度、すなわち酸素摂取率に比例することが知られている。即ち、静脈と生体組織との磁化率差をχv、ヘマトクリット(血液中に占める血球の体積の割合を示す数値)をHct、単位ヘマトクリットあたりの動静脈間の磁化率差をΔχdoとすると、酸素摂取率は式4を用いて算出することができる(Jan Sedlacik他、 ”Validation of Quantitative Estimation of Tissue Oxygen Extraction Fraction and Deoxygenated Blood Volume Fraction in Phantom and In Vivo Experiments by Using MRI”、 Magnetic Resonance in Medicine、2010年、63巻、910-921頁の式6を参照)。
ここで、ヘマトクリット値は正常男性でおよそ0.42、正常女性で0.38と言われている。また、単位ヘマトクリットあたりの動静脈間の磁化率差Δχdoは0.18ppm(CGS単位系)であることが知られている。したがって、静脈と生体組織の磁化率差Δχvを算出できれば静脈のOEFに変換することができる。なおヘマトクリット値については、MRI検査とは別に行った血液検査から被検体について求めた値を代入してもよい。
[酸素摂取率分布推定:S1104]
酸素摂取率分布推定部334は、酸素摂取率に変換した静脈の磁化率分布において、任意の画素の画素値とその周囲の画素の平均値が略等しいという制約条件(第1の条件)に基づいて、検査対象である組織全体、例えば脳実質の酸素摂取率分布を推定する。ここで、対象とする領域を1、それ以外(例えば脳表などの領域)を0とするマスク(バイナリマスク)をM、第1の条件を満たすと推定できる局所的領域の半径をr、半径rの球状のカーネルをρ、デルタ関数をδとすると、生体組織(対象とする領域)の酸素摂取率OEFtは、半径rの範囲内では大きく変化しないと仮定できるため、式(5)の関係式が成り立つ。
酸素摂取率分布推定部334は、酸素摂取率に変換した静脈の磁化率分布において、任意の画素の画素値とその周囲の画素の平均値が略等しいという制約条件(第1の条件)に基づいて、検査対象である組織全体、例えば脳実質の酸素摂取率分布を推定する。ここで、対象とする領域を1、それ以外(例えば脳表などの領域)を0とするマスク(バイナリマスク)をM、第1の条件を満たすと推定できる局所的領域の半径をr、半径rの球状のカーネルをρ、デルタ関数をδとすると、生体組織(対象とする領域)の酸素摂取率OEFtは、半径rの範囲内では大きく変化しないと仮定できるため、式(5)の関係式が成り立つ。

式(5)は、フーリエ変換演算子F、逆フーリエ変換演算子F-1を用いると、式(6)のように書き換えることができる。

式(6)において、Cはカーネルρのフーリエ成分(C=Fρ)、Δはデルタ関数δのフーリエ成分(Δ=Fδ)をそれぞれ表す。式(6)を満たすような生体組織の酸素摂取率OEFtを算出できればよい。そこで本実施形態では、静脈の酸素摂取率OEFvの局所平均値と、生体組織の酸素摂取率OEFtの局所平均値が等しいという制約条件(第二の条件)を加えて、式(6)を満たす酸素摂取率OEFtを算出する。すなわち式(7)を最小化する「OEFt」を求める。
なお、本実施形態では、式(7)に示す最小化処理により生体組織の酸素摂取率OEFtを推定したが、この方法に限られない。たとえば、静脈の酸素摂取率OEFvの局所平均値や、静脈の酸素摂取率OEFvのガウシアンフィルタによる平滑化処理を用いてもよい。
[部分体積効果補正:S1105]
部分体積効果補正部335は、S1104で算出した生体組織の酸素摂取率OEFtに対して、部分体積効果補正を実施する。S1103で生体組織の酸素摂取率OEFtを算出するのに用いた静脈の酸素摂取率OEFvは、画素サイズより小さい静脈については、画素内に含まれるその他の生体組織による部分体積効果によって小さい値に算出されている(部分体積効果)。したがって、部分体積効果による酸素摂取率の低下を補正する必要がある。このため、部分体積効果補正部335は、まず、任意の静脈の酸素摂取率と脳全体の酸素摂取率の平均値が等しいという条件に基づいて、部分体積効果により低下した酸素摂取率を補正するための補正係数(部分体積効果補正係数)を算出する。任意の静脈は、脳全体の酸素摂取率を代表するとみなすことができる静脈であることが好ましく、例えば静脈洞などの太い静脈とする。
部分体積効果補正部335は、S1104で算出した生体組織の酸素摂取率OEFtに対して、部分体積効果補正を実施する。S1103で生体組織の酸素摂取率OEFtを算出するのに用いた静脈の酸素摂取率OEFvは、画素サイズより小さい静脈については、画素内に含まれるその他の生体組織による部分体積効果によって小さい値に算出されている(部分体積効果)。したがって、部分体積効果による酸素摂取率の低下を補正する必要がある。このため、部分体積効果補正部335は、まず、任意の静脈の酸素摂取率と脳全体の酸素摂取率の平均値が等しいという条件に基づいて、部分体積効果により低下した酸素摂取率を補正するための補正係数(部分体積効果補正係数)を算出する。任意の静脈は、脳全体の酸素摂取率を代表するとみなすことができる静脈であることが好ましく、例えば静脈洞などの太い静脈とする。
ここで、任意の静脈の酸素摂取率の平均値をOEFSSS、バイナリマスクM内にある画素数をN、画素位置iにおける生体組織の酸素摂取率をOEFt(i)とすると、上述した条件(任意の静脈の酸素摂取率と脳全体の酸素摂取率の平均値が等しいという条件)は、式(8)で表すことができる。PVCは式(8)を満たすための部分体積効果補正係数である。

任意の静脈の酸素摂取率OEFSSSは、例えば、組織分離処理において、静脈として分離された画像(磁化率分布画像)から任意の静脈に相当する1ないし複数の画素を選択し、その変換処理S1103後の酸素摂取率を用いることができる。
次いで部分体積効果補正部335は、式(8)を満たす部分体積効果補正係数PVCを用いて、式(9)により各画素の酸素摂取率を補正する。これにより最終的な酸素摂取率分布OEF(i)correctedを算出することができる。

以上の処理S1101~S1105により、図3の酸素摂取率分布算出処理S1003が完了する。なお、図6に示すフローは一例であり、その一部の処理を省いたり、順番を入れ替えたりすることも本実施形態に含まれる。例えば、図6の部分体積効果補正を省いたり、部分体積効果補正を組織分離画像算出後や酸素摂取率変換後に実施したりすることもあり得る。また部分体積効果補正以外に、適宜フィルタなどを用いた平滑処理などを施してもよい。さらに、算出した酸素摂取率を用いて、その他の酸素量特性、例えば酸素飽和度や酸素代謝率などを算出することも可能である。
上記処理S1101~S1105の各段階で得られる画像の例を図8に示す。図8は、QSM法を用いて算出した脳の酸素摂取率分布を示す図で、図8(a)は、物性値分布算出部331が算出した磁化率分布、図8(b)は、組織分離部332が算出した静脈の磁化率分布、図8(c)は最終的に算出した酸素摂取率分布である。
[画像表示:S1005]
酸素摂取率分布算出部330が算出した酸素摂取率分布や磁化率分布は、ディスプレイ110(図1)に表示することができる。或いは外部記憶装置111に画像データとして格納し、所望の表示装置で表示されてもよい。表示の形態は、特に限定されず、例えば酸素摂取率分布は、図8(c)に示すような等高線やカラーマップとして表示することができる。
酸素摂取率分布算出部330が算出した酸素摂取率分布や磁化率分布は、ディスプレイ110(図1)に表示することができる。或いは外部記憶装置111に画像データとして格納し、所望の表示装置で表示されてもよい。表示の形態は、特に限定されず、例えば酸素摂取率分布は、図8(c)に示すような等高線やカラーマップとして表示することができる。
本実施形態のMRI装置(或いは演算処理装置)及び画像処理方法によれば、カフェイン投与などの負荷を与えず簡易な処理で脳実質を含む脳内の酸素摂取率分布を算出でき、診断精度を向上させることができる。また本実施形態によれば、酸素摂取率との線形な関係にある磁化率分布を用い、且つ磁化率を精度よく算出できる組織、例えば静脈、を分離して組織分離画像を作成し、酸素摂取率を推定するので、精度のよく酸素摂取率分布を算出することができる。
また部分体積効果補正を行うことにより、画素サイズよりも小さい毛細血管が含まれる組織についても、部分体積効果による誤差を低減し、算出した酸素摂取率分布の精度を高めることができる。
<第二実施形態>
第一実施形態では、酸素摂取率を反映する物性値として磁化率分布を用いた例であるが、本実施形態では、本実施形態では、酸素摂取率を反映する物性値分布として見かけの横緩和速度(R2 *)分布を算出する。
第一実施形態では、酸素摂取率を反映する物性値として磁化率分布を用いた例であるが、本実施形態では、本実施形態では、酸素摂取率を反映する物性値分布として見かけの横緩和速度(R2 *)分布を算出する。
本実施形態においても計算機109及び酸素摂取率算出部330の構成は、第一実施形態と同様であるが、計測制御部310は2つ以上の複数のエコー時間のエコーを計測し、エコー時間が異なる複数の複素画像を取得する制御を行う。また物性値分布算出部331、及び酸素摂取率変換部332の処理内容が異なる。具体的には、また物性値分布算出部331では、複数のエコー時間の複素画像から、R2
*分布を算出し、酸素摂取率変換部332では、R2
*分布の各画素値を酸素摂取率に変換する。本実施形態では、図3における物性値分布算出部331は、R2
*分布算出部と読み替える。
以下、第一実施形態とは異なる点を中心に、本実施形態の計算機109、主として酸素摂取率算出部330の動作を、図9のフローを参照して説明する。以下の説明において、適宜、第一実施形態で用いた図3の機能ブロック図及び図4も参照する。
[計測及び画像再構成:S1001、S1002]
計測制御部310は、図5に示すような、GrE系パルスシーケンスに基き計測部を制御し、複数のエコー時間(TE)の異なるエコーを計測する。なお図5は1回の励起後にTEの異なる複数のエコーを計測するマルチエコーシーケンスであるが、1つのエコーを計測するシーケンスを用いた撮像を、TEを変えて複数回実行してもよい。画像再構成部320は、各エコーから異なるTE毎に複素画像を再構成する。
計測制御部310は、図5に示すような、GrE系パルスシーケンスに基き計測部を制御し、複数のエコー時間(TE)の異なるエコーを計測する。なお図5は1回の励起後にTEの異なる複数のエコーを計測するマルチエコーシーケンスであるが、1つのエコーを計測するシーケンスを用いた撮像を、TEを変えて複数回実行してもよい。画像再構成部320は、各エコーから異なるTE毎に複素画像を再構成する。
[酸素摂取率分布算出:S1003]
[R2 *分布算出:S1101]
R2 *分布算出部331は、エコー時間(TE)で計測した複素画像I(TE)から、R2 *分布を算出する。以下、複素画像I(TE)からR2 *分布を算出する手法について説明する。
[R2 *分布算出:S1101]
R2 *分布算出部331は、エコー時間(TE)で計測した複素画像I(TE)から、R2 *分布を算出する。以下、複素画像I(TE)からR2 *分布を算出する手法について説明する。
複素画像Iは強度情報と位相情報を含む画像であるが、ここでは強度情報を持つ画像(絶対値画像)を用いて、生体組織の磁化率変化によって生じる信号減衰を算出する。ここで、画素内のプロトン密度をM0、見かけの横緩和速度をR2
*とすると、エコー時間TEにおける信号強度I(TE)は式(10)で表される。

GrE法で計測した、TEが異なる複数の画像の各画素の画素値を、式(10)の信号モデルに最小二乗フィッティングさせることでプロトン密度分布M0、見かけの横緩和速度分布R2
*をそれぞれ算出することができる。式(10)の未知数は2つなので、TEが異なる画像の数は2以上であればよいが、画像数(エコー数)を多くすることでフィッティングの精度を高めることができる。
[組織分離画像算出:S1102]
組織分離部332は、算出したR2 *分布から、少なくとも2つ種類以上の生体組織に分離した組織分離画像を算出する。ここではR2 *分布から静脈を抽出して、静脈のR2 *分布と、それ以外のR2 *分布に分離する。静脈のR2 *分布を抽出する方法は、第一実施形態と同様であり、例えばモルフォロジーフィルタバンクを用いた処理(図7)や局所の平均値と標準偏差から静脈を判別する処理などを採用することができる。
組織分離部332は、算出したR2 *分布から、少なくとも2つ種類以上の生体組織に分離した組織分離画像を算出する。ここではR2 *分布から静脈を抽出して、静脈のR2 *分布と、それ以外のR2 *分布に分離する。静脈のR2 *分布を抽出する方法は、第一実施形態と同様であり、例えばモルフォロジーフィルタバンクを用いた処理(図7)や局所の平均値と標準偏差から静脈を判別する処理などを採用することができる。
[酸素摂取率変換:S1103]
酸素摂取率変換部333は、S1102で分離した静脈のR2 *分布の各画素値(R2 *値)を酸素摂取率に変換する。静脈のR2 *値は、デオキシヘモグロビンの濃度、すなわち酸素摂取率に比例することが知られている(Xiang He他、 ” Quantitative BOLD: Mapping of Human Cerebral Deoxygenated Blood Volume and Oxygen Extraction Fraction: Default State”、 Magnetic Resonance in Medicine、2007年、57巻、115-126頁の式1と式2を参照)。ここで、静脈の横緩和速度をR2、ヘマトクリット(血液中に占める血球の体積の割合を示す数値)をHct、単位ヘマトクリットあたりの動静脈間の磁化率差をΔχdoとすると、酸素摂取率OEFは式(11)で表される。
酸素摂取率変換部333は、S1102で分離した静脈のR2 *分布の各画素値(R2 *値)を酸素摂取率に変換する。静脈のR2 *値は、デオキシヘモグロビンの濃度、すなわち酸素摂取率に比例することが知られている(Xiang He他、 ” Quantitative BOLD: Mapping of Human Cerebral Deoxygenated Blood Volume and Oxygen Extraction Fraction: Default State”、 Magnetic Resonance in Medicine、2007年、57巻、115-126頁の式1と式2を参照)。ここで、静脈の横緩和速度をR2、ヘマトクリット(血液中に占める血球の体積の割合を示す数値)をHct、単位ヘマトクリットあたりの動静脈間の磁化率差をΔχdoとすると、酸素摂取率OEFは式(11)で表される。


酸素摂取率変換以降の処理、即ち、酸素摂取率分布推定(S1104)や部分体積効果補正(S1105)は第一の実施形態と同様に実施する。
以上の手順により、見かけの横緩和速度R2
*から脳実質の酸素摂取率が算出できる。この場合にも、図8(c)に示したような酸素摂取率分布を得ることができ、適宜、任意の表示形態でディスプレイ110に表示することができる。
本実施形態によれば、第一実施形態と同様に、精度よく酸素摂取率を算出できる組織を分離して酸素摂取率の計算を行うので、非侵襲的に且つ精度よく酸素摂取率分布を得ることができる。また本実施形態によれば、特性値として見かけの横緩和速度R2
*を用いることにより、磁化率分布よりもミクロの構造の情報を得ることができ、組織分離の精度を高めることができる。その結果、酸素摂取率分布算出の精度を高めることができる。
なお第一実施形態で説明した変形例、例えばモルフォロジーフィルタバンク以外の組織分離方法を採用することや、図3に示す手順の入れ替え、部分体積効果補正の省略等は、本実施形態においても同様に適用することができる。
<第二実施形態の変形例>
上記実施形態では、真の横緩和速度R2については、R2 *値に対し無視できる程度に小さいものと仮定して酸素摂取率を算出したが、式(11)からわかるように、酸素摂取率と線形の関係にあるのはR’(=R2 *-R2)である。本変形例では、計測制御部310は、図5のパルスシーケンスの他に、R2が求められるパルスシーケンスを用いて、TEの異なるスピンエコー(SE)画像を複数取得し、物性値としてR’分布を取得する。
上記実施形態では、真の横緩和速度R2については、R2 *値に対し無視できる程度に小さいものと仮定して酸素摂取率を算出したが、式(11)からわかるように、酸素摂取率と線形の関係にあるのはR’(=R2 *-R2)である。本変形例では、計測制御部310は、図5のパルスシーケンスの他に、R2が求められるパルスシーケンスを用いて、TEの異なるスピンエコー(SE)画像を複数取得し、物性値としてR’分布を取得する。
R2が求められるパルスシーケンスとしては、例えば図10に示すように、反転パルス702-2や702-3を追加したMulti-echo SEシーケンス750を用いることができる。このシーケンスの詳細な説明は省略するが、このシーケンスでは、図5のGrEシーケンスと同様に、複数のTEの異なるエコー710、711が得られる。これらのエコーは静磁場の不均一の影響を含まないスピンエコーであり、図10のシーケンスを、スライス方向及び位相エンコード方向の各エンコード量を異ならせて繰り返すことにより複数のSE画像用データ(k空間データ)が得られる。画像再構成部320はこれら画像用データを再構成し、TEが異なる複数のSE画像を得る。
酸素摂取率算出部330は、複数のSE画像から、式(10)と同様の信号減衰式を用いて、R2を算出し(物性値分布算出)、GrE画像から算出したR2
*とSE画像から算出したR2を用いて式(11)により酸素摂取率OEFを算出することができる(酸素摂取率変換)。
本変形例によれば、計測ステップ(図3:S1001)の時間は長くなるが、より正確なOEFを算出することができる。
なお、その他のパルスシーケンスを用いてR2 *とR2をそれぞれ算出してもよい。例えば、2D GrE-EPIシーケンスのTEを複数回変えて計測した複数の画像からR2 *を算出し、2D SE-EPIシーケンスのTEを複数回変えて計測した複数の画像からR2を算出してもよい。上記のようにEPI系シーケンスを用いることで計測ステップ(図3:S1001)の時間を短縮することができる。
本変形例によれば、計測ステップ(図3:S1001)の時間は長くなるが、より正確なOEFを算出することができる。
なお、その他のパルスシーケンスを用いてR2 *とR2をそれぞれ算出してもよい。例えば、2D GrE-EPIシーケンスのTEを複数回変えて計測した複数の画像からR2 *を算出し、2D SE-EPIシーケンスのTEを複数回変えて計測した複数の画像からR2を算出してもよい。上記のようにEPI系シーケンスを用いることで計測ステップ(図3:S1001)の時間を短縮することができる。
<第三実施形態>
本実施形態も第二実施形態と同様に、物性値分布算出部331が、酸素摂取率を反映した特性として見かけの横緩和速度R2 *を算出する。ただし、組織分離部332(図3)の処理が第二の実施形態とは異なり、本実施形態では、見かけの横緩和速度R2 *を脳実質のR2 *とその他の組織のR2 *に分離する。
本実施形態も第二実施形態と同様に、物性値分布算出部331が、酸素摂取率を反映した特性として見かけの横緩和速度R2 *を算出する。ただし、組織分離部332(図3)の処理が第二の実施形態とは異なり、本実施形態では、見かけの横緩和速度R2 *を脳実質のR2 *とその他の組織のR2 *に分離する。
以下、第二実施形態と異なる点を中心に本実施形態の酸素摂取率分布算出部330の処理を説明する。図11に本実施形態の処理の流れを示す。図11において、図9の各ステップと同じ内容のステップは同じ符号で示し、詳しい説明は省略する。
[R2
*分布(R’分布)算出:S1101]
第二実施形態のR2 *分布(R’分布)算出ステップS1101と同様に、物性値算出部(R2 *分布算出部)331はTEの異なる複数の画像の強度情報を用いて、画素毎に見かけの横緩和速度R2 *を算出し、R2 *分布を得る。計測において、GrE系パルスシーケンスのみを用いた場合にはR2 *分布が得られるが、第二実施形態の変形例のようにSE系パルスシーケンスを併用した場合にはR’(=R2 *-R2)分布が得られる。以下、R2 *分布とR’ 分布を代表して、R2 *分布が得られたものとして説明する。
第二実施形態のR2 *分布(R’分布)算出ステップS1101と同様に、物性値算出部(R2 *分布算出部)331はTEの異なる複数の画像の強度情報を用いて、画素毎に見かけの横緩和速度R2 *を算出し、R2 *分布を得る。計測において、GrE系パルスシーケンスのみを用いた場合にはR2 *分布が得られるが、第二実施形態の変形例のようにSE系パルスシーケンスを併用した場合にはR’(=R2 *-R2)分布が得られる。以下、R2 *分布とR’ 分布を代表して、R2 *分布が得られたものとして説明する。
[組織分離画像算出:S1102]
組織分離部332は、R2 *分布から静脈を抽出して、静脈のR2 *分布を算出する。静脈のR2 *分布を抽出する方法は第一実施形態と同様であり、例えば、R2 *分布に対しモルフォロジーフィルタバンクを用いて線状の構造を抽出する手法や、絶対値画像から抽出する手法などを用いる。次いで、元のR2 *分布と静脈のR2 *分布との差分によって、脳実質のR2 *分布(差分R2 *分布という)を算出する。
組織分離部332は、R2 *分布から静脈を抽出して、静脈のR2 *分布を算出する。静脈のR2 *分布を抽出する方法は第一実施形態と同様であり、例えば、R2 *分布に対しモルフォロジーフィルタバンクを用いて線状の構造を抽出する手法や、絶対値画像から抽出する手法などを用いる。次いで、元のR2 *分布と静脈のR2 *分布との差分によって、脳実質のR2 *分布(差分R2 *分布という)を算出する。
[特性値補正:S1102-1]
この処理では、脳実質のR2 *を変化させる物質の影響を補正する。例えば、脳にフェリチンなどの鉄タンパクの沈着などがあるとその部分のR2 *は高い値となる。このようなR2 *の異常値を検出し、それを除去する。具体的には、差分R2 *分布に対して、複数の画素からなる小領域を設定し、この小領域におけるR2 *の平均値と標準偏差を算出し、平均値+N×標準偏差の範囲を超える画素値をフェリチン沈着組織のR2 *として抽出する。次いで抽出したR2 *を差分R2 *分布から差し引き、脳実質の補正後R2 *分布とする。
この処理では、脳実質のR2 *を変化させる物質の影響を補正する。例えば、脳にフェリチンなどの鉄タンパクの沈着などがあるとその部分のR2 *は高い値となる。このようなR2 *の異常値を検出し、それを除去する。具体的には、差分R2 *分布に対して、複数の画素からなる小領域を設定し、この小領域におけるR2 *の平均値と標準偏差を算出し、平均値+N×標準偏差の範囲を超える画素値をフェリチン沈着組織のR2 *として抽出する。次いで抽出したR2 *を差分R2 *分布から差し引き、脳実質の補正後R2 *分布とする。
なおこの処理は、フェリチン沈着が疑われる被検体に対してのみ行ってもよいし、省略することも可能である。また組織分離画像算出S1102において、静脈のR2
*分布を抽出する際に、第一実施形態と同様に、直線構造要素の角度を三次元的に変えた多重直線構造要素によるトップハット変換により粒状成分を分離し、粒状成分のR2
*分布を算出した場合には、この粒状成分のR2
*分布を元のR2
*分布から差し引くことで、上述したフェリチン沈着組織を除去することができる。
以降の酸素摂取率変換(S1103)や酸素摂取率分布推定(S1104)、部分体積効果補正(S1105)は第二実施形態と同様に実施する。
本実施形態によれば、酸素摂取率を求める対象である脳実質のR2
*分布を組織分離して、その組織分離画像から、酸素摂取率を算出するので、より直接な手法であり、精度よく、酸素摂取率を求めることができる。
<第三実施形態の変形例>
上記実施形態では、フェリチン沈着組織のR2 *として抽出した値を、組織分離画像算出ステップS1102で求めた差分R2 *分布から差し引き、脳実質のR2 *分布としたが、本変形例では、フェリチン沈着組織のR2 *として抽出したR2 *分布を用いて、バイナリマスクを作成し、これを以降の計算に用いる。
上記実施形態では、フェリチン沈着組織のR2 *として抽出した値を、組織分離画像算出ステップS1102で求めた差分R2 *分布から差し引き、脳実質のR2 *分布としたが、本変形例では、フェリチン沈着組織のR2 *として抽出したR2 *分布を用いて、バイナリマスクを作成し、これを以降の計算に用いる。
即ち、フェリチン沈着組織のR2
*をゼロ、それ以外を1とするバイナリマスクを作成する。次の酸素摂取率変換(S1103)は、マスクされない領域(マスク値が1の領域)のみについて酸素摂取率変換を行う。このマスクされない領域にのみ、酸素摂取率変換後の組織分離画像(酸素摂取率画像)を用いて酸素摂取率分布推定(S1104)すること、さらに部分体積効果補正を行ってもよいことは上記実施形態と同様である。
以上、本発明の各実施形態とその変形例を説明したが、これら実施形態では言及されない要素を追加した構成や必須ではない要素を削除した構成も本発明に包含される。また上記実施形態では、主としてMRI装置の計算機109の機能の実施形態を説明したが、計算機109の機能は、MRI装置で取得した画像データを無線、有線或いは可搬媒体等を介して取り込むことができる画像処理装置であれば、MRI装置から独立した画像処理装置でも実現することも可能であり、このような画像処理装置も本発明に包含される。
100:MRI装置、101:被検体、102:静磁場コイル、103:傾斜磁場コイル、104:シムコイル、105:送信コイル、106:受信コイル、107:送信機、108:受信機、109:計算機、110:ディスプレイ、111:外部記憶装置、112:傾斜磁場用電源部、113:シム用電源部、114:シーケンス制御装置、115:入力装置、120:MRI装置、130:MRI装置、310:計測制御部、320:画像再構成部、330:酸素摂取率分布算出部、331:物性値分布算出部(磁化率分布算出部、R2
*分布算出部)、332:組織分離部、333:酸素摂取率変換部、334:酸素摂取率分布推定部、335:部分体積効果補正部
Claims (13)
- 静磁場内に配置された被検体に高周波磁場パルスを送信する送信部、前記被検体が発生する核磁気共鳴信号を受信する受信部、及び、静磁場に傾斜磁場を与える傾斜磁場発生部を有する計測部と、
予め設定した撮像シーケンスに従い、前記計測部の動作を制御する計測制御部と、
前記受信した核磁気共鳴信号に演算を施す計算機と、を備えた磁気共鳴イメージング装置であって、
前記計算機は、
少なくとも1つのエコー時間で取得した核磁気共鳴信号からの複素画像を生成する画像再構成部と、
酸素量特性を反映した物性値を画素値とする物性値画像を算出する物性値分布算出部と、
対象領域の物性値画像を、少なくとも2種類以上の組織毎の物性値画像に分離し、組織分離画像を算出する組織分離部と、
前記組織分離画像の少なくとも1つについて、各画素の前記物性値を酸素量特性に変換する酸素量特性変換部と、
画素値を酸素量特性に変換した後の組織分離画像において、任意の画素の画素値とその周囲の画素の平均値が略等しいという条件に基づいて前記対象領域の酸素量特性分布を推定する酸素量特性分布推定部と、
を有することを特徴とする磁気共鳴イメージング装置。 - 請求項1記載の磁気共鳴イメージング装置であって、
前記物性値分布算出部は、前記複素画像の位相情報から磁化率分布を算出する磁化率分布算出部を有することを特徴とする磁気共鳴イメージング装置。 - 請求項1記載の磁気共鳴イメージング装置であって、
前記計測制御部は、少なくとも2つの異なるエコー時間で核磁気共鳴信号を取得する撮影シーケンスを用いて、前記計測部を制御し、
前記物性値分布算出部は、複数の異なるエコー時間で取得した前記複素画像の強度情報から見かけの横緩和速度(R2 *)分布を算出するR2 *分布算出部を有することを特徴とする磁気共鳴イメージング装置。 - 請求項1記載の磁気共鳴イメージング装置であって、
前記組織分離部は、静脈とそれ以外の組織に分離することを特徴とする磁気共鳴イメージング装置。 - 請求項1記載の磁気共鳴イメージング装置であって、
前記組織分離部は、脳実質とそれ以外の組織に分離することを特徴とする磁気共鳴イメージング装置。 - 請求項1記載の磁気共鳴イメージング装置であって、
前記酸素量特性分布推定部は、任意の組織の酸素量特性と脳全体の酸素量特性の平均値が略等しいという条件に基づいて部分体積効果を補正する部分体積効果補正部を有することを特徴とする磁気共鳴イメージング装置。 - 請求項4記載の磁気共鳴イメージング装置であって、
前記酸素量特性分布推定部は、
脳組織の酸素量特性の任意の画素の画素値とその周囲の画素の平均値が略等しいという条件と、
脳組織の酸素量特性の任意の画素の周囲の平均値と、静脈の酸素量特性の静脈の酸素量特性の任意の画素の周囲の平均値が略等しいという条件とに基づいて前記対象領域の酸素量特性分布を推定することを特徴とする磁気共鳴イメージング装置。 - 請求項1記載の磁気共鳴イメージング装置であって、
前記酸素量特性分布推定部が推定する前記酸素量特性は、酸素摂取率、酸素飽和度、酸素代謝率のいずれかを含むことを特徴とする磁気共鳴イメージング装置。 - 請求項1記載の磁気共鳴イメージング装置であって、
前記組織分離部は、元画像を粒状成分画像、血管成分画像及び平滑化画像に分離するモルフォロジーフィルタを用いて、任意の組織を分離することを特徴とする磁気共鳴イメージング装置。 - MRI装置を用いた撮影により取得した計測データを用いて、検査対象の酸素摂取率を算出する方法であって、
前記計測データを用いて前記検査対象の複素画像を画像再構成し、
前記複素画像を用いて磁化率分布を算出し、
前記磁化率分布を、複数の組織毎の磁化率分布に分離して、組織分離画像を得て、
前記組織分離画像の少なくとも一つについて、任意の画素の磁化率は、その画素を囲む所定サイズの領域の磁化率と等しいという推定のもとで、組織毎磁化率分布から検査対象の酸素摂取率を推定することを特徴とする酸素摂取率の算出方法。 - 請求項10に記載の方法であって、
前記組織分離画像から推定した酸素摂取率を、さらに、任意の組織の酸素摂取率と脳全体の酸素摂取率の平均値が略等しいという条件に基づいて部分体積効果補正することを特徴とする酸素摂取率の算出方法。 - MRI装置を用いた撮影により取得した計測データを用いて、検査対象の酸素摂取率を算出する方法であって、
前記計測データを用いて、エコー時間が異なる複数の複素画像を画像再構成し、
前記複数の複素画像を用いて見かけの横緩和速度R2 *分布または見かけの横緩和速度R2 *と横緩和速度R2との差の分布を算出し、
前記見かけの横緩和速度R2 *分布または前記差の分布を、複数の組織毎の組織分離画像に分離し、
組織分離画像の少なくとも一つについて、任意の画素の画素値は、その画素を囲む所定サイズの領域の画素値と等しいという推定のもとで、前記見かけの横緩和速度R2 *分布または前記差の分布から、前記検査対象の酸素摂取率を推定することを特徴とする酸素摂取率の算出方法。 - 請求項10又は12に記載の方法であって、
前記複数の組織は、脳静脈及び脳実質を含むことを特徴とする酸素摂取率の算出方法。
Priority Applications (1)
| Application Number | Priority Date | Filing Date | Title |
|---|---|---|---|
| US16/342,612 US10765349B2 (en) | 2016-11-07 | 2017-10-11 | Magnetic resonance imaging device and method for calculating oxygen extraction fractions |
Applications Claiming Priority (2)
| Application Number | Priority Date | Filing Date | Title |
|---|---|---|---|
| JP2016-217307 | 2016-11-07 | ||
| JP2016217307A JP6679467B2 (ja) | 2016-11-07 | 2016-11-07 | 磁気共鳴イメージング装置および酸素摂取率算出方法 |
Publications (1)
| Publication Number | Publication Date |
|---|---|
| WO2018083952A1 true WO2018083952A1 (ja) | 2018-05-11 |
Family
ID=62076118
Family Applications (1)
| Application Number | Title | Priority Date | Filing Date |
|---|---|---|---|
| PCT/JP2017/036826 WO2018083952A1 (ja) | 2016-11-07 | 2017-10-11 | 磁気共鳴イメージング装置および酸素摂取率算出方法 |
Country Status (3)
| Country | Link |
|---|---|
| US (1) | US10765349B2 (ja) |
| JP (1) | JP6679467B2 (ja) |
| WO (1) | WO2018083952A1 (ja) |
Cited By (1)
| Publication number | Priority date | Publication date | Assignee | Title |
|---|---|---|---|---|
| US11013452B1 (en) * | 2020-03-03 | 2021-05-25 | Heuron Co., Ltd. | Artificial intelligence (AI) based parkinson's disease diagnosing apparatus and method |
Families Citing this family (9)
| Publication number | Priority date | Publication date | Assignee | Title |
|---|---|---|---|---|
| US10890641B2 (en) * | 2017-04-07 | 2021-01-12 | Cornell University | System and method of robust quantitative susceptibility mapping |
| EP3301649B1 (en) * | 2017-09-07 | 2019-10-30 | Siemens Healthcare GmbH | Method for processing medical image data and image processing system for medical image data |
| KR20190065941A (ko) * | 2017-12-04 | 2019-06-12 | 신에쓰 가가꾸 고교 가부시끼가이샤 | 탄화탄탈 피복 탄소 재료 및 그 제조 방법, 반도체 단결정 제조 장치용 부재 |
| CN108829639B (zh) * | 2018-07-06 | 2023-10-27 | 上海联影医疗科技股份有限公司 | 一种磁共振成像方法和设备 |
| JP7280997B2 (ja) * | 2018-08-29 | 2023-05-24 | 富士フイルムヘルスケア株式会社 | 画像処理装置及び磁気共鳴イメージング装置 |
| JP7140606B2 (ja) * | 2018-08-29 | 2022-09-21 | 富士フイルムヘルスケア株式会社 | 画像処理装置、画像処理方法、画像処理プログラム及び磁気共鳴イメージング装置 |
| CN111096748B (zh) * | 2019-12-19 | 2023-06-02 | 首都医科大学宣武医院 | 一种动态测量脑氧代谢率的方法 |
| CN113571188A (zh) * | 2021-08-02 | 2021-10-29 | 首都医科大学宣武医院 | 一种氧摄取分数的计算方法 |
| CN115530820B (zh) * | 2022-11-30 | 2023-01-31 | 脑玺(苏州)智能科技有限公司 | 一种氧摄取分数测量方法、装置、设备及存储介质 |
Citations (1)
| Publication number | Priority date | Publication date | Assignee | Title |
|---|---|---|---|---|
| JP2015062637A (ja) * | 2013-09-26 | 2015-04-09 | 株式会社日立メディコ | 磁気共鳴イメージング装置、画像処理装置および磁化率画像算出方法 |
Family Cites Families (4)
| Publication number | Priority date | Publication date | Assignee | Title |
|---|---|---|---|---|
| WO2007149971A2 (en) * | 2006-06-22 | 2007-12-27 | General Hospital Corporation | Cancer detection by optical measurement of compression-induced transients |
| US8958866B2 (en) * | 2008-03-31 | 2015-02-17 | The General Hospital Corporation | System and method to analyze blood parameters using magnetic resonance imaging |
| WO2013054718A1 (ja) * | 2011-10-12 | 2013-04-18 | 株式会社日立製作所 | 磁気共鳴イメージング装置および磁化率強調画像生成方法 |
| JP6533571B2 (ja) * | 2015-04-15 | 2019-06-19 | 株式会社日立製作所 | 磁気共鳴イメージング装置及び画像作成方法 |
-
2016
- 2016-11-07 JP JP2016217307A patent/JP6679467B2/ja active Active
-
2017
- 2017-10-11 US US16/342,612 patent/US10765349B2/en active Active
- 2017-10-11 WO PCT/JP2017/036826 patent/WO2018083952A1/ja active Application Filing
Patent Citations (1)
| Publication number | Priority date | Publication date | Assignee | Title |
|---|---|---|---|---|
| JP2015062637A (ja) * | 2013-09-26 | 2015-04-09 | 株式会社日立メディコ | 磁気共鳴イメージング装置、画像処理装置および磁化率画像算出方法 |
Non-Patent Citations (4)
| Title |
|---|
| BOLAR, D. S. ET AL.: "Imagine of Oxygenation", PROC. INTL. SOC. MAG. RESON. MED. 23 (ISMRM15), 2015, pages 1 - 11, XP055503301, Retrieved from the Internet <URL:https://www.mr.ethz.ch/intern/ISMRM/ISMRM15/PDFfiles/ISMRM2015-008327.pdf> * |
| DIMOV, A. ET AL.: "Estimation of Blood Oxygenation using Quantitative Susceptibility Mapping, ISMRM, 23", INSTITUTE OF NAVIGATION, 2015 * |
| MCDANIEL, P. ET AL.: "Improved Accuracy in Susceptibility-based OEF Measurements by Mitigation of Partial-Volume Effects via Combined Magnitude and Phase Reconstruction", PROC. INTL. SOC. MAG. RESON. MED. 23 (ISMRM 23RD), 2015 * |
| ZHANG, J. ET AL.: "High Resolution Cerebral Metabolic Rate of Oxygen [CMRO2] using Quantitative Susceptibility Mapping (QSM) and an Oxygen Extractioi Fraction (OEF) Constraint", PROC. INTL. SOC. MAG. RESON. MED. 23 (ISMRM15), 2015 * |
Cited By (1)
| Publication number | Priority date | Publication date | Assignee | Title |
|---|---|---|---|---|
| US11013452B1 (en) * | 2020-03-03 | 2021-05-25 | Heuron Co., Ltd. | Artificial intelligence (AI) based parkinson's disease diagnosing apparatus and method |
Also Published As
| Publication number | Publication date |
|---|---|
| US10765349B2 (en) | 2020-09-08 |
| JP2018075075A (ja) | 2018-05-17 |
| JP6679467B2 (ja) | 2020-04-15 |
| US20190261906A1 (en) | 2019-08-29 |
Similar Documents
| Publication | Publication Date | Title |
|---|---|---|
| JP6679467B2 (ja) | 磁気共鳴イメージング装置および酸素摂取率算出方法 | |
| EP2145200B1 (en) | Diffusion tensor imaging of moving objects | |
| Haneder et al. | Quantitative and qualitative 23Na MR imaging of the human kidneys at 3 T: before and after a water load | |
| JP6289664B2 (ja) | 磁気共鳴イメージング装置、定量的磁化率マッピング方法、計算機、磁化率分布計算方法、及び、磁化率分布計算プログラム | |
| US8958866B2 (en) | System and method to analyze blood parameters using magnetic resonance imaging | |
| US20160313428A1 (en) | Methods and devices for optimization of contrast inhomogeneity correction in magnetic resonance imaging | |
| Bammer et al. | Foundations of advanced magnetic resonance imaging | |
| US10379189B2 (en) | Simultaneous magnetic resonance angiography and perfusion with nuclear magnetic resonance fingerprinting | |
| JP6533571B2 (ja) | 磁気共鳴イメージング装置及び画像作成方法 | |
| JP6595393B2 (ja) | 磁気共鳴イメージング装置、及び、画像処理方法 | |
| US11047942B2 (en) | Magnetic resonance imaging method and system with optimal variable flip angles | |
| JP2018075075A5 (ja) | ||
| JP6568760B2 (ja) | 磁気共鳴イメージング装置、および、画像処理装置 | |
| Kathiravan et al. | A review of magnetic resonance imaging techniques | |
| EP3956674A1 (en) | System and method for free-breathing quantitative multiparametric mri | |
| US20200281500A1 (en) | Systems and Methods for Detecting Small Physiological or Pathological Changes Using High Resolution Magnetic Resonance Imaging | |
| CN116888489A (zh) | 分析医学图像的方法 | |
| US11406277B2 (en) | Methods for determining contrast agent concentration using magnetic resonance imaging | |
| WO2019049443A1 (ja) | 磁気共鳴イメージング装置 | |
| Adlung | Efficient Quantification of In-Vivo 23Na Magnetic Resonance Imaging | |
| Nissan | Development and Applications in Breast and Pancreatic MRI: Tools for Investigating Structural and Physiological Features of Neoplastic Tissue | |
| Magharehabed | Analyzing the effects of GRAPPA-based acceleration on MREPT conductivity images acquired with multi spin multi echo pulse sequence | |
| CN115698741A (zh) | 用于快速采集和重建覆盖体积的磁共振图像序列的方法和设备 | |
| Nissan | Development and Applications in Breast and Pancreatic MRI | |
| Han | A New Paradigm of Cardiovascular Magnetic Resonance Imaging for Pediatric Patients with Congenital Heart Disease |
Legal Events
| Date | Code | Title | Description |
|---|---|---|---|
| 121 | Ep: the epo has been informed by wipo that ep was designated in this application |
Ref document number: 17866626 Country of ref document: EP Kind code of ref document: A1 |
|
| NENP | Non-entry into the national phase |
Ref country code: DE |
|
| 122 | Ep: pct application non-entry in european phase |
Ref document number: 17866626 Country of ref document: EP Kind code of ref document: A1 |