WO2018016492A1 - 計数方法および放射線検出装置 - Google Patents
計数方法および放射線検出装置 Download PDFInfo
- Publication number
- WO2018016492A1 WO2018016492A1 PCT/JP2017/025982 JP2017025982W WO2018016492A1 WO 2018016492 A1 WO2018016492 A1 WO 2018016492A1 JP 2017025982 W JP2017025982 W JP 2017025982W WO 2018016492 A1 WO2018016492 A1 WO 2018016492A1
- Authority
- WO
- WIPO (PCT)
- Prior art keywords
- counting
- peak
- discrimination threshold
- pulse height
- value
- Prior art date
- Legal status (The legal status is an assumption and is not a legal conclusion. Google has not performed a legal analysis and makes no representation as to the accuracy of the status listed.)
- Ceased
Links
Images





Classifications
-
- A—HUMAN NECESSITIES
- A61—MEDICAL OR VETERINARY SCIENCE; HYGIENE
- A61N—ELECTROTHERAPY; MAGNETOTHERAPY; RADIATION THERAPY; ULTRASOUND THERAPY
- A61N5/00—Radiation therapy
- A61N5/10—X-ray therapy; Gamma-ray therapy; Particle-irradiation therapy
-
- G—PHYSICS
- G01—MEASURING; TESTING
- G01T—MEASUREMENT OF NUCLEAR OR X-RADIATION
- G01T1/00—Measuring X-radiation, gamma radiation, corpuscular radiation, or cosmic radiation
- G01T1/16—Measuring radiation intensity
- G01T1/17—Circuit arrangements not adapted to a particular type of detector
-
- G—PHYSICS
- G01—MEASURING; TESTING
- G01T—MEASUREMENT OF NUCLEAR OR X-RADIATION
- G01T1/00—Measuring X-radiation, gamma radiation, corpuscular radiation, or cosmic radiation
- G01T1/16—Measuring radiation intensity
- G01T1/20—Measuring radiation intensity with scintillation detectors
-
- G—PHYSICS
- G01—MEASURING; TESTING
- G01T—MEASUREMENT OF NUCLEAR OR X-RADIATION
- G01T1/00—Measuring X-radiation, gamma radiation, corpuscular radiation, or cosmic radiation
- G01T1/16—Measuring radiation intensity
- G01T1/20—Measuring radiation intensity with scintillation detectors
- G01T1/202—Measuring radiation intensity with scintillation detectors the detector being a crystal
-
- G—PHYSICS
- G01—MEASURING; TESTING
- G01T—MEASUREMENT OF NUCLEAR OR X-RADIATION
- G01T3/00—Measuring neutron radiation
- G01T3/06—Measuring neutron radiation with scintillation detectors
Definitions
- a radiation detection device that combines a radiation detection element such as a scintillator or a semiconductor with a pulse height discrimination circuit, a pulse signal corresponding to the energy of the radiation detected by the radiation detection element is obtained, the peak value is read, and the peak value is a peak detection threshold value.
- a method for obtaining a dose rate by counting pulse signals exceeding the range is widely used.
- Patent Documents 2 and 3 disclose a method in which pulses are digitized by an AD converter, a plurality of piled-up pulses are separated and counted, and a change in peak value due to baseline fluctuation is corrected. .
- a plurality of piled-up pulses cannot be separated, and there is a case where counting loss occurs.
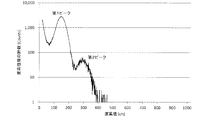
- the wave height distribution spectrum when there is a radiation detection event in which two pulses (two radiation detection events) are processed as one pulse (one radiation detection event) is, for example, as shown in FIG.
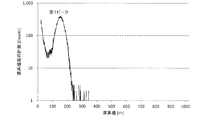
- a second peak is observed at a peak value that is approximately twice as high. Note that the second peak is not observed in the wave height distribution spectrum in the absence of pileup as shown in FIG.
- the third peak may be observed at a peak value that is about three times the first peak.
- One is to devise a circuit configuration so that the pulse decay time is shortened (for example, using an amplifier having a short time constant or using a differentiating circuit).
- the present inventors have intensively studied and found that the method of completely different from the above approach, that is, optimization of the pulse height discrimination threshold, can suppress a decrease in counting accuracy due to pileup, and completed the present invention. It came to do.
- the present invention by a simple method of optimizing the pulse height discrimination threshold, it is possible to suppress a decrease in counting accuracy due to pileup, and accurately count radiation over a wide range from a low radiation counting rate to a high situation. Is possible.
- the circuit can be simplified and the analysis time can be shortened.
- Wave height distribution spectrum (medium count rate condition) obtained when accelerator neutrons were counted by a neutron detector using Eu: LiCaAlF 6 crystal.
- Wave height distribution spectrum (low count rate condition) obtained when accelerator neutrons were counted by a neutron detector using Eu: LiCaAlF 6 crystal.
- Wave height distribution spectrum (high count rate condition) obtained when accelerator neutrons were counted by a neutron detector using Eu: LiCaAlF 6 crystal.
- the schematic of the neutron detector used in the Example The time series graph of the neutron count rate and accelerator electric current value which were obtained in Example 1.
- FIG. The graph which shows the relationship between the accelerator electric current value in Example 1, and a neutron count rate.
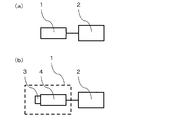
- FIG. 4 shows a schematic diagram of a radiation detection apparatus which is an example of an apparatus for carrying out the present invention.
- a radiation detection apparatus is provided with the radiation detection element 1 and the wave height discrimination circuit 2 which output a pulse-shaped electric signal by incidence
- a medium that does not directly output an electrical signal and emits light upon incidence of radiation such as a scintillator
- the light emitted from the scintillator 3 and the scintillator 3 is converted into an electrical signal as shown in FIG.
- the radiation detection element 1 can be obtained by combining with the photodetector 4 to be used.
- the pulse height discriminating circuit 2 only needs to be able to analyze the peak value of the pulse output from the radiation detection element 1 and to count pulses exceeding the pulse height discrimination threshold.
- the present invention can be applied to both reading by digital data processing.
- the pulse generated when the radiation detection element 1 detects radiation is amplified and amplified along the time axis by the analog amplifier, and the amplified pulse signal is fixed to a certain level by the AD converter. It is converted into digital data at a sampling interval, and the digital data is read by a digital data processor.
- a wave height distribution spectrum, a count value exceeding the wave height discrimination threshold, and the like are displayed on a display device including a computer, software, a display monitor, and the like.
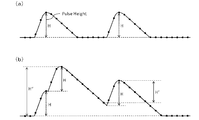
- FIG. 5 is a signal waveform diagram of a pulse amplified by an analog amplifier for conceptually explaining the influence of pileup. Each point in the diagram is a digital signal at a constant time interval on the analog signal indicated by a solid line. The discrete values obtained in the case of the conversion are shown.
- Fig. 5 (a) shows a case where pile-up is not performed.
- the digital data processing apparatus counts as “the event corresponding to the pulse height (Pulse Height) H is twice”.
- FIG. 5B shows a case where pileup is performed. Originally, it should be counted as “three events corresponding to the peak value H”, but another radiation is incident immediately after the first pulse, and the second pulse rises. Since the signal value continues to rise, the first pulse and the second pulse are not recognized separately, and an event corresponding to “H” ( ⁇ 2H) is counted once. That is, the signal that should be counted twice is counted only once. This phenomenon is called counting loss.
- the third pulse rises before the pulse in which the first pulse and the second pulse pile up returns to the baseline. That is, the third pulse rises after the analog signal takes the minimum value. Since the peak value is calculated based on the discrete value immediately before the minimum value, the third pulse is counted as “one event corresponding to H ′ ( ⁇ H)” due to the apparent shift of the baseline. Is done. This phenomenon is called the reduction of the peak value.
- the problem to be solved by the present invention is the counting loss that occurs for the first and second pulses. In the following description, for the sake of convenience, the case where the first pulse and the second pulse are superimposed as shown in FIG. Thus, those that can be counted separately from the previous pulse are treated as not piled up.
- the wave height distribution spectra respectively shown in the case where the pile-up is not performed and the case where the pile-up is performed are represented by the Gauss of the following formula (1).
- Approximation using function The maximum count N in the Gaussian function of Expression (1) is a count indicated by the average peak value ⁇ . ⁇ indicates an arbitrary peak value, and ⁇ is a standard deviation.
- FIG. 6 illustrates a method for approximating the wave height distribution spectrum.
- the counts are added for each peak value to form one peak distribution spectrum. In the spectrum actually measured, such as the wave height distribution spectrum in FIGS.
- FIG. 7 shows the wave height distribution spectrum generated by the above-mentioned method with the pile-up rate being 0%, 10%, 20%, and 30%.
- the wave height distribution spectrum with a pile-up rate of 0% is data having only the first peak.
- the total count of each wave height distribution spectrum from 0 to 1023ch is made to coincide if the count of the second peak is doubled and the count of the third peak is tripled.
- the pile-up rate is a rate at which pulses cannot be overlapped and separated. Specifically, when two of the 100 pulses are overlapped and processed as one signal, the pile-up rate is 2%.
- the pile-up rate is 30%. That is, the ratio of pulses included in a signal on which pulses are superimposed is called a pile-up rate.
- the pulse height discrimination threshold (Threshold) was set to ⁇ + X ⁇ , and a count equal to or higher than the pulse height discrimination threshold when X was changed in the range of ⁇ 3 to +3 was obtained from the pulse height distribution spectrum. The result is shown in FIG. Further, from the results shown in FIG. 8, count errors of 10%, 20%, and 30% of pileup rates with respect to the count exceeding the pulse height discrimination threshold when the pileup is 0% were obtained.
- FIG. 10 also shows the simulation value of the counting error when the pile-up rate is 25%.
- the counting method of the present invention is characterized in that the counting error is reduced by setting a pulse height discrimination threshold in the vicinity of ⁇ of the first peak.
- the counting error due to pileup is calculated. Does not occur.
- the total count of the first peak not piled up is N s
- the total count of the second peak piled up by two pulses is N d
- the total count of the third peak piled up by three pulses is N t
- the number of radiation detected by the radiation detection element is N s + 2N d + 3N t .
- T 1 capable of counting all events is set as the pulse height discrimination threshold
- the count exceeding the threshold obtained is N s + N d + N t
- a negative error of N d + 2N t is compared with the theoretical value N s + 2N d + 3N t. It will occur.
- a count equal to or greater than the threshold obtained when ⁇ of the first peak is the pulse height discrimination threshold (T 2 ) is 1 ⁇ 2 N s + N d + N t .
- a minus error of 1 ⁇ 2N t occurs, but the error can be made much smaller than when the threshold is set to T 1 .
- the counting method of the present invention that reduces the counting error due to pileup by setting a pulse height discrimination threshold close to ⁇ is based on the theory described above, and the simulation results shown in FIG. It shows the validity of the invention.
- a method for setting a pulse height discrimination threshold and counting the frequency of signals exceeding the pulse height discrimination threshold wherein when the target component of the count shows a peak in the pulse height distribution spectrum, a Gaussian function is used for the peak.
- a Gaussian function is used for the peak.
- an arbitrary value selected from the range of ( ⁇ 0.4 ⁇ ) to ( ⁇ + 0.6 ⁇ ) is used as the pulse height discrimination threshold.
- the method for setting the pulse height discrimination threshold is not limited to the fitting of a Gaussian function.
- the pulse height discrimination threshold value at the time of signal processing in the discrimination circuit may be in the above range, and even a threshold value set by another method is included in the scope of the present invention if it is in the above range.
- the target component for counting is an event to be counted, and is not particularly limited.
- a neutron detector that can provide a neutron dose rate, an accumulated dose, and the like
- a neutron incident event is a target component for counting.
- radiation such as X-rays, ⁇ -rays, ⁇ -rays, and neutrons
- a radiation detection device that detects two or more types of radiation may be used, and in that case, the pulse height discrimination threshold of the present invention is applied. Any one type of radiation to be detected may be used, or two or more types of radiation may be used.
- the shape of the wave height distribution peak is not particularly limited, and the effect of the present invention can be obtained without any problem as long as the shape follows a Gaussian distribution.
- the ⁇ obtained by fitting a Gaussian function by the method described below matches the peak value indicating the maximum count (hereinafter, the peak value is represented by P) at the peak indicated by the target component of the count in the peak distribution spectrum. It is statistically natural that the higher the counting accuracy can be expected, the more accurate counting is possible as long as the values agree within a range of 0.9 ⁇ ⁇ P ⁇ 1.1 ⁇ m.
- processing such as baseline correction, peak separation, and smoothing may be performed on the wave height distribution spectrum in advance.
- ⁇ and ⁇ are fitted to the Gaussian function of Equation (1) for the first peak that is not piled up among the peak distribution peaks indicated by the target component of the count. And is irrelevant to the values obtained for the second peak piled up by two pulses and the third peak piled up by three pulses.
- the ⁇ and ⁇ described below are ⁇ and ⁇ obtained for the first peak.
- the first peak is generally also the peak with the largest count.
- the counting method of the present invention can be applied by setting conditions so that the shape of the first peak approximates a Gaussian function by means such as reducing detection sensitivity or shortening the pulse decay time.
- the data range of the wave height distribution spectrum used when fitting the Gaussian function is preferably 0.75 P to 1.25 P with reference to the wave height value P indicating the maximum count at the peak indicated by the target component of the wave height distribution spectrum. is there.
- the noise count by a component different from the target component of the count affects the analysis values of ⁇ and ⁇
- the lower limit value and / or the upper limit value may be narrowed.
- the data range used when fitting the Gaussian function may be expanded.
- the data range of the pulse height distribution spectrum used when fitting a Gaussian function may be set to 0.75P to 3P.
- the count of the second peak becomes noise when performing fitting, but the count of the second peak that appears due to pileup is sufficiently smaller than the count of the first peak.
- the influence of the noise on the analysis values of ⁇ and ⁇ is limited. Note that the least square method is preferably used for fitting the Gaussian function, and it is more preferable to fit the maximum count N together with ⁇ and ⁇ .
- the essence of the counting method of the present invention is to reduce the counting error due to pileup by setting the wave height discrimination threshold in the vicinity of ⁇ . Then, the method of setting an arbitrary value selected from the range of ( ⁇ 0.4 ⁇ ) to ( ⁇ + 0.6 ⁇ ) obtained by fitting the above-described Gaussian function as the above-described pulse height discrimination threshold is appropriately set in the vicinity of ⁇ . An index for setting the discrimination threshold is given.
- the pulse height discrimination threshold can be determined also by the method described below.
- any wave height discrimination threshold determined by the method described below is included in the range of ( ⁇ 0.4 ⁇ ) to ( ⁇ + 0.6 ⁇ ) obtained from the fitting by fitting a Gaussian function.
- the first determination method of the pulse height discrimination threshold that does not require analysis by the method of fitting a Gaussian function is the highest in the count n obtained by the following equation (2) for the peak distribution peak indicating the maximum count N ′ at the peak value P.
- a peak value indicating a close count is used as a peak discrimination threshold.
- the peak height discrimination threshold is set to P or more, an arbitrary value selected from the range of 0.0 to 0.6 is set as X, and the formula (2)
- the peak value equal to or higher than P indicating the closest count to the count n obtained by the above may be used as the pulse height discrimination threshold.
- the second determination method of the pulse height discrimination threshold that does not require analysis by a method of fitting a Gaussian function is a method of determining the pulse height discrimination threshold based on the half-value width FWHM instead of the standard deviation ⁇ .
- ⁇ and the crest value P are the same, and the relationship of the following formula (3) exists between the standard deviation ⁇ and the half-value width FWHM.
- the pulse height discrimination threshold according to the present invention can be determined.
- a third method for determining a pulse height discrimination threshold that does not require analysis by Gaussian fitting is to determine a wave height value P indicating the maximum count of wave height distribution peaks from the shape of the wave height distribution spectrum, and to determine a wave height value near the wave height value P. This is a method for setting a pulse height discrimination threshold.
- the threshold value T B for preventing the loss of counts of the second peak and the third peak is preferably not less than 3.mu., more preferably not less than 5 [mu].
- a pulse height discrimination threshold for counting the first target component may be set, and a pulse height discrimination threshold for counting the second target component may be set separately.
- the present invention by setting an arbitrary value selected from the range of ( ⁇ 0.4 ⁇ ) to ( ⁇ + 0.6 ⁇ ) as the pulse height discrimination threshold, it is possible to suppress a decrease in counting accuracy due to pileup.
- the measured value of the counting error due to pileup shown in FIG. 10 when counting pulse signals that exceed the pulse height discrimination threshold, the counting error caused by pileup can be suppressed to about ⁇ 10% or less. With such counting errors, highly accurate measurement can be realized in most applications.
- the more preferable pulse height discrimination threshold is an arbitrary value selected from the range of ( ⁇ + 0.0 ⁇ ) to ( ⁇ + 0.5 ⁇ ), and the more preferable pulse height discrimination threshold is selected from the range of ( ⁇ + 0.2 ⁇ ) to ( ⁇ + 0.4 ⁇ ). It is an arbitrary value and can be suppressed to a count error of about ⁇ 5% and ⁇ 3%, respectively.
- the counting method of the present invention can be suitably used in a radiation detection apparatus in which the scintillator 3, the photodetector 4, and the wave height discrimination circuit 2 are combined.
- the present invention is a radiation detection apparatus using a combination of a scintillator 3, a photodetector 4, and a wave height discrimination circuit 2, wherein the wave height discrimination circuit 2 includes an amplifier that amplifies the signal of the photodetector 4, and the amplifier
- a wave height discrimination circuit comprising: an AD converter that converts an analog signal output into a digital signal; and a digital data processing device that performs signal processing on the digital signal output of the AD converter, wherein the wave height discrimination circuit uses the counting method.
- a radiation detection apparatus for signal processing is provided.
- the wave height discriminating circuit 2 As the wave height discriminating circuit 2, as described in Patent Document 2 and Patent Document 3, an amplifier that amplifies the signal of the photodetector, an AD converter that converts an analog signal output of the amplifier into a digital signal, and And a digital data processing device that performs signal processing on the digital signal output of the AD converter.
- the pulse height discriminating circuit that reads pulse signals by digital data processing is used, the circuit configuration for reducing the peak value due to the pile-up is less expensive than the pulse height discriminating circuit that reads pulse signals by analog data processing.
- the digital data processing device creates a wave height distribution spectrum at a predetermined time interval, fits a Gaussian function to a peak indicated by a target component of counting in the created wave height distribution spectrum, and obtains ⁇ and ⁇ It is preferable to implement a function for sequentially setting a pulse height discrimination threshold with reference to. By implementing such a function, the peak discrimination threshold can be automatically updated following the reduction of the peak value by the pile-up, and an increase in counting error due to the reduction of the peak value can be prevented.
- a function for fitting a Gaussian function and a function for sequentially setting a pulse height discrimination threshold are not implemented, and a pulse height discrimination threshold according to the present invention is not implemented. May be analyzed in advance and counted based on the pulse height discrimination threshold from the start to the end of counting.
- a preamplifier preamplifier
- a waveform shaping amplifier shaping amplifier
- a circuit configuration in which a differential circuit is combined may be used.
- the circuit configurations described in Patent Document 6 and Patent Document 7 are also suitable.
- the scintillator 3 is composed of LiCaAlF 6 crystal, LiSrAlF 6 crystal, LiF / CaF 2 eutectic, LiF / SaF 2 eutectic, NaI crystal, Bi 4 Ge 3 O 12 crystal containing an activator such as Eu, Ce, Tl, and Na.
- Inorganic scintillators such as Gd 3 Al 2 Ga 3 O 12 crystal and CeF 3 crystal, organic scintillators composed of organic phosphors such as anthracene, stilbene and diphenyloxazole, polystyrene containing the organic phosphor, polyvinyl toluene, Plastic scintillators such as polyethylene terephthalate, liquid scintillators such as toluene and xylene containing the organic phosphor, and gas scintillators such as helium, argon, xenon, and krypton can be used without any limitation depending on the application. .
- organic scintillators composed of organic phosphors such as anthracene, stilbene and diphenyloxazole, polystyrene containing the organic phosphor, polyvinyl toluene, Plastic scintillators such as polyethylene terephthalate, liquid scintillators such as toluene and xylene
- the scintillator 3 is a LiCa x Sr 1-x AlF 6 crystal (x is 0 to 1).
- LiCaAlF 6 crystals and LiSrAlF 6 crystals containing additives such as Eu and Ce as activators can be suitably used.
- These scintillator crystals are neutron scintillators, and Li-6 contained in the scintillator crystals reacts with neutrons to generate ⁇ rays and tritium, and the ⁇ rays and tritium give 4.8 MeV energy to the scintillator crystals. Then, light corresponding to the applied energy is emitted by the activator contained in the scintillator crystal.
- the LiCa x Sr 1-x AlF 6 crystal containing Eu as an activator such as the Eu: LiCaAlF 6 crystal used in the examples of the present invention, has a particularly high light emission amount and can measure a high signal / noise ratio. It can use suitably for this invention.
- the LiCa x Sr 1-x AlF 6 crystal containing Eu as an activator has a fluorescence lifetime of 1.6 ⁇ sec, and in a general scintillator material, it has a long fluorescence lifetime, so that pileup is likely to occur. By applying the counting method of the present invention, it is possible to accurately count even if pileup occurs.
- the neutron sensitivity of a neutron scintillator containing Li-6 can be adjusted by adjusting the scintillator size and the Li-6 isotope ratio.
- Li-6, Li-7, which is a stable isotope of Li is adjusted in the ratio of Li-6, natural ratio, Li-7, and Li-6.
- the means for propagating the light of the scintillator 3 to the photodetector 4 is not particularly limited, and the scintillator 3 and the photodetector 4 may be directly connected as shown in FIG. As shown in FIG. 12, it may be indirectly connected using a light guide such as the optical fiber 5.
- the scintillator 3 and the light detector 4 are directly connected, the light detector 4 is exposed to the radiation field together with the scintillator 3, so that noise observed when radiation is incident on the light detector 4. There is a possibility that the counting accuracy is lowered due to the influence, or the photodetector 4 is broken.
- the scintillator 3 when counting radiation in a high dose rate environment, the scintillator 3 is installed in the high dose rate environment to be counted, and the photodetector 4 is installed far away with a sufficiently low dose rate. It is preferable to indirectly connect the scintillator 3 and the photodetector 4 using a light guide such as an optical fiber 5.
- the reflective material is not particularly limited, but white materials such as tetrafluoroethylene, polyethylene, titanium oxide, and barium sulfate are preferable.
- the optical fiber 5 can be made of quartz fiber, plastic fiber or the like, and preferably has a large numerical aperture (NA) and a small transmission loss. Specifically, NA of 0.45 or more and transmission loss of 200 dB / km or less are preferable. If a sufficient amount of light can be propagated to the photodetector 4 by using one having a large NA and a small transmission loss, a Gaussian distribution with an accuracy of 0.95 ⁇ ⁇ P ⁇ 1.05 ⁇ depending on the event of detecting a neutron. Is particularly preferred since a peak corresponding to
- a counting method is as follows.
- a pulse height distribution spectrum obtained by plotting a pulse signal derived from radiation or electromagnetic waves based on the peak value and the count for each peak value, when there are a plurality of peaks, a pulse height discrimination threshold is set, A method for counting the frequency of a signal exceeding a pulse height discrimination threshold, Among the plurality of peaks, when the average peak value that can be obtained by approximating the maximum peak to a Gaussian function is ⁇ and the standard deviation is ⁇ , A counting method in which the pulse height discrimination threshold is in the range of ( ⁇ 0.4 ⁇ ) to ( ⁇ + 0.6 ⁇ ).
- Example 1 a neutron detection device in which the neutron scintillator 3, the photodetector 4, and the wave height discrimination circuit 2 were combined was manufactured as follows.
- the manufactured neutron detector is shown schematically in FIG.
- Eu LiCaAlF 6 crystal produced using a Li raw material having a Li-6 isotope ratio concentrated to 95% was used.
- Epoxy adhesive to Eu LiCaAlF 6 crystal processed to 0.6 mm x 0.6 mm x 0.6 mm to the tip of the optical fiber 5 made of quartz having a core diameter of 1 mm and a length of 10 m (with the reverse end as the back end) was optically bonded.
- the optical fiber 5 has an NA of 0.48 and a transmission loss of 100 dB / km at an emission wavelength (370 nm) of Eu: LiCaAlF 6 crystal.
- the optical bonding surfaces of the scintillator 3 made of Eu: LiCaAlF 6 crystal and the optical fiber 5 were each subjected to optical polishing. Furthermore, the scintillator 3 made of Eu: LiCaAlF 6 crystal is covered with a reflector made of barium sulfate to improve the light collection efficiency to the optical fiber, and the optical fiber 5 is covered with a light shielding material so that room light does not enter. I made it.
- the pulse height discriminating circuit 2 includes an amplifier that amplifies the signal of the photodetector, an AD converter that converts an analog signal output of the amplifier into a digital signal, a digital data processing device that processes the digital signal output of the AD converter, And a display device that displays a result of digital data processing.
- the display device used was a computer, software, and monitor.
- the monitor can display the wave height distribution spectrum and the count value of pulses exceeding the wave height discrimination threshold.
- the digital data processing device creates a wave height distribution spectrum every 10 seconds, fits a Gaussian function to the peak indicated by the target component of the count in the created wave height distribution spectrum, and uses the obtained ⁇ and ⁇ as references.
- the peak height distribution peak gradually shifts to the low peak value side, and in the situation where the pile-up frequency is the highest, ⁇ is smaller than the situation where the pile-up frequency is the lowest.
- the wave height discrimination threshold is automatically updated according to the peak position at that time, so the count loss due to the decrease in the wave height value was slight.
- Neutrons were generated by an electrostatic accelerator, and the neutrons were detected by a neutron detector.
- the detected pulses of neutrons were analyzed, and pulses exceeding the pulse height discrimination threshold were counted every second to obtain a neutron count rate [cps] per unit time.
- the pulse height discrimination threshold in Example 1 was ( ⁇ + 0.3 ⁇ ).
- the neutron dose rate [n / cm 2 / sec] can be obtained by multiplying the obtained neutron count rate [cps] by a coefficient for conversion to a neutron dose rate.
- the neutron dose rate of the environment in which the detection element was arranged at the maximum output of the accelerator was about 1 ⁇ 10 8 n / cm 2 / sec.
- FIG. 13 shows the change over time in the count rate [cps] obtained in Example 1 (left vertical axis).
- FIG. 13 also shows the current value [ ⁇ A] of the accelerator (right vertical axis), and the current value represents the history of the accelerator output in the first embodiment.
- the right vertical scale in FIG. 13 is adjusted so that the accelerator current value overlaps the neutron count rate on the graph for the neutron count rate of the portion showing 6 kcps or less.
- FIG. 15 and 16 show the results of analyzing the neutron count rate and the accelerator current value obtained in Comparative Example 1 by the same method as in Example 1.
- FIG. 15 in the part where the neutron count rate exceeds 40 kcps, the neutron count rate is significantly lower than the accelerator current value. This shows the result of counting loss caused by pileup.
- the difference between the neutron count rate and the regression line at each accelerator current value is as shown in Table 1 and produced a counting error exceeding -10%.
- FIGS. 17 Results of analyzing the neutron count rate and accelerator current value obtained in Comparative Example 2 by the same method as in Example 1 are shown in FIGS.
- FIG. 17 in the part where the neutron count rate exceeds 15 kcps, the neutron count rate is remarkably higher than the accelerator current value. This is affected by the increase in the counts of the second peak and the third peak due to pileup. The results are shown.
- the difference between the neutron count rate and the regression line at each accelerator current value is as shown in Table 1 and caused a counting error exceeding + 10%.
- Radiodetector 5 Optical fiber
Landscapes
- Health & Medical Sciences (AREA)
- Life Sciences & Earth Sciences (AREA)
- Molecular Biology (AREA)
- Spectroscopy & Molecular Physics (AREA)
- Physics & Mathematics (AREA)
- General Physics & Mathematics (AREA)
- High Energy & Nuclear Physics (AREA)
- Biomedical Technology (AREA)
- Engineering & Computer Science (AREA)
- Crystallography & Structural Chemistry (AREA)
- Chemical & Material Sciences (AREA)
- Pathology (AREA)
- Nuclear Medicine, Radiotherapy & Molecular Imaging (AREA)
- Radiology & Medical Imaging (AREA)
- Animal Behavior & Ethology (AREA)
- General Health & Medical Sciences (AREA)
- Public Health (AREA)
- Veterinary Medicine (AREA)
- Measurement Of Radiation (AREA)
- Radiation-Therapy Devices (AREA)
Abstract
【課題】 計数率が低い状況から高い状況まで広い範囲にわたって精度良く放射線等を計数する計数方法を提供する。 【解決手段】 波高弁別閾値を設定し、該波高弁別閾値を超える信号の頻度を計数する方法であって、計数の目的成分が波高分布スペクトルでピークを示す場合において、前記ピークについてガウス関数をフィッティングして求められ得る平均波高値をμ、標準偏差をσとした際に、(μ-0.4σ)~(μ+0.6σ)の範囲から選ばれる任意の値を前記波高弁別閾値とする計数方法であり、また、当該計数方法により信号処理する放射線検出装置である。本発明の計数方法および放射線検出装置によれば、パイルアップが計数値に与える誤差を小さくすることが可能であり、放射線線量率が低い状況から高い状況まで広い範囲にわたって精度良く放射線等を計数することが可能である。
Description
本発明は、放射線等の計数方法および放射線検出装置に関する。詳しくは、高計数率条件下でも精度良く放射線等を計数する方法および放射線検出装置に関する。
シンチレータや半導体などの放射線検出素子と波高弁別回路を組み合わせた放射線検出装置では、放射線検出素子が検出した放射線のエネルギーに対応したパルス信号を得てその波高値を読み取り、当該波高値が波高弁別閾値を超えたパルス信号を計数することにより線量率を求める方法が広く一般に行われている。
例えば、中性子線の線量率を求める中性子検出装置の場合には、バックグラウンドノイズとなるγ線を計数しない波高値を波高弁別閾値とする必要がある。波高弁別閾値を最適化する方法としては、特許文献1に記載されたように、波高分布スペクトルで示されたピークについてガウス関数をフィッティングして求められるμ(波高値の平均値)およびσ(波高値の標準偏差)を基準として設定する方法がある。
例えば、がんの放射線治療において放射線検出素子が曝される環境は、非常に高い放射線線量率となる場合がある。このような高線量率環境においては、特許文献2や特許文献3に記載されたように、或るパルスの測定直後に次のパルスが入射すること(所謂パイルアップ現象)により信号波形が重なってしまって計数ロスを起こし、計数精度が低下する問題がある。
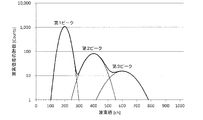
特許文献2や特許文献3では、AD変換器によりパルスをデジタル化させ、パイルアップした複数のパルスを分離して計数すると共に、ベースライン変動による波高値の変化を補正する方法が開示されている。しかし、実施の形態によってはパイルアップした複数のパルスを分離できず、計数ロスする場合があった。2つのパルス(2回の放射線検出事象)が1つのパルス(1回の放射線検出事象)として処理された放射線検出事象がある場合の波高分布スペクトルは、例えば図1のようになり、第1ピークの約2倍の波高値に第2ピークが観測される。なお、パイルアップが無い状態の波高分布スペクトルは図2に示したように第2ピークが観測されない。
そして、さらにパイルアップの頻度が増える場合(線量率がより高かったり、検出素子の感度がより高かったりする場合)には、3つのパルスを1つのパルスとして処理してしまう放射線検出事象の存在によって、図3の波高分布スペクトルのように、第1ピークの約3倍の波高値に第3ピークが観測されることもあった。
このように複数のパルスが1つのパルスとして処理されると、計数ロスを生じて計数精度が低下してしまう。そのため、放射線検出素子の小型化などによって放射線検出感度を下げて、パイルアップの頻度を減らす必要がある。しかし、放射線検出感度を下げることで他の問題を生じることもあるため、多方面からのアプローチが必要となる。
1つとしては、特許文献4に記載されたように、パルスの減衰時間(蛍光寿命)が短い放射線検出素子を用いることである。
1つとしては、パルスの減衰時間が短くなるように回路構成を工夫することである(例えば、時定数が短い増幅器(アンプ)を用いたり、微分回路を用いたりする)。
1つとしては、AD変換器を高速化して、デジタルデータのサンプリング点を増やすことである。
しかしながら、このようなアプローチによっても、パイルアップによって計数精度が低下する問題を解決できない場合もあった。
上記課題に鑑み、本発明者らは鋭意検討を行い、上述のアプローチとは全く異なる方法、すなわち波高弁別閾値の最適化によって、パイルアップによる計数精度の低下を抑制できることを見出し、本発明を完成するに至った。
即ち本発明は、波高弁別閾値を設定し、該波高弁別閾値を超える信号の頻度を計数する方法であって、計数の目的成分が波高分布スペクトルでピークを示す場合において、前記ピークについてガウス関数をフィッティングして求められ得る平均波高値をμ、標準偏差をσとした際に、(μ-0.4σ)~(μ+0.6σ)の範囲から選ばれる任意の値を前記波高弁別閾値とすることを特徴とする計数方法および放射線検出装置である。
本発明によれば、波高弁別閾値を最適化するという簡略な方法によって、パイルアップによる計数精度の低下を抑制でき、放射線計数率が低い状況から高い状況まで広い範囲にわたって精度良く放射線を計数することが可能である。また、回路の簡略化や解析時間の短縮等も可能になる。
本発明を実施するための装置の一例である放射線検出装置の概略図を図4に示す。図4(a)に示すように、放射線検出装置は、放射線の入射によってパルス状の電気信号を出力する放射線検出素子1と波高弁別回路2とを備える。シンチレータのように、直接電気信号を出力せず放射線の入射によって光を発する媒体を用いる場合は、図4(b)に示すように、当該シンチレータ3と、シンチレータ3の発する光を電気信号へ変換させる光検出器4とを組み合わせることによって、放射線検出素子1とすることができる。シンチレータの発する光を電気信号へ変換させる光検出器4として、光電子増倍管、フォトダイオード、アバランシェフォトダイオード、ガイガーモードアバランシェフォトダイオード等の光検出器が一般的に用いられる。
波高弁別回路2は、放射線検出素子1から出力されるパルスの波高値を解析し、波高弁別閾値を超えたパルスを計数できるものであれば良く、パルスをアナログデータ処理によって読み取るものと、パルスをデジタルデータ処理によって読み取るものと、どちらにおいても本発明を適用できる。
本発明の実施例で用いた波高弁別回路2は、増幅器(アナログアンプ)、AD変換器、デジタルデータ処理装置、表示装置などで構成された、デジタルデータ処理によってパルスを読み取るものである。以下、デジタルデータ処理によってパルスを読み取る装置を例として記述する。
前記の実施形態によれば、放射線検出素子1が放射線を検出した際に発するパルスはアナログアンプにより時間軸に沿って拡大して増幅され、増幅されたパルス信号はAD変換器によって或る一定のサンプリング間隔でデジタルデータに変換され、当該デジタルデータをデジタルデータ処理装置によって読み取る。そして、コンピュータ、ソフトウェア、表示モニタなどで構成される表示装置に、波高分布スペクトルや波高弁別閾値を超えた計数値などが表示される。
図5は、パイルアップの影響を概念的に説明するためのアナログアンプによって増幅されたパルスの信号波形図であり、図中の各点は、実線で示したアナログ信号上に一定時間間隔でデジタル化させた場合に得られる離散値を示している。
図5(a)は、パイルアップしていない場合である。この場合、デジタルデータ処理装置は、「波高値(Pulse Height)Hに相当する事象が2回」として計数する。
一方、図5(b)は、パイルアップした場合である。本来は「波高値Hに相当する事象が3回」と計数されるべきところだが、第1パルスの直後に別の放射線が入射して第2パルスが立ち上がっており、デジタルデータの離散値で見ると信号値が上昇し続けているため、第1パルスと第2パルスは分離して認識されず、「H”(≒2H)に相当する事象が1回」と計数される。すなわち、2回と計数されるべき信号が、1回としか計数されていないことになる。この現象を計数ロスと呼ぶ。
また、第1パルスと第2パルスとがパイルアップしたパルスがベースラインに戻る前に第3パルスが立ち上がる。すなわち、第3パルスは、アナログ信号が極小値を取った後に立ち上がる。波高値を算出する際には、極小値の直前の離散値を基礎とするため、見掛け上ベースラインのシフトによって第3パルスは「H’(<H)に相当する事象が1回」と計数される。この現象を波高値の小値化と呼ぶ。本発明が解決しようとする問題は、第1パルスと第2パルスについて生じる計数ロスである。以降の説明では、便宜上、図5(b)のように第1パルスと第2パルスとが重畳し、複数のパルスに分離して計数できなかった場合をパイルアップしたとして取り扱い、第3パルスのように直前のパルスから分離して計数できたものはパイルアップしていないものとして取り扱う。なお、第3パルスについて波高値が小値化する問題は、計数ロスを招くこともある。すなわち波高弁別閾値を超える波高値として処理されるべきパルスが、波高弁別閾値未満の波高値まで小値化してしまうと計数ロスとなる。この計数ロスについては、後述するガウスフィッティングを活用し、波高値の小値化に合わせて波高弁別閾値を調整することによっても計数ロスを軽減できる。
上述のパイルアップが計数値に与える誤差をシミュレーションするため、まず、パイルアップしていない場合と、パイルアップしている場合との、それぞれで示される波高分布スペクトルを、下記式(1)のガウス関数を用いて近似した。式(1)のガウス関数における最大計数Nは、平均波高値μにおいて示される計数である。χは任意の波高値を示し、σは標準偏差である。波高分布スペクトルの近似方法を説明する図を図6に示す。

パイルアップ率を0%、10%、20%、30%として、前述の方法で生成した波高分布スペクトルを図7に示す。パイルアップ率0%の波高分布スペクトルは、第1ピークしか持たないデータである。各波高分布スペクトルの0~1023chまでの合計計数は、第2ピークの計数を2倍、第3ピークの計数を3倍として計算すれば一致するようにしている。なお、パイルアップ率とは、パルスが重畳して分離できない割合である。具体的には、100個のパルスの内、2個が重畳し1つの信号として処理される場合には、パイルアップ率は2%となる。100個のパルスの内、30個が重畳し、2パルスが重畳した信号や、3パルスが重畳した信号が生成する場合には、パイルアップ率は30%となる。つまり、パルスが重畳した信号に含まれるパルスの割合をパイルアップ率と呼ぶ。
次に、波高弁別閾値(Threshold)をμ+Xσとし、Xを-3~+3の範囲で変化させた場合の波高弁別閾値以上の計数を波高分布スペクトルから求めた。その結果を図8に示す。さらに、図8の結果から、パイルアップ0%の場合の波高弁別閾値以上の計数に対するパイルアップ率10%、20%、30%の計数誤差をそれぞれ求めた。ここで計数誤差は、パイルアップ率0%、波高弁別閾値μ+Xσの場合の計数をC0、パイルアップ率Y%、波高弁別閾値μ+Xσの場合の計数をCYとした際に、100×(CY-C0)/C0により求められる。その結果を図9に示す。これら図8および図9の結果から、Xが小さいほど計数ロスによるマイナスの誤差が大きくなり、Xが大きいほど過剰な計数によるプラスの誤差が大きくなるが、μに近い波高弁別閾値(すなわちX=0付近)ではパイルアップによる計数誤差を生じ難いことが解る。
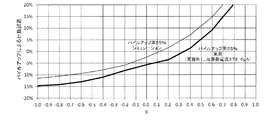
また、最適な波高弁別閾値を実測値に基づいて設定するため、後述の実施例1について、最もパイルアップしていない状況(加速器電流は5.7μA、波高分布スペクトルは図2)に対する、最もパイルアップしている状況(加速器電流は379.6μA、波高分布スペクトルは図3)の計数誤差を解析した。図2及び図3のそれぞれの第1ピークについて、ガウス関数をフィッティングしてμ及びσを求め、得られたμ及びσを基に波高弁別閾値μ+Xσを設定し、前記シミュレーションと同様の方法で計数誤差を求めた結果を図10に示す。ただし、図2および図3の波高分布スペクトルを得た際の線量率差を考慮する必要があるため、線量率差は加速器電流差と同じ傾向を示すものと見做し、図2および図3の計数を各加速器電流値によって規格化した。また、図3の波高分布スペクトルの解析により、該波高分布スペクトルのパイルアップ率は25%程度であることが判った。図10には、パイルアップ率を25%とした場合の計数誤差のシミュレーション値を併せて示す。
図10に示したパイルアップによる計数誤差は、シミュレーションと実測で多少のずれが生じている。これは、シミュレーションではパイルアップによる波高値の小値化を考慮していないのに対し、実測ではパイルアップによる波高値の小値化が生じているためと考えられる。このように、シミュレーションと実測では多少のずれを生じるものの、実測においても、μに近い波高弁別閾値(すなわちX=0付近)はパイルアップによる計数ロスの影響を受け難いことが解る。また、実測において波高値の小値化が生じる場合には、波高弁別閾値をμよりもやや高めに設定することが最適であることが分かる。
ここで、図11を用いて、波高弁別閾値をμ付近に設定することによってパイルアップによる計数誤差を小さくできる原理を説明する。
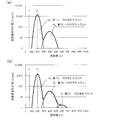
まず、図11(a)を用いて、パルス2個のパイルアップのみを考慮して説明する。パイルアップしていない第1ピークの合計計数をNs、パルス2個がパイルアップした第2ピークの合計計数をNdとした場合、放射線検出素子が検出した放射線の数はNs+2Ndであることが理論的に言える。
ここで、一般には、全ての事象を計数できるように例えばT1の辺りに閾値を設定する。T1を波高弁別閾値とした場合に得られる閾値以上の計数はNs+Ndとなり、理論値Ns+2Ndと比較するとNdのマイナス誤差を生じ、特にパイルアップが顕著に生じてNdが増大すると、計数誤差も甚大となる。これに対して、本発明の計数方法は、第1ピークのμの近傍に波高弁別閾値を設定することによって、計数誤差を低減することを特徴とする。例えば、第1ピークのμを波高弁別閾値(T2)とした場合に得られる閾値以上の計数は1/2Ns+Ndとなり、理論値Ns+2Ndと比較するとちょうど半分を計数することになる。換言すれば、第1ピークのμを波高弁別閾値として得られた計数を2倍すれば、理論値通りの計数を得ることができる。このとき、上記第1ピークのμを波高弁別閾値として得られる計数は、パイルアップの程度にかかわらず、常に理論値の半分であるため、本発明の計数方法によれば、パイルアップによる計数誤差を生じない。
次に、図11(b)を用いて、パルス2個のパイルアップとパルス3個のパイルアップを考慮して説明する。パイルアップしていない第1ピークの合計計数をNs、パルス2個がパイルアップした第2ピークの合計計数をNd、パルス3個がパイルアップした第3ピークの合計計数をNtとした場合、放射線検出素子が検出した放射線の数はNs+2Nd+3Ntであることが理論的に言える。全ての事象を計数できるT1を波高弁別閾値とした場合に得られる閾値以上の計数はNs+Nd+Ntとなり、理論値Ns+2Nd+3Ntと比較するとNd+2Ntのマイナス誤差を生じてしまう。一方、第1ピークのμを波高弁別閾値(T2)とした場合に得られる閾値以上の計数は1/2Ns+Nd+Ntとなる。理論値の半分の値である1/2Ns+Nd+3/2Ntと比較すると1/2Ntのマイナス誤差が生じてしまうが、閾値をT1とした場合よりも誤差を格段に小さくできる。
μに近い波高弁別閾値を設定することによって、パイルアップによる計数誤差を低減する本発明の計数方法は、上記説明した理論に基づいてなされたものであって、図9に示したシミュレーション結果も本発明の妥当性を示すものである。
なお、前述のシミュレーションはパルス2個のパイルアップとパルス3個のパイルアップを考慮したものであり、閾値μ+0σにおいて若干のマイナス誤差が生じていることもこの理論と一致している。なお、このマイナス誤差が生じる原因である第3ピークの計数Ntは、第1ピークの計数Nsより十分に小さいため、パイルアップによって生じる計数誤差への寄与度が小さい結果となっている。さらに、パルス4個以上がパイルアップした第4、第5、第6…ピークが観測される可能性もあるが、パイルアップによって生じる計数誤差への寄与度は第3ピークよりさらに小さくなるため、ほとんどの用途において問題にはならない。
本発明によれば、波高弁別閾値を設定し、該波高弁別閾値を超える信号の頻度を計数する方法であって、計数の目的成分が波高分布スペクトルでピークを示す場合において、前記ピークについてガウス関数をフィッティングして求められ得る平均波高値をμ、標準偏差をσとした際に、(μ-0.4σ)~(μ+0.6σ)の範囲から選ばれる任意の値を前記波高弁別閾値とする計数方法を採用することにより、パイルアップによる計数精度の低下を抑えることができる。なお、波高弁別閾値の設定法は、ガウス関数のフィッティングに限定されない。弁別回路における信号処理時の波高弁別閾値が結果として上記範囲あれば良いのであって、他の方法によって設定された閾値であっても、上記範囲にあれば、本発明の範囲に含まれる。
計数の目的成分とは、計数の対象とする事象のことであり、特に限定されるものではない。例えば、中性子の線量率や積算線量などを提供できる中性子検出装置であれば、中性子の入射事象が計数の目的成分となる。放射線の種類はX線、α線、γ線、中性子など多種多様であるが、2種類以上の放射線を検出する放射線検出装置でも良く、その際に本発明の波高弁別閾値を適用するのは、検出する放射線のうち何れか1種類についてでも良く、2種類以上の放射線についてでも良い。
さらに、計数の目的成分とは、放射線の入射事象に限定されるものではなく、紫外線、可視光線、赤外線、マイクロ波などの電磁波を検出する場合にも適用でき、様々な分野への応用が可能である。
本発明の計数方法は、計数の目的成分が波高分布スペクトルでピークを示す場合に適用できる。例えば、中性子検出装置について、横軸に波高値をとり、縦軸に各波高値を示した事象の頻度を示した波高分布スペクトルにおいて、中性子を検出した事象が波高分布スペクトルでピークを示せば、当該ピークについてガウス関数をフィッティングして求められる(μ-0.4σ)~(μ+0.6σ)の範囲から選ばれる任意の値を前記閾値とし、閾値を越えた事象を計数することにより適用できる。中性子を検出した事象が波高分布スペクトルでピークを示さない場合には、本発明の計数方法は適用できない。
中性子の検出によってピークを形成できる形態の一例として、特許文献5に記載されたEu:LiCaAlF6結晶(中性子シンチレータ)と光検出器と波高弁別回路を組み合わせる方法がある。
波高分布ピークの形状については特に限定されず、およそガウス分布に従った形状であれば問題なく本発明の効果が得られる。後述の方法によりガウス関数をフィッティングして得られるμと、波高分布スペクトルで計数の目的成分が示すピークにおいて、最大の計数を示す波高値(以下、該波高値をPで表す)が一致しているほど高い計数精度が期待できることは統計学的に当然のことであるが、0.9μ≦P≦1.1μの範囲で一致していれば、特に精度の良い計数が可能である。
なお、前記ピークについてガウス関数をフィッティングする前に、波高分布スペクトルに対してベースライン補正、ピーク分離、スムージング等の処理を予め施しても良い。
本発明の波高弁別閾値を決定するための基準となるμおよびσは、計数の目的成分によって示される波高分布ピークのうち、パイルアップしていない第1ピークについて式(1)のガウス関数をフィッティングすることにより求められる値であり、2個のパルスがパイルアップした第2ピークや3個のパルスがパイルアップした第3ピークについて求められる値とは無関係である。以下に記載するμ、σとは、前記第1ピークについて求められるμ、σのことである。第1ピークとは、一般に最も計数の大きなピークでもある。なお、パイルアップが頻発する場合には、第2ピークが大きくなり、分離が困難になることもある。この場合には、検出感度を下げる、パルスの減衰時間を短くするなどの手段により、第1ピークの形状がガウス関数に近似するように条件設定することで、本発明の計数方法を適用できる。
ガウス関数をフィッティングする際に用いる波高分布スペクトルのデータ範囲は、波高分布スペクトルで計数の目的成分が示すピークにおいて、最大計数を示す波高値Pを基準として、0.75P~1.25Pが好適である。また、計数の目的成分とは異なる成分によるノイズの計数がμ、σの解析値に影響する場合には、下限値及び/又は上限値を狭めても良い。逆に、μ、σの解析値に影響するノイズが無ければ、ガウス関数をフィッティングする際に用いるデータ範囲を広げても良い。例えば、ガウス関数をフィッティングする際に用いる波高分布スペクトルのデータ範囲を0.75P~3Pとしても良い。ここで、第2ピークが現われる場合には、当該第2ピークの計数はフィッティングを行う上ではノイズとなるが、パイルアップによって現われる第2ピークの計数は第1ピークの計数よりも十分に小さいため、当該ノイズがμ、σの解析値に与える影響は限定的である。なお、ガウス関数のフィッティングには最小二乗法を用いることが好ましく、μ、σと併せて最大計数Nに関してもフィッティングする方が好ましい。
前記説明から理解される通り、本発明の計数方法の本質は、μの近傍に波高弁別閾値を設定することによって、パイルアップによる計数誤差を低減することである。そして、上述のガウス関数をフィッティングして求められる(μ-0.4σ)~(μ+0.6σ)の範囲から選ばれる任意の値を前記波高弁別閾値とする方法は、μの近傍に適切に波高弁別閾値を設定するための指標を与えるものである。
本発明において、ガウス関数をフィッティングする方法による解析を行わなくとも、例えば、以下に記載した方法によっても波高弁別閾値を決定できる。
なお、以下に記載した方法によって決定されたいずれの波高弁別閾値も、ガウス関数をフィッティングすれば、該フィッティングから求められる(μ-0.4σ)~(μ+0.6σ)の範囲に包含される。
ガウス関数をフィッティングする方法による解析を必要としない波高弁別閾値の第1の決定方法は、波高値Pにおいて最大計数N’を示す波高分布ピークについて、下記式(2)によって求められる計数nに最も近い計数を示す波高値を波高弁別閾値とする方法である。

ガウス関数をフィッティングする方法による解析を必要としない波高弁別閾値の第2の決定方法は、標準偏差σに代わって、半値幅FWHMを基準として波高弁別閾値を決定する方法である。ガウス分布において、μと波高値Pは同じであり、標準偏差σと半値幅FWHMの間には下記式(3)の関係がある。

ガウスフィッティングによる解析を必要としない波高弁別閾値の第3の決定方法は、波高分布ピークの最大計数を示す波高値Pを波高分布スペクトルの形状から判断して、該波高値P付近の波高値を波高弁別閾値とする方法である。
以上、ガウスフィッティングによる解析を必要としない波高弁別閾値の第1~第3の決定方法を例示したが、これらとも異なる方法によって波高弁別閾値を決定しても良く、何らかの方法により決定した波高弁別閾値が、ガウスフィッティングにより解析した(μ-0.4σ)~(μ+0.6σ)の範囲に包含されていれば、本発明の効果が発揮される。
上記のように、本発明では波高分布における第1ピークの最大計数近傍で波高弁別閾値が設定される。以下、本発明で設定する閾値をTAと記載することがある。本発明の計数方法では、TAを超えるパルスの頻度を計数する。本発明の計数方法において、計数の目的成分よりも高波高値側のノイズを除去する目的で、TAと併せて、高波高値側に他の波高弁別閾値(TB)を設けて、TAを超えTB未満または、TA以上かつTB以下のパルスを計数しても良い。その場合、第2ピークおよび第3ピークの計数をロスさせないための閾値TBは、好ましくは3μ以上であり、さらに好ましくは5μ以上である。また、第1目的成分を計数するための波高弁別閾値を設定すると共に、第2目的成分を計数するための波高弁別閾値を別に設定しても良い。
本発明によれば、(μ-0.4σ)~(μ+0.6σ)の範囲から選ばれる任意の値を波高弁別閾値として設定することにより、パイルアップによる計数精度の低下を抑えることができる。図10に示したパイルアップによる計数誤差の実測値によれば、当該波高弁別閾値を超えたパルス信号を計数する場合、パイルアップによって生じる計数誤差をおよそ±10%以下に抑えることができ、斯様な計数誤差であればほとんどの用途において、精度の高い計測を実現できる。
ただし、パイルアップの頻度や前記パイルアップによる波高値の小値化の程度によっては±10%を超える誤差を生じる可能性もあるが、図9を用いて説明した理論によれば、本発明の範囲を逸脱した波高弁別閾値とする場合に較べて格段に優れた計数精度が実現できる。図10に示したパイルアップによる計数誤差の実測値によれば、波高弁別閾値を(μ+0.3σ)より低い波高値とする場合、波高弁別閾値を低くするほどパイルアップによる計数ロスが影響してマイナス側に計数誤差が拡大しやすく、波高弁別閾値を(μ+0.3σ)より高い波高値とする場合、波高弁別閾値を高くするほど第2ピークや第3ピークの計数増が影響してプラス側に計数誤差が拡大しやすい。
より好ましい波高弁別閾値は(μ+0.0σ)~(μ+0.5σ)の範囲から選ばれる任意の値であり、さらに好ましい波高弁別閾値は(μ+0.2σ)~(μ+0.4σ)の範囲から選ばれる任意の値であり、それぞれ約±5%、±3%の計数誤差に抑えられる。
本発明の計数方法は、シンチレータ3と光検出器4と波高弁別回路2を組み合わせた放射線検出装置において好適に採用できる。
本発明は、シンチレータ3と光検出器4と波高弁別回路2を組み合わせて用いる放射線検出装置であって、前記波高弁別回路2は、前記光検出器4の信号を増幅する増幅器と、前記増幅器のアナログ信号出力をデジタル信号に変換するAD変換器と、前記AD変換器のデジタル信号出力を信号処理するデジタルデータ処理装置と、を備える波高弁別回路であって、当該波高弁別回路において前記計数方法により信号処理する放射線検出装置を提供する。
前記波高弁別回路2としては、特許文献2や特許文献3に記載されたように、前記光検出器の信号を増幅する増幅器と、前記増幅器のアナログ信号出力をデジタル信号に変換するAD変換器と、前記AD変換器のデジタル信号出力を信号処理するデジタルデータ処理装置と、を備えるものが好ましい。デジタルデータ処理によってパルス信号を読み取る波高弁別回路であれば、アナログデータ処理によってパルス信号を読み取る波高弁別回路に較べて、前記パイルアップによる波高値の小値化を軽減するための回路構成を低コストで実現できると共に、波高値の補正処理などが容易に可能となる。パイルアップによる波高値の小値化を軽減することによって、本発明の効果をより高い確度で得ることができる。
本発明において、前記デジタルデータ処理装置には、所定の時間間隔で波高分布スペクトルを作成し、作成した波高分布スペクトルにおいて計数の目的成分が示すピークについてガウス関数をフィッティングし、求められたμおよびσを基準とした波高弁別閾値を逐次設定する機能を実装することが好ましい。かかる機能を実装することによって、前記パイルアップによる波高値の小値化に追従して波高弁別閾値を自動更新することができ、該小値化に起因する計数誤差の増大を防ぐことができる。
なお、パイルアップによる波高値の小値化が小さい波高弁別回路を用いる場合であれば、ガウス関数をフィッティングする機能や波高弁別閾値を逐次設定する機能を実装せず、本発明に準ずる波高弁別閾値を予め解析し、計数の開始から終了まで該波高弁別閾値に基づいて計数しても良い。
増幅器は、前置増幅器(プリアンプ)や波形整形増幅器(シェイピングアンプ)などが適用でき、これらの組合せであっても良い。また、微分回路を組み合せた回路構成であっても良い。特許文献2や特許文献3に記載された回路構成の他には、特許文献6や特許文献7に記載された回路構成なども好適である。
シンチレータ3は、Eu、Ce、Tl、Na等の賦活剤を含むLiCaAlF6結晶、LiSrAlF6結晶、LiF/CaF2共晶体、LiF/SaF2共晶体、NaI結晶、Bi4Ge3O12結晶、Gd3Al2Ga3O12結晶、CeF3結晶等の無機シンチレータ、また、アントラセン、スチルベン、ジフェニルオキサゾール等の有機蛍光体からなる有機シンチレータ、また、前記有機蛍光体を含有するポリスチレン、ポリビニルトルエン、ポリエチレンテレフタレート等のプラスチックシンチレータ、また、前記有機蛍光体を含有するトルエン、キシレン等の液体シンチレータ、また、ヘリウム、アルゴン、キセノン、クリプトン等の気体シンチレータ等を用途に応じて何ら制限なく用いることができる。
本発明において、シンチレータ3がLiCaxSr1-xAlF6結晶(xは0~1)であることが好ましい。具体的には、EuやCeなどの添加物を賦活剤として含む、LiCaAlF6結晶やLiSrAlF6結晶を好適に用いることができる。これらのシンチレータ結晶は中性子シンチレータであり、当該シンチレータ結晶に含まれるLi-6は、中性子と反応してα線及びトリチウムを生じ、当該α線及びトリチウムによってシンチレータ結晶に4.8MeVのエネルギーを与える。そして、当該シンチレータ結晶に含まれる賦活剤によって、与えられたエネルギーに相当する光が発せられる。該LiCaAlF6結晶や該LiSrAlF6結晶は、中性子を検出した事象によって、0.95μ≦P≦1.05μの精度でガウス分布と一致するピークを示すことができるため、本発明の放射線検出装置に用いるシンチレータとして特に好適である。
本発明の実施例で用いたEu:LiCaAlF6結晶等の、Euを賦活剤として含むLiCaxSr1-xAlF6結晶は、特に発光量が高く、信号/雑音比の高い計測が可能なため本発明に好適に用いることができる。なお、該Euを賦活剤として含むLiCaxSr1-xAlF6結晶は、蛍光寿命が1.6μsecであり、一般的なシンチレータ材料の中では蛍光寿命が長いため、パイルアップを生じやすいが、本発明の計数方法を適用することによって、パイルアップを生じても精度良く計数することが可能となる。
一方、Ceを賦活剤として含むLiCaxSr1-xAlF6結晶は、特に蛍光寿命が数十nsecと短いため本発明に好適に用いることができる。当該Ce:LiCaAlF6結晶やCe:LiSrAlF6結晶等のCeを賦活剤として含むLiCaxSr1-xAlF6結晶は、本来蛍光寿命が短く、パイルアップを起こしにくいため、本発明の計数方法を適用すれば極めて高い計数率での計測を実現できる。
Li-6を含む中性子シンチレータの中性子感度の調整は、シンチレータサイズの調整、及びLi-6同位体比の調整によって可能である。Liの安定な同位体であるLi-6、Li-7の比を調整したものとしては、Li-6を濃縮したもの、天然比のもの、Li-7を濃縮したものがあり、Li-6同位体比が高いほど中性子感度が高くなる。また、これらの混合によって中性子感度を調整しても良い。上記のようにして中性子感度を調整することによって、計数の対象とする線量率に応じた放射線検出装置を提供できる。
本発明において、シンチレータ3の光を光検出器4まで伝搬する手段は特に限定されず、シンチレータ3と光検出器4を図4(b)に示したように直接的に接続しても良く、図12に示したように光ファイバ5などのライトガイドを用いて間接的に接続しても良い。シンチレータ3と光検出器4を直接的に接続する場合には、光検出器4をシンチレータ3と共に放射線場へ曝すことになるため、光検出器4に放射線が入射することにより観測されるノイズの影響で計数精度が低下したり、光検出器4が故障したりする可能性がある。そのため、高線量率環境下で放射線を計数する場合には、計数の対象とする高線量率環境下にシンチレータ3を設置し、光検出器4を充分に線量率が低い遠方に設置し、該シンチレータ3と光検出器4を光ファイバ5などのライトガイドを用いて間接的に接続することが好ましい。
高線量率となる放射線場としてはがんの放射線治療装置が挙げられ、中でも、ホウ素中性子捕捉療法(BNCT)用の放射線治療装置では、中性子線量率が1×10⁹n/cm2/sec程度と非常に高くなることが知られている。従来は、原子炉中性子を利用したBNCT治療が行われていたが、近年では、サイクロトロン加速器や静電加速器によっても高線量率の中性子が得られるようになっており、病院にも設置可能な加速器BNCT治療装置が開発されている。
本発明の計数方法および放射線検出装置は、様々な放射線場で好適に利用可能であり、前記加速器中性子の検出に特に適している。特に、非常に高い中性子線量率となるホウ素中性子捕捉療法用の中性子の検出に適している。
ホウ素中性子捕捉療法用の中性子を検出する場合において、本発明を実施する最良の形態は、中性子シンチレータ3と光検出器4と波高弁別回路2を組み合わせた放射線検出装置であって、中性子シンチレータ3としてEu:LiCaAlF6結晶、Ce:LiCaAlF6結晶、Eu:LiSrAlF6結晶、Ce:LiSrAlF6結晶の何れかを用い、当該中性子シンチレータ3と光検出器4の間を光ファイバ5によって接続して成るものである。
かかる態様において、中性子シンチレータ3から光ファイバ5への光の伝搬効率を高めるため、中性子シンチレータ3と光ファイバ5の先端を光学接着することが好ましい。光学接着する方法は特に制限されないが、シンチレータ3の発光波長における透過率が良く、且つ、耐放射線性が良い有機接着剤や無機接着剤を用いる方法、又は、光ファイバ5の先端部を一時的に融解させてシンチレータ3を融着する方法が好ましい。また、中性子シンチレータ3から光ファイバ5への集光効率を高めるため、中性子シンチレータ3の周囲を反射材で覆うことが好ましい。反射材は特に制限されないが、テトラフルオロエチレン、ポリエチレン、酸化チタン、硫酸バリウムなどの白色物質が好ましい。なお、光ファイバ5は石英ファイバ、プラスチックファイバなどを用いることができ、開口数(NA)が大きく、伝送損失が小さいものが好ましい。具体的には、NA0.45以上、伝送損失200dB/km以下が好ましい。NAが大きく、伝送損失が小さいものを用いることによって、光検出器4まで十分な光量を伝搬させることができれば、中性子を検出した事象によって、0.95μ≦P≦1.05μの精度でガウス分布と一致するピークが形成されるため、特に好ましい。
前記の形態であれば、光検出器4を高線量率環境下に配置する必要がなく、波高分布スペクトルにおいて、シンチレータ3が中性子を検出した事象として認められるピークを形成することが可能である。また、当該ピークについて、ガウス関数をフィッティングして求められ得る平均波高値をμ、標準偏差をσとした際に、(μ-0.4σ)~(μ+0.6σ)の範囲から選ばれる任意の値を波高弁別閾値とし、当該波高弁別閾値を超えた事象を計数すれば、パイルアップによる計数精度の低下が小さく、低線量率から高線量率まで広い範囲にわたって精度良く中性子を計数可能な放射線検出装置を提供できる。
以上の説明から明らかなように、本発明の一態様に係る計数方法は、
波高弁別閾値を設定し、該波高弁別閾値を超える信号の頻度を計数する方法であって、
計数の目的成分が波高分布スペクトルでピークを示す場合において、
前記ピークについてガウス関数をフィッティングして求められ得る(μ-0.4σ)~(μ+0.6σ)[ただし、μは平均波高値であり、σは標準偏差である]の範囲から選ばれる任意の値を前記波高弁別閾値とする。
波高弁別閾値を設定し、該波高弁別閾値を超える信号の頻度を計数する方法であって、
計数の目的成分が波高分布スペクトルでピークを示す場合において、
前記ピークについてガウス関数をフィッティングして求められ得る(μ-0.4σ)~(μ+0.6σ)[ただし、μは平均波高値であり、σは標準偏差である]の範囲から選ばれる任意の値を前記波高弁別閾値とする。
本発明の他の態様に係る計数方法は、
計数の目的成分が波高分布スペクトルで複数のピークを示す場合において、波高弁別閾値を設定し、該波高弁別閾値を超える信号の頻度を計数する方法であって、
該波高弁別閾値が、(μ-0.4σ)~(μ+0.6σ)の範囲にある。
ただしμおよびσは、前記複数のピークの内の最大ピークをガウス関数に近似した際の平均波高値μおよび標準偏差σである。
計数の目的成分が波高分布スペクトルで複数のピークを示す場合において、波高弁別閾値を設定し、該波高弁別閾値を超える信号の頻度を計数する方法であって、
該波高弁別閾値が、(μ-0.4σ)~(μ+0.6σ)の範囲にある。
ただしμおよびσは、前記複数のピークの内の最大ピークをガウス関数に近似した際の平均波高値μおよび標準偏差σである。
本発明のさらに他の態様に係る計数方法は、
放射線もしくは電磁波に由来のパルス信号を、その波高値および波高値毎の計数に基づいてプロットして得られる波高分布スペクトルにおいて、複数のピークが存在する場合に、波高弁別閾値を設定して、該波高弁別閾値を超える信号の頻度を計数する方法であって、
前記複数のピークの内、最大ピークをガウス関数に近似して求められ得る平均波高値をμ、標準偏差をσとした際に、
前記波高弁別閾値が(μ-0.4σ)~(μ+0.6σ)の範囲にある計数方法。
放射線もしくは電磁波に由来のパルス信号を、その波高値および波高値毎の計数に基づいてプロットして得られる波高分布スペクトルにおいて、複数のピークが存在する場合に、波高弁別閾値を設定して、該波高弁別閾値を超える信号の頻度を計数する方法であって、
前記複数のピークの内、最大ピークをガウス関数に近似して求められ得る平均波高値をμ、標準偏差をσとした際に、
前記波高弁別閾値が(μ-0.4σ)~(μ+0.6σ)の範囲にある計数方法。
以下、具体的な実験例を挙げて本発明の実施態様をより詳しく説明するが、本発明はこれらに限定されるものではない。
実施例1
まず、中性子シンチレータ3と光検出器4と波高弁別回路2を組み合わせた中性子検出装置を下記の通り製作した。製作した中性子検出装置は図12に概略図を示すものである。
まず、中性子シンチレータ3と光検出器4と波高弁別回路2を組み合わせた中性子検出装置を下記の通り製作した。製作した中性子検出装置は図12に概略図を示すものである。
中性子シンチレータ3は、Li-6同位体比を95%に濃縮したLi原料を用いて製造されたEu:LiCaAlF6結晶を用いた。0.6mm×0.6mm×0.6mmに加工したEu:LiCaAlF6結晶を、コア径φ1mm・長さ10mの石英製の光ファイバ5の先端(逆端を後端とする)へエポキシ接着剤を用いて光学接着した。光ファイバ5は、NAが0.48であり、Eu:LiCaAlF6結晶の発光波長(370nm)における伝送損失が100dB/kmのものを用いた。なお、Eu:LiCaAlF6結晶からなるシンチレータ3と光ファイバ5との光学接着面は、それぞれ光学研磨を施した。さらに、Eu:LiCaAlF6結晶からなるシンチレータ3を硫酸バリウムからなる反射材で覆うことにより光ファイバへの集光効率改善を図り、光ファイバ5を遮光材料で被覆することにより室内光が入射しないようにした。
Eu:LiCaAlF6結晶からなるシンチレータ3を接着した光ファイバ5の後端を光検出器4へ光学的に接続した。光検出器4は波高弁別回路2へ電気的に接続した。光検出器4としては、光電子増倍管を用いた。
波高弁別回路2は、光検出器の信号を増幅する増幅器と、増幅器のアナログ信号出力をデジタル信号に変換するAD変換器と、AD変換器のデジタル信号出力を信号処理するデジタルデータ処理装置と、デジタルデータ処理の結果を表示する表示装置と、を備えるものを用いた。
表示装置は、コンピュータとソフトウェア、モニタを備えるものを用いた。モニタには、波高分布スペクトルや波高弁別閾値を超えたパルスの計数値などを表示できるようにした。
なお、前記デジタルデータ処理装置には、10秒毎に波高分布スペクトルを作成し、作成した波高分布スペクトルにおいて計数の目的成分が示すピークについてガウス関数をフィッティングし、求められたμおよびσを基準とした波高弁別閾値を逐次設定する機能を実装した。本実施例では、パイルアップの頻度が高まるに連れ波高分布ピークが徐々に低波高値側へシフトし、パイルアップの頻度が最も多い状況では、パイルアップの頻度が最も少ない状況に対してμが約14%低下したが、波高弁別閾値はその時点でのピーク位置に合わせて自動更新されるため、波高値の小値化による計数ロスは軽微であった。
次に、製作した中性子検出装置を用いて、下記に記載した方法の通り、加速器中性子を計数し、パイルアップが計数値に与えた誤差を解析した。
静電加速器を用いた中性子発生装置の中性子照射口付近に、中性子減速材としてポリエチレンブロックを配置し、当該ポリエチレンブロックに設けた挿入孔へシンチレータ3を接着した光ファイバ5の先端を挿入して固定した。光検出器4および波高弁別回路2は、光ファイバ5を伸ばすことにより、中性子照射口から遠ざけて配置した。
静電加速器によって中性子を発生させ、中性子検出装置によって当該中性子を検出した。検出した中性子のパルスを解析し、波高弁別閾値を超えたパルスを1秒毎に計数して単位時間あたりの中性子計数率[cps]を得た。実施例1における波高弁別閾値は、(μ+0.3σ)とした。なお、得られた中性子計数率[cps]に中性子線量率へ換算するための係数を乗じることにより、中性子線量率[n/cm2/sec]を求めることができる。該加速器の最大出力における該検出素子を配置させた環境の中性子線量率は、約1×108n/cm2/secであった。
実施例1において得られた計数率[cps]の経時変化を図13に示す(左縦軸)。図13には、加速器の電流値[μA]も併せて示しており(右縦軸)、当該電流値は、実施例1における加速器出力の履歴を現わしている。図13の右縦軸スケールは、6kcps以下を示している部分の中性子計数率について、加速器電流値が中性子計数率とグラフ上で重なるように調整している。なお、加速器電流値が最も低い約5μAの際の波高分布スペクトルは、図2のようにパイルアップが少ないものであり、約45μA、約380μAの際の波高分布スペクトルはそれぞれ図1、図3のようなものであり、加速器電流値が高いほど、即ち中性子線量率が高いほどパイルアップの頻度が増えることがわかる。
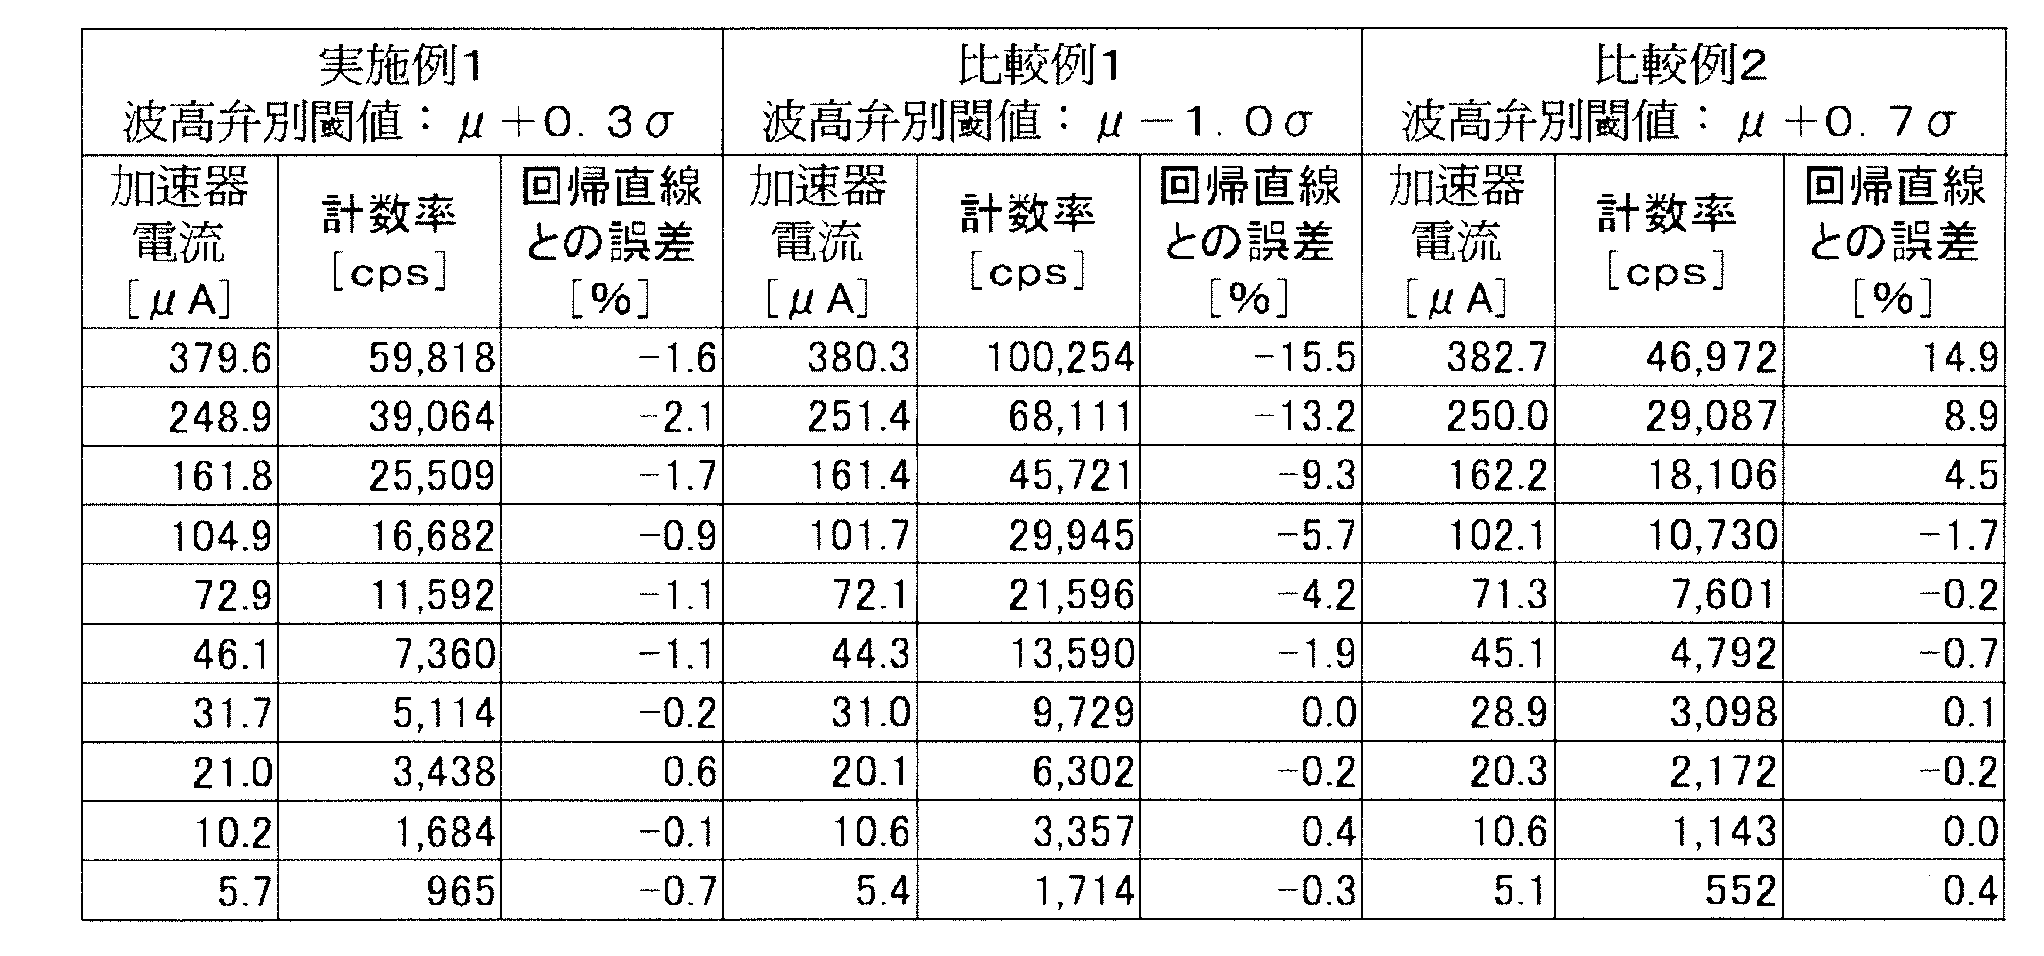
図13のデータについて、加速器電流値が安定している期間毎に、加速器電流値と中性子計数率の平均値を算出して比較したグラフを図14に示す。図14の回帰直線は、中性子計数率が低くパイルアップの影響が小さい部分(約1kcps~5kcpsの4点)から求めたものである。回帰直線から期待される中性子計数率に対する実際に得られた中性子計数率の誤差は、表1に示した通りであり、最大で-2.1%の誤差しかなく良好な結果だった。
実施例1と同一の中性子検出装置を用いて、波高弁別閾値を(μ-1.0σ)とした以外は、実施例1と同様にして加速器中性子を計数した。
比較例1において得られた中性子計数率および加速器電流値について、実施例1と同様の方法で解析した結果を図15および図16に示す。図15において、中性子計数率が40kcpsを超えた部分では、中性子計数率が加速器電流値と較べて顕著に低くなっているが、これはパイルアップによって計数ロスが生じた結果を示すものである。各加速器電流値における中性子計数率の回帰直線との差は、表1に示した通りであり、-10%を超える計数誤差を生じていた。
比較例2
実施例1と同一の中性子検出装置を用いて、波高弁別閾値を(μ+0.7σ)とした以外は、実施例1と同様にして加速器中性子を計数した。
実施例1と同一の中性子検出装置を用いて、波高弁別閾値を(μ+0.7σ)とした以外は、実施例1と同様にして加速器中性子を計数した。
比較例2において得られた中性子計数率および加速器電流値について、実施例1と同様の方法で解析した結果を図17および図18に示す。図17において、中性子計数率が15kcpsを超えた部分では、中性子計数率が加速器電流値と較べて顕著に高くなっているが、これはパイルアップによる第2ピークや第3ピークの計数増が影響した結果を示すものである。各加速器電流値における中性子計数率の回帰直線との差は、表1に示した通りであり、+10%を超える計数誤差を生じていた。
以上の実施例では、パイルアップの頻度が高くなる高計数率条件下においても、本発明の計数方法を採用することによって、パイルアップによる計数精度の低下を抑えることが可能である結果を示した。Li-6同位体比を天然比とし、サイズを0.3mm×0.3mm×0.2mmへ小型化したEu:LiCaAlF6結晶を中性子シンチレータ3として用いれば、本実施例で製作した中性子検出装置の1/100以下の中性子感度とできるため、該Eu:LiCaAlF6結晶を用いた中性子検出装置であれば、BNCT治療における中性子線量率1×109n/cm2/secにおいても精度良く中性子の計数が可能である。当該中性子検出装置であれば、さらに線量率が高い1×1010n/cm2/secにおいても精度良く中性子を計数可能である。
1:放射線検出素子
2:波高弁別回路
3:シンチレータ
4:光検出器
5:光ファイバ
2:波高弁別回路
3:シンチレータ
4:光検出器
5:光ファイバ
Claims (7)
- 波高弁別閾値を設定し、該波高弁別閾値を超える信号の頻度を計数する方法であって、
計数の目的成分が波高分布スペクトルでピークを示す場合において、
前記ピークについてガウス関数をフィッティングして求められ得る(μ-0.4σ)~(μ+0.6σ)[ただし、μは平均波高値であり、σは標準偏差である]の範囲から選ばれる任意の値を前記波高弁別閾値とする計数方法。 - 計数の目的成分が波高分布スペクトルで複数のピークを示す場合において、波高弁別閾値を設定し、該波高弁別閾値を超える信号の頻度を計数する方法であって、
該波高弁別閾値が、(μ-0.4σ)~(μ+0.6σ)の範囲にある計数方法、
ただしμおよびσは、前記複数のピークの内の最大ピークをガウス関数に近似した際の平均波高値μおよび標準偏差σである。 - 放射線もしくは電磁波に由来のパルス信号を、その波高値および波高値毎の計数に基づいてプロットして得られる波高分布スペクトルにおいて、複数のピークが存在する場合に、波高弁別閾値を設定して、該波高弁別閾値を超える信号の頻度を計数する方法であって、
前記複数のピークの内、最大ピークをガウス関数に近似して求められ得る平均波高値をμ、標準偏差をσとした際に、
前記波高弁別閾値が(μ-0.4σ)~(μ+0.6σ)の範囲にある計数方法。 - シンチレータと光検出器と波高弁別回路を組み合わせて用いる放射線検出装置であって、
前記波高弁別回路は、
前記光検出器の信号を増幅する増幅器と、
前記増幅器のアナログ信号出力をデジタル信号に変換するAD変換器と、
前記AD変換器のデジタル信号出力を信号処理するデジタルデータ処理装置と、
を備える波高弁別回路であって、
当該波高弁別回路において請求項1~3の何れか一項に記載の計数方法により信号処理する放射線検出装置。 - シンチレータが、LiCaxSr1-xAlF6結晶(xは0~1)である請求項4に記載の放射線検出装置。
- シンチレータが検出する放射線が加速器中性子である請求項4又は5の何れか一項に記載の放射線検出装置。
- シンチレータが検出する放射線がホウ素中性子捕捉療法用の中性子である請求項4~6の何れか一項に記載の放射線検出装置。
Applications Claiming Priority (2)
| Application Number | Priority Date | Filing Date | Title |
|---|---|---|---|
| JP2016144371A JP2019152436A (ja) | 2016-07-22 | 2016-07-22 | 計数方法および放射線検出装置 |
| JP2016-144371 | 2016-07-22 |
Publications (1)
| Publication Number | Publication Date |
|---|---|
| WO2018016492A1 true WO2018016492A1 (ja) | 2018-01-25 |
Family
ID=60992196
Family Applications (1)
| Application Number | Title | Priority Date | Filing Date |
|---|---|---|---|
| PCT/JP2017/025982 Ceased WO2018016492A1 (ja) | 2016-07-22 | 2017-07-18 | 計数方法および放射線検出装置 |
Country Status (3)
| Country | Link |
|---|---|
| JP (1) | JP2019152436A (ja) |
| TW (1) | TW201809722A (ja) |
| WO (1) | WO2018016492A1 (ja) |
Families Citing this family (3)
| Publication number | Priority date | Publication date | Assignee | Title |
|---|---|---|---|---|
| TWI692649B (zh) * | 2019-05-14 | 2020-05-01 | 國立臺灣大學 | 偵測及判斷中子及伽馬射線之方法及系統 |
| CN113877081B (zh) * | 2020-07-03 | 2024-04-19 | 中硼(厦门)医疗器械有限公司 | 中子捕获治疗设备及其监测系统运行步骤 |
| CN116999720A (zh) * | 2020-11-25 | 2023-11-07 | 中硼(厦门)医疗器械有限公司 | 中子捕获治疗设备 |
Citations (3)
| Publication number | Priority date | Publication date | Assignee | Title |
|---|---|---|---|---|
| WO2012060381A1 (ja) * | 2010-11-02 | 2012-05-10 | 株式会社トクヤマ | コルキライト型結晶、中性子検出用シンチレーター及び中性子線検出器 |
| WO2014092202A1 (ja) * | 2012-12-12 | 2014-06-19 | 株式会社トクヤマ | 中性子シンチレーター、中性子検出方法及び中性子検出器 |
| WO2014192321A1 (ja) * | 2013-05-27 | 2014-12-04 | 住友重機械工業株式会社 | 中性子線検出装置及び中性子捕捉療法装置 |
-
2016
- 2016-07-22 JP JP2016144371A patent/JP2019152436A/ja active Pending
-
2017
- 2017-07-18 WO PCT/JP2017/025982 patent/WO2018016492A1/ja not_active Ceased
- 2017-07-21 TW TW106124514A patent/TW201809722A/zh unknown
Patent Citations (3)
| Publication number | Priority date | Publication date | Assignee | Title |
|---|---|---|---|---|
| WO2012060381A1 (ja) * | 2010-11-02 | 2012-05-10 | 株式会社トクヤマ | コルキライト型結晶、中性子検出用シンチレーター及び中性子線検出器 |
| WO2014092202A1 (ja) * | 2012-12-12 | 2014-06-19 | 株式会社トクヤマ | 中性子シンチレーター、中性子検出方法及び中性子検出器 |
| WO2014192321A1 (ja) * | 2013-05-27 | 2014-12-04 | 住友重機械工業株式会社 | 中性子線検出装置及び中性子捕捉療法装置 |
Also Published As
| Publication number | Publication date |
|---|---|
| TW201809722A (zh) | 2018-03-16 |
| JP2019152436A (ja) | 2019-09-12 |
Similar Documents
| Publication | Publication Date | Title |
|---|---|---|
| RU2505842C2 (ru) | Стабилизация коэффициента усиления гамма-сцинтилляционного детектора | |
| Moses et al. | Cerium fluoride, a new fast, heavy scintillator | |
| US6876711B2 (en) | Neutron detector utilizing sol-gel absorber and activation disk | |
| US7095029B2 (en) | Scintillators for neutron detection and neutron detectors using the same | |
| JP4791935B2 (ja) | ZnS蛍光体を用いたシンチレーション中性子検出器の中性子/ガンマ線弁別方法 | |
| Ding et al. | Advances on inorganic scintillator-based optic fiber dosimeters | |
| JP5916421B2 (ja) | 中性子検出器 | |
| JP4766407B2 (ja) | 放射線線量計および放射線線量計算プログラム | |
| US8399849B1 (en) | Fast neutron detector | |
| Chichester et al. | Comparison of BCF-10, BCF-12, and BCF-20 scintillating fibers for use in a 1-dimensional linear sensor | |
| Vitullo et al. | Developing and testing a miniature fiber-coupled scintillator for in-core neutron counting in CROCUS | |
| JP7161973B2 (ja) | 放射線モニタ装置 | |
| WO2018016492A1 (ja) | 計数方法および放射線検出装置 | |
| JP2017161378A (ja) | 放射線モニタ及び放射線測定方法 | |
| JP4061367B2 (ja) | ZnS(Ag)シンチレーション検出器 | |
| Pritchard et al. | Cold neutron radiation dose effects on a 6LiF: ZnS (Ag) neutron detector with wavelength shifting fibers and SiPM photodetector | |
| JP2019148429A (ja) | 放射線モニタ | |
| JP6637176B2 (ja) | 放射線モニタ | |
| JP2012242369A (ja) | 放射線検出器 | |
| JP4137121B2 (ja) | 放射線検出装置 | |
| US10996353B1 (en) | N-type gallium nitride scintillation for fast-neutron detection | |
| JP7160572B2 (ja) | 放射線モニタ | |
| Hesse | OCTOPUS–A High Repetition Rate Detector for Laser-Accelerated Particles | |
| JP7599380B2 (ja) | 中性子検出器 | |
| MITRA | Simulation based optimization of indigenously developed inorganic scintillators and various light sensors to develop gamma spectrometer systems |
Legal Events
| Date | Code | Title | Description |
|---|---|---|---|
| 121 | Ep: the epo has been informed by wipo that ep was designated in this application |
Ref document number: 17831008 Country of ref document: EP Kind code of ref document: A1 |
|
| NENP | Non-entry into the national phase |
Ref country code: DE |
|
| 122 | Ep: pct application non-entry in european phase |
Ref document number: 17831008 Country of ref document: EP Kind code of ref document: A1 |
|
| NENP | Non-entry into the national phase |
Ref country code: JP |