WO2017199542A1 - Structure assessment system, structure assessment device and structure assessment method - Google Patents
Structure assessment system, structure assessment device and structure assessment method Download PDFInfo
- Publication number
- WO2017199542A1 WO2017199542A1 PCT/JP2017/008818 JP2017008818W WO2017199542A1 WO 2017199542 A1 WO2017199542 A1 WO 2017199542A1 JP 2017008818 W JP2017008818 W JP 2017008818W WO 2017199542 A1 WO2017199542 A1 WO 2017199542A1
- Authority
- WO
- WIPO (PCT)
- Prior art keywords
- elastic wave
- evaluation
- distribution
- region
- unit
- Prior art date
Links
Images


Classifications
-
- G—PHYSICS
- G01—MEASURING; TESTING
- G01N—INVESTIGATING OR ANALYSING MATERIALS BY DETERMINING THEIR CHEMICAL OR PHYSICAL PROPERTIES
- G01N29/00—Investigating or analysing materials by the use of ultrasonic, sonic or infrasonic waves; Visualisation of the interior of objects by transmitting ultrasonic or sonic waves through the object
- G01N29/14—Investigating or analysing materials by the use of ultrasonic, sonic or infrasonic waves; Visualisation of the interior of objects by transmitting ultrasonic or sonic waves through the object using acoustic emission techniques
-
- G—PHYSICS
- G01—MEASURING; TESTING
- G01M—TESTING STATIC OR DYNAMIC BALANCE OF MACHINES OR STRUCTURES; TESTING OF STRUCTURES OR APPARATUS, NOT OTHERWISE PROVIDED FOR
- G01M5/00—Investigating the elasticity of structures, e.g. deflection of bridges or air-craft wings
- G01M5/0008—Investigating the elasticity of structures, e.g. deflection of bridges or air-craft wings of bridges
-
- G—PHYSICS
- G01—MEASURING; TESTING
- G01M—TESTING STATIC OR DYNAMIC BALANCE OF MACHINES OR STRUCTURES; TESTING OF STRUCTURES OR APPARATUS, NOT OTHERWISE PROVIDED FOR
- G01M5/00—Investigating the elasticity of structures, e.g. deflection of bridges or air-craft wings
- G01M5/0033—Investigating the elasticity of structures, e.g. deflection of bridges or air-craft wings by determining damage, crack or wear
-
- G—PHYSICS
- G01—MEASURING; TESTING
- G01M—TESTING STATIC OR DYNAMIC BALANCE OF MACHINES OR STRUCTURES; TESTING OF STRUCTURES OR APPARATUS, NOT OTHERWISE PROVIDED FOR
- G01M5/00—Investigating the elasticity of structures, e.g. deflection of bridges or air-craft wings
- G01M5/0066—Investigating the elasticity of structures, e.g. deflection of bridges or air-craft wings by exciting or detecting vibration or acceleration
-
- G—PHYSICS
- G01—MEASURING; TESTING
- G01N—INVESTIGATING OR ANALYSING MATERIALS BY DETERMINING THEIR CHEMICAL OR PHYSICAL PROPERTIES
- G01N29/00—Investigating or analysing materials by the use of ultrasonic, sonic or infrasonic waves; Visualisation of the interior of objects by transmitting ultrasonic or sonic waves through the object
- G01N29/04—Analysing solids
- G01N29/043—Analysing solids in the interior, e.g. by shear waves
-
- G—PHYSICS
- G01—MEASURING; TESTING
- G01N—INVESTIGATING OR ANALYSING MATERIALS BY DETERMINING THEIR CHEMICAL OR PHYSICAL PROPERTIES
- G01N29/00—Investigating or analysing materials by the use of ultrasonic, sonic or infrasonic waves; Visualisation of the interior of objects by transmitting ultrasonic or sonic waves through the object
- G01N29/04—Analysing solids
- G01N29/07—Analysing solids by measuring propagation velocity or propagation time of acoustic waves
-
- G—PHYSICS
- G01—MEASURING; TESTING
- G01N—INVESTIGATING OR ANALYSING MATERIALS BY DETERMINING THEIR CHEMICAL OR PHYSICAL PROPERTIES
- G01N29/00—Investigating or analysing materials by the use of ultrasonic, sonic or infrasonic waves; Visualisation of the interior of objects by transmitting ultrasonic or sonic waves through the object
- G01N29/22—Details, e.g. general constructional or apparatus details
- G01N29/24—Probes
- G01N29/2437—Piezoelectric probes
-
- G—PHYSICS
- G01—MEASURING; TESTING
- G01N—INVESTIGATING OR ANALYSING MATERIALS BY DETERMINING THEIR CHEMICAL OR PHYSICAL PROPERTIES
- G01N29/00—Investigating or analysing materials by the use of ultrasonic, sonic or infrasonic waves; Visualisation of the interior of objects by transmitting ultrasonic or sonic waves through the object
- G01N29/44—Processing the detected response signal, e.g. electronic circuits specially adapted therefor
- G01N29/4409—Processing the detected response signal, e.g. electronic circuits specially adapted therefor by comparison
- G01N29/4436—Processing the detected response signal, e.g. electronic circuits specially adapted therefor by comparison with a reference signal
-
- G—PHYSICS
- G01—MEASURING; TESTING
- G01N—INVESTIGATING OR ANALYSING MATERIALS BY DETERMINING THEIR CHEMICAL OR PHYSICAL PROPERTIES
- G01N29/00—Investigating or analysing materials by the use of ultrasonic, sonic or infrasonic waves; Visualisation of the interior of objects by transmitting ultrasonic or sonic waves through the object
- G01N29/44—Processing the detected response signal, e.g. electronic circuits specially adapted therefor
- G01N29/4445—Classification of defects
-
- G—PHYSICS
- G01—MEASURING; TESTING
- G01N—INVESTIGATING OR ANALYSING MATERIALS BY DETERMINING THEIR CHEMICAL OR PHYSICAL PROPERTIES
- G01N29/00—Investigating or analysing materials by the use of ultrasonic, sonic or infrasonic waves; Visualisation of the interior of objects by transmitting ultrasonic or sonic waves through the object
- G01N29/44—Processing the detected response signal, e.g. electronic circuits specially adapted therefor
- G01N29/4463—Signal correction, e.g. distance amplitude correction [DAC], distance gain size [DGS], noise filtering
-
- G—PHYSICS
- G01—MEASURING; TESTING
- G01N—INVESTIGATING OR ANALYSING MATERIALS BY DETERMINING THEIR CHEMICAL OR PHYSICAL PROPERTIES
- G01N2291/00—Indexing codes associated with group G01N29/00
- G01N2291/02—Indexing codes associated with the analysed material
- G01N2291/023—Solids
- G01N2291/0232—Glass, ceramics, concrete or stone
-
- G—PHYSICS
- G01—MEASURING; TESTING
- G01N—INVESTIGATING OR ANALYSING MATERIALS BY DETERMINING THEIR CHEMICAL OR PHYSICAL PROPERTIES
- G01N2291/00—Indexing codes associated with group G01N29/00
- G01N2291/02—Indexing codes associated with the analysed material
- G01N2291/025—Change of phase or condition
- G01N2291/0258—Structural degradation, e.g. fatigue of composites, ageing of oils
-
- G—PHYSICS
- G01—MEASURING; TESTING
- G01N—INVESTIGATING OR ANALYSING MATERIALS BY DETERMINING THEIR CHEMICAL OR PHYSICAL PROPERTIES
- G01N2291/00—Indexing codes associated with group G01N29/00
- G01N2291/02—Indexing codes associated with the analysed material
- G01N2291/028—Material parameters
- G01N2291/0289—Internal structure, e.g. defects, grain size, texture
Definitions
- Embodiments of the present invention relate to a structure evaluation system, a structure evaluation apparatus, and a structure evaluation method.
- AE Acoustic Emission
- AE is an elastic wave generated with the progress of fatigue cracks in the material.
- AE electrostic Emission
- an elastic wave is detected as an AE signal (voltage signal) by an AE sensor using a piezoelectric element.
- the AE signal is detected as an indication before material breakage occurs. Therefore, the occurrence frequency and signal intensity of the AE signal are useful as an index representing the soundness of the material. For this reason, research is being conducted on techniques for detecting signs of deterioration of structures by the AE method.
- the problem to be solved by the present invention is to provide a structure evaluation system, a structure evaluation apparatus, and a structure evaluation method capable of evaluating the soundness of a structure that generates elastic waves.
- the structure evaluation system of the embodiment includes a plurality of AE sensors, a signal processing unit, a position locating unit, a speed calculation unit, and an evaluation unit.
- the AE sensor detects elastic waves generated from the structure.
- the signal processing unit extracts an AE signal including information on the elastic wave by performing signal processing on the elastic wave detected by the AE sensor.
- the position locating unit derives a transmission source distribution representing the distribution of the elastic wave transmission sources generated in the structure based on the AE signal.
- the velocity calculation unit derives a propagation velocity of the elastic wave generated in the structure based on the AE signal.
- An evaluation part evaluates the soundness of the said structure based on the said transmission source distribution and the propagation velocity of the said elastic wave.
- FIG. 1 is a diagram illustrating a system configuration of a structure evaluation system 100 according to an embodiment.
- the structure evaluation system 100 is used for evaluating the soundness of a structure.
- a bridge is described as an example of a structure, but the structure need not be limited to a bridge.
- the structure may be any structure as long as an elastic wave is generated due to the occurrence or development of a crack or an external impact (for example, rain, artificial rain, etc.).
- Bridges are not limited to structures laid on rivers and valleys, but also include various structures (for example, highway viaducts) provided above the ground.
- the structure evaluation system 100 includes a plurality of AE sensors 10-1 to 10-n (n is an integer of 2 or more), a signal processing unit 11, and a structure evaluation apparatus 20.
- the signal processing unit 11 and the structure evaluation apparatus 20 are connected to be communicable by wire or wirelessly.
- the AE sensors 10-1 to 10-n are referred to as AE sensors 10 when not distinguished from each other.
- the AE sensor 10 is installed in a structure.
- the AE sensor 10 is installed on a concrete floor slab of a bridge.
- the AE sensor 10 includes a piezoelectric element, detects an elastic wave (AE wave) generated by a structure, and converts the detected elastic wave into a voltage signal (AE source signal).
- the AE sensor 10 performs processing such as amplification and frequency limitation on the AE source signal and outputs the signal to the signal processing unit 11.
- the signal processing unit 11 receives the AE source signal processed by the AE sensor 10 as an input.
- the signal processing unit 11 extracts an AE feature amount including information on an elastic wave by performing signal processing such as noise removal and parameter extraction required on the input AE source signal.
- the information on the elastic wave is information such as the amplitude, energy, rise time, duration, frequency, zero cross count number, etc. of the AE source signal.
- the signal processing unit 11 outputs information based on the extracted AE feature amount to the structure evaluation apparatus 20 as an AE signal.
- the AE signal output from the signal processing unit 11 includes information such as sensor ID, AE detection time, AE source signal amplitude, energy, rise time, and frequency.
- the amplitude of the AE source signal is, for example, a maximum amplitude value among elastic waves.
- the energy is, for example, a value obtained by time integration of the square of the amplitude at each time point.
- the definition of energy is not limited to the above example, and may be approximated using, for example, a waveform envelope.
- the rise time is, for example, a time T1 until the elastic wave rises from a zero value exceeding a predetermined value set in advance.
- the duration is, for example, the time from when the rise of the elastic wave starts until the amplitude becomes smaller than a preset value.
- the frequency is the frequency of the elastic wave.
- the zero cross count number is, for example, the number of times the elastic wave crosses a reference line passing through a zero value.
- the structure evaluation apparatus 20 includes a CPU (Central Processing Unit), a memory, an auxiliary storage device, and the like connected by a bus, and executes an evaluation program. By executing the evaluation program, the structure evaluation device 20 functions as a device including a position locating unit 201, a speed calculation unit 202, an evaluation unit 203, and a display unit 204. Note that all or a part of each function of the structure evaluation apparatus 20 may be realized by using hardware such as ASIC (Application Specific Integrated Circuit), PLD (Programmable Logic Device), and FPGA (Field Programmable Gate Array). .
- the evaluation program may be recorded on a computer-readable recording medium.
- the computer-readable recording medium is, for example, a portable medium such as a flexible disk, a magneto-optical disk, a ROM, a CD-ROM, or a storage device such as a hard disk built in the computer system.
- the evaluation program may be transmitted / received via a telecommunication line.
- the position locating unit 201 receives the AE signal output from the signal processing unit 11 as an input. In addition, the position locating unit 201 stores in advance information related to the installation position of the AE sensor 10 in the structure (hereinafter referred to as “sensor position information”) in association with the sensor ID.
- the information regarding the installation position is, for example, latitude and longitude, or distances in the horizontal and vertical directions from a specific position of the structure.
- the position locating unit 201 locates the AE generation source based on information such as sensor ID and AE detection time included in the input AE signal and sensor position information held in advance.
- the position location unit 201 derives the AE seismic source density distribution (source distribution) using the position location results for a certain period.
- the AE hypocenter density distribution represents a distribution in which the source of elastic waves generated in the structure is shown.
- the position location unit 201 outputs the derived AE seismic source density distribution to the evaluation unit 203.
- the speed calculation unit 202 receives the AE signal output from the signal processing unit 11 as an input.
- the speed calculation unit 202 holds the sensor position information in advance in association with the sensor ID.
- the velocity calculation unit 202 derives the elastic wave propagation velocity distribution of the structure based on information such as sensor ID and AE detection time included in the input AE signal and sensor position information held in advance.
- the elastic wave propagation velocity distribution represents a distribution in which the propagation velocity of the elastic wave generated in the structure is shown.
- the velocity calculation unit 202 derives the elastic wave propagation velocity distribution of the structure using the AE tomography analysis method.
- the velocity calculation unit 202 outputs the derived elastic wave propagation velocity distribution to the evaluation unit 203.
- the AE tomography analysis method detects the elastic wave generated from the structure with multiple AE sensors, locates the AE source, and measures the theoretical scanning time from the source to each sensor.
- the propagation speed of the analysis model of the structure is corrected so that the scanning time error converges within an allowable value, and the elastic wave propagation speed distribution in the structure is obtained. Since the speed of AE which advances inside is reduced as the structure is deteriorated, the degree of deterioration inside the structure can be evaluated from the speed distribution of AE by using the AE tomography analysis method.
- the evaluation unit 203 receives the AE seismic source density distribution output from the position location unit 201 and the elastic wave propagation velocity distribution output from the velocity calculation unit 202 as inputs.
- the evaluation unit 203 evaluates the soundness of the structure based on the input AE seismic source density distribution and elastic wave propagation velocity distribution.
- the evaluation unit 203 causes the display unit 204 to display the evaluation result.
- the display unit 204 is an image display device such as a liquid crystal display or an organic EL (Electro Luminescence) display.
- the display unit 204 displays the evaluation result according to the control of the evaluation unit 203.
- the display unit 204 may be an interface for connecting the image display device to the structure evaluation device 20. In this case, the display unit 204 generates a video signal for displaying the evaluation result, and outputs the video signal to an image display device connected to itself.
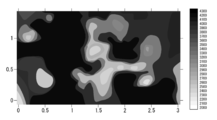
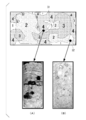
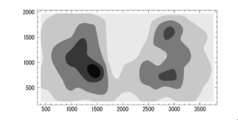
- FIG. 2A represents the AE source density distribution
- FIG. 2B represents the elastic wave propagation velocity distribution.
- the AE hypocenter density distribution and the elastic wave propagation velocity distribution are distributions obtained based on the same region of the same structure.
- 2A and 2B show the results of using 15 AE sensors 10 for a floor slab of a certain road structure.
- the horizontal axis and the vertical axis represent the horizontal length (mm) and the vertical length (mm) from a specific position of the structure to be evaluated.
- FIG. 2B the horizontal axis and the vertical axis represent the horizontal length (m) and the vertical length (m) from a specific position of the structure to be evaluated.
- FIG. 2A the richer the source (the denser the source), the darker the color, and the fewer the source (the sparser the source), the thinner.
- a region 30 in FIG. 2A represents a region where the number of transmission sources is larger than other regions.
- FIG. 2B the higher the propagation speed is, the darker it is, and the slower the propagation speed is, the thinner it is.
- the AE source density distribution and elastic wave propagation velocity distribution shown in FIGS. 2A and 2B are input to the evaluation unit 203.
- the evaluation unit 203 uses the input AE seismic source density distribution based on a reference value related to the density of the transmission source (hereinafter referred to as “density reference value”) and a region where the transmission source is sparse and a region where the transmission source is dense. It is divided into two areas. Specifically, the evaluation unit 203 classifies the region by binarizing the AE hypocenter density distribution based on the density reference value. In this embodiment, the density reference value is set to 0.5.
- the evaluation unit 203 binarizes an area that is equal to or higher than the density reference value as an area where the transmission source is dense, and an area where the density is lower than the density reference value as an area where the transmission source is sparse. Divide the area.
- the density reference value is not necessarily limited to the above value, and may be changed as appropriate.
- the evaluation unit 203 uses the input elastic wave propagation velocity distribution based on a reference value related to the propagation velocity of the elastic wave (hereinafter referred to as “propagation velocity reference value”), a region having a high propagation velocity, and a propagation velocity. It is divided into two areas of low area. Specifically, the evaluation unit 203 classifies the region by binarizing the elastic wave propagation velocity distribution based on the propagation velocity reference value.
- the propagation speed reference value is 3800 m / s.
- the evaluation unit 203 binarizes a region having a propagation velocity higher than the propagation velocity reference value as a region having a higher propagation velocity and a region having a propagation velocity lower than the propagation velocity reference value as a region having a lower propagation velocity. To divide the area.
- the propagation speed reference value is not necessarily limited to the above value, and may be changed as appropriate.
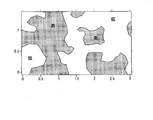
- FIG. 3A shows the segmentation result of the AE source density distribution region
- FIG. 3B shows the segmentation result of the elastic wave propagation velocity distribution region.
- the diagram shown in FIG. 3A is described as a binarized AE source density distribution
- the diagram shown in FIG. 3B is described as a binarized elastic wave propagation velocity distribution.
- the evaluation unit 203 evaluates the soundness of the structure using the binarized AE seismic source density distribution and the binarized elastic wave propagation velocity distribution. Specifically, the evaluation unit 203 superimposes the binarized AE seismic source density distribution and the binarized elastic wave propagation velocity distribution on the soundness of the structure in accordance with the segmented result of the overlapped region. Assess in 4 stages.
- specific examples of the four-stage evaluation include soundness, intermediate deterioration I, intermediate deterioration II, and limit deterioration. It shows that the deterioration of the structure progresses in the order of soundness, intermediate deterioration I, intermediate deterioration II, and limit deterioration.
- the evaluation unit 203 evaluates whether each region (each overlapped region) of the structure corresponds to sound, intermediate deterioration I, intermediate deterioration II, or limit deterioration based on the following evaluation conditions.
- the evaluation unit 203 evaluates the region as a healthy region. In addition, when the overlapping region is a region where the transmission sources are dense and the propagation speed is high, the evaluation unit 203 evaluates the region as a region of intermediate degradation I. Further, when the overlapping region is a region where the transmission sources are dense and the propagation speed is low, the evaluation unit 203 evaluates the region as a region of intermediate degradation II. In addition, when the overlapped area is an area where the transmission source is sparse and the propagation speed is low, the evaluation unit 203 evaluates the area as a marginal deterioration area.
- the evaluation unit 203 evaluates whether each of the overlapped regions corresponds to sound, intermediate deterioration I, intermediate deterioration II, and limit deterioration, and the evaluation result of each region is indicated.
- the evaluation result distribution is derived.
- the evaluation unit 203 represents a healthy region by “1”, an intermediate degradation I region by “2”, an intermediate degradation II region by “3”, and a marginal degradation region. May be represented by “4”.
- the evaluation unit 203 causes the display unit 204 to display the derived evaluation result distribution.
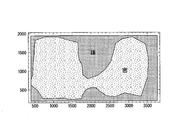
- FIG. 4 is a diagram showing an example of the evaluation result distribution. As shown in FIG. 4, by displaying the evaluation result distribution, the worker or the administrator can easily grasp which region of the structure is being deteriorated.
- FIG. 5 is a diagram showing a verification result of the validity of the evaluation result.
- FIG. 5 shows the result of collecting and confirming the inside of the floor slab of the structure shown in FIG.
- a core sample taken from the portion indicated by a circle 31 in the region “4” indicating the limit deterioration is shown in FIG.
- FIG. 5A the progress of deterioration inside the core sample can be seen to the extent that the core is separated by horizontal cracks.
- the core sample taken from the portion of the circle 32 in the region “1” representing the sound is FIG. 5B.
- no cracks are visually confirmed inside the core sample.
- the effectiveness of the evaluation method by the structure evaluation apparatus 20 was confirmed.
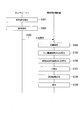
- FIG. 6 is a sequence diagram illustrating a processing flow of the structure evaluation system 100.
- each AE sensor 10 and the signal processing unit 11 are sensor units.
- Each AE sensor 10 detects an elastic wave (AE wave) generated by the structure (step S101).
- the AE sensor 10 converts the detected elastic wave into a voltage signal (AE source signal), performs processing such as amplification and frequency limitation on the AE source signal, and outputs the signal to the signal processing unit 11.
- the signal processing unit 11 performs signal processing such as necessary noise removal and parameter extraction on the input AE source signal (step S102).
- the signal processing unit 11 outputs information based on the AE feature amount extracted by performing signal processing to the structure evaluation apparatus 20 as an AE signal (step S103). Steps S101 to S103 are executed for a predetermined period.
- the position location unit 201 locates the AE generation source based on the AE signal output from the signal processing unit 11 and sensor position information held in advance (step S104). The position location unit 201 performs the process of step S104 for a predetermined period. And the position location part 201 derives
- the velocity calculation unit 202 derives the elastic wave propagation velocity distribution of the structure based on the AE signal output from the signal processing unit 11 (step S106). For example, the velocity calculation unit 202 may derive an elastic wave propagation velocity distribution using an AE signal for a predetermined period, or an elastic wave propagation velocity distribution using an AE signal for a period shorter than the predetermined period. May be derived. The velocity calculation unit 202 outputs the derived elastic wave propagation velocity distribution to the evaluation unit 203. Note that step S105 and step S106 are in no particular order.
- the evaluation unit 203 binarizes the AE source density distribution output from the position location unit 201 and the elastic wave propagation velocity distribution output from the velocity calculation unit 202, thereby binarizing the AE source density distribution. And a binarized elastic wave propagation velocity distribution are derived (step S107).
- the evaluation unit 203 derives the evaluation result distribution by evaluating each region of the structure based on the evaluation condition using the derived binarized AE seismic source density distribution and the binarized elastic wave propagation velocity distribution. (Step S108).
- the evaluation unit 203 causes the display unit 204 to display the derived evaluation result distribution.
- the display unit 204 displays the evaluation result distribution according to the control of the evaluation unit 203 (step S109).
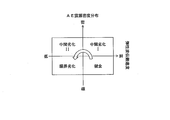
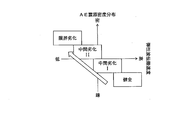
- FIG. 7 is a diagram showing a basic concept of soundness evaluation by the structure evaluation apparatus 20 in the present embodiment.
- the level of elastic wave propagation speed and the density of AE seismic source density are each divided into four quadrants using a two-dimensional evaluation axis.
- the structure evaluation apparatus 20 classify
- the conventional evaluation method and the evaluation method in this embodiment are compared.
- Fig. 8A shows the evaluation based only on the AE hypocenter location
- Fig. 8B shows the evaluation based only on the propagation velocity.
- the evaluation based only on the AE seismic source location indicates that the possibility that the structure is deteriorated is higher as the AE seismic source is sparser and denser.
- the evaluation based only on the propagation speed indicates that the possibility that the structure is deteriorated is higher as the propagation speed is lower.
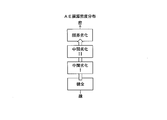
- FIG. 9 is a diagram illustrating an example of an evaluation result when it is assumed that the conventional two evaluation methods illustrated in FIGS. 8A and 8B are combined.
- the region where the elastic wave propagation velocity is higher than a certain standard and the AE source density distribution is sparse becomes healthy.
- the elastic wave propagation velocity is lower than a certain standard and the AE seismic source density distribution is denser (the source is denser)
- the deterioration of the structure progresses and becomes a linear change that leads to marginal deterioration.
- the structure evaluation apparatus 20 evaluates the soundness of the structure based on the evaluation conditions using the AE hypocenter density distribution obtained from the elastic waves detected by each of the plurality of AE sensors 10 and the elastic wave propagation velocity distribution. To do. As described above, the structure evaluation apparatus 20 in this embodiment can evaluate the deterioration level of the structure for each region by combining the AE seismic source density distribution and the elastic wave propagation velocity distribution. Therefore, it is possible to evaluate the soundness of a structure that generates elastic waves. Moreover, the structure evaluation apparatus 20 can perform more accurate evaluation by using a plurality of pieces of information instead of one piece of information obtained from elastic waves.
- the structure evaluation apparatus 20 may include only the evaluation unit 203, and the position location unit 201, the speed calculation unit 202, and the display unit 204 may be provided in another casing.
- the evaluation part 203 acquires AE seismic source density distribution and elastic wave propagation velocity distribution from another housing, and uses the acquired AE seismic source density distribution and elastic wave propagation velocity distribution for a structure. Assess the health of And the evaluation part 203 outputs an evaluation result to the display part 204 with which another housing is provided.
- the manufacturing cost of the structure evaluation apparatus 20 can be suppressed by using an existing apparatus for deriving the AE seismic source density distribution and the elastic wave propagation velocity distribution.
- the signal processing unit 11 may be provided in the structure evaluation apparatus 20. When configured in this manner, the signal processing unit 11 acquires the AE source signal that has been processed by the AE sensor 10 directly from the AE sensor 10 or via a relay device (not shown). In FIG. 1, one signal processing unit 11 is connected to a plurality of AE sensors 10-1 to 10-n. However, the structure evaluation system 100 includes a plurality of signal processing units 11, and each AE sensor 10 The signal processing unit 11 may be connected to each of the plurality of sensor units, and a plurality of sensor units may be provided.
- the velocity calculation unit 202 may be configured to derive a velocity in a region having a density equal to or higher than a predetermined threshold in the AE source density distribution illustrated in FIG. 2A or a velocity in a region having a density lower than the predetermined threshold.
- the evaluation part 203 evaluates the soundness of a structure using the AE hypocenter density distribution derived
- the evaluation unit 203 may operate as an output control unit.
- the output control unit controls the output unit and outputs an evaluation result.
- the output unit includes a display unit 204, a communication unit, and a printing unit.
- the output control unit controls the communication unit and transmits the evaluation result to another device.
- the output unit is a printing unit
- the output control unit controls the printing unit to print the evaluation result.
- the structure evaluation apparatus 20 may include the display unit 204, the communication unit, and a part or all of the printing unit as an output unit, and execute the above operation.
- the position locating unit 201 may derive the AE seismic source density distribution using only the information on the AE generated from the transmission source in which the amplitude of the first arrival wave of the AE is equal to or greater than a predetermined threshold.
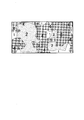
- the position location unit 201 may derive the AE seismic source density distribution using only information on the AE generated from a transmission source having an amplitude of the first arrival wave of AE of 60 dB or more. This will be specifically described with reference to FIGS. 10A and 10B.
- FIG. 10A is an AE source density distribution derived using AE information generated from a source with an AE first arrival wave having an amplitude of 53 dB or more
- FIG. 10A is an AE source density distribution derived using AE information generated from a source with an AE first arrival wave having an amplitude of 53 dB or more
- FIG. 10A is an AE source density distribution derived using AE information generated from a source with an AE first arrival wave having an amplitude of 53 dB or
- the 10B is an AE first arrival wave having an amplitude of 60 dB or more. This is the AE seismic source density distribution derived using information on AE generated from the source. In view of the validity verification result of FIG. 5, it becomes possible to perform more accurate evaluation by using only information on AE generated from a transmission source having a certain amplitude or more as shown in FIG. 10B. Therefore, with this configuration, it is possible to contribute to effective deterioration diagnosis.
- the first arrival wave means an elastic wave that first reaches the AE sensor when a plurality of AE sensors detect an elastic wave generation event (event) that has occurred in the structure.
- FIG. 11 is a diagram showing another example of the basic concept shown in FIG.
- an “initial” phase corresponding to an initial stage immediately after construction and repair of a structure is added.
- This represents a situation where a large amount of transmission sources are observed when a load is applied for the first time in the initial state after construction and manufacture of the structure. This does not immediately indicate the progress of deterioration of the structure, but shows the response of the structure to the first load experienced by the structure. Thereafter, the occurrence of AE is reduced with respect to the existing load. Therefore, it is positioned as a pre-stage of the healthy phase in FIG. 7, and after the initial phase, represents a transition to the healthy phase as the number of transmission sources decreases.
- the example shown in FIG. 11 is a phase that should be taken into consideration when the soundness is evaluated immediately after the construction and repair of the structure.
- a plurality of AE sensors 10 for detecting elastic waves generated from a structure, and signal processing on the elastic waves detected by the AE sensor 10 to perform processing on the elastic waves.
- a signal processing unit 11 for extracting an AE signal including information; a position locating unit 201 for deriving a source distribution based on the AE signal; a speed calculating unit 202 for deriving a propagation speed based on the AE signal; and a source distribution
- the evaluation unit 203 that evaluates the soundness of the structure based on the propagation speed, the soundness of the structure that generates elastic waves can be evaluated.
Abstract
A structure assessment system according to one embodiment comprises a plurality of AE sensors, a signal processing unit, a position locating unit, a speed calculating unit, and an assessment unit. The AE sensors detect elastic waves generated by a structure. The signal processing unit extracts an AE signal that includes information pertaining to the elastic waves, by performing signal processing on the elastic waves detected by the AE sensors. The position locating unit derives a source distribution that represents the distribution of sources of the elastic waves generated by the structure, on the basis of the AE signal. The speed calculating unit derives, on the basis of the AE signal, the velocity of propagation of the elastic wave generated by the structure. The assessment unit assesses the soundness of the structure on the basis of the source distribution and the velocity of propagation.
Description
本発明の実施形態は、構造物評価システム、構造物評価装置及び構造物評価方法に関する。
Embodiments of the present invention relate to a structure evaluation system, a structure evaluation apparatus, and a structure evaluation method.
近年、高度経済成長期に建設された橋梁等の構造物の老朽化に伴う問題が顕在化してきている。万が一にも構造物に事故が生じた場合の損害は計り知れないため、従来から構造物の状態を監視するための技術が提案されている。例えば、内部亀裂の発生、又は、内部亀裂の進展に伴い発生する弾性波を、高感度センサにより検出するAE(Acoustic Emission:アコースティック・エミッション)方式により、構造物の損傷を検出する技術が提案されている。AEは、材料の疲労亀裂の進展に伴い発生する弾性波である。AE方式では、圧電素子を利用したAEセンサにより弾性波をAE信号(電圧信号)として検出する。
AE信号は、材料の破断が生じる前の兆候として検出される。したがって、AE信号の発生頻度および信号強度は、材料の健全性を表す指標として有用である。そのため、AE方式によって構造物の劣化の予兆を検出する技術の研究が行われている。 In recent years, problems associated with the aging of structures such as bridges constructed during the period of high economic growth have become apparent. Since damage in the event of an accident in a structure is immeasurable, techniques for monitoring the state of the structure have been proposed. For example, a technology has been proposed that detects damage to structures by the AE (Acoustic Emission) method that detects the occurrence of internal cracks or the elastic waves that accompany the progress of internal cracks using a high-sensitivity sensor. ing. AE is an elastic wave generated with the progress of fatigue cracks in the material. In the AE method, an elastic wave is detected as an AE signal (voltage signal) by an AE sensor using a piezoelectric element.
The AE signal is detected as an indication before material breakage occurs. Therefore, the occurrence frequency and signal intensity of the AE signal are useful as an index representing the soundness of the material. For this reason, research is being conducted on techniques for detecting signs of deterioration of structures by the AE method.
交通などによる荷重が橋梁のコンクリート床版にかかった際、床版内の亀裂の進展や摩擦などによりAEが発生する。床版表面にAEセンサを設置することで、床版から発生するAEを検出することができる。また、複数のAEセンサを設置することで、AEセンサ間のAE信号の到達時刻の差からAE発生源の位置を標定することができる。このAE発生源の位置標定結果から、対象床版の損傷度合を推定することが行われている。しかしながら、標定結果と、損傷度合との対応付けが十分ではない場合、安定した健全性の評価を行うことができない場合があった。なお、このような問題は、橋梁のコンクリート床版に限らず亀裂の発生または進展に伴い弾性波が発生する構造物すべてに共通する問題である。
When load due to traffic is applied to the concrete floor slab of a bridge, AE occurs due to the progress of cracks and friction in the floor slab. By installing an AE sensor on the floor slab surface, AE generated from the floor slab can be detected. Moreover, by installing a plurality of AE sensors, the position of the AE generation source can be determined from the difference in arrival time of the AE signals between the AE sensors. The degree of damage to the target floor slab is estimated from the position determination result of the AE generation source. However, when the correlation between the orientation result and the degree of damage is not sufficient, there is a case where stable soundness evaluation cannot be performed. Such a problem is not limited to a concrete floor slab of a bridge, but is a problem common to all structures in which elastic waves are generated when cracks are generated or propagated.
本発明が解決しようとする課題は、弾性波を発生する構造物の健全性の評価を行うことができる構造物評価システム、構造物評価装置及び構造物評価方法を提供することである。
The problem to be solved by the present invention is to provide a structure evaluation system, a structure evaluation apparatus, and a structure evaluation method capable of evaluating the soundness of a structure that generates elastic waves.
実施形態の構造物評価システムは、複数のAEセンサと、信号処理部と、位置標定部と、速度演算部と、評価部とを持つ。AEセンサは、構造物より発生した弾性波を検出する。信号処理部は、前記AEセンサによって検出された前記弾性波に対して信号処理を行うことによって前記弾性波に関する情報を含むAE信号を抽出する。位置標定部は、前記AE信号に基づいて、前記構造物で発生した前記弾性波の発信源の分布を表す発信源分布を導出する。速度演算部は、前記AE信号に基づいて、前記構造物で発生した前記弾性波の伝搬速度を導出する。評価部は、前記発信源分布と、前記弾性波の伝搬速度とに基づいて、前記構造物の健全性を評価する。
The structure evaluation system of the embodiment includes a plurality of AE sensors, a signal processing unit, a position locating unit, a speed calculation unit, and an evaluation unit. The AE sensor detects elastic waves generated from the structure. The signal processing unit extracts an AE signal including information on the elastic wave by performing signal processing on the elastic wave detected by the AE sensor. The position locating unit derives a transmission source distribution representing the distribution of the elastic wave transmission sources generated in the structure based on the AE signal. The velocity calculation unit derives a propagation velocity of the elastic wave generated in the structure based on the AE signal. An evaluation part evaluates the soundness of the said structure based on the said transmission source distribution and the propagation velocity of the said elastic wave.
以下、実施形態の構造物評価システム、構造物評価装置及び構造物評価方法を、図面を参照して説明する。
図1は、実施形態の構造物評価システム100のシステム構成を示す図である。構造物評価システム100は、構造物の健全性の評価に用いられる。なお、本実施形態では、構造物の一例として橋梁を例に説明するが、構造物は橋梁に限定される必要はない。例えば、構造物は、亀裂の発生または進展、あるいは外的衝撃(例えば雨、人工雨など)に伴い弾性波が発生する構造物であればどのようなものであってもよい。なお、橋梁は、河川や渓谷などの上に架設される構造物に限らず、地面よりも上方に設けられる種々の構造物(例えば高速道路の高架橋)なども含む。 Hereinafter, a structure evaluation system, a structure evaluation apparatus, and a structure evaluation method of an embodiment will be described with reference to the drawings.
FIG. 1 is a diagram illustrating a system configuration of astructure evaluation system 100 according to an embodiment. The structure evaluation system 100 is used for evaluating the soundness of a structure. In the present embodiment, a bridge is described as an example of a structure, but the structure need not be limited to a bridge. For example, the structure may be any structure as long as an elastic wave is generated due to the occurrence or development of a crack or an external impact (for example, rain, artificial rain, etc.). Bridges are not limited to structures laid on rivers and valleys, but also include various structures (for example, highway viaducts) provided above the ground.
図1は、実施形態の構造物評価システム100のシステム構成を示す図である。構造物評価システム100は、構造物の健全性の評価に用いられる。なお、本実施形態では、構造物の一例として橋梁を例に説明するが、構造物は橋梁に限定される必要はない。例えば、構造物は、亀裂の発生または進展、あるいは外的衝撃(例えば雨、人工雨など)に伴い弾性波が発生する構造物であればどのようなものであってもよい。なお、橋梁は、河川や渓谷などの上に架設される構造物に限らず、地面よりも上方に設けられる種々の構造物(例えば高速道路の高架橋)なども含む。 Hereinafter, a structure evaluation system, a structure evaluation apparatus, and a structure evaluation method of an embodiment will be described with reference to the drawings.
FIG. 1 is a diagram illustrating a system configuration of a
構造物評価システム100は、複数のAEセンサ10-1~10-n(nは2以上の整数)、信号処理部11および構造物評価装置20を備える。信号処理部11および構造物評価装置20は、有線又は無線により通信可能に接続される。なお、以下の説明では、AEセンサ10-1~10-nについて区別しない場合にはAEセンサ10と記載する。
The structure evaluation system 100 includes a plurality of AE sensors 10-1 to 10-n (n is an integer of 2 or more), a signal processing unit 11, and a structure evaluation apparatus 20. The signal processing unit 11 and the structure evaluation apparatus 20 are connected to be communicable by wire or wirelessly. In the following description, the AE sensors 10-1 to 10-n are referred to as AE sensors 10 when not distinguished from each other.
AEセンサ10は、構造物に設置される。例えば、AEセンサ10は、橋梁のコンクリート床版に設置される。AEセンサ10は、圧電素子を有し、構造物が発生する弾性波(AE波)を検出し、検出した弾性波を電圧信号(AE源信号)に変換する。AEセンサ10は、AE源信号に対して増幅、周波数制限などの処理を施して信号処理部11に出力する。
AE sensor 10 is installed in a structure. For example, the AE sensor 10 is installed on a concrete floor slab of a bridge. The AE sensor 10 includes a piezoelectric element, detects an elastic wave (AE wave) generated by a structure, and converts the detected elastic wave into a voltage signal (AE source signal). The AE sensor 10 performs processing such as amplification and frequency limitation on the AE source signal and outputs the signal to the signal processing unit 11.
信号処理部11は、AEセンサ10による処理が施されたAE源信号を入力とする。信号処理部11は、入力したAE源信号に対して、必要とされるノイズ除去、パラメータ抽出などの信号処理を行うことによって弾性波に関する情報を含むAE特徴量を抽出する。
弾性波に関する情報とは、例えば、AE源信号の振幅、エネルギー、立ち上がり時間、持続時間、周波数、ゼロクロスカウント数などの情報である。信号処理部11は、抽出したAE特徴量に基づく情報をAE信号として構造物評価装置20に出力する。信号処理部11が出力するAE信号には、センサID、AE検知時刻、AE源信号振幅、エネルギー、立ち上り時間および周波数などの情報が含まれる。 Thesignal processing unit 11 receives the AE source signal processed by the AE sensor 10 as an input. The signal processing unit 11 extracts an AE feature amount including information on an elastic wave by performing signal processing such as noise removal and parameter extraction required on the input AE source signal.
The information on the elastic wave is information such as the amplitude, energy, rise time, duration, frequency, zero cross count number, etc. of the AE source signal. Thesignal processing unit 11 outputs information based on the extracted AE feature amount to the structure evaluation apparatus 20 as an AE signal. The AE signal output from the signal processing unit 11 includes information such as sensor ID, AE detection time, AE source signal amplitude, energy, rise time, and frequency.
弾性波に関する情報とは、例えば、AE源信号の振幅、エネルギー、立ち上がり時間、持続時間、周波数、ゼロクロスカウント数などの情報である。信号処理部11は、抽出したAE特徴量に基づく情報をAE信号として構造物評価装置20に出力する。信号処理部11が出力するAE信号には、センサID、AE検知時刻、AE源信号振幅、エネルギー、立ち上り時間および周波数などの情報が含まれる。 The
The information on the elastic wave is information such as the amplitude, energy, rise time, duration, frequency, zero cross count number, etc. of the AE source signal. The
ここで、AE源信号の振幅は、例えば弾性波の中で最大振幅の値である。エネルギーは、例えば各時点において振幅を二乗したものを時間積分した値である。なお、エネルギーの定義は、上記例に限定されず、例えば波形の包絡線を用いて近似されたものでもよい。
立ち上がり時間は、例えば弾性波がゼロ値から予め設定される所定値を超えて立ち上がるまでの時間T1である。持続時間は、例えば弾性波の立ち上がり開始から振幅が予め設定される値よりも小さくなるまでの時間である。周波数は、弾性波の周波数である。ゼロクロスカウント数は、例えばゼロ値を通る基準線を弾性波が横切る回数である。 Here, the amplitude of the AE source signal is, for example, a maximum amplitude value among elastic waves. The energy is, for example, a value obtained by time integration of the square of the amplitude at each time point. The definition of energy is not limited to the above example, and may be approximated using, for example, a waveform envelope.
The rise time is, for example, a time T1 until the elastic wave rises from a zero value exceeding a predetermined value set in advance. The duration is, for example, the time from when the rise of the elastic wave starts until the amplitude becomes smaller than a preset value. The frequency is the frequency of the elastic wave. The zero cross count number is, for example, the number of times the elastic wave crosses a reference line passing through a zero value.
構造物評価装置20は、バスで接続されたCPU(Central Processing Unit)やメモリや補助記憶装置などを備え、評価プログラムを実行する。評価プログラムの実行によって、構造物評価装置20は、位置標定部201、速度演算部202、評価部203、表示部204を備える装置として機能する。なお、構造物評価装置20の各機能の全て又は一部は、ASIC(Application Specific Integrated Circuit)やPLD(ProgrammableLogic Device)やFPGA(Field Programmable Gate Array)等のハードウェアを用いて実現されてもよい。また、評価プログラムは、コンピュータ読み取り可能な記録媒体に記録されてもよい。コンピュータ読み取り可能な記録媒体とは、例えばフレキシブルディスク、光磁気ディスク、ROM、CD-ROM等の可搬媒体、コンピュータシステムに内蔵されるハードディスク等の記憶装置である。また、評価プログラムは、電気通信回線を介して送受信されてもよい。
The structure evaluation apparatus 20 includes a CPU (Central Processing Unit), a memory, an auxiliary storage device, and the like connected by a bus, and executes an evaluation program. By executing the evaluation program, the structure evaluation device 20 functions as a device including a position locating unit 201, a speed calculation unit 202, an evaluation unit 203, and a display unit 204. Note that all or a part of each function of the structure evaluation apparatus 20 may be realized by using hardware such as ASIC (Application Specific Integrated Circuit), PLD (Programmable Logic Device), and FPGA (Field Programmable Gate Array). . The evaluation program may be recorded on a computer-readable recording medium. The computer-readable recording medium is, for example, a portable medium such as a flexible disk, a magneto-optical disk, a ROM, a CD-ROM, or a storage device such as a hard disk built in the computer system. The evaluation program may be transmitted / received via a telecommunication line.
位置標定部201は、信号処理部11から出力されたAE信号を入力とする。また、位置標定部201は、構造物におけるAEセンサ10の設置位置に関する情報(以下、「センサ位置情報」という。)をセンサIDに対応付けて予め保持する。設置位置に関する情報は、例えば緯度および経度、あるいは構造物の特定位置からの水平方向および垂直方向の距離などである。位置標定部201は、入力されたAE信号に含まれるセンサID、AE検知時刻等の情報と、予め保持しているセンサ位置情報とに基づいてAE発生源の位置標定を行う。位置標定部201は、ある期間分の位置標定結果を用いて、AE震源密度分布(発信源分布)を導出する。AE震源密度分布は、構造物で発生した弾性波の発信源が示された分布を表す。位置標定部201は、導出したAE震源密度分布を評価部203に出力する。
The position locating unit 201 receives the AE signal output from the signal processing unit 11 as an input. In addition, the position locating unit 201 stores in advance information related to the installation position of the AE sensor 10 in the structure (hereinafter referred to as “sensor position information”) in association with the sensor ID. The information regarding the installation position is, for example, latitude and longitude, or distances in the horizontal and vertical directions from a specific position of the structure. The position locating unit 201 locates the AE generation source based on information such as sensor ID and AE detection time included in the input AE signal and sensor position information held in advance. The position location unit 201 derives the AE seismic source density distribution (source distribution) using the position location results for a certain period. The AE hypocenter density distribution represents a distribution in which the source of elastic waves generated in the structure is shown. The position location unit 201 outputs the derived AE seismic source density distribution to the evaluation unit 203.
速度演算部202は、信号処理部11から出力されたAE信号を入力とする。また、速度演算部202は、センサ位置情報をセンサIDに対応付けて予め保持する。速度演算部202は、入力されたAE信号に含まれるセンサID、AE検知時刻等の情報と、予め保持しているセンサ位置情報とに基づいて、構造物の弾性波伝搬速度分布を導出する。弾性波伝搬速度分布は、構造物で発生した弾性波の伝搬速度が示された分布を表す。例えば、速度演算部202は、AEトモグラフィ解析法を用いて構造物の弾性波伝搬速度分布を導出する。速度演算部202は、導出した弾性波伝搬速度分布を評価部203に出力する。
AEトモグラフィ解析法とは、構造物から発生した弾性波を複数のAEセンサで検知し、AE発生源の位置標定を行ない、その発生源から各センサまでの理論的な走査時間と計測された走査時間の誤差が許容値以内に収束するように、構造物の解析モデルの伝搬速度を補正し、構造物における弾性波伝搬速度の分布を得るものである。劣化した構造物ほど内部を進むAEの速度が低下するため、AEトモグラフィ解析法を用いることによってAEの速度分布から構造物内部の劣化度合いを評価できる。 The speed calculation unit 202 receives the AE signal output from thesignal processing unit 11 as an input. The speed calculation unit 202 holds the sensor position information in advance in association with the sensor ID. The velocity calculation unit 202 derives the elastic wave propagation velocity distribution of the structure based on information such as sensor ID and AE detection time included in the input AE signal and sensor position information held in advance. The elastic wave propagation velocity distribution represents a distribution in which the propagation velocity of the elastic wave generated in the structure is shown. For example, the velocity calculation unit 202 derives the elastic wave propagation velocity distribution of the structure using the AE tomography analysis method. The velocity calculation unit 202 outputs the derived elastic wave propagation velocity distribution to the evaluation unit 203.
The AE tomography analysis method detects the elastic wave generated from the structure with multiple AE sensors, locates the AE source, and measures the theoretical scanning time from the source to each sensor. The propagation speed of the analysis model of the structure is corrected so that the scanning time error converges within an allowable value, and the elastic wave propagation speed distribution in the structure is obtained. Since the speed of AE which advances inside is reduced as the structure is deteriorated, the degree of deterioration inside the structure can be evaluated from the speed distribution of AE by using the AE tomography analysis method.
AEトモグラフィ解析法とは、構造物から発生した弾性波を複数のAEセンサで検知し、AE発生源の位置標定を行ない、その発生源から各センサまでの理論的な走査時間と計測された走査時間の誤差が許容値以内に収束するように、構造物の解析モデルの伝搬速度を補正し、構造物における弾性波伝搬速度の分布を得るものである。劣化した構造物ほど内部を進むAEの速度が低下するため、AEトモグラフィ解析法を用いることによってAEの速度分布から構造物内部の劣化度合いを評価できる。 The speed calculation unit 202 receives the AE signal output from the
The AE tomography analysis method detects the elastic wave generated from the structure with multiple AE sensors, locates the AE source, and measures the theoretical scanning time from the source to each sensor. The propagation speed of the analysis model of the structure is corrected so that the scanning time error converges within an allowable value, and the elastic wave propagation speed distribution in the structure is obtained. Since the speed of AE which advances inside is reduced as the structure is deteriorated, the degree of deterioration inside the structure can be evaluated from the speed distribution of AE by using the AE tomography analysis method.
評価部203は、位置標定部201から出力されたAE震源密度分布と、速度演算部202から出力された弾性波伝搬速度分布とを入力とする。評価部203は、入力されたAE震源密度分布と、弾性波伝搬速度分布とに基づいて構造物の健全性を評価する。評価部203は、評価結果を表示部204に表示させる。
The evaluation unit 203 receives the AE seismic source density distribution output from the position location unit 201 and the elastic wave propagation velocity distribution output from the velocity calculation unit 202 as inputs. The evaluation unit 203 evaluates the soundness of the structure based on the input AE seismic source density distribution and elastic wave propagation velocity distribution. The evaluation unit 203 causes the display unit 204 to display the evaluation result.
表示部204は、液晶ディスプレイ、有機EL(Electro Luminescence)ディスプレイ等の画像表示装置である。表示部204は、評価部203の制御に従って評価結果を表示する。表示部204は、画像表示装置を構造物評価装置20に接続するためのインタフェースであってもよい。この場合、表示部204は、評価結果を表示するための映像信号を生成し、自身に接続されている画像表示装置に映像信号を出力する。
The display unit 204 is an image display device such as a liquid crystal display or an organic EL (Electro Luminescence) display. The display unit 204 displays the evaluation result according to the control of the evaluation unit 203. The display unit 204 may be an interface for connecting the image display device to the structure evaluation device 20. In this case, the display unit 204 generates a video signal for displaying the evaluation result, and outputs the video signal to an image display device connected to itself.
図2AはAE震源密度分布を表し、図2Bは弾性波伝搬速度分布を表す。なお、AE震源密度分布および弾性波伝搬速度分布は、同じ構造物の同じ領域に基づいて得られる分布である。図2A及び図2Bでは、ある道路の構造物の床版に15個のAEセンサ10を用いた結果を示している。図2Aにおいて、横軸と縦軸は評価対象となる構造物の特定位置からの水平方向の長さ(mm)と垂直方向の長さ(mm)を表す。また、図2Bにおいて、横軸と縦軸は評価対象となる構造物の特定位置からの水平方向の長さ(m)と垂直方向の長さ(m)を表す。
2A represents the AE source density distribution, and FIG. 2B represents the elastic wave propagation velocity distribution. The AE hypocenter density distribution and the elastic wave propagation velocity distribution are distributions obtained based on the same region of the same structure. 2A and 2B show the results of using 15 AE sensors 10 for a floor slab of a certain road structure. In FIG. 2A, the horizontal axis and the vertical axis represent the horizontal length (mm) and the vertical length (mm) from a specific position of the structure to be evaluated. In FIG. 2B, the horizontal axis and the vertical axis represent the horizontal length (m) and the vertical length (m) from a specific position of the structure to be evaluated.
図2Aでは、発信源が多いほど(発信源が密なほど)濃く表されており、発信源が少ないほど(発信源が疎なほど)薄く表されている。例えば、図2Aにおける領域30は発信源が他の領域よりも多い領域を表す。また、図2Bでは、伝搬速度が速いほど濃く表されており、伝搬速度が遅いほど薄く表されている。図2A及び図2Bに示すAE震源密度分布および弾性波伝搬速度分布が評価部203に入力される。
In FIG. 2A, the richer the source (the denser the source), the darker the color, and the fewer the source (the sparser the source), the thinner. For example, a region 30 in FIG. 2A represents a region where the number of transmission sources is larger than other regions. In FIG. 2B, the higher the propagation speed is, the darker it is, and the slower the propagation speed is, the thinner it is. The AE source density distribution and elastic wave propagation velocity distribution shown in FIGS. 2A and 2B are input to the evaluation unit 203.
以下、図3A、図3Bおよび図4を用いて、評価部203の具体的な処理について説明する。
評価部203は、入力されたAE震源密度分布を、発信源の密度に関する基準値(以下、「密度基準値」という。)に基づいて、発信源が疎な領域と、発信源が密な領域の二つの領域に区分けする。具体的には、評価部203は、AE震源密度分布を密度基準値に基づいて、二値化することによって領域を区分けする。本実施形態では、密度基準値を0.5としている。評価部203は、AE震源密度分布において、密度基準値以上の領域を発信源が密な領域とし、密度基準値よりも密度が少ない領域を発信源が疎な領域として、二値化することによって領域を区分けする。なお、密度基準値は、上記の値に限定される必要はなく、適宜変更されてもよい。 Hereinafter, specific processing of theevaluation unit 203 will be described with reference to FIGS. 3A, 3 </ b> B, and 4.
Theevaluation unit 203 uses the input AE seismic source density distribution based on a reference value related to the density of the transmission source (hereinafter referred to as “density reference value”) and a region where the transmission source is sparse and a region where the transmission source is dense. It is divided into two areas. Specifically, the evaluation unit 203 classifies the region by binarizing the AE hypocenter density distribution based on the density reference value. In this embodiment, the density reference value is set to 0.5. In the AE seismic source density distribution, the evaluation unit 203 binarizes an area that is equal to or higher than the density reference value as an area where the transmission source is dense, and an area where the density is lower than the density reference value as an area where the transmission source is sparse. Divide the area. The density reference value is not necessarily limited to the above value, and may be changed as appropriate.
評価部203は、入力されたAE震源密度分布を、発信源の密度に関する基準値(以下、「密度基準値」という。)に基づいて、発信源が疎な領域と、発信源が密な領域の二つの領域に区分けする。具体的には、評価部203は、AE震源密度分布を密度基準値に基づいて、二値化することによって領域を区分けする。本実施形態では、密度基準値を0.5としている。評価部203は、AE震源密度分布において、密度基準値以上の領域を発信源が密な領域とし、密度基準値よりも密度が少ない領域を発信源が疎な領域として、二値化することによって領域を区分けする。なお、密度基準値は、上記の値に限定される必要はなく、適宜変更されてもよい。 Hereinafter, specific processing of the
The
また、評価部203は、入力された弾性波伝搬速度分布を、弾性波の伝搬速度に関する基準値(以下、「伝搬速度基準値」という。)に基づいて、伝搬速度が高い領域と、伝搬速度が低い領域の二つの領域に区分けする。具体的には、評価部203は、弾性波伝搬速度分布を伝搬速度基準値に基づいて、二値化することによって領域を区分けする。本実施形態では、伝搬速度基準値を3800m/sとしている。評価部203は、弾性波伝搬速度分布において、伝搬速度基準値以上の領域を伝搬速度が高い領域とし、伝搬速度基準値よりも伝搬速度が遅い領域を伝搬速度が低い領域として、二値化することによって領域を区分けする。なお、伝搬速度基準値は、上記の値に限定される必要はなく、適宜変更されてもよい。
Further, the evaluation unit 203 uses the input elastic wave propagation velocity distribution based on a reference value related to the propagation velocity of the elastic wave (hereinafter referred to as “propagation velocity reference value”), a region having a high propagation velocity, and a propagation velocity. It is divided into two areas of low area. Specifically, the evaluation unit 203 classifies the region by binarizing the elastic wave propagation velocity distribution based on the propagation velocity reference value. In this embodiment, the propagation speed reference value is 3800 m / s. In the elastic wave propagation velocity distribution, the evaluation unit 203 binarizes a region having a propagation velocity higher than the propagation velocity reference value as a region having a higher propagation velocity and a region having a propagation velocity lower than the propagation velocity reference value as a region having a lower propagation velocity. To divide the area. The propagation speed reference value is not necessarily limited to the above value, and may be changed as appropriate.
図3AはAE震源密度分布の領域の区分け結果を表し、図3Bは弾性波伝搬速度分布の領域の区分け結果を表す。以下、図3Aに示す図を二値化AE震源密度分布と記載し、図3Bに示す図を二値化弾性波伝搬速度分布と記載する。
3A shows the segmentation result of the AE source density distribution region, and FIG. 3B shows the segmentation result of the elastic wave propagation velocity distribution region. Hereinafter, the diagram shown in FIG. 3A is described as a binarized AE source density distribution, and the diagram shown in FIG. 3B is described as a binarized elastic wave propagation velocity distribution.
その後、評価部203は、二値化AE震源密度分布と、二値化弾性波伝搬速度分布とを用いて構造物の健全性を評価する。具体的には、評価部203は、二値化AE震源密度分布と、二値化弾性波伝搬速度分布とを重ね合わせることによって、重ね合った領域の区分け結果に応じて構造物の健全性を4段階で評価する。ここで、4段階の評価の具体例として、健全、中間劣化I、中間劣化IIおよび限界劣化が挙げられる。健全、中間劣化I、中間劣化IIおよび限界劣化の順に、構造物の劣化が進行していることを表す。すなわち、健全は構造物の劣化が最も進行していないことを表し、限界劣化に近づくにつれて構造物の劣化が進行していることを表す。評価部203は、以下の評価条件に基づいて、構造物の各領域(重ね合った各領域)がそれぞれ健全、中間劣化I、中間劣化II及び限界劣化のいずれに相当するのかを評価する。
Thereafter, the evaluation unit 203 evaluates the soundness of the structure using the binarized AE seismic source density distribution and the binarized elastic wave propagation velocity distribution. Specifically, the evaluation unit 203 superimposes the binarized AE seismic source density distribution and the binarized elastic wave propagation velocity distribution on the soundness of the structure in accordance with the segmented result of the overlapped region. Assess in 4 stages. Here, specific examples of the four-stage evaluation include soundness, intermediate deterioration I, intermediate deterioration II, and limit deterioration. It shows that the deterioration of the structure progresses in the order of soundness, intermediate deterioration I, intermediate deterioration II, and limit deterioration. That is, sound means that the deterioration of the structure is least advanced, and that the deterioration of the structure is progressing as it approaches the limit deterioration. The evaluation unit 203 evaluates whether each region (each overlapped region) of the structure corresponds to sound, intermediate deterioration I, intermediate deterioration II, or limit deterioration based on the following evaluation conditions.
(評価条件)
・健全:二値化AE震源密度分布で“疎”の領域、かつ、二値化弾性波伝搬速度分布で“高”の領域
・中間劣化I:二値化AE震源密度分布で“密”の領域、かつ、二値化弾性波伝搬速度分布で“高”の領域
・中間劣化II:二値化AE震源密度分布で“密”の領域、かつ、二値化弾性波伝搬速度分布で“低”の領域
・限界劣化:二値化AE震源密度分布で“疎”の領域、かつ、二値化弾性波伝搬速度分布で“低”の領域 (Evaluation conditions)
・ Sound: binarized AE source density distribution “sparse” region, binarized elastic wave propagation velocity distribution “high” region ・ Intermediate deterioration I: binarized AE source density distribution “dense” Region and “High” region in binarized elastic wave propagation velocity distribution ・ Intermediate deterioration II: “Dense” region in binarized AE source density distribution and “Low” in binarized elastic wave propagation velocity distribution "Area" and critical degradation: "Sparse" area in binarized AE source density distribution and "Low" area in binarized elastic wave propagation velocity distribution
上記のように、評価部203は、重ね合った領域が、発信源が疎な領域であり、かつ、伝搬速度が高い領域の場合には、その領域を健全な領域と評価する。また、評価部203は、重ね合った領域が、発信源が密な領域であり、かつ、伝搬速度が高い領域の場合には、その領域を中間劣化Iの領域と評価する。また、評価部203は、重ね合った領域が、発信源が密な領域であり、かつ、伝搬速度が低い領域の場合には、その領域を中間劣化IIの領域と評価する。また、評価部203は、重ね合った領域が、発信源が疎な領域であり、かつ、伝搬速度が低い領域の場合には、その領域を限界劣化の領域と評価する。
As described above, when the overlapping region is a region where the transmission source is sparse and the propagation speed is high, the evaluation unit 203 evaluates the region as a healthy region. In addition, when the overlapping region is a region where the transmission sources are dense and the propagation speed is high, the evaluation unit 203 evaluates the region as a region of intermediate degradation I. Further, when the overlapping region is a region where the transmission sources are dense and the propagation speed is low, the evaluation unit 203 evaluates the region as a region of intermediate degradation II. In addition, when the overlapped area is an area where the transmission source is sparse and the propagation speed is low, the evaluation unit 203 evaluates the area as a marginal deterioration area.
評価部203は、上記のように、重ね合った各領域がそれぞれ健全、中間劣化I、中間劣化II及び限界劣化のいずれに相当するのかを評価することによって、各領域の評価結果が示された評価結果分布を導出する。例えば、評価部203は、評価結果分布において、健全な領域を“1”で表し、中間劣化Iの領域を“2”で表し、中間劣化IIの領域を“3”で表し、限界劣化の領域を“4”で表してもよい。評価部203は、導出した評価結果分布を表示部204に表示させる。
As described above, the evaluation unit 203 evaluates whether each of the overlapped regions corresponds to sound, intermediate deterioration I, intermediate deterioration II, and limit deterioration, and the evaluation result of each region is indicated. The evaluation result distribution is derived. For example, in the evaluation result distribution, the evaluation unit 203 represents a healthy region by “1”, an intermediate degradation I region by “2”, an intermediate degradation II region by “3”, and a marginal degradation region. May be represented by “4”. The evaluation unit 203 causes the display unit 204 to display the derived evaluation result distribution.
図4は、評価結果分布の一例を示す図である。図4に示すように、評価結果分布が表示されることによって、作業者や管理者は構造物のどの領域の劣化が進んでいるのかを容易に把握することができる。
FIG. 4 is a diagram showing an example of the evaluation result distribution. As shown in FIG. 4, by displaying the evaluation result distribution, the worker or the administrator can easily grasp which region of the structure is being deteriorated.
図5は、評価結果の妥当性の検証結果を示す図である。図5には、図4に示した構造物の床版の内部を採取して確認した結果が示されている。図4において、限界劣化であることを表す“4”の領域内の丸印31の部分から採取したコアサンプルが図5(A)である。図5(A)に示すように、コアサンプル内部は、水平ひび割れによりコアが分離するほどの劣化進展が見てとれる。それに対して、図4において、健全であることを表す“1”の領域内の丸印32の部分から採取したコアサンプルが図5(B)である。図5(B)に示すように、コアサンプル内部は、目視ではひび割れは確認されない。このように、構造物評価装置20による評価手法の有効性が確認された。
FIG. 5 is a diagram showing a verification result of the validity of the evaluation result. FIG. 5 shows the result of collecting and confirming the inside of the floor slab of the structure shown in FIG. In FIG. 4, a core sample taken from the portion indicated by a circle 31 in the region “4” indicating the limit deterioration is shown in FIG. As shown in FIG. 5A, the progress of deterioration inside the core sample can be seen to the extent that the core is separated by horizontal cracks. On the other hand, in FIG. 4, the core sample taken from the portion of the circle 32 in the region “1” representing the sound is FIG. 5B. As shown in FIG. 5B, no cracks are visually confirmed inside the core sample. Thus, the effectiveness of the evaluation method by the structure evaluation apparatus 20 was confirmed.
図6は、構造物評価システム100の処理の流れを示すシーケンス図である。なお、図6では、各AEセンサ10と信号処理部11とをセンサユニットとしている。
各AEセンサ10は、構造物が発生する弾性波(AE波)を検出する(ステップS101)。AEセンサ10は、検出した弾性波を電圧信号(AE源信号)に変換し、AE源信号に対して増幅、周波数制限などの処理を施して信号処理部11に出力する。信号処理部11は、入力したAE源信号に対して、必要とされるノイズ除去、パラメータ抽出などの信号処理を行う(ステップS102)。信号処理部11は、信号処理を行うことによって抽出されるAE特徴量に基づく情報をAE信号として構造物評価装置20に出力する(ステップS103)。ステップS101~ステップS103の処理は、所定の期間実行される。 FIG. 6 is a sequence diagram illustrating a processing flow of thestructure evaluation system 100. In FIG. 6, each AE sensor 10 and the signal processing unit 11 are sensor units.
EachAE sensor 10 detects an elastic wave (AE wave) generated by the structure (step S101). The AE sensor 10 converts the detected elastic wave into a voltage signal (AE source signal), performs processing such as amplification and frequency limitation on the AE source signal, and outputs the signal to the signal processing unit 11. The signal processing unit 11 performs signal processing such as necessary noise removal and parameter extraction on the input AE source signal (step S102). The signal processing unit 11 outputs information based on the AE feature amount extracted by performing signal processing to the structure evaluation apparatus 20 as an AE signal (step S103). Steps S101 to S103 are executed for a predetermined period.
各AEセンサ10は、構造物が発生する弾性波(AE波)を検出する(ステップS101)。AEセンサ10は、検出した弾性波を電圧信号(AE源信号)に変換し、AE源信号に対して増幅、周波数制限などの処理を施して信号処理部11に出力する。信号処理部11は、入力したAE源信号に対して、必要とされるノイズ除去、パラメータ抽出などの信号処理を行う(ステップS102)。信号処理部11は、信号処理を行うことによって抽出されるAE特徴量に基づく情報をAE信号として構造物評価装置20に出力する(ステップS103)。ステップS101~ステップS103の処理は、所定の期間実行される。 FIG. 6 is a sequence diagram illustrating a processing flow of the
Each
位置標定部201は、信号処理部11から出力されたAE信号と、予め保持しているセンサ位置情報とに基づいてAE発生源の位置標定を行う(ステップS104)。位置標定部201は、ステップS104の処理を所定の期間分実行する。そして、位置標定部201は、所定の期間分の位置標定結果を用いて、AE震源密度分布を導出する(ステップS105)。位置標定部201は、導出したAE震源密度分布を評価部203に出力する。
The position location unit 201 locates the AE generation source based on the AE signal output from the signal processing unit 11 and sensor position information held in advance (step S104). The position location unit 201 performs the process of step S104 for a predetermined period. And the position location part 201 derives | leads-out AE seismic-source density distribution using the position location result for a predetermined period (step S105). The position location unit 201 outputs the derived AE seismic source density distribution to the evaluation unit 203.
速度演算部202は、信号処理部11から出力されたAE信号に基づいて、構造物の弾性波伝搬速度分布を導出する(ステップS106)。例えば、速度演算部202は、所定の期間分のAE信号を用いて弾性波伝搬速度分布を導出してもよいし、所定の期間よりも短い期間分のAE信号を用いて弾性波伝搬速度分布を導出してもよい。速度演算部202は、導出した弾性波伝搬速度分布を評価部203に出力する。なお、ステップS105とステップS106は順不同である。
The velocity calculation unit 202 derives the elastic wave propagation velocity distribution of the structure based on the AE signal output from the signal processing unit 11 (step S106). For example, the velocity calculation unit 202 may derive an elastic wave propagation velocity distribution using an AE signal for a predetermined period, or an elastic wave propagation velocity distribution using an AE signal for a period shorter than the predetermined period. May be derived. The velocity calculation unit 202 outputs the derived elastic wave propagation velocity distribution to the evaluation unit 203. Note that step S105 and step S106 are in no particular order.
評価部203は、位置標定部201から出力されたAE震源密度分布と、速度演算部202から出力された弾性波伝搬速度分布とを用いてそれぞれ二値化することによって二値化AE震源密度分布と、二値化弾性波伝搬速度分布とを導出する(ステップS107)。
評価部203は、導出した二値化AE震源密度分布と、二値化弾性波伝搬速度分布とを用いて、評価条件に基づいて構造物の各領域を評価することによって評価結果分布を導出する(ステップS108)。評価部203は、導出した評価結果分布を表示部204に表示させる。表示部204は、評価部203の制御に従って評価結果分布を表示する(ステップS109)。 Theevaluation unit 203 binarizes the AE source density distribution output from the position location unit 201 and the elastic wave propagation velocity distribution output from the velocity calculation unit 202, thereby binarizing the AE source density distribution. And a binarized elastic wave propagation velocity distribution are derived (step S107).
Theevaluation unit 203 derives the evaluation result distribution by evaluating each region of the structure based on the evaluation condition using the derived binarized AE seismic source density distribution and the binarized elastic wave propagation velocity distribution. (Step S108). The evaluation unit 203 causes the display unit 204 to display the derived evaluation result distribution. The display unit 204 displays the evaluation result distribution according to the control of the evaluation unit 203 (step S109).
評価部203は、導出した二値化AE震源密度分布と、二値化弾性波伝搬速度分布とを用いて、評価条件に基づいて構造物の各領域を評価することによって評価結果分布を導出する(ステップS108)。評価部203は、導出した評価結果分布を表示部204に表示させる。表示部204は、評価部203の制御に従って評価結果分布を表示する(ステップS109)。 The
The
図7は、本実施形態における構造物評価装置20による健全性の評価の基本概念を示す図である。図7に示すように、本実施形態における構造物評価装置20では、弾性波伝搬速度の高低、AE震源密度の疎密をそれぞれ2次元の評価軸として4象限に区分けする。
そして、構造物評価装置20は、評価条件に基づいて区分けされた4象限においてそれぞれ、健全、中間劣化I、中間劣化II及び限界劣化と区分けする。ここで、従来の評価方法と本実施形態における評価方法とを比較する。 FIG. 7 is a diagram showing a basic concept of soundness evaluation by thestructure evaluation apparatus 20 in the present embodiment. As shown in FIG. 7, in the structure evaluation apparatus 20 in this embodiment, the level of elastic wave propagation speed and the density of AE seismic source density are each divided into four quadrants using a two-dimensional evaluation axis.
And thestructure evaluation apparatus 20 classify | categorizes into healthy, intermediate | middle deterioration I, intermediate | middle deterioration II, and limit deterioration, respectively in four quadrants divided based on evaluation conditions. Here, the conventional evaluation method and the evaluation method in this embodiment are compared.
そして、構造物評価装置20は、評価条件に基づいて区分けされた4象限においてそれぞれ、健全、中間劣化I、中間劣化II及び限界劣化と区分けする。ここで、従来の評価方法と本実施形態における評価方法とを比較する。 FIG. 7 is a diagram showing a basic concept of soundness evaluation by the
And the
図8AはAE震源位置標定のみによる評価を表し、図8Bは伝搬速度のみによる評価を表す。図8Aに示すようにAE震源位置標定のみによる評価では、AE震源が疎から密になるほど構造物が劣化している可能性が高いことが表されている。また、図8Bに示すように伝搬速度のみによる評価では、伝搬速度が低くなるほど構造物が劣化している可能性が高いことが表されている。
Fig. 8A shows the evaluation based only on the AE hypocenter location, and Fig. 8B shows the evaluation based only on the propagation velocity. As shown in FIG. 8A, the evaluation based only on the AE seismic source location indicates that the possibility that the structure is deteriorated is higher as the AE seismic source is sparser and denser. Moreover, as shown in FIG. 8B, the evaluation based only on the propagation speed indicates that the possibility that the structure is deteriorated is higher as the propagation speed is lower.
図9は、図8A及び図8Bに示した従来の2つの評価方法を組み合わせたと仮定した場合の評価結果の一例を示す図である。図9に示すように、従来の2つの評価方法を単に組み合わせると、弾性波伝搬速度がある基準より高く、かつ、AE震源密度分布が疎な領域(発信源が疎な領域)が健全となり、弾性波伝搬速度がある基準より低く、かつ、AE震源密度分布が密(発信源が密)になるほど構造物の劣化が進み、限界劣化に至る、直線的な変化となることが想定される。これは、限界劣化状態の構造物で、AE震源密度分布が疎になることや、劣化がある程度進んだ構造物でも弾性波伝搬速度が健全状態と略同等に高いことが実験的に確認されたことから必ずしも正しい評価指標となっていない。それに対して、図7に示した本実施形態における構造物評価装置20による健全性の評価の基本概念では、図5に示した評価結果の妥当性の検証結果を見ても分かる通り、正しい評価指標となっていると言える。
FIG. 9 is a diagram illustrating an example of an evaluation result when it is assumed that the conventional two evaluation methods illustrated in FIGS. 8A and 8B are combined. As shown in FIG. 9, when two conventional evaluation methods are simply combined, the region where the elastic wave propagation velocity is higher than a certain standard and the AE source density distribution is sparse (region where the source is sparse) becomes healthy. As the elastic wave propagation velocity is lower than a certain standard and the AE seismic source density distribution is denser (the source is denser), it is assumed that the deterioration of the structure progresses and becomes a linear change that leads to marginal deterioration. This is experimentally confirmed that the AE seismic density distribution is sparse in structures that are in a critically deteriorated state, and that the elastic wave propagation velocity is almost as high as in a healthy state even in structures that have advanced to some extent. Therefore, it is not necessarily a correct evaluation index. On the other hand, in the basic concept of the soundness evaluation by the structure evaluation apparatus 20 in the present embodiment shown in FIG. 7, the correct evaluation is performed as seen from the verification result of the validity of the evaluation result shown in FIG. It can be said that it is an indicator.
以上のように構成された構造物評価システム100によれば、弾性波を発生する構造物の健全性の評価を行うことが可能になる。以下、この効果について詳細に説明する。
構造物評価装置20は、複数のAEセンサ10それぞれによって検出された弾性波から得られるAE震源密度分布と、弾性波伝搬速度分布とを用いて、評価条件に基づいて構造物の健全性を評価する。このように、本実施形態における構造物評価装置20は、AE震源密度分布と、弾性波伝搬速度分布を組み合わせることによって構造物を領域毎に劣化レベルを評価することができる。そのため、弾性波を発生する構造物の健全性の評価を行うことが可能になる。また、構造物評価装置20は、弾性波から得られる1つの情報ではなく、複数の情報を用いることによってより精度の高い評価を行うことができる。 According to thestructure evaluation system 100 configured as described above, it is possible to evaluate the soundness of a structure that generates elastic waves. Hereinafter, this effect will be described in detail.
Thestructure evaluation apparatus 20 evaluates the soundness of the structure based on the evaluation conditions using the AE hypocenter density distribution obtained from the elastic waves detected by each of the plurality of AE sensors 10 and the elastic wave propagation velocity distribution. To do. As described above, the structure evaluation apparatus 20 in this embodiment can evaluate the deterioration level of the structure for each region by combining the AE seismic source density distribution and the elastic wave propagation velocity distribution. Therefore, it is possible to evaluate the soundness of a structure that generates elastic waves. Moreover, the structure evaluation apparatus 20 can perform more accurate evaluation by using a plurality of pieces of information instead of one piece of information obtained from elastic waves.
構造物評価装置20は、複数のAEセンサ10それぞれによって検出された弾性波から得られるAE震源密度分布と、弾性波伝搬速度分布とを用いて、評価条件に基づいて構造物の健全性を評価する。このように、本実施形態における構造物評価装置20は、AE震源密度分布と、弾性波伝搬速度分布を組み合わせることによって構造物を領域毎に劣化レベルを評価することができる。そのため、弾性波を発生する構造物の健全性の評価を行うことが可能になる。また、構造物評価装置20は、弾性波から得られる1つの情報ではなく、複数の情報を用いることによってより精度の高い評価を行うことができる。 According to the
The
以下、構造物評価装置20の変形例について説明する。
構造物評価装置20が備える各機能部は、一部又は全てが別の筺体に備えられていてもよい。例えば、構造物評価装置20が評価部203のみを備えて、位置標定部201、速度演算部202および表示部204が別の筺体に備えられてもよい。このように構成される場合、評価部203は、AE震源密度分布と弾性波伝搬速度分布とを別の筺体から取得し、取得したAE震源密度分布と弾性波伝搬速度分布とを用いて構造物の健全性を評価する。そして、評価部203は、評価結果を別の筺体が備える表示部204に出力する。
このように構成されることによって、AE震源密度分布および弾性波伝搬速度分布の導出に既存の装置を用いることによって、構造物評価装置20の製造コストを抑えることができる。 Hereinafter, modified examples of thestructure evaluation apparatus 20 will be described.
A part or all of the functional units included in thestructure evaluation apparatus 20 may be included in another casing. For example, the structure evaluation apparatus 20 may include only the evaluation unit 203, and the position location unit 201, the speed calculation unit 202, and the display unit 204 may be provided in another casing. When comprised in this way, the evaluation part 203 acquires AE seismic source density distribution and elastic wave propagation velocity distribution from another housing, and uses the acquired AE seismic source density distribution and elastic wave propagation velocity distribution for a structure. Assess the health of And the evaluation part 203 outputs an evaluation result to the display part 204 with which another housing is provided.
By being configured in this manner, the manufacturing cost of thestructure evaluation apparatus 20 can be suppressed by using an existing apparatus for deriving the AE seismic source density distribution and the elastic wave propagation velocity distribution.
構造物評価装置20が備える各機能部は、一部又は全てが別の筺体に備えられていてもよい。例えば、構造物評価装置20が評価部203のみを備えて、位置標定部201、速度演算部202および表示部204が別の筺体に備えられてもよい。このように構成される場合、評価部203は、AE震源密度分布と弾性波伝搬速度分布とを別の筺体から取得し、取得したAE震源密度分布と弾性波伝搬速度分布とを用いて構造物の健全性を評価する。そして、評価部203は、評価結果を別の筺体が備える表示部204に出力する。
このように構成されることによって、AE震源密度分布および弾性波伝搬速度分布の導出に既存の装置を用いることによって、構造物評価装置20の製造コストを抑えることができる。 Hereinafter, modified examples of the
A part or all of the functional units included in the
By being configured in this manner, the manufacturing cost of the
信号処理部11は、構造物評価装置20に備えられてもよい。このように構成される場合、信号処理部11は、AEセンサ10による処理が施されたAE源信号を、AEセンサ10から直接、又は、不図示の中継装置を介して取得する。
図1では、複数のAEセンサ10-1~10-nに1台の信号処理部11が接続されているが、構造物評価システム100は複数台の信号処理部11を備え、各AEセンサ10にそれぞれ信号処理部11が接続されて複数台のセンサユニットを備えるように構成されてもよい。 Thesignal processing unit 11 may be provided in the structure evaluation apparatus 20. When configured in this manner, the signal processing unit 11 acquires the AE source signal that has been processed by the AE sensor 10 directly from the AE sensor 10 or via a relay device (not shown).
In FIG. 1, onesignal processing unit 11 is connected to a plurality of AE sensors 10-1 to 10-n. However, the structure evaluation system 100 includes a plurality of signal processing units 11, and each AE sensor 10 The signal processing unit 11 may be connected to each of the plurality of sensor units, and a plurality of sensor units may be provided.
図1では、複数のAEセンサ10-1~10-nに1台の信号処理部11が接続されているが、構造物評価システム100は複数台の信号処理部11を備え、各AEセンサ10にそれぞれ信号処理部11が接続されて複数台のセンサユニットを備えるように構成されてもよい。 The
In FIG. 1, one
本実施形態では、速度演算部202が弾性波伝搬速度分布を導出する構成を示したが、これに限定される必要はない。例えば、速度演算部202は、図2Aに示すAE震源密度分布において所定の閾値以上の密度の領域における速度、又は、所定の閾値未満の密度の領域における速度を導出するように構成されてもよい。このように構成される場合、評価部203は、位置標定部201によって導出されたAE震源密度分布と、速度演算部202によって導出された速度とを用いて構造物の健全性を評価する。
In the present embodiment, the configuration in which the velocity calculation unit 202 derives the elastic wave propagation velocity distribution is shown, but the present invention is not limited to this. For example, the velocity calculation unit 202 may be configured to derive a velocity in a region having a density equal to or higher than a predetermined threshold in the AE source density distribution illustrated in FIG. 2A or a velocity in a region having a density lower than the predetermined threshold. . When comprised in this way, the evaluation part 203 evaluates the soundness of a structure using the AE hypocenter density distribution derived | led-out by the position location part 201, and the speed derived | led-out by the speed calculating part 202. FIG.
また、評価部203は、出力制御部として動作してもよい。出力制御部は、出力部を制御して、評価結果を出力する。ここで、出力部には、表示部204、通信部および印刷部が含まれる。出力部が通信部である場合、出力制御部は通信部を制御して、評価結果を他の装置に送信する。また、出力部が印刷部である場合、出力制御部は印刷部を制御して、評価結果を印刷する。なお、構造物評価装置20は、出力部として、表示部204、通信部および印刷部の一部又は全てを備えて上記の動作を実行してもよい。
Further, the evaluation unit 203 may operate as an output control unit. The output control unit controls the output unit and outputs an evaluation result. Here, the output unit includes a display unit 204, a communication unit, and a printing unit. When the output unit is a communication unit, the output control unit controls the communication unit and transmits the evaluation result to another device. When the output unit is a printing unit, the output control unit controls the printing unit to print the evaluation result. In addition, the structure evaluation apparatus 20 may include the display unit 204, the communication unit, and a part or all of the printing unit as an output unit, and execute the above operation.
位置標定部201は、AEの第一到達波の振幅が所定の閾値以上の発信源から発生したAEの情報のみを用いてAE震源密度分布を導出してもよい。例えば、位置標定部201は、AEの第一到達波の振幅が60dB以上の発信源から発生したAEの情報のみを用いてAE震源密度分布を導出してもよい。図10A及び図10Bを用いて、具体的に説明する。図10AはAEの第一到達波の振幅が53dB以上の発信源から発生したAEの情報を用いて導出したAE震源密度分布であり、図10BはAEの第一到達波の振幅が60dB以上の発信源から発生したAEの情報を用いて導出したAE震源密度分布である。図5の妥当性の検証結果を鑑みると、図10Bのようにある一定振幅以上の発信源から発生したAEの情報のみを用いることで、より精度の高い評価を行うことが可能になる。したがって、このように構成されることによって、効果的な劣化診断に寄与することが可能になる。なお、第一到達波とは、構造物で起こったある弾性波発生事象(イベントという)を複数のAEセンサで検知した場合、最初にAEセンサに到達した弾性波のことを言う。
The position locating unit 201 may derive the AE seismic source density distribution using only the information on the AE generated from the transmission source in which the amplitude of the first arrival wave of the AE is equal to or greater than a predetermined threshold. For example, the position location unit 201 may derive the AE seismic source density distribution using only information on the AE generated from a transmission source having an amplitude of the first arrival wave of AE of 60 dB or more. This will be specifically described with reference to FIGS. 10A and 10B. FIG. 10A is an AE source density distribution derived using AE information generated from a source with an AE first arrival wave having an amplitude of 53 dB or more, and FIG. 10B is an AE first arrival wave having an amplitude of 60 dB or more. This is the AE seismic source density distribution derived using information on AE generated from the source. In view of the validity verification result of FIG. 5, it becomes possible to perform more accurate evaluation by using only information on AE generated from a transmission source having a certain amplitude or more as shown in FIG. 10B. Therefore, with this configuration, it is possible to contribute to effective deterioration diagnosis. The first arrival wave means an elastic wave that first reaches the AE sensor when a plurality of AE sensors detect an elastic wave generation event (event) that has occurred in the structure.
図11は、図7に示した基本概念の別例を示す図である。図11に示す例では、図7の区分けに加えて、構造物建造、補修直後の初期段階に当たる「初期」フェーズが追加されている。これは、構造物の建設、製造後の初期状態において初めて荷重が掛かったときに、発信源が多量に観測される状況を表している。これは直ちに構造物の劣化進行を示すものではなく、構造物が自身の経験する初めての荷重に対する応答を示すもので、その後は、既往の荷重に対してはAEの発生が少なくなっていく。したがって、図7の健全フェーズの前段階と位置付けられ、初期フェーズの後は、発信源の減少と共に健全フェーズへと移行していくことを表している。例えば、図11に示す例は、構造物の建造、補修直後に健全性の評価を行う場合に考慮すべきフェーズである。
FIG. 11 is a diagram showing another example of the basic concept shown in FIG. In the example shown in FIG. 11, in addition to the division of FIG. 7, an “initial” phase corresponding to an initial stage immediately after construction and repair of a structure is added. This represents a situation where a large amount of transmission sources are observed when a load is applied for the first time in the initial state after construction and manufacture of the structure. This does not immediately indicate the progress of deterioration of the structure, but shows the response of the structure to the first load experienced by the structure. Thereafter, the occurrence of AE is reduced with respect to the existing load. Therefore, it is positioned as a pre-stage of the healthy phase in FIG. 7, and after the initial phase, represents a transition to the healthy phase as the number of transmission sources decreases. For example, the example shown in FIG. 11 is a phase that should be taken into consideration when the soundness is evaluated immediately after the construction and repair of the structure.
以上説明した少なくともひとつの実施形態によれば、構造物より発生した弾性波を検出する複数のAEセンサ10と、AEセンサ10によって検出された弾性波に対して信号処理を行うことによって弾性波に関する情報を含むAE信号を抽出する信号処理部11と、AE信号に基づいて発信源分布を導出する位置標定部201と、AE信号に基づいて伝搬速度を導出する速度演算部202と、発信源分布と、伝搬速度とに基づいて、構造物の健全性を評価する評価部203とを持つことにより、弾性波を発生する構造物の健全性の評価を行うことができる。
According to at least one embodiment described above, a plurality of AE sensors 10 for detecting elastic waves generated from a structure, and signal processing on the elastic waves detected by the AE sensor 10 to perform processing on the elastic waves. A signal processing unit 11 for extracting an AE signal including information; a position locating unit 201 for deriving a source distribution based on the AE signal; a speed calculating unit 202 for deriving a propagation speed based on the AE signal; and a source distribution By having the evaluation unit 203 that evaluates the soundness of the structure based on the propagation speed, the soundness of the structure that generates elastic waves can be evaluated.
本発明のいくつかの実施形態を説明したが、これらの実施形態は、例として提示したものであり、発明の範囲を限定することは意図していない。これら実施形態は、その他の様々な形態で実施されることが可能であり、発明の要旨を逸脱しない範囲で、種々の省略、置き換え、変更を行うことができる。これら実施形態やその変形は、発明の範囲や要旨に含まれると同様に、特許請求の範囲に記載された発明とその均等の範囲に含まれるものである。
Although several embodiments of the present invention have been described, these embodiments are presented as examples and are not intended to limit the scope of the invention. These embodiments can be implemented in various other forms, and various omissions, replacements, and changes can be made without departing from the spirit of the invention. These embodiments and their modifications are included in the scope and gist of the invention, and are also included in the invention described in the claims and the equivalents thereof.
10(10-1~10-n)…AEセンサ,11…信号処理部,20…構造物評価装置,201…位置標定部,202…速度演算部,203…評価部,204…表示部
DESCRIPTION OF SYMBOLS 10 (10-1-10-n) ... AE sensor, 11 ... Signal processing part, 20 ... Structure evaluation apparatus, 201 ... Position location part, 202 ... Speed calculating part, 203 ... Evaluation part, 204 ... Display part
Claims (10)
- 構造物より発生した弾性波を検出する複数のAEセンサと、
前記AEセンサによって検出された前記弾性波に対して信号処理を行うことによって前記弾性波に関する情報を含むAE信号を抽出する信号処理部と、
前記AE信号に基づいて、前記構造物で発生した前記弾性波の発信源の分布を表す発信源分布を導出する位置標定部と、
前記AE信号に基づいて、前記構造物で発生した前記弾性波の伝搬速度を導出する速度演算部と、
前記発信源分布と、前記弾性波の伝搬速度とに基づいて、前記構造物の健全性を評価する評価部と、
を備える構造物評価システム。 A plurality of AE sensors for detecting elastic waves generated from the structure;
A signal processing unit for extracting an AE signal including information on the elastic wave by performing signal processing on the elastic wave detected by the AE sensor;
A position locating unit for deriving a source distribution representing a distribution of the source of the elastic wave generated in the structure based on the AE signal;
Based on the AE signal, a speed calculation unit for deriving a propagation speed of the elastic wave generated in the structure;
An evaluation unit that evaluates the soundness of the structure based on the transmission source distribution and the propagation speed of the elastic wave;
A structure evaluation system comprising: - 前記評価部は、前記発信源の密度に関する基準値に基づいて前記発信源分布を前記発信源が疎な領域と前記発信源が密な領域との二つの領域に区分けし、前記発信源が疎な領域であり、かつ、前記弾性波の伝搬速度に関する基準値より前記弾性波の伝搬速度が低い領域を最も構造物の劣化が進行している領域と評価する、請求項1に記載の構造物評価システム。 The evaluation unit divides the source distribution into two regions, a region where the source is sparse and a region where the source is dense, based on a reference value related to the density of the source, and the source is sparse. 2. The structure according to claim 1, wherein the structure is a region having a lower propagation speed of the elastic wave than a reference value related to the propagation speed of the elastic wave, and is evaluated as a region where the deterioration of the structure is most advanced. Evaluation system.
- 前記速度演算部は、前記AE信号に基づいてAEトモグラフィ解析を行うことによって前記弾性波の伝搬速度の分布を表す伝搬速度分布を導出し、
前記評価部は、前記弾性波の伝搬速度に関する基準値に基づいて前記伝搬速度分布を前記伝搬速度が高い領域と前記伝搬速度が低い領域との二つの領域に区分けし、前記発信源分布と、前記伝搬速度分布とを用いて、前記発信源が疎な領域であり、かつ、前記伝搬速度が低い領域を最も劣化が進行している領域と評価する、請求項1又は2に記載の構造物評価システム。 The velocity calculation unit derives a propagation velocity distribution representing a distribution of the propagation velocity of the elastic wave by performing an AE tomography analysis based on the AE signal;
The evaluation unit divides the propagation velocity distribution into two regions, a region where the propagation velocity is high and a region where the propagation velocity is low, based on a reference value related to the propagation velocity of the elastic wave, and the source distribution, The structure according to claim 1, wherein the propagation velocity distribution is used to evaluate a region where the transmission source is sparse and the propagation velocity is low as a region where deterioration is most advanced. Evaluation system. - 前記評価部は、前記構造物の各領域を、健全、中間劣化I、中間劣化II及び限界劣化の4つで評価することによって、前記構造物の各領域がそれぞれ健全、中間劣化I、中間劣化II及び限界劣化のいずれに相当するのかが示された評価結果分布を導出し、導出した前記評価結果分布を出力する、請求項1~3のいずれか一項に記載の構造物評価システム。 The evaluation unit evaluates each region of the structure based on four types of sound, intermediate deterioration I, intermediate deterioration II, and limit deterioration, so that each region of the structure is sound, intermediate deterioration I, and intermediate deterioration, respectively. The structure evaluation system according to any one of claims 1 to 3, wherein an evaluation result distribution indicating whether it is equivalent to II or critical deterioration is derived, and the derived evaluation result distribution is output.
- 前記評価部は、前記発信源が疎な領域であり、かつ、前記弾性波の伝搬速度に関する基準値より前記弾性波の伝搬速度が高い領域を、構造物の劣化が最も進行していない健全な領域と評価する、請求項2~4のいずれか一項に記載の構造物評価システム。 The evaluation unit is a healthy region in which the deterioration of the structure is least advanced in a region where the transmission source is sparse and the elastic wave propagation velocity is higher than a reference value related to the elastic wave propagation velocity. The structure evaluation system according to any one of claims 2 to 4, wherein the structure is evaluated as a region.
- 前記位置標定部は、前記AEセンサによって検出された前記弾性波の振幅情報に基づいて、既定の振幅以上の発信源の分布が表された前記発信源分布を導出する、請求項1~5のいずれか一項に記載の構造物評価システム。 6. The position locating unit derives the transmission source distribution in which a distribution of transmission sources having a predetermined amplitude or more is expressed based on amplitude information of the elastic wave detected by the AE sensor. The structure evaluation system as described in any one of Claims.
- 前記弾性波の振幅情報は、前記AEセンサによって検出された各イベントにおける前記弾性波の第一到達波の振幅の情報である、請求項6に記載の構造物評価システム。 The structure evaluation system according to claim 6, wherein the amplitude information of the elastic wave is information on an amplitude of a first arrival wave of the elastic wave in each event detected by the AE sensor.
- 前記弾性波は、前記構造物に応力が印加された結果として構造物表面あるいは内部の損傷より発生したものである、請求項1~7のいずれ一項に記載の構造物評価システム。 The structure evaluation system according to any one of claims 1 to 7, wherein the elastic wave is generated from damage on the surface of the structure or inside as a result of applying stress to the structure.
- 構造物より発生した弾性波を検出する複数のAEセンサそれぞれによって検出された前記弾性波に対して信号処理を行うことによって前記弾性波に関する情報を含むAE信号を抽出する信号処理部と、
前記AE信号に基づいて、前記構造物で発生した前記弾性波の発信源の分布を表す発信源分布を導出する位置標定部と、
前記AE信号に基づいて、前記構造物で発生した前記弾性波の伝搬速度を導出する速度演算部と、
前記発信源分布と、前記弾性波の伝搬速度とに基づいて、前記構造物の健全性を評価する評価部と、
を備える構造物評価装置。 A signal processing unit that extracts an AE signal including information on the elastic wave by performing signal processing on the elastic wave detected by each of the plurality of AE sensors that detect the elastic wave generated from the structure;
A position locating unit for deriving a source distribution representing a distribution of the source of the elastic wave generated in the structure based on the AE signal;
Based on the AE signal, a speed calculation unit for deriving a propagation speed of the elastic wave generated in the structure;
An evaluation unit that evaluates the soundness of the structure based on the transmission source distribution and the propagation speed of the elastic wave;
A structure evaluation apparatus comprising: - 構造物より発生した弾性波を検出する複数のAEセンサそれぞれによって検出された前記弾性波に対して信号処理を行うことによって前記弾性波に関する情報を含むAE信号を抽出する信号処理ステップと、
前記AE信号に基づいて、前記構造物で発生した前記弾性波の発信源の分布を表す発信源分布を導出する位置標定ステップと、
前記AE信号に基づいて、前記構造物で発生した前記弾性波の伝搬速度を導出する速度演算ステップと、
前記発信源分布と、前記弾性波の伝搬速度とに基づいて、前記構造物の健全性を評価する評価ステップと、
を有する構造物評価方法。 A signal processing step of extracting an AE signal including information on the elastic wave by performing signal processing on the elastic wave detected by each of a plurality of AE sensors that detect the elastic wave generated from the structure;
A position locating step for deriving a source distribution representing the distribution of the source of the elastic wave generated in the structure based on the AE signal;
A speed calculation step for deriving a propagation speed of the elastic wave generated in the structure based on the AE signal;
An evaluation step for evaluating the soundness of the structure based on the transmission source distribution and the propagation speed of the elastic wave;
A structure evaluation method having
Priority Applications (4)
| Application Number | Priority Date | Filing Date | Title |
|---|---|---|---|
| JP2017514721A JP6366826B2 (en) | 2016-05-17 | 2017-03-06 | Structure evaluation system, structure evaluation apparatus, and structure evaluation method |
| CN201780000107.8A CN107850579B (en) | 2016-05-17 | 2017-03-06 | Structure evaluation system, structure evaluation device, and structure evaluation method |
| EP17707456.4A EP3264076A4 (en) | 2016-05-17 | 2017-03-06 | Structure assessment system, structure assessment device and structure assessment method |
| US15/454,101 US10330646B2 (en) | 2016-05-17 | 2017-03-09 | Structure evaluation system, structure evaluation apparatus, and structure evaluation method |
Applications Claiming Priority (2)
| Application Number | Priority Date | Filing Date | Title |
|---|---|---|---|
| JP2016098951 | 2016-05-17 | ||
| JP2016-098951 | 2016-05-17 |
Related Child Applications (1)
| Application Number | Title | Priority Date | Filing Date |
|---|---|---|---|
| US15/454,101 Continuation US10330646B2 (en) | 2016-05-17 | 2017-03-09 | Structure evaluation system, structure evaluation apparatus, and structure evaluation method |
Publications (1)
| Publication Number | Publication Date |
|---|---|
| WO2017199542A1 true WO2017199542A1 (en) | 2017-11-23 |
Family
ID=60325922
Family Applications (2)
| Application Number | Title | Priority Date | Filing Date |
|---|---|---|---|
| PCT/JP2017/008818 WO2017199542A1 (en) | 2016-05-17 | 2017-03-06 | Structure assessment system, structure assessment device and structure assessment method |
| PCT/JP2017/008850 WO2017199544A1 (en) | 2016-05-17 | 2017-03-06 | Structure assessment system, structure assessment device and structure assessment method |
Family Applications After (1)
| Application Number | Title | Priority Date | Filing Date |
|---|---|---|---|
| PCT/JP2017/008850 WO2017199544A1 (en) | 2016-05-17 | 2017-03-06 | Structure assessment system, structure assessment device and structure assessment method |
Country Status (5)
| Country | Link |
|---|---|
| US (3) | US10330646B2 (en) |
| EP (2) | EP3264076A4 (en) |
| JP (3) | JP6368040B2 (en) |
| CN (2) | CN107850579B (en) |
| WO (2) | WO2017199542A1 (en) |
Families Citing this family (13)
| Publication number | Priority date | Publication date | Assignee | Title |
|---|---|---|---|---|
| JP6486739B2 (en) * | 2015-03-23 | 2019-03-20 | 株式会社東芝 | Detection system, detection method and signal processing apparatus |
| WO2017199542A1 (en) * | 2016-05-17 | 2017-11-23 | 株式会社東芝 | Structure assessment system, structure assessment device and structure assessment method |
| US10345275B2 (en) | 2016-06-15 | 2019-07-09 | Kabushiki Kaisha Toshiba | Structure evaluation system, structure evaluation apparatus, and structure evaluation method |
| US10613060B2 (en) | 2016-06-15 | 2020-04-07 | Kabushiki Kaisha Toshiba | Structure evaluation system, structure evaluation apparatus, and structure evaluation method |
| EP3761022A4 (en) * | 2018-02-27 | 2021-10-13 | Kabushiki Kaisha Toshiba | Structure evaluation system and structure evaluation method |
| EP3851849A4 (en) * | 2018-09-13 | 2022-05-04 | Kabushiki Kaisha Toshiba | Structure evaluation system, structure evaluation device, and structure evaluation method |
| JP7160695B2 (en) * | 2019-01-09 | 2022-10-25 | 株式会社東芝 | DETECTION SYSTEM, DETECTION METHOD, AND INFORMATION PROCESSING APPARATUS |
| CN110297040A (en) * | 2019-06-10 | 2019-10-01 | 华北水利水电大学 | A kind of sound emission type judgement method rising wave band acquisition parameter based on sound emission |
| WO2021240817A1 (en) * | 2020-05-29 | 2021-12-02 | 株式会社東芝 | Non-contact/non-destructive inspection system, signal processing device, and non-contact/non-destructive inspection method |
| JP7362580B2 (en) * | 2020-09-16 | 2023-10-17 | 株式会社東芝 | Structure evaluation method and structure evaluation system |
| CN112098524B (en) * | 2020-09-22 | 2021-08-20 | 北京航空航天大学 | Method for identifying asphalt concrete fracture process and quantifying microcracks based on acoustic emission |
| JP7447045B2 (en) * | 2021-03-22 | 2024-03-11 | 株式会社東芝 | Inspection system, inspection device and inspection method |
| CN115406385B (en) * | 2022-09-30 | 2023-08-11 | 武汉路通市政工程质量检测中心有限公司 | Method for monitoring fracture of prestressed reinforcement in anchoring area of cable-stayed bridge cable tower |
Citations (4)
| Publication number | Priority date | Publication date | Assignee | Title |
|---|---|---|---|---|
| US4531411A (en) * | 1983-10-25 | 1985-07-30 | The United States Of America As Represented By The United States Department Of Energy | Acoustic emission linear pulse holography |
| JPH09218182A (en) * | 1996-02-09 | 1997-08-19 | Tobishima Corp | Method for examining damage of structure support pile |
| JP2004125721A (en) | 2002-10-07 | 2004-04-22 | Railway Technical Res Inst | Method and apparatus for determining degree of damage in structure by acoustic emission sound of secondary origination |
| JP2014095555A (en) * | 2012-11-07 | 2014-05-22 | Tobishima Corp | Nondestructive inspection system for structure using tomography |
Family Cites Families (20)
| Publication number | Priority date | Publication date | Assignee | Title |
|---|---|---|---|---|
| JPH0755617B2 (en) * | 1984-09-17 | 1995-06-14 | 株式会社ゼクセル | Air conditioner for vehicle |
| JP2891767B2 (en) * | 1989-10-25 | 1999-05-17 | 日本たばこ産業株式会社 | AE generation position locating device |
| US5293555A (en) * | 1991-05-24 | 1994-03-08 | Hughes Aircraft Company | System and method for locating material fatigue using multiple sensors |
| JPH08313309A (en) | 1995-05-23 | 1996-11-29 | Nippon Koei Co Ltd | Discriminating method for banking collapse detection signal and its device |
| JP3448593B2 (en) * | 2000-01-19 | 2003-09-22 | 農工大ティー・エル・オー株式会社 | Civil structure flaw detection method |
| JP4366467B2 (en) | 2002-10-28 | 2009-11-18 | 国土交通省国土技術政策総合研究所長 | AE sensor, structure abnormality detection method using AE sensor, and safety evaluation method |
| KR101004123B1 (en) * | 2002-10-31 | 2010-12-27 | 히타치 지이 뉴클리어 에너지 가부시키가이샤 | Array sensor for ultrasonic wave transceiving, flaw detector and method for flaw detecting therewith |
| JP2007047094A (en) * | 2005-08-12 | 2007-02-22 | Railway Technical Res Inst | Method and apparatus for determining damage of structure using ae source for one-dimensional location |
| JP5030081B2 (en) * | 2006-08-18 | 2012-09-19 | 独立行政法人産業技術総合研究所 | AE / ultrasound detection system, and material monitoring apparatus and nondestructive inspection apparatus provided with the same |
| GB2482124B (en) * | 2010-07-19 | 2016-08-17 | Ultra Electronics Ltd | Acoustic structural integrity monitoring system and method |
| CN102269736B (en) * | 2011-07-08 | 2012-12-19 | 天津大学 | Automatic identification method for sound source distribution areas in tank bottom corrosion acoustic emission detection |
| JP5840084B2 (en) * | 2012-07-04 | 2016-01-06 | 株式会社Ihi検査計測 | AE position location apparatus and method |
| KR20140042458A (en) * | 2012-09-28 | 2014-04-07 | 삼성전자주식회사 | File management device of storage system and file management method thereof |
| JP6159926B2 (en) * | 2013-03-11 | 2017-07-12 | 飛島建設株式会社 | Simultaneous identification method of transmission point and physical properties (degradation status) in elastic wave tomography performed on measurement object of inhomogeneous physical properties |
| CN103744129B (en) * | 2014-01-07 | 2014-12-10 | 山东大学 | Tunnel construction large-scale integrated geophysics advanced detection model test device |
| US20150338380A1 (en) | 2014-05-21 | 2015-11-26 | University Of South Carolina | Assessing Corrosion Damage in Post-Tensioned Concrete Structures Using Acoustic Emission |
| WO2017199542A1 (en) * | 2016-05-17 | 2017-11-23 | 株式会社東芝 | Structure assessment system, structure assessment device and structure assessment method |
| US10613060B2 (en) | 2016-06-15 | 2020-04-07 | Kabushiki Kaisha Toshiba | Structure evaluation system, structure evaluation apparatus, and structure evaluation method |
| US10345275B2 (en) | 2016-06-15 | 2019-07-09 | Kabushiki Kaisha Toshiba | Structure evaluation system, structure evaluation apparatus, and structure evaluation method |
| US10352912B2 (en) * | 2016-09-15 | 2019-07-16 | Kabushiki Kaisha Toshiba | Structure evaluation system, structure evaluation apparatus, and structure evaluation method |
-
2017
- 2017-03-06 WO PCT/JP2017/008818 patent/WO2017199542A1/en active Application Filing
- 2017-03-06 CN CN201780000107.8A patent/CN107850579B/en active Active
- 2017-03-06 JP JP2017514934A patent/JP6368040B2/en active Active
- 2017-03-06 EP EP17707456.4A patent/EP3264076A4/en active Pending
- 2017-03-06 WO PCT/JP2017/008850 patent/WO2017199544A1/en active Application Filing
- 2017-03-06 EP EP17707746.8A patent/EP3428635A4/en active Pending
- 2017-03-06 CN CN201780000111.4A patent/CN107624160B/en active Active
- 2017-03-06 JP JP2017514721A patent/JP6366826B2/en active Active
- 2017-03-09 US US15/454,101 patent/US10330646B2/en active Active
- 2017-03-10 US US15/456,075 patent/US10371666B2/en active Active
-
2018
- 2018-07-04 JP JP2018127894A patent/JP6917344B2/en active Active
-
2019
- 2019-06-27 US US16/455,433 patent/US10648949B2/en active Active
Patent Citations (4)
| Publication number | Priority date | Publication date | Assignee | Title |
|---|---|---|---|---|
| US4531411A (en) * | 1983-10-25 | 1985-07-30 | The United States Of America As Represented By The United States Department Of Energy | Acoustic emission linear pulse holography |
| JPH09218182A (en) * | 1996-02-09 | 1997-08-19 | Tobishima Corp | Method for examining damage of structure support pile |
| JP2004125721A (en) | 2002-10-07 | 2004-04-22 | Railway Technical Res Inst | Method and apparatus for determining degree of damage in structure by acoustic emission sound of secondary origination |
| JP2014095555A (en) * | 2012-11-07 | 2014-05-22 | Tobishima Corp | Nondestructive inspection system for structure using tomography |
Non-Patent Citations (1)
| Title |
|---|
| See also references of EP3264076A4 * |
Also Published As
| Publication number | Publication date |
|---|---|
| US20170336365A1 (en) | 2017-11-23 |
| EP3428635A1 (en) | 2019-01-16 |
| JP6917344B2 (en) | 2021-08-11 |
| US20170336364A1 (en) | 2017-11-23 |
| EP3264076A1 (en) | 2018-01-03 |
| US20190317051A1 (en) | 2019-10-17 |
| WO2017199544A1 (en) | 2017-11-23 |
| JP6368040B2 (en) | 2018-08-01 |
| CN107850579B (en) | 2021-02-05 |
| EP3264076A4 (en) | 2018-06-27 |
| EP3428635A4 (en) | 2020-03-04 |
| CN107624160B (en) | 2021-05-28 |
| US10648949B2 (en) | 2020-05-12 |
| CN107850579A (en) | 2018-03-27 |
| JP2018194553A (en) | 2018-12-06 |
| JPWO2017199544A1 (en) | 2018-05-31 |
| CN107624160A (en) | 2018-01-23 |
| JPWO2017199542A1 (en) | 2018-06-07 |
| US10330646B2 (en) | 2019-06-25 |
| US10371666B2 (en) | 2019-08-06 |
| CN113092592A (en) | 2021-07-09 |
| JP6366826B2 (en) | 2018-08-01 |
Similar Documents
| Publication | Publication Date | Title |
|---|---|---|
| JP6366826B2 (en) | Structure evaluation system, structure evaluation apparatus, and structure evaluation method | |
| US10613060B2 (en) | Structure evaluation system, structure evaluation apparatus, and structure evaluation method | |
| JP6368039B2 (en) | Structure evaluation system, structure evaluation apparatus, and structure evaluation method | |
| JP7222014B2 (en) | Structure evaluation system, structure evaluation device, and structure evaluation method | |
| US10578587B2 (en) | Deterioration diagnosis method, a deterioration diagnosis system, and a sensor | |
| US10345275B2 (en) | Structure evaluation system, structure evaluation apparatus, and structure evaluation method | |
| JPWO2018235195A1 (en) | Structure evaluation system, structure evaluation method and shock applying device | |
| WO2018168218A1 (en) | Sensor adhesion state determination system, sensor adhesion state determination device, and sensor adhesion state determination method | |
| CN113092592B (en) | Structure evaluation system, structure evaluation device, and structure evaluation method |
Legal Events
| Date | Code | Title | Description |
|---|---|---|---|
| ENP | Entry into the national phase |
Ref document number: 2017514721 Country of ref document: JP Kind code of ref document: A |
|
| REEP | Request for entry into the european phase |
Ref document number: 2017707456 Country of ref document: EP |
|
| NENP | Non-entry into the national phase |
Ref country code: DE |