WO2017145529A1 - Calculation system - Google Patents
Calculation system Download PDFInfo
- Publication number
- WO2017145529A1 WO2017145529A1 PCT/JP2017/000397 JP2017000397W WO2017145529A1 WO 2017145529 A1 WO2017145529 A1 WO 2017145529A1 JP 2017000397 W JP2017000397 W JP 2017000397W WO 2017145529 A1 WO2017145529 A1 WO 2017145529A1
- Authority
- WO
- WIPO (PCT)
- Prior art keywords
- light
- filter
- wavelength
- wavelength range
- calculation system
- Prior art date
Links
Images


Classifications
-
- A—HUMAN NECESSITIES
- A61—MEDICAL OR VETERINARY SCIENCE; HYGIENE
- A61B—DIAGNOSIS; SURGERY; IDENTIFICATION
- A61B5/00—Measuring for diagnostic purposes; Identification of persons
- A61B5/145—Measuring characteristics of blood in vivo, e.g. gas concentration, pH value; Measuring characteristics of body fluids or tissues, e.g. interstitial fluid, cerebral tissue
- A61B5/1455—Measuring characteristics of blood in vivo, e.g. gas concentration, pH value; Measuring characteristics of body fluids or tissues, e.g. interstitial fluid, cerebral tissue using optical sensors, e.g. spectral photometrical oximeters
-
- A—HUMAN NECESSITIES
- A61—MEDICAL OR VETERINARY SCIENCE; HYGIENE
- A61B—DIAGNOSIS; SURGERY; IDENTIFICATION
- A61B1/00—Instruments for performing medical examinations of the interior of cavities or tubes of the body by visual or photographical inspection, e.g. endoscopes; Illuminating arrangements therefor
- A61B1/06—Instruments for performing medical examinations of the interior of cavities or tubes of the body by visual or photographical inspection, e.g. endoscopes; Illuminating arrangements therefor with illuminating arrangements
- A61B1/0638—Instruments for performing medical examinations of the interior of cavities or tubes of the body by visual or photographical inspection, e.g. endoscopes; Illuminating arrangements therefor with illuminating arrangements providing two or more wavelengths
-
- A—HUMAN NECESSITIES
- A61—MEDICAL OR VETERINARY SCIENCE; HYGIENE
- A61B—DIAGNOSIS; SURGERY; IDENTIFICATION
- A61B1/00—Instruments for performing medical examinations of the interior of cavities or tubes of the body by visual or photographical inspection, e.g. endoscopes; Illuminating arrangements therefor
- A61B1/00002—Operational features of endoscopes
- A61B1/00004—Operational features of endoscopes characterised by electronic signal processing
- A61B1/00009—Operational features of endoscopes characterised by electronic signal processing of image signals during a use of endoscope
- A61B1/000094—Operational features of endoscopes characterised by electronic signal processing of image signals during a use of endoscope extracting biological structures
-
- A—HUMAN NECESSITIES
- A61—MEDICAL OR VETERINARY SCIENCE; HYGIENE
- A61B—DIAGNOSIS; SURGERY; IDENTIFICATION
- A61B1/00—Instruments for performing medical examinations of the interior of cavities or tubes of the body by visual or photographical inspection, e.g. endoscopes; Illuminating arrangements therefor
- A61B1/00163—Optical arrangements
- A61B1/00186—Optical arrangements with imaging filters
-
- A—HUMAN NECESSITIES
- A61—MEDICAL OR VETERINARY SCIENCE; HYGIENE
- A61B—DIAGNOSIS; SURGERY; IDENTIFICATION
- A61B1/00—Instruments for performing medical examinations of the interior of cavities or tubes of the body by visual or photographical inspection, e.g. endoscopes; Illuminating arrangements therefor
- A61B1/04—Instruments for performing medical examinations of the interior of cavities or tubes of the body by visual or photographical inspection, e.g. endoscopes; Illuminating arrangements therefor combined with photographic or television appliances
- A61B1/042—Instruments for performing medical examinations of the interior of cavities or tubes of the body by visual or photographical inspection, e.g. endoscopes; Illuminating arrangements therefor combined with photographic or television appliances characterised by a proximal camera, e.g. a CCD camera
-
- A—HUMAN NECESSITIES
- A61—MEDICAL OR VETERINARY SCIENCE; HYGIENE
- A61B—DIAGNOSIS; SURGERY; IDENTIFICATION
- A61B5/00—Measuring for diagnostic purposes; Identification of persons
- A61B5/0059—Measuring for diagnostic purposes; Identification of persons using light, e.g. diagnosis by transillumination, diascopy, fluorescence
- A61B5/0075—Measuring for diagnostic purposes; Identification of persons using light, e.g. diagnosis by transillumination, diascopy, fluorescence by spectroscopy, i.e. measuring spectra, e.g. Raman spectroscopy, infrared absorption spectroscopy
-
- A—HUMAN NECESSITIES
- A61—MEDICAL OR VETERINARY SCIENCE; HYGIENE
- A61B—DIAGNOSIS; SURGERY; IDENTIFICATION
- A61B5/00—Measuring for diagnostic purposes; Identification of persons
- A61B5/0059—Measuring for diagnostic purposes; Identification of persons using light, e.g. diagnosis by transillumination, diascopy, fluorescence
- A61B5/0082—Measuring for diagnostic purposes; Identification of persons using light, e.g. diagnosis by transillumination, diascopy, fluorescence adapted for particular medical purposes
- A61B5/0084—Measuring for diagnostic purposes; Identification of persons using light, e.g. diagnosis by transillumination, diascopy, fluorescence adapted for particular medical purposes for introduction into the body, e.g. by catheters
-
- A—HUMAN NECESSITIES
- A61—MEDICAL OR VETERINARY SCIENCE; HYGIENE
- A61B—DIAGNOSIS; SURGERY; IDENTIFICATION
- A61B5/00—Measuring for diagnostic purposes; Identification of persons
- A61B5/145—Measuring characteristics of blood in vivo, e.g. gas concentration, pH value; Measuring characteristics of body fluids or tissues, e.g. interstitial fluid, cerebral tissue
- A61B5/14546—Measuring characteristics of blood in vivo, e.g. gas concentration, pH value; Measuring characteristics of body fluids or tissues, e.g. interstitial fluid, cerebral tissue for measuring analytes not otherwise provided for, e.g. ions, cytochromes
-
- A—HUMAN NECESSITIES
- A61—MEDICAL OR VETERINARY SCIENCE; HYGIENE
- A61B—DIAGNOSIS; SURGERY; IDENTIFICATION
- A61B5/00—Measuring for diagnostic purposes; Identification of persons
- A61B5/145—Measuring characteristics of blood in vivo, e.g. gas concentration, pH value; Measuring characteristics of body fluids or tissues, e.g. interstitial fluid, cerebral tissue
- A61B5/1455—Measuring characteristics of blood in vivo, e.g. gas concentration, pH value; Measuring characteristics of body fluids or tissues, e.g. interstitial fluid, cerebral tissue using optical sensors, e.g. spectral photometrical oximeters
- A61B5/14551—Measuring characteristics of blood in vivo, e.g. gas concentration, pH value; Measuring characteristics of body fluids or tissues, e.g. interstitial fluid, cerebral tissue using optical sensors, e.g. spectral photometrical oximeters for measuring blood gases
-
- A—HUMAN NECESSITIES
- A61—MEDICAL OR VETERINARY SCIENCE; HYGIENE
- A61B—DIAGNOSIS; SURGERY; IDENTIFICATION
- A61B5/00—Measuring for diagnostic purposes; Identification of persons
- A61B5/145—Measuring characteristics of blood in vivo, e.g. gas concentration, pH value; Measuring characteristics of body fluids or tissues, e.g. interstitial fluid, cerebral tissue
- A61B5/1455—Measuring characteristics of blood in vivo, e.g. gas concentration, pH value; Measuring characteristics of body fluids or tissues, e.g. interstitial fluid, cerebral tissue using optical sensors, e.g. spectral photometrical oximeters
- A61B5/1459—Measuring characteristics of blood in vivo, e.g. gas concentration, pH value; Measuring characteristics of body fluids or tissues, e.g. interstitial fluid, cerebral tissue using optical sensors, e.g. spectral photometrical oximeters invasive, e.g. introduced into the body by a catheter
-
- G—PHYSICS
- G01—MEASURING; TESTING
- G01N—INVESTIGATING OR ANALYSING MATERIALS BY DETERMINING THEIR CHEMICAL OR PHYSICAL PROPERTIES
- G01N21/00—Investigating or analysing materials by the use of optical means, i.e. using sub-millimetre waves, infrared, visible or ultraviolet light
- G01N21/17—Systems in which incident light is modified in accordance with the properties of the material investigated
- G01N21/25—Colour; Spectral properties, i.e. comparison of effect of material on the light at two or more different wavelengths or wavelength bands
- G01N21/31—Investigating relative effect of material at wavelengths characteristic of specific elements or molecules, e.g. atomic absorption spectrometry
- G01N21/314—Investigating relative effect of material at wavelengths characteristic of specific elements or molecules, e.g. atomic absorption spectrometry with comparison of measurements at specific and non-specific wavelengths
-
- G—PHYSICS
- G02—OPTICS
- G02B—OPTICAL ELEMENTS, SYSTEMS OR APPARATUS
- G02B23/00—Telescopes, e.g. binoculars; Periscopes; Instruments for viewing the inside of hollow bodies; Viewfinders; Optical aiming or sighting devices
- G02B23/24—Instruments or systems for viewing the inside of hollow bodies, e.g. fibrescopes
Definitions
- the present invention relates to a calculation system.
- an endoscope apparatus having a spectral image capturing function
- a spectroscopic endoscope apparatus it is possible to obtain information (for example, a reflection spectrum) regarding spectral characteristics of a living tissue such as a digestive organ mucous membrane.
- the reflection spectrum of this biological tissue reflects information on the type and concentration of substances contained in the vicinity of the surface layer of the biological tissue to be measured.
- the absorption calculated from the reflection spectrum of the living tissue is a linear superposition of the absorption of a plurality of substances constituting the living tissue.
- the biological tissue of the lesioned part differs from the biological tissue of the healthy part in the composition and the amount of components.
- abnormalities in lesions typified by cancer and the like are deeply related to blood conditions, particularly the total blood volume and oxygen saturation.
- qualitative and quantitative analysis of two biological tissues of interest by using the spectroscopic feature quantities in the visible range of them is a technique often used in the field of spectroscopic chemistry. Therefore, it is possible to estimate whether or not a certain lesioned part is included in the living tissue by comparing the spectral characteristic of blood of the living tissue including the lesioned part with that of the living tissue including only the healthy part.
- a spectral image is composed of a plurality of pieces of image information captured with light of different wavelengths, but the more wavelength information (the number of wavelengths from which image information is acquired) included in the spectral image, the more detailed biological tissue information. Can be obtained from the spectral image.
- Patent Document 1 discloses a configuration example of a spectroscopic endoscope apparatus that acquires spectral images at a wavelength interval of 5 nm in a wavelength range of 400 to 800 nm. Yes.
- Patent Document 2 discloses an endoscope system including two light source devices that emit illumination lights having different wavelength bands. These two illumination lights are alternately irradiated onto the subject every frame.
- the oxygen saturation is calculated using an image signal when the subject is illuminated with the first illumination light and an image signal when the subject is illuminated with the second illumination light. Is done.
- the spectroscopic endoscope apparatus disclosed in Patent Document 1 has a problem that it takes a long time to obtain information useful for diagnosis in order to perform image analysis by acquiring a large number of spectral images at a wavelength interval of 5 nm. is there.
- the endoscope system described in Patent Document 2 two light source devices are necessary, and in order to calculate oxygen saturation, it is necessary to perform imaging while switching between the two light source devices for each frame. There is a problem that the frame rate of the captured image is lowered.
- the present invention has been made in view of the above circumstances, and provides a calculation system capable of calculating biological information such as oxygen saturation of hemoglobin contained in living tissue without causing a decrease in the frame rate of the captured image.
- the purpose is to do.
- the calculation system is one light source device that emits illumination light, a wavelength selection unit that selects light in at least two specific wavelength ranges included in the illumination light, and a subject.
- An image sensor that receives light from a living tissue and outputs a pixel signal corresponding to the received light, and a signal processing unit that performs predetermined signal processing on the pixel signal output from the image sensor.
- the signal processing unit calculates an index indicating the concentration of a predetermined biological material contained in the biological tissue based on the pixel signal output from the image sensor in accordance with light in at least two specific wavelength ranges.
- light in at least two wavelength ranges is extracted from the illumination light emitted from the light source device by the wavelength selection means.
- An index indicating the concentration of a predetermined biological material contained in the biological tissue is calculated using the light in the at least two wavelength ranges. Therefore, unlike the prior art, there is no need to switch the illumination light (light source) in order to calculate the index, and it is possible to prevent a decrease in the frame rate caused by the switching of the illumination light when shooting the subject.
- the imaging device has, for example, three color filters for color photographing on the light receiving surface of each pixel, and wavelength regions of two of the three colors. Each includes two specific wavelength ranges.
- the color filter includes, for example, an R filter, a G filter, and a B filter having different wavelength ranges of transmitted light.
- the one specific wavelength range that the G filter transmits includes a wavelength range that is partitioned by two predetermined isosbestic points of hemoglobin
- the other specific wavelength range that the B filter transmits is that of hemoglobin, It includes a wavelength range defined by two isosbestic points in a combination different from the predetermined two isosbestic points.
- the wavelength range of light transmitted by the R filter includes a first wavelength range of 600 nm or more, and the wavelength range of light transmitted by the G filter is 528 nm or more and 584 nm.
- the wavelength range of light that the B filter transmits includes a third wavelength range of 452 nm or more and 502 nm or less.
- the wavelength selection unit selects, for example, light in the first wavelength range, the second wavelength range, and the third wavelength range included in the illumination light.
- the wavelength selection unit is, for example, a single optical filter that selectively transmits or reflects light in at least two specific wavelength ranges.
- the wavelength selection unit includes, for example, at least two bandpass filters respectively corresponding to at least two specific wavelength ranges.
- the calculation system further includes a filter driving unit that selectively inserts at least two band-pass filters into the optical path of the illumination light.
- the wavelength selection unit includes, for example, a first bandpass filter, a second bandpass filter, and a third bandpass filter.
- the first bandpass filter selectively transmits light in the wavelength range of 600 nm or more
- the second bandpass filter selectively transmits light in the second wavelength range of 528 nm or more and 584 nm or less
- the third band pass filter selectively transmits light in a third wavelength range of 452 nm or more and 502 nm or less.
- the wavelength selection unit is disposed, for example, between the light source device and the biological tissue.
- the living tissue is illuminated with the illumination light selected as the light in the specific wavelength range by the wavelength selection unit.
- the wavelength selection unit is disposed between, for example, a living tissue and an imaging device, and selects light having a specific wavelength from reflected light reflected by the living tissue.
- the imaging device receives the reflected light selected as the light in the specific wavelength range by the wavelength selection unit.
- a calculation system capable of calculating biological information of a living tissue without causing a decrease in the frame rate of a captured image is provided.
- (A) is an endoscopic image
- (b) is an oxygen saturation distribution image.
- It is a block diagram which shows the structure of the electronic endoscope system of 2nd Embodiment of this invention. It is a front view of the rotary turret which concerns on 2nd Embodiment of this invention. It is a block diagram which shows the structure of the imaging system of 3rd Embodiment of this invention.
- the calculation system of the present invention can be applied to an electronic endoscope system including an electronic endoscope and an imaging system including an imaging device such as a digital video camera.
- the first embodiment is an example in which the present invention is applied to an electronic endoscope system.
- the electronic endoscope system according to the first embodiment is an image picked up by independent band lights having different wavelength ranges (in the first embodiment, images of three wavelength ranges of R, G, and B constituting one color image). )
- the biological information for example, oxygen saturation and blood volume
- the analysis result is imaged and displayed.
- the spectral characteristics of blood in the visible range that is, the spectral characteristics of hemoglobin
- the changing nature is used.
- Hemoglobin includes oxygenated hemoglobin (HbO 2 ) and reduced hemoglobin (Hb), and the proportion of oxygenated hemoglobin is called oxygen saturation.
- the spectral characteristics of hemoglobin vary with oxygen saturation.
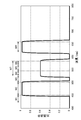
- Fig. 1 shows the transmission spectrum of hemoglobin.
- the horizontal axis in FIG. 1 indicates the wavelength of light, and the vertical axis indicates the light transmittance T.
- the solid line waveform in FIG. 1 is a transmission spectrum when the oxygen saturation is 100% (ie, oxygenated hemoglobin), and the long dashed waveform is when the oxygen saturation is 0% (ie, reduced hemoglobin). It is a transmission spectrum.
- the short dashed line is a transmission spectrum of hemoglobin (a mixture of oxygenated hemoglobin and reduced hemoglobin) at an intermediate oxygen saturation (10, 20, 30,... 90%).
- the transmission spectrum of hemoglobin has isoabsorption points E1 (424 nm), E2 (452 nm), E3 (where the light transmittance T (that is, absorption A) is constant regardless of the oxygen saturation). 502 nm), E4 (528 nm), E5 (546 nm), E6 (570 nm) and E7 (584 nm) appear.
- the wavelength region from the equal absorption points E1 to E2 is the wavelength region W1
- the wavelength region from the equal absorption points E2 to E3 is the wavelength region W2
- the wavelength region from the equal absorption points E3 to E4 is the wavelength region W3.
- the wavelength region from the equal absorption points E4 to E5 is defined as the wavelength region W4
- the wavelength region from the equal absorption points E5 to E6 is defined as the wavelength region W5
- the wavelength region from the equal absorption points E6 to E7 is defined as the wavelength region W6.
- FIG. 2 is a graph plotting the relationship between the oxygen saturation (horizontal axis) in the wavelength region W2 and the amount of light transmitted through hemoglobin (vertical axis).
- the transmitted light amount on the vertical axis is a value obtained by integrating the transmitted light amount in the wavelength region W2. From the graph of FIG. 2, it can be seen that the amount of transmitted light monotonously decreases with respect to the oxygen saturation in the wavelength region W2. In the wavelength range W1 adjacent to the wavelength range W2, the amount of transmitted light monotonously increases with respect to the oxygen saturation.
- the wavelength region W7 When attention is paid to the wavelength region from the isosbestic points E4 to E7 (that is, the continuous wavelength region of the wavelength regions W4 to W6, defined in this specification as the wavelength region W7), as shown in FIG.
- the amount of transmitted light monotonously decreases as the oxygen saturation increases.
- the wavelength region W5 the amount of transmitted light monotonously increases as the oxygen saturation increases.
- the inventor has found that the amount of decrease in the amount of transmitted light accompanying an increase in oxygen saturation in the wavelength region W5 is substantially equal to the sum of the amount of increase in the amount of transmitted light accompanying an increase in oxygen saturation in the wavelength regions W4 and W6. It was found that the amount of transmitted light in the region W7 as a whole is substantially constant regardless of the oxygen saturation. In other words, the absorption A of hemoglobin in the entire wavelength region W7 is substantially constant regardless of the oxygen saturation.
- FIG. 3 is a graph plotting the relationship between the oxygen saturation (horizontal axis) in the wavelength region W7 and the amount of light transmitted through hemoglobin (vertical axis).
- the transmitted light amount on the vertical axis is a value obtained by integrating the transmitted light amount in the wavelength region W7.
- the average value of the amount of transmitted light was 0.267 (arbitrary unit), and the standard deviation was 1.86 ⁇ 10 ⁇ 5 . From the graph of FIG. 3, it is understood that the transmitted light amount is substantially constant regardless of the oxygen saturation in the entire wavelength region W7.
- a wavelength region of 600 nm or more (for example, a wavelength region of 600 to 660 nm or 620 to 660 nm) is a transparent region that is not absorbed by hemoglobin.
- a reference wavelength range of transmitted light amount T (or absorption A).
- a wavelength region from a wavelength of 620 nm to a wavelength of 660 nm is defined as a wavelength region WR.
- the amount of light transmitted through hemoglobin in the wavelength region W2 monotonously decreases with an increase in oxygen saturation
- the amount of light transmitted through hemoglobin in the wavelength region W7 is oxygen. Regardless of the degree of saturation, it can be regarded as a constant value. Therefore, based on the transmitted light amount in the wavelength region W2 and the transmitted light amount in the wavelength region W7, an index indicating the amount of hemoglobin (that is, blood) in the subject (living tissue) and an index indicating the oxygen saturation level of blood are obtained. be able to. Therefore, if the relationship between the blood volume and the index indicating it and the relationship between the oxygen saturation and the index indicating it are obtained in advance experimentally or by calculation, the blood volume and oxygen saturation are calculated from the values of the respective indexes. Can be estimated.
- the greater the absorbance of the living tissue derived from hemoglobin the smaller the light transmittance
- the reflectance of the illumination light by the living tissue becomes small.
- the smaller the absorbance of hemoglobin the greater the light transmittance
- FIG. 4 is a block diagram showing a configuration of the electronic endoscope system 1 according to the first embodiment of the present invention.
- the electronic endoscope system 1 includes an electronic scope 100, a processor 200, and a monitor 300.
- the processor 200 includes a system controller 202, a timing controller 204, an image processing circuit 220, a lamp 208, and an optical filter device 260 which is an example of a wavelength selection unit.
- the system controller 202 executes various programs stored in the memory 212 and controls the entire electronic endoscope system 1 in an integrated manner.
- the system controller 202 is connected to the operation panel 214.
- the system controller 202 changes each operation of the electronic endoscope system 1 and parameters for each operation in accordance with a user instruction input from the operation panel 214.
- the timing controller 204 outputs a clock pulse for adjusting the operation timing of each unit to each circuit in the electronic endoscope system 1.
- the lamp power igniter 206 and the lamp 208 constitute an example of a light source device.
- the lamp 208 emits the illumination light L after being started by the lamp power igniter 206.
- the lamp 208 is, for example, a high-intensity lamp such as a xenon lamp, a halogen lamp, a mercury lamp, or a metal halide lamp, or a white LED (Light Emitting Diode).
- the illumination light L is light (or white light including at least the visible region) having a spectrum that extends mainly from the visible region (or near ultraviolet region) to the invisible infrared region.
- An optical filter device 260 is disposed between the lamp 208 and the condenser lens 210.
- the optical filter device 260 includes a filter driving unit 264 and an optical filter 262 attached to the filter driving unit 264.
- the filter driving unit 264 is configured to be able to slide the optical filter 262 in a direction orthogonal to the optical path between a position on the optical path of the illumination light L (solid line) and a position retracted from the optical path (broken line).
- the configuration of the filter driving unit 264 is not limited to the above-described one.
- optical filter 262 may be inserted into and removed from the optical path of the illumination light L. Details of the optical filter 262 will be described later.
- the electronic endoscope system 1 uses white light emitted from the lamp 208 as it is (or by removing infrared components and / or ultraviolet components) as illumination light (normal light Ln).
- Normal observation mode for performing endoscopic observation and filtered light Lf obtained by passing white light through the optical filter 262 (or further removing the infrared component and / or ultraviolet component) as the illumination light. It is configured to be operable in three operation modes: a special observation mode for performing mirror observation and a baseline measurement mode for acquiring a correction value used in the special observation mode.
- the optical filter 262 is disposed at a position retracted from the optical path in the normal observation mode, and is disposed on the optical path in the special observation mode.
- the illumination light L (filter light Lf or normal light Ln) that has passed through the optical filter device 260 is condensed on the incident end face of an LCB (Light Carrying Bundle) 102 by the condenser lens 210 and introduced into the LCB 102.
- LCB Light Carrying Bundle
- the illumination light L introduced into the LCB 102 propagates through the LCB 102, is emitted from the exit end face of the LCB 102 disposed at the tip of the electronic scope 100, and is irradiated onto the subject via the light distribution lens 104.
- the return light from the subject irradiated with the illumination light L forms an optical image on the light receiving surface of the solid-state image sensor 108 via the objective lens 106.
- the solid-state image sensor 108 is a single-plate color CCD (Charge Coupled Device) image sensor having a Bayer pixel arrangement.
- the solid-state image sensor 108 accumulates an optical image formed by each pixel on the light receiving surface as a charge corresponding to the amount of light, and generates and outputs a pixel signal.
- the solid-state imaging device 108 is a so-called on-chip configuration of an R filter that transmits red light directly formed on each pixel of the solid-state imaging device 108, a G filter that transmits green light, and a B filter that transmits blue light. A color filter is provided.
- the pixel signal generated by the solid-state image sensor 108 is the pixel signal R output from the pixel mounted with the R filter, the pixel signal output from the pixel mounted with the G filter, and the pixel mounted with the B filter.
- the output pixel signal B is included.
- FIG. 5 shows transmission spectra of the R filter, G filter, and B filter of the solid-state image sensor 108.
- the horizontal axis of FIG. 5 indicates the wavelength, and the vertical axis indicates the light transmittance of each filter.
- the R filter is a filter that transmits light in a wavelength region of approximately 600 nm or more including the wavelength region WR.
- the G filter is a filter that transmits light in a wavelength region of approximately 510 to 630 nm including the wavelength region W7.
- the B filter is a filter that transmits light in a wavelength region of approximately 510 nm or less including the wavelength regions W1 and W2.
- the optical filter 262 has an optical characteristic of selectively transmitting only light in the three wavelength regions of the wavelength regions WR, W7, and W2.
- the images of the light in the wavelength regions WR, W7, and W2 that have passed through the optical filter 262 are captured by the pixels to which the R filter, G filter, and B filter of the solid-state image sensor 108 are attached, and as pixel signals R, G, and B, respectively. Each is output.
- the solid-state image sensor 108 is not limited to a CCD image sensor, and may be replaced with a CMOS (Complementary Metal Oxide Semiconductor) image sensor or other types of image pickup devices.
- CMOS Complementary Metal Oxide Semiconductor
- a driver signal processing circuit 110 is provided in the connection portion of the electronic scope 100.
- a pixel signal is input to the driver signal processing circuit 110 from the solid-state imaging device 108 in a field cycle.
- the driver signal processing circuit 110 performs predetermined processing on the pixel signal input from the solid-state image sensor 108 and then outputs the processed signal to the image processing circuit 220 of the processor 200.
- the driver signal processing circuit 110 also accesses the memory 112 and reads the unique information of the electronic scope 100.
- the unique information of the electronic scope 100 recorded in the memory 112 includes, for example, the number and sensitivity of the solid-state image sensor 108, the operable field rate, the model number, and the like.
- the driver signal processing circuit 110 outputs the unique information read from the memory 112 to the system controller 202.
- the system controller 202 performs various calculations based on the unique information of the electronic scope 100 and generates a control signal.
- the system controller 202 controls the operation and timing of various circuits in the processor 200 using the generated control signal so that processing suitable for the electronic scope connected to the processor 200 is performed.
- the timing controller 204 supplies clock pulses to the driver signal processing circuit 110 according to the timing control by the system controller 202.
- the driver signal processing circuit 110 drives and controls the solid-state imaging device 108 at a timing synchronized with the field rate of the video processed on the processor 200 side in accordance with the clock pulse supplied from the timing controller 204.
- the image processing circuit 220 which is an example of a signal processing unit, performs predetermined signal processing such as color interpolation, matrix calculation, and Y / C separation on the pixel signal input from the driver signal processing circuit 110 in one field cycle. Thereafter, screen data for monitor display is generated, and the generated screen data for monitor display is converted into a predetermined video format signal. The converted video format signal is output to the monitor 300. Thereby, the image of the subject is displayed on the display screen of the monitor 300.
- predetermined signal processing such as color interpolation, matrix calculation, and Y / C separation
- the image processing circuit 220 includes an analysis processing circuit 230.
- the analysis processing circuit 230 performs spectroscopic analysis processing (signal processing) based on the acquired pixel signal in the special observation mode, and has an index having a correlation with biological information of biological tissue such as blood volume and oxygen saturation. Is calculated, and image data for visually displaying the calculation result is generated.
- the electronic endoscope system 1 does not use the optical filter 262, and the normal observation mode in which white light (normal light Ln) emitted from the lamp 208 is used as illumination light.
- the special observation mode for performing spectroscopic analysis using the filter light Lf obtained by passing the white light through the optical filter 262 as illumination light, and the baseline measurement mode for obtaining a correction value for special observation It is configured to operate in three modes. Switching between the modes is performed by a user operation on the operation unit of the electronic scope 100 or the operation panel 214 of the processor 200.
- the system controller 202 controls the optical filter device 260 to retract the optical filter 262 from the optical path, and performs imaging by irradiating the subject with the normal light Ln. Then, the image data captured using the solid-state image sensor 108 is subjected to image processing as necessary, and then converted into a video signal and displayed on the monitor 300.
- the system controller 202 controls the optical filter device 260 to place the optical filter 262 on the optical path, and performs imaging by irradiating the subject with the filter light Lf.
- analysis processing to be described later is performed based on image data captured using the solid-state image sensor 108.
- a color reference plate such as an achromatic diffuser or a standard reflector is used as an object for imaging under illumination with the filter light Lf, and special observation described later.
- data used for mode normalization processing is acquired.
- the image data R (x, y), G (x, y), and B (x, y) of the three primary colors captured using the filter light Lf in the baseline measurement mode are the baseline image data BL R (x, y, y), BL G (x, y), and BL B (x, y) are stored in the internal memory of the analysis processing circuit 230.
- R (x, y), G (x, y), B (x, y), BL R (x, y), BL G (x, y), and BL B (x, y) are pixels, respectively. This is the value of the image data (x, y) and the baseline image data.
- the pixel (x, y) is specified by the horizontal coordinate x and the vertical coordinate y of the imaging surface of the solid-state imaging device 108.
- FIG. 6 is a transmission spectrum of the optical filter 262.
- the optical filter 262 is a single dielectric multilayer filter having optical characteristics that selectively transmits only light in the three wavelength regions of the wavelength regions W2, W7, and WR at least in the visible region.
- the optical filter 262 has a flat transmission characteristic in each of the wavelength ranges W2, W7, and WR, but the transmittance in the wavelength range W7 is adjusted to be lower than that in the other wavelength ranges W2 and WR. This is because the emission spectrum of the lamp 207 used in the present embodiment has a peak in the wavelength band W7, so that each wavelength band after passing through the optical filter 262 is reduced by reducing the transmittance in the wavelength band W7.
- the optical filter 262 is not limited to a transmission type optical filter that transmits the illumination light L.
- the optical filter 262 may be a reflective optical filter that selectively reflects only light in three wavelength regions of the wavelength regions W2, W7, and WR.
- the optical filter 262 may be an absorption type optical filter that absorbs light outside the three wavelength regions of the wavelength regions W2, W7, and WR.
- analysis processing performed by the analysis processing circuit 230 in the special observation mode.
- the biological information of the biological tissue that is the subject is analyzed. Specifically, an index indicating the content of blood (hemoglobin) in a living tissue and an index indicating oxygen saturation (a ratio of hemoglobin to oxyhemoglobin) are calculated.
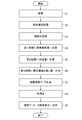
- FIG. 7 is a flowchart illustrating the analysis process.
- the subject is imaged using the solid-state image sensor 108, and the image data R (x, y), G (x, y), and B (x, y) of the three primary colors are analyzed. Is input.
- the following analysis processing is performed using the image data R (x, y), G (x, y), and B (x, y) input by the analysis processing circuit 230.
- the pixel selection process for selecting the pixel (x, y) that is the target of () is performed.
- Image data of a portion of the biological tissue that is the subject that does not contain blood or a portion where the color of the biological tissue is dominantly influenced by a substance other than hemoglobin is based on color information obtained from the image data. Even if the blood volume or oxygen saturation is calculated, a meaningful value cannot be obtained, so that it is merely noise. If such noise is calculated and provided to the doctor, it not only hinders an appropriate diagnosis, but also causes an adverse effect of reducing the processing speed by applying an unnecessary load to the analysis processing circuit 230. Therefore, in this embodiment, a pixel suitable for analysis processing (that is, a pixel in which the spectroscopic characteristics of blood are recorded) is selected, and the analysis processing is performed only on the selected pixel. Yes.
- the above three conditional expressions are set based on the magnitude relationship of the values of “G component ⁇ B component ⁇ R component” in the blood transmission spectrum. It should be noted that pixel selection processing S2 using only one or two of the above three conditional expressions (for example, using only Expression 3 and / or Expression 4 focusing on the red color peculiar to blood). May be performed.
- processing step S3 normalization processing is performed on the image data of the pixels selected in the pixel selection processing S2.
- the normalization process S3 of the present embodiment corrects the optical characteristics of the electronic endoscope system 1 itself (for example, the transmittance of the optical filter 262 and the light receiving sensitivity of the solid-state imaging device 108), and enables quantitative analysis. It is a process to do.
- the analysis processing circuit 230 calculates the following from the image data R (x, y) and the baseline image data BL R (x, y) acquired using the filter light Lf that has passed through the optical filter 262.
- Gs (x, y) and Bs (x, y) are calculated by the following formulas 6 and 7.
- Gs (x, y) G (x, y) / BL G (x, y)
- Bs (x, y) B (x, y) / BL B (x, y)
- standardized image data Rs (x, y), Gs (x, y), and Bs (x, y) are used, but the standardized image data Rs ( Index calculation using image data R (x, y), G (x, y), B (x, y) instead of x, y), Gs (x, y), Bs (x, y) May be performed.
- Image data Gs (x, y) represents an optical image formed by light in the wavelength region W7 that has passed through the optical filter 262.
- the image data Bs (x, y) represents an optical image formed by light in the wavelength region W2 that has passed through the optical filter 262.
- the emissivity of light in the anti-wavelength region W2 by the living tissue that is, the value of the image data Bs (x, y)
- the reflectance of light in the wavelength region W7 by the living tissue that is, the value of the image data Gs (x, y)
- the first index X is an index with good oxygen saturation.
- the normalized reflectance Gs (x, y) is a value that does not depend on the oxygen saturation but depends on the blood volume.
- the normalized reflectance Rs (that is, the value of the image data Rs (x, y)) is the reflectance by the living tissue of the light in the wavelength region WR that is hardly absorbed by blood, and therefore, the oxygen saturation is reduced. It does not depend on blood volume. Therefore, by dividing the normalized reflectance Gs by the normalized reflectance Rs, the contribution of the surface state of the living tissue and the contribution of the incident angle of the illumination light (filter light Lf) to the living tissue are offset. An index having only blood volume contribution can be obtained. Therefore, the second index Y is a good index for blood volume.
- a third index Z representing the logical operation result of oxygen saturation and blood volume is calculated.
- the analysis processing circuit 230 has a second index indicating the blood volume calculated by Expression 9 and the first index X indicating the oxygen saturation calculated by Expression 8 is smaller than a predetermined reference value (first reference value).
- first reference value a predetermined reference value
- second reference value a predetermined reference value
- the first index X, the second index Y, and the third index Z are each a binary index
- the third index Z is calculated as a logical product or logical sum of the first index X and the second index Y.
- X 1 (the oxygen saturation is lower than the normal value) when the value on the right side of Formula 8 is less than the first reference value
- X 0 (the oxygen saturation is greater than the first reference value).
- Y 1 (the blood volume is greater than the normal value) when the value on the right side of Equation 9 is greater than or equal to the second reference value
- Y 0 (the blood volume is less than the second reference value).
- the third index Z is a binary index, but the third index Z may be a multi-value (or continuous value such as a real number) indicating the degree of suspicion of malignant tumor.
- the third index Z (x, y) indicating the degree of suspicion of malignant tumor may be calculated.
- the third index Z (x, y) can be calculated, for example, as the sum (or weighted average) or product of the deviation of the first index X (x, y) and the deviation of the second reference value.
- a pixel value (luminance) that is designated in advance by the user among the first index X (x, y), the second index Y (x, y), or the third index Z (x, y) is used.
- Index image data to be generated is generated.
- processing step S8 color correction processing is performed on the image data R (x, y), G (x, y), and B (x, y). Since the filter light Lf that has passed through the optical filter 262 includes spectral components of the three primary colors of R (wavelength band WR), G (wavelength band W7), and B (wavelength band W2), the filter light Lf is used in the color. An endoscopic image can be taken. However, since the spectrum of the filter light Lf has a limited band, an image captured using the filter light Lf may be unnatural in color compared to an image captured using the normal light Ln. is there.
- this processing step S8 when the normal light Ln is used for the image data R (x, y), G (x, y), and B (x, y) imaged using the filter light Lf Color correction processing is performed to bring the hue close to the obtained image. Thereby, it is possible to obtain an image (pseudo normal observation image) picked up using the normal light Ln in a pseudo manner.
- the color correction processing S8 adds or multiplies correction values C R , C G , and C B acquired in advance to, for example, image data R (x, y), G (x, y), and B (x, y). Is done by doing.
- a color matrix Mf may be prepared and color correction may be performed by color matrix calculation.
- the correction values C R , C G , C B and the color matrix Mf are set in advance based on image data obtained by imaging the color reference plate illuminated with the filter light Lf by the electronic endoscope system 1, for example, and analyzed. It is stored in the internal memory of the circuit 230. It is also possible to set so that the color correction process S8 is not performed.
- screen data to be displayed on the monitor 300 is generated based on the image data subjected to the color correction process S8, the index image data generated in process S7, and the like.
- the screen data generation processing S9 for example, an endoscope image (pseudo normal observation image) and one or more types of index images are displayed side by side on a single screen, or an endoscope that displays only an endoscope image.
- Various screen data such as an image display and an index image display that displays only one or more types of index images specified by the user can be generated.
- the type of screen data to be generated is selected by a user operation on the operation unit of the electronic scope 100 or the operation panel 214 of the processor 200.
- FIG. 8 is an example of a screen displayed on the monitor 300.
- FIG. 8A is an endoscopic image
- FIG. 6B is an index image of the first index X (x, y) indicating oxygen saturation.
- the image in FIG. 8 is an observation of the right hand in a state where the vicinity of the proximal interphalangeal joint of the middle finger is pressed with a rubber band.
- FIG. 8B shows that the oxygen saturation is lowered due to the blood flow being blocked by the compression on the distal side of the compression part of the right middle finger. Further, it can be seen that arterial blood stays in the immediate vicinity of the compressed portion, and the oxygen saturation is locally high.
- the electronic scope 100 is operated to quickly switch from the special observation mode to the normal observation mode, and the normal observation image with higher color reproducibility is displayed on the full screen. Can be diagnosed.
- the electronic endoscope system 1 according to the present embodiment can be operated in the normal observation mode and the special observation mode only by changing the image processing method by automatically inserting and removing the optical filter 262 on the optical path by operating the electronic scope 100. Is configured to be able to easily and quickly be switched.
- an optical filter 262 that separates the three wavelength ranges W2, W7, and WR is employed, and further, the three wavelength ranges W2, W7, and WR are included in the solid-state image sensor 108.
- a configuration that transmits each of the B filter, the G filter, and the R filter is employed. With these configurations, it is possible to generate an endoscopic image and an index image of one frame by imaging one frame (two fields). Therefore, unlike the endoscope system disclosed in Patent Document 2, a plurality of frames of image data are not used for calculation of oxygen saturation, which causes a problem that the frame rate of a captured image decreases in the special observation mode. An endoscopic image and an index image can be displayed at the same time.
- the optical filter 262 has a characteristic of transmitting light in the three wavelength ranges W2, W7, and WR. Therefore, in the special observation mode, there is no need to sequentially insert a plurality of optical filters having different transmission characteristics in the optical path of the illumination light. For example, an optical filter that transmits only light in the wavelength band W2, an optical filter that transmits only light in the wavelength band W7, and an optical filter that transmits only light in the wavelength band WR are alternatively selected from the three optical filters.
- a moving mechanism for moving the optical filter in synchronization with the frame rate is required.
- the processor 200 becomes relatively large and complicated, and the moving mechanism itself includes a movable part, so that the durability becomes relatively low. Furthermore, when a plurality of optical filters are sequentially inserted into the optical path of the illumination light, the amount of illumination light applied to the subject fluctuates each time the optical filter crosses the optical path, and image data with stable brightness cannot be obtained. There is. However, according to the present embodiment, it is not necessary to drive the optical filter 262 during the imaging process in the special observation mode, so that the processor 200 (light source device) is increased in size and durability, and the amount of illumination light is reduced. Variations can be suppressed.
- the transmission spectrum of the optical filter 262 in the present embodiment is not limited to that shown in FIG.
- the amount of light (specifically, maximum light transmittance) in the wavelength ranges W2, W7, and WR transmitted through the optical filter 262 is the transmission spectrum of the on-chip color filter (R filter, G filter, and B filter) of the solid-state image sensor 108. It can be changed according to. For example, the light transmittance of the G filter of the solid-state image sensor 108 can be lowered, while the light transmittance of the optical filter 262 in the wavelength region W7 can be increased.
- the oxygen saturation is calculated using the image data of two frames as in the endoscope system disclosed in Patent Document 2, when the subject moves with respect to the solid-state image sensor, the two frames are used.
- the position of the subject image in the captured image may change.
- the oxygen saturation cannot be correctly calculated using the images of two frames, or the edge of the subject image is emphasized.
- biological information such as oxygen saturation is calculated using the captured image of one frame. Therefore, even if the subject moves during the imaging process, the index indicating the biological information can be correctly calculated without enhancing the edge.
- Embodiments of the present invention are not limited to those described above, and various modifications are possible within the scope of the technical idea of the present invention.
- the embodiment of the present application also includes an embodiment that is exemplarily specified in the specification or a combination of obvious embodiments and the like as appropriate.
- the first embodiment is an example in which the wavelength region W2 is used as the blue wavelength region used in the special observation mode, but the wavelength region W1 can be used instead of the wavelength region W2.
- the wavelength region W1 has a larger difference in light transmittance T (that is, absorption) between oxygenated hemoglobin and reduced hemoglobin than the wavelength region W2. Therefore, by using the wavelength region W1, it is possible to detect a change in oxygen saturation with higher sensitivity.
- the above embodiment is an example in which the spectroscopic analysis result is displayed by a gray scale or monochrome index image, but the display method of the analysis result is not limited to this.
- the image data R (x, y), G (x, y), and B (x, y) may be changed according to the index value. For example, for a pixel whose index value exceeds the reference value, a process for increasing the brightness, a process for changing the hue (for example, a process for increasing the red component by increasing the R component, or rotating the hue by a predetermined angle) And a process of blinking the pixels (or changing the hue periodically).
- FIG. 9 is a block diagram illustrating a configuration of the electronic endoscope system 2 according to the second embodiment. As shown in FIG. 9, the electronic endoscope system 2 of the second embodiment includes an optical filter device 270.
- the optical filter device 270 includes a rotary turret 273, a motor 274 connected to the rotary turret 273, and a motor drive circuit 275 that drives and controls the motor 274.
- the motor 274 and the motor drive circuit 275 constitute an example of a filter drive unit.
- An optical filter 272 is attached to the rotary turret 270.
- the same reference numerals are used for components equivalent to those in the first embodiment.
- FIG. 10 is a front view of the rotary turret 273.
- the optical filter 272 includes a bandpass filter 272B that transmits only light in the wavelength band W2, a bandpass filter 272G that transmits only light in the wavelength band W7, and a bandpass filter 272R that transmits only light in the wavelength band WR.
- Bandpass filters 272B, 272G, and 272R are examples of first, second, and third bandpass filters, respectively.
- the band pass filters 272 ⁇ / b> B, 272 ⁇ / b> G, 272 ⁇ / b> R are arranged side by side in the circumferential direction of the rotary turret 273.
- Each band-pass filter 272B, 272G, 272R has a fan shape and is arranged at an angular pitch corresponding to the frame period (here, an angular pitch of about 120 °). In this embodiment, one rotation of the optical filter 272 corresponds to one frame.
- the motor drive circuit 275 drives the motor 274 under the control of the system controller 202.
- the three band pass filters 272B, 272G, and 272R are sequentially inserted into the optical path of the illumination light.
- three types of illumination light L having different spectra are extracted from the illumination light L emitted from the lamp 208 at a timing synchronized with imaging.
- the rotary turret 273 emits illumination light in the wavelength region W2 by the bandpass filter 272B, illumination light in the wavelength region W7 by the optical filter 272G, and illumination in the wavelength region WR by the bandpass filter 272R. Take out light alternatively.
- the extracted illumination light is sequentially applied to the subject.
- the rotational position and rotational phase of the rotary turret 273 are controlled by detecting an opening (not shown) formed near the outer periphery of the rotary turret 273 with a photo interrupter 276.
- the solid-state image sensor 108 ′ outputs, as a pixel signal B, a charge corresponding to the amount of light received while the subject is irradiated with illumination light in the wavelength region W2.
- the solid-state imaging device 108 ′ outputs, as a pixel signal G, a charge corresponding to the amount of light received while the object is irradiated with illumination light in the wavelength region W7.
- the solid-state imaging device 108 ′ outputs a charge corresponding to the amount of light received while the subject is irradiated with illumination light in the wavelength region WR as a pixel signal R.
- the pixel signals R, G, and B are used for both displaying a normal endoscopic image and displaying an index image representing an index of biological information. Therefore, in the electronic endoscope system 2 of the second embodiment, it is not necessary to newly use another optical filter or light source device in order to display the index image. Therefore, the endoscopic image and the index image can be displayed simultaneously without reducing the frame rate of the captured image. Further, in the electronic endoscope system 2 of the second embodiment, the solid-state imaging device 108 ′ for monochrome image capturing that does not have the on-chip color filter is used for subject imaging processing. A high-definition photographed image can be obtained as compared with the case of using the solid-state imaging device.
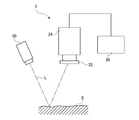
- FIG. 11 is a block diagram illustrating a configuration of the imaging system 3 according to the third embodiment.
- the imaging system 3 includes a light source device 30, an optical filter 32, a digital video camera (imaging device) 34, and a monitor 36.
- the light source device 30 emits illumination light L that illuminates the subject S.
- the illumination light L is light having a spectrum (or white light including at least the visible range) that mainly extends from the visible range to the invisible infrared range.
- the illumination light L (reflected light) reflected from the subject S enters the optical filter 32.
- the optical characteristics of the optical filter 32 are the same as the optical characteristics of the optical filter 262 of the first embodiment. That is, the optical filter 32 selectively transmits only light in the three wavelength regions of the wavelength regions W2, W7, and WR. The reflected light that has passed through the optical filter 32 enters the imaging device 34.
- the imaging device 34 includes a solid-state imaging device, a signal processing circuit that performs signal processing on a pixel signal output from the solid-state imaging device, and the like.
- the solid-state imaging device includes a so-called on-chip color filter such as an R filter, a G filter, and a B filter on each pixel.
- the solid-state image sensor outputs pixel signals R, G, and B according to the amount of received reflected light.
- the imaging device 34 generates a normal endoscopic image and an index image representing an index of biological information based on the pixel signals R, G, and B, similarly to the image processing circuit 220 of the first embodiment.
- the endoscopic image and the index image generated by the imaging device 34 are displayed on the monitor 36.
- the optical filter 32 is not in front of the emission direction of the illumination light L of the light source device 30 (between the light source device 30 and the subject S), but in front of the solid-state imaging device (with the solid-state imaging device). Between the subject S). Thus, both the endoscopic image and the index image can be displayed without changing the spectral characteristics of the illumination light L that illuminates the subject.
- the imaging device 34 can be arranged away from the subject S, analysis processing by the imaging system 3 and direct observation of the subject S by the surgeon can be performed simultaneously.
- the spectral characteristics of the illumination light L are not changed during the analysis process, the color of the subject S changes due to the illumination light L when viewed from an operator who directly observes the subject S. Can be prevented.
- the third embodiment it is possible to generate an endoscopic image and an index image by imaging one frame (two fields) as in the first embodiment. Therefore, since it is not necessary to switch the light source device for each frame as in Patent Document 2, it is possible to simultaneously display the endoscopic image and the index image without causing a decrease in the frame rate.
- the optical filters 262 and 272 are disposed in front of the light source device (lamp 208).
- the optical filter 32 is disposed in front of the solid-state imaging device.
- the optical filter can be disposed at any position on the optical path of the illumination light from the light source device to the solid-state imaging device.
- the optical filter 262 may be disposed in front of the light distribution lens 104, in front of the objective lens 106, or between the objective lens 106 and the solid-state image sensor 108.
- the optical filter 32 may be disposed in front of the light source device 30.
- the optical filter may be a wavelength selectable reflecting member, for example, a dichroic mirror.
- the dichroic mirror has a property of reflecting illumination light as the filter light Lf and transmitting light other than the filter light Lf.
Abstract
A calculation system is provided with: a single light source device for emitting illumination light; a wavelength selector for selecting light of at least two specific wavelength bands contained in the illumination light; an imaging element that receives light from biological tissue, i.e. the object of imaging, and outputs a pixel signal corresponding to the received light; and a signal processing unit for performing prescribed signal processing upon the pixel signal outputted by the imaging element. In this configuration, the signal processing unit calculates an indicator of the concentration of a prescribed biological substance in the biological tissue, calculation being performed on the basis of the pixel signal outputted, in response to the light of at least two specific wavelength bands, by the imaging element.
Description
本発明は計算システムに関する。
The present invention relates to a calculation system.
近年、分光画像撮影機能を備えた内視鏡装置(分光内視鏡装置)が提案されている。このような分光内視鏡装置によれば、消化器の粘膜等の生体組織の分光特性に関する情報(例えば反射スペクトル)を得ることができる。この生体組織の反射スペクトルは、測定対象となる生体組織の表層近傍に含まれる物質の種類や濃度の情報を反映していることが知られている。具体的には、生体組織の反射スペクトルより算出される吸収は、その生体組織を構成する複数の物質の吸収を線形的に重畳したものとなることが知られている。
Recently, an endoscope apparatus (spectral endoscope apparatus) having a spectral image capturing function has been proposed. According to such a spectroscopic endoscope apparatus, it is possible to obtain information (for example, a reflection spectrum) regarding spectral characteristics of a living tissue such as a digestive organ mucous membrane. It is known that the reflection spectrum of this biological tissue reflects information on the type and concentration of substances contained in the vicinity of the surface layer of the biological tissue to be measured. Specifically, it is known that the absorption calculated from the reflection spectrum of the living tissue is a linear superposition of the absorption of a plurality of substances constituting the living tissue.
病変部の生体組織は、健常部の生体組織とは、その組成、成分量において異なることが知られている。特に、癌などに代表される病変部の異常は、血液の状態、とりわけ全血液量や酸素飽和度の状態と深く関わることが多くの先行研究で報告されている。ここで、注目する2つの生体組織を、それらが有する可視域の分光学的特徴量を利用して、定性、定量することは、分光分析化学の分野では良く利用されている手法である。よって病変部を含む生体組織の血液の分光特性と、健常部のみの生体組織のそれとを比較して、生体組織に何らかの病変部が含まれるかどうかを推定することができる。
It is known that the biological tissue of the lesioned part differs from the biological tissue of the healthy part in the composition and the amount of components. In particular, it has been reported in many previous studies that abnormalities in lesions typified by cancer and the like are deeply related to blood conditions, particularly the total blood volume and oxygen saturation. Here, qualitative and quantitative analysis of two biological tissues of interest by using the spectroscopic feature quantities in the visible range of them is a technique often used in the field of spectroscopic chemistry. Therefore, it is possible to estimate whether or not a certain lesioned part is included in the living tissue by comparing the spectral characteristic of blood of the living tissue including the lesioned part with that of the living tissue including only the healthy part.
分光画像は、異なる波長の光で撮像された複数の画像情報から構成されるが、分光画像に含まれる波長情報(画像情報を取得する波長の数)が多いほど、より詳細な生体組織の情報を分光画像から得ることができる。特開2012-245223号公報(以下「特許文献1」と記す。)には、400~800nmの波長域において5nmの波長間隔で分光画像を取得する分光内視鏡装置の構成例が開示されている。
A spectral image is composed of a plurality of pieces of image information captured with light of different wavelengths, but the more wavelength information (the number of wavelengths from which image information is acquired) included in the spectral image, the more detailed biological tissue information. Can be obtained from the spectral image. Japanese Patent Laying-Open No. 2012-245223 (hereinafter referred to as “Patent Document 1”) discloses a configuration example of a spectroscopic endoscope apparatus that acquires spectral images at a wavelength interval of 5 nm in a wavelength range of 400 to 800 nm. Yes.
また、特開2013-099464号公報(以下「特許文献2」と記す。)には、互いに波長帯域の異なる照明光を射出する2つの光源装置を備える内視鏡システムが開示されている。この2つの照明光は、1フレーム毎に交互に被写体に照射される。特許文献2では、被写体が1つ目の照明光で照明されているときの画像信号と、被写体が2つ目の照明光で照明されているときの画像信号とを用いて酸素飽和度が計算される。
In addition, Japanese Unexamined Patent Application Publication No. 2013-099464 (hereinafter referred to as “Patent Document 2”) discloses an endoscope system including two light source devices that emit illumination lights having different wavelength bands. These two illumination lights are alternately irradiated onto the subject every frame. In Patent Document 2, the oxygen saturation is calculated using an image signal when the subject is illuminated with the first illumination light and an image signal when the subject is illuminated with the second illumination light. Is done.
しかしながら、特許文献1の分光内視鏡装置では、5nmの波長間隔で多数の分光画像を取得して画像解析を行うために、診断に有効な情報を得るためには長時間を要するという問題がある。また、特許文献2に記載されている内視鏡システムでは、2つの光源装置が必要であり、酸素飽和度を計算するためにフレーム毎に2つの光源装置を切り替えながら撮像しなければならないため、撮影画像のフレームレートが低下するという問題がある。
However, the spectroscopic endoscope apparatus disclosed in Patent Document 1 has a problem that it takes a long time to obtain information useful for diagnosis in order to perform image analysis by acquiring a large number of spectral images at a wavelength interval of 5 nm. is there. In addition, in the endoscope system described in Patent Document 2, two light source devices are necessary, and in order to calculate oxygen saturation, it is necessary to perform imaging while switching between the two light source devices for each frame. There is a problem that the frame rate of the captured image is lowered.
本発明は上記の事情に鑑みてなされたものであり、撮影画像のフレームレートの低下を生じさせることなく、生体組織に含まれるヘモグロビンの酸素飽和度等の生体情報を計算可能な計算システムを提供することを目的とする。
The present invention has been made in view of the above circumstances, and provides a calculation system capable of calculating biological information such as oxygen saturation of hemoglobin contained in living tissue without causing a decrease in the frame rate of the captured image. The purpose is to do.
本発明の一実施形態によれば、計算システムは、照明光を射出する1つの光源装置と、照明光に含まれる、少なくとも2つの特定波長域の光を選択する波長選択部と、被写体である生体組織からの光を受光し、受光した光に応じた画素信号を出力する撮像素子と、撮像素子から出力された画素信号に対して所定の信号処理を施す信号処理部と、を備える。この構成において、信号処理部は、撮像素子から少なくとも2つの特定波長域の光に応じて出力された画素信号に基づいて、生体組織に含まれる所定の生体物質の濃度を示す指標を算出する。
According to an embodiment of the present invention, the calculation system is one light source device that emits illumination light, a wavelength selection unit that selects light in at least two specific wavelength ranges included in the illumination light, and a subject. An image sensor that receives light from a living tissue and outputs a pixel signal corresponding to the received light, and a signal processing unit that performs predetermined signal processing on the pixel signal output from the image sensor. In this configuration, the signal processing unit calculates an index indicating the concentration of a predetermined biological material contained in the biological tissue based on the pixel signal output from the image sensor in accordance with light in at least two specific wavelength ranges.
このような構成によれば、光源装置から射出された照明光から、波長選択手段によって少なくとも2つの波長域の光が取り出される。この少なくとも2つの波長域の光を使用して、生体組織に含まれる所定の生体物質の濃度を示す指標が計算される。従って、先行技術のように、指標を計算するために照明光(光源)を切り替える必要が無く、被写体を撮影する際に、照明光の切り替えによって発生するフレームレートの低下を防止することができる。
According to such a configuration, light in at least two wavelength ranges is extracted from the illumination light emitted from the light source device by the wavelength selection means. An index indicating the concentration of a predetermined biological material contained in the biological tissue is calculated using the light in the at least two wavelength ranges. Therefore, unlike the prior art, there is no need to switch the illumination light (light source) in order to calculate the index, and it is possible to prevent a decrease in the frame rate caused by the switching of the illumination light when shooting the subject.
また、本発明の一実施形態によれば、撮像素子は、例えば、各画素の受光面上にカラー撮影のための3色のカラーフィルタを有し、該3色のうちの2色の波長域が2つの特定波長域をそれぞれ含む。
Further, according to an embodiment of the present invention, the imaging device has, for example, three color filters for color photographing on the light receiving surface of each pixel, and wavelength regions of two of the three colors. Each includes two specific wavelength ranges.
また、本発明の一実施形態によれば、カラーフィルタは、例えば、透過させる光の波長域が互いに異なるRフィルタ、Gフィルタ、Bフィルタを含む。この場合、Gフィルタが透過させる一方の前記特定波長域は、ヘモグロビンの所定の2つの等吸収点によって区画される波長域を含み、Bフィルタが透過させる他方の前記特定波長域は、ヘモグロビンの、所定の2つの等吸収点とは異なる組み合わせの2つの等吸収点によって区画される波長域を含む。
In addition, according to an embodiment of the present invention, the color filter includes, for example, an R filter, a G filter, and a B filter having different wavelength ranges of transmitted light. In this case, the one specific wavelength range that the G filter transmits includes a wavelength range that is partitioned by two predetermined isosbestic points of hemoglobin, and the other specific wavelength range that the B filter transmits is that of hemoglobin, It includes a wavelength range defined by two isosbestic points in a combination different from the predetermined two isosbestic points.
また、本発明の一実施形態によれば、例えば、Rフィルタが透過させる光の波長域は、600nm以上の第1波長域を含み、Gフィルタが透過させる光の波長域は、528nm以上且つ584nm以下の第2波長域を含み、Bフィルタが透過させる光の波長域は、452nm以上且つ502nm以下の第3波長域を含む。
According to one embodiment of the present invention, for example, the wavelength range of light transmitted by the R filter includes a first wavelength range of 600 nm or more, and the wavelength range of light transmitted by the G filter is 528 nm or more and 584 nm. The wavelength range of light that the B filter transmits, including the following second wavelength range, includes a third wavelength range of 452 nm or more and 502 nm or less.
また、本発明の一実施形態によれば、波長選択部は、例えば、照明光に含まれる、第1波長域、第2波長域及び第3波長域の光を選択する。
Further, according to an embodiment of the present invention, the wavelength selection unit selects, for example, light in the first wavelength range, the second wavelength range, and the third wavelength range included in the illumination light.
また、本発明の一実施形態によれば、波長選択部は、例えば、少なくとも2つの特定波長域の光を選択的に透過又は反射させる単一の光学フィルタである。
Further, according to one embodiment of the present invention, the wavelength selection unit is, for example, a single optical filter that selectively transmits or reflects light in at least two specific wavelength ranges.
また、本発明の一実施形態によれば、波長選択部は、例えば、少なくとも2つの特定波長域にそれぞれ対応する少なくとも2つのバンドパスフィルタを有する。この場合、計算システムは、少なくとも2つのバンドパスフィルタを択一的に照明光の光路に挿入するフィルタ駆動部を更に備える。
Further, according to an embodiment of the present invention, the wavelength selection unit includes, for example, at least two bandpass filters respectively corresponding to at least two specific wavelength ranges. In this case, the calculation system further includes a filter driving unit that selectively inserts at least two band-pass filters into the optical path of the illumination light.
また、本発明の一実施形態によれば、波長選択部は、例えば、第1バンドパスフィルタ、第2バンドパスフィルタ及び第3バンドパスフィルタを有する。この場合、第1バンドパスフィルタは、600nm以上の波長域の光を選択的に透過させ、第2バンドパスフィルタは、528nm以上且つ584nm以下の第2波長域の光を選択的に透過させ、第3バンドパスフィルタは、452nm以上且つ502nm以下の第3波長域の光を選択的に透過させる。
In addition, according to an embodiment of the present invention, the wavelength selection unit includes, for example, a first bandpass filter, a second bandpass filter, and a third bandpass filter. In this case, the first bandpass filter selectively transmits light in the wavelength range of 600 nm or more, and the second bandpass filter selectively transmits light in the second wavelength range of 528 nm or more and 584 nm or less, The third band pass filter selectively transmits light in a third wavelength range of 452 nm or more and 502 nm or less.
また、本発明の一実施形態によれば、波長選択部は、例えば、光源装置と生体組織との間に配置される。この場合、生体組織は、波長選択部によって特定波長域の光に選択された照明光によって照明される。
Moreover, according to one embodiment of the present invention, the wavelength selection unit is disposed, for example, between the light source device and the biological tissue. In this case, the living tissue is illuminated with the illumination light selected as the light in the specific wavelength range by the wavelength selection unit.
また、本発明の一実施形態によれば、波長選択部は、例えば、生体組織と撮像素子との間に配置され、生体組織で反射された反射光から特定波長の光を選択する。この場合、撮像素子は、波長選択部によって特定波長域の光に選択された反射光を受光する。
Further, according to an embodiment of the present invention, the wavelength selection unit is disposed between, for example, a living tissue and an imaging device, and selects light having a specific wavelength from reflected light reflected by the living tissue. In this case, the imaging device receives the reflected light selected as the light in the specific wavelength range by the wavelength selection unit.
本発明の一実施形態によれば、撮影画像のフレームレートの低下を生じさせることなく、生体組織の生体情報を計算可能な計算システムが提供される。
According to an embodiment of the present invention, a calculation system capable of calculating biological information of a living tissue without causing a decrease in the frame rate of a captured image is provided.
以下、本発明の計算システムの実施形態について図面を参照しながら説明する。本発明の計算システムは、電子内視鏡を備えた電子内視鏡システムやデジタルビデオカメラなどの撮像装置を備えた撮像システムに適用できる。
(第1実施形態)
第1実施形態は、本発明を電子内視鏡システムに適用した例である。第1実施形態の電子内視鏡システムは、波長域の異なる各々独立した帯域光で撮像した画像(第1実施形態では、1つのカラー画像を構成するR、G、Bの3波長域の画像)に基づいて被写体の生体情報(例えば、酸素飽和度や血液量)を定量的に分析して、分析結果を画像化して表示する装置である。以下に説明する第1実施形態の電子内視鏡システムを用いた酸素飽和度等の定量分析では、可視域における血液の分光特性(すなわち、ヘモグロビンの分光特性)が酸素飽和度に応じて連続的に変化する性質が利用される。 Hereinafter, embodiments of a calculation system according to the present invention will be described with reference to the drawings. The calculation system of the present invention can be applied to an electronic endoscope system including an electronic endoscope and an imaging system including an imaging device such as a digital video camera.
(First embodiment)
The first embodiment is an example in which the present invention is applied to an electronic endoscope system. The electronic endoscope system according to the first embodiment is an image picked up by independent band lights having different wavelength ranges (in the first embodiment, images of three wavelength ranges of R, G, and B constituting one color image). ) Based on the biological information (for example, oxygen saturation and blood volume) of the subject quantitatively, and the analysis result is imaged and displayed. In the quantitative analysis of oxygen saturation or the like using the electronic endoscope system of the first embodiment described below, the spectral characteristics of blood in the visible range (that is, the spectral characteristics of hemoglobin) are continuous according to the oxygen saturation. The changing nature is used.
[ヘモグロビンの分光特性及び酸素飽和度の計算原理]
本発明の実施形態に係る電子内視鏡システムの詳しい構成を説明する前に、可視域におけるヘモグロビンの分光特性と、本実施形態における酸素飽和度の計算原理について説明する。ヘモグロビンには、酸素化ヘモグロビン(HbO2)と還元ヘモグロビン(Hb)があり、酸素化ヘモグロビンが占める割合を酸素飽和度と呼ぶ。ヘモグロビンの分光特性は、酸素飽和度に応じて変化する。 [Calculation principle of spectral characteristics and oxygen saturation of hemoglobin]
Before describing the detailed configuration of the electronic endoscope system according to the embodiment of the present invention, the spectral characteristics of hemoglobin in the visible region and the calculation principle of oxygen saturation in the present embodiment will be described. Hemoglobin includes oxygenated hemoglobin (HbO 2 ) and reduced hemoglobin (Hb), and the proportion of oxygenated hemoglobin is called oxygen saturation. The spectral characteristics of hemoglobin vary with oxygen saturation.
図1に、ヘモグロビンの透過スペクトルを示す。図1の横軸は光の波長を示し、縦軸は光透過率Tを示す。図1における実線の波形は、酸素飽和度が100%の場合(すなわち、酸素化ヘモグロビン)の透過スペクトルであり、長破線の波形は、酸素飽和度が0%の場合(すなわち、還元ヘモグロビン)の透過スペクトルである。また、短破線は、その中間の酸素飽和度(10、20、30、・・・90%)におけるヘモグロビン(酸素化ヘモグロビンと還元ヘモグロビンの混合物)の透過スペクトルである。
Fig. 1 shows the transmission spectrum of hemoglobin. The horizontal axis in FIG. 1 indicates the wavelength of light, and the vertical axis indicates the light transmittance T. The solid line waveform in FIG. 1 is a transmission spectrum when the oxygen saturation is 100% (ie, oxygenated hemoglobin), and the long dashed waveform is when the oxygen saturation is 0% (ie, reduced hemoglobin). It is a transmission spectrum. The short dashed line is a transmission spectrum of hemoglobin (a mixture of oxygenated hemoglobin and reduced hemoglobin) at an intermediate oxygen saturation (10, 20, 30,... 90%).
なお、ヘモグロビンの吸収(吸光度)Aは、光透過率Tから以下の数式1により計算される。
(数1)
A=-logT The absorption (absorbance) A of hemoglobin is calculated from the light transmittance T according to the followingformula 1.
(Equation 1)
A = -logT
(数1)
A=-logT The absorption (absorbance) A of hemoglobin is calculated from the light transmittance T according to the following
(Equation 1)
A = -logT
図1に示されるように、ヘモグロビンの透過スペクトルには、酸素飽和度によらず光透過率T(すなわち、吸収A)が一定となる等吸収点E1(424nm)、E2(452nm)、E3(502nm)、E4(528nm)、E5(546nm)、E6(570nm)及びE7(584nm)が現れる。本明細書では、等吸収点E1からE2までの波長領域を波長域W1、等吸収点E2からE3までの波長領域を波長域W2、等吸収点E3からE4までの波長領域を波長域W3、等吸収点E4からE5までの波長領域を波長域W4、等吸収点E5からE6までの波長領域を波長域W5、等吸収点E6からE7までの波長領域を波長域W6と定義する。
As shown in FIG. 1, the transmission spectrum of hemoglobin has isoabsorption points E1 (424 nm), E2 (452 nm), E3 (where the light transmittance T (that is, absorption A) is constant regardless of the oxygen saturation). 502 nm), E4 (528 nm), E5 (546 nm), E6 (570 nm) and E7 (584 nm) appear. In this specification, the wavelength region from the equal absorption points E1 to E2 is the wavelength region W1, the wavelength region from the equal absorption points E2 to E3 is the wavelength region W2, and the wavelength region from the equal absorption points E3 to E4 is the wavelength region W3. The wavelength region from the equal absorption points E4 to E5 is defined as the wavelength region W4, the wavelength region from the equal absorption points E5 to E6 is defined as the wavelength region W5, and the wavelength region from the equal absorption points E6 to E7 is defined as the wavelength region W6.
隣接する等吸収点間では、酸素飽和度の増加に応じて光透過率Tが単調に増加又は減少する。また、隣接する等吸収点間では、光透過率Tは、酸素飽和度に対してほぼ線形的に変化する。図2は、波長域W2における酸素飽和度(横軸)とヘモグロビンを透過する光の光量(縦軸)との関係をプロットしたグラフである。なお、縦軸の透過光量は、波長域W2内の透過光量を積分した値である。図2のグラフより、波長域W2において、透過光量が酸素飽和度に対して単調に減少することがわかる。なお、波長域W2に隣接する波長域W1においては、透過光量が酸素飽和度に対して単調に増加する。
Between adjacent isosbestic points, the light transmittance T monotonously increases or decreases as the oxygen saturation increases. In addition, between the adjacent isosbestic points, the light transmittance T changes substantially linearly with respect to the oxygen saturation. FIG. 2 is a graph plotting the relationship between the oxygen saturation (horizontal axis) in the wavelength region W2 and the amount of light transmitted through hemoglobin (vertical axis). The transmitted light amount on the vertical axis is a value obtained by integrating the transmitted light amount in the wavelength region W2. From the graph of FIG. 2, it can be seen that the amount of transmitted light monotonously decreases with respect to the oxygen saturation in the wavelength region W2. In the wavelength range W1 adjacent to the wavelength range W2, the amount of transmitted light monotonously increases with respect to the oxygen saturation.
また、等吸収点E4からE7までの波長領域(すなわち、波長域W4~W6の連続した波長領域。本明細書では波長域W7と定義する。)に着目すると、図1に示すように、波長域W4及びW6においては、酸素飽和度の増加に応じて透過光量が単調に減少するが、波長域W5においては、逆に酸素飽和度の増加に応じて透過光量が単調に増加する。しかしながら、本発明者は、波長域W5における酸素飽和度の増加に伴う透過光量の減少量が、波長域W4及びW6における酸素飽和度の増加に伴う透過光量の増加量の和と略等しく、波長域W7全体としては透過光量が酸素飽和度に依らず略一定となることを見出した。言い換えると、波長域W7全体としてはヘモグロビンの吸収Aは、酸素飽和度に依らず略一定である。
When attention is paid to the wavelength region from the isosbestic points E4 to E7 (that is, the continuous wavelength region of the wavelength regions W4 to W6, defined in this specification as the wavelength region W7), as shown in FIG. In the regions W4 and W6, the amount of transmitted light monotonously decreases as the oxygen saturation increases. On the other hand, in the wavelength region W5, the amount of transmitted light monotonously increases as the oxygen saturation increases. However, the inventor has found that the amount of decrease in the amount of transmitted light accompanying an increase in oxygen saturation in the wavelength region W5 is substantially equal to the sum of the amount of increase in the amount of transmitted light accompanying an increase in oxygen saturation in the wavelength regions W4 and W6. It was found that the amount of transmitted light in the region W7 as a whole is substantially constant regardless of the oxygen saturation. In other words, the absorption A of hemoglobin in the entire wavelength region W7 is substantially constant regardless of the oxygen saturation.
図3は、波長域W7における酸素飽和度(横軸)とヘモグロビンを透過する光の光量(縦軸)との関係をプロットしたグラフである。なお、縦軸の透過光量は、波長域W7内の透過光量を積分した値である。透過光量の平均値は0.267(任意単位)、標準偏差は1.86×10⁻⁵であった。図3のグラフより、波長域W7全体では、透過光量が酸素飽和度に依らず略一定となることがわかる。
FIG. 3 is a graph plotting the relationship between the oxygen saturation (horizontal axis) in the wavelength region W7 and the amount of light transmitted through hemoglobin (vertical axis). The transmitted light amount on the vertical axis is a value obtained by integrating the transmitted light amount in the wavelength region W7. The average value of the amount of transmitted light was 0.267 (arbitrary unit), and the standard deviation was 1.86 × 10 −5 . From the graph of FIG. 3, it is understood that the transmitted light amount is substantially constant regardless of the oxygen saturation in the entire wavelength region W7.
また、図1に示されるように、概ね600nm以上の波長領域においては、光透過率Tが高く(ヘモグロビンによる光の吸収Aが少なく)、酸素飽和度が変化しても光透過率Tは殆ど変化しない。そのため、ヘモグロビン(血液)を含む被写体を、白色光で照明して観察する際に、600nm以上の波長領域(例えば600~660nm、もしくは620~660nmの波長領域)を、ヘモグロビンによる吸収が無い透明領域として、透過光量T(又は吸収A)の基準の波長域として使用することができる。本明細書では、波長620nmから波長660nmまでの波長領域を波長域WRと定義する。
Further, as shown in FIG. 1, in the wavelength region of approximately 600 nm or more, the light transmittance T is high (light absorption A by the hemoglobin is small), and the light transmittance T is almost unchanged even when the oxygen saturation is changed. It does not change. Therefore, when a subject including hemoglobin (blood) is illuminated with white light and observed, a wavelength region of 600 nm or more (for example, a wavelength region of 600 to 660 nm or 620 to 660 nm) is a transparent region that is not absorbed by hemoglobin. As a reference wavelength range of transmitted light amount T (or absorption A). In this specification, a wavelength region from a wavelength of 620 nm to a wavelength of 660 nm is defined as a wavelength region WR.
上述したように、波長域W2におけるヘモグロビンを透過する光の光量は酸素飽和度の増加に対して単調に減少し、波長域W7(波長域W4~W6)におけるヘモグロビンを透過する光の光量は酸素飽和度に依らず一定値とみなせる。そのため、波長域W2における透過光量、及び、波長域W7における透過光量に基づいて、被写体(生体組織)中のヘモグロビン(すなわち、血液)の量を示す指標及び血液の酸素飽和度を示す指標を得ることができる。従って、予め実験的に又は計算により血液量とそれを示す指標との関係、及び、酸素飽和度とそれを示す指標との関係を取得すれば、各指標の値から血液量や酸素飽和度を推定することができる。
As described above, the amount of light transmitted through hemoglobin in the wavelength region W2 monotonously decreases with an increase in oxygen saturation, and the amount of light transmitted through hemoglobin in the wavelength region W7 (wavelength regions W4 to W6) is oxygen. Regardless of the degree of saturation, it can be regarded as a constant value. Therefore, based on the transmitted light amount in the wavelength region W2 and the transmitted light amount in the wavelength region W7, an index indicating the amount of hemoglobin (that is, blood) in the subject (living tissue) and an index indicating the oxygen saturation level of blood are obtained. be able to. Therefore, if the relationship between the blood volume and the index indicating it and the relationship between the oxygen saturation and the index indicating it are obtained in advance experimentally or by calculation, the blood volume and oxygen saturation are calculated from the values of the respective indexes. Can be estimated.
なお、生体組織に対して照明光を照射し、生体組織での反射光に基づいて生体組織の観察を行う場合、ヘモグロビンに由来する生体組織の吸光度が大きいほど(光透過率が小さいほど)、生体組織による照明光の反射率が小さくなる。一方、ヘモグロビンの吸光度が小さいほど(光透過率が大きいほど)、生体組織による照明光の反射率が大きくなる。そのため、生体組織からの反射光を検出することにより、血液量を示す指標や酸素飽和度を示す指標を計算することができる。
In addition, when irradiating illumination light to a living tissue and observing the living tissue based on reflected light from the living tissue, the greater the absorbance of the living tissue derived from hemoglobin (the smaller the light transmittance), The reflectance of the illumination light by the living tissue becomes small. On the other hand, the smaller the absorbance of hemoglobin (the greater the light transmittance), the greater the reflectance of illumination light by the living tissue. Therefore, by detecting the reflected light from the living tissue, it is possible to calculate an index indicating the blood volume and an index indicating the oxygen saturation.
[電子内視鏡システム1全体の構成]
図4は、本発明の第1実施形態の電子内視鏡システム1の構成を示すブロック図である。図4に示されるように、電子内視鏡システム1は、電子スコープ100、プロセッサ200及びモニタ300を備えている。 [Configuration of the entire electronic endoscope system 1]
FIG. 4 is a block diagram showing a configuration of theelectronic endoscope system 1 according to the first embodiment of the present invention. As shown in FIG. 4, the electronic endoscope system 1 includes an electronic scope 100, a processor 200, and a monitor 300.
図4は、本発明の第1実施形態の電子内視鏡システム1の構成を示すブロック図である。図4に示されるように、電子内視鏡システム1は、電子スコープ100、プロセッサ200及びモニタ300を備えている。 [Configuration of the entire electronic endoscope system 1]
FIG. 4 is a block diagram showing a configuration of the
プロセッサ200は、システムコントローラ202、タイミングコントローラ204、画像処理回路220、ランプ208及び波長選択部の一例である光学フィルタ装置260を備えている。システムコントローラ202は、メモリ212に記憶された各種プログラムを実行し、電子内視鏡システム1全体を統合的に制御する。また、システムコントローラ202は、操作パネル214に接続されている。システムコントローラ202は、操作パネル214より入力されるユーザからの指示に応じて、電子内視鏡システム1の各動作及び各動作のためのパラメータを変更する。タイミングコントローラ204は、各部の動作のタイミングを調整するクロックパルスを電子内視鏡システム1内の各回路に出力する。
The processor 200 includes a system controller 202, a timing controller 204, an image processing circuit 220, a lamp 208, and an optical filter device 260 which is an example of a wavelength selection unit. The system controller 202 executes various programs stored in the memory 212 and controls the entire electronic endoscope system 1 in an integrated manner. The system controller 202 is connected to the operation panel 214. The system controller 202 changes each operation of the electronic endoscope system 1 and parameters for each operation in accordance with a user instruction input from the operation panel 214. The timing controller 204 outputs a clock pulse for adjusting the operation timing of each unit to each circuit in the electronic endoscope system 1.
本実施形態では、ランプ電源イグナイタ206及びランプ208が光源装置の一例を構成する。ランプ208は、ランプ電源イグナイタ206による始動後、照明光Lを射出する。ランプ208は、例えば、キセノンランプ、ハロゲンランプ、水銀ランプ、メタルハライドランプ等の高輝度ランプや白色LED(Light Emitting Diode)である。照明光Lは、主に可視域(又は近紫外域)から不可視である赤外域に広がるスペクトルを持つ光(又は少なくとも可視域を含む白色光)である。
In the present embodiment, the lamp power igniter 206 and the lamp 208 constitute an example of a light source device. The lamp 208 emits the illumination light L after being started by the lamp power igniter 206. The lamp 208 is, for example, a high-intensity lamp such as a xenon lamp, a halogen lamp, a mercury lamp, or a metal halide lamp, or a white LED (Light Emitting Diode). The illumination light L is light (or white light including at least the visible region) having a spectrum that extends mainly from the visible region (or near ultraviolet region) to the invisible infrared region.
ランプ208と集光レンズ210との間には、光学フィルタ装置260が配置されている。光学フィルタ装置260は、フィルタ駆動部264と、フィルタ駆動部264に装着された光学フィルタ262を備えている。フィルタ駆動部264は、光学フィルタ262を、照明光Lの光路上の位置(実線)と光路から退避した位置(破線)との間で、光路と直交する方向にスライド可能に構成されている。なお、フィルタ駆動部264の構成は、上述のものに限定されず、例えば回転フィルタ装置のように、光学フィルタ262の重心から外れた回動軸の周りに光学フィルタ262を回動させることにより、照明光Lの光路上に光学フィルタ262を挿抜する構成としてもよい。光学フィルタ262の詳細については後述する。
An optical filter device 260 is disposed between the lamp 208 and the condenser lens 210. The optical filter device 260 includes a filter driving unit 264 and an optical filter 262 attached to the filter driving unit 264. The filter driving unit 264 is configured to be able to slide the optical filter 262 in a direction orthogonal to the optical path between a position on the optical path of the illumination light L (solid line) and a position retracted from the optical path (broken line). The configuration of the filter driving unit 264 is not limited to the above-described one. For example, like the rotary filter device, by rotating the optical filter 262 around the rotation axis deviated from the center of gravity of the optical filter 262, The optical filter 262 may be inserted into and removed from the optical path of the illumination light L. Details of the optical filter 262 will be described later.
本実施形態の電子内視鏡システム1は、ランプ208から放射された白色光をそのまま(或いは、赤外成分及び/又は紫外成分を除去して)照明光(通常光Ln)として使用して内視鏡観察を行う通常観察モードと、白色光を光学フィルタ262に通して(或いは、更に赤外成分及び/又は紫外成分を除去して)得たフィルタ光Lfを照明光として使用して内視鏡観察を行う特殊観察モードと、特殊観察モードで使用される補正値を取得するためのベースライン測定モードの3つの動作モードで動作可能に構成されている。光学フィルタ262は、通常観察モードでは光路から退避した位置に配置され、特殊観察モードでは光路上に配置される。
The electronic endoscope system 1 according to the present embodiment uses white light emitted from the lamp 208 as it is (or by removing infrared components and / or ultraviolet components) as illumination light (normal light Ln). Normal observation mode for performing endoscopic observation and filtered light Lf obtained by passing white light through the optical filter 262 (or further removing the infrared component and / or ultraviolet component) as the illumination light. It is configured to be operable in three operation modes: a special observation mode for performing mirror observation and a baseline measurement mode for acquiring a correction value used in the special observation mode. The optical filter 262 is disposed at a position retracted from the optical path in the normal observation mode, and is disposed on the optical path in the special observation mode.
光学フィルタ装置260を通過した照明光L(フィルタ光Lf又は通常光Ln)は、集光レンズ210によってLCB(Light Carrying Bundle)102の入射端面に集光されて、LCB102内に導入される。
The illumination light L (filter light Lf or normal light Ln) that has passed through the optical filter device 260 is condensed on the incident end face of an LCB (Light Carrying Bundle) 102 by the condenser lens 210 and introduced into the LCB 102.
LCB102内に導入された照明光Lは、LCB102内を伝播して電子スコープ100の先端に配置されたLCB102の射出端面より射出され、配光レンズ104を介して被写体に照射される。照明光Lにより照射された被写体からの戻り光は、対物レンズ106を介して固体撮像素子108の受光面上で光学像を結ぶ。
The illumination light L introduced into the LCB 102 propagates through the LCB 102, is emitted from the exit end face of the LCB 102 disposed at the tip of the electronic scope 100, and is irradiated onto the subject via the light distribution lens 104. The return light from the subject irradiated with the illumination light L forms an optical image on the light receiving surface of the solid-state image sensor 108 via the objective lens 106.
固体撮像素子108は、ベイヤ型画素配置を有する単板式カラーCCD(Charge Coupled Device)イメージセンサである。固体撮像素子108は、受光面上の各画素で結像した光学像を光量に応じた電荷として蓄積して画素信号を生成して出力する。固体撮像素子108は、固体撮像素子108の各画素上に直接形成された赤色の光を透過させるRフィルタ、緑色の光を透過させるGフィルタ、青色の光を透過させるBフィルタの、いわゆるオンチップカラーフィルタを備えている。固体撮像素子108が生成する画素信号には、Rフィルタが装着された画素から出力された画素信号R、Gフィルタが装着された画素から出力された画素信号G及びBフィルタが装着された画素から出力された画素信号Bが含まれている。
The solid-state image sensor 108 is a single-plate color CCD (Charge Coupled Device) image sensor having a Bayer pixel arrangement. The solid-state image sensor 108 accumulates an optical image formed by each pixel on the light receiving surface as a charge corresponding to the amount of light, and generates and outputs a pixel signal. The solid-state imaging device 108 is a so-called on-chip configuration of an R filter that transmits red light directly formed on each pixel of the solid-state imaging device 108, a G filter that transmits green light, and a B filter that transmits blue light. A color filter is provided. The pixel signal generated by the solid-state image sensor 108 is the pixel signal R output from the pixel mounted with the R filter, the pixel signal output from the pixel mounted with the G filter, and the pixel mounted with the B filter. The output pixel signal B is included.
図5は、固体撮像素子108のRフィルタ、Gフィルタ及びBフィルタの透過スペクトルである。図5の横軸は波長を示し、縦軸は各フィルタの光透過率を示す。Rフィルタは、波長域WRを含む概ね600nm以上の波長領域の光を透過させるフィルタである。Gフィルタは、波長域W7を含む概ね510~630nmの波長領域の光を透過させるフィルタである。また、Bフィルタは、波長域W1及びW2を含む概ね510nm以下の波長領域の光を透過させるフィルタである。また、後述するように、光学フィルタ262は、波長域WR、W7及びW2の3つの波長領域の光のみを選択的に透過させる光学特性を有している。光学フィルタ262を透過した波長域WR、W7及びW2の光の像は、固体撮像素子108のRフィルタ、Gフィルタ及びBフィルタが装着された画素によってそれぞれ撮像され、画素信号R、G及びBとしてそれぞれ出力される。
FIG. 5 shows transmission spectra of the R filter, G filter, and B filter of the solid-state image sensor 108. The horizontal axis of FIG. 5 indicates the wavelength, and the vertical axis indicates the light transmittance of each filter. The R filter is a filter that transmits light in a wavelength region of approximately 600 nm or more including the wavelength region WR. The G filter is a filter that transmits light in a wavelength region of approximately 510 to 630 nm including the wavelength region W7. The B filter is a filter that transmits light in a wavelength region of approximately 510 nm or less including the wavelength regions W1 and W2. As will be described later, the optical filter 262 has an optical characteristic of selectively transmitting only light in the three wavelength regions of the wavelength regions WR, W7, and W2. The images of the light in the wavelength regions WR, W7, and W2 that have passed through the optical filter 262 are captured by the pixels to which the R filter, G filter, and B filter of the solid-state image sensor 108 are attached, and as pixel signals R, G, and B, respectively. Each is output.
なお、固体撮像素子108は、CCDイメージセンサに限らず、CMOS(Complementary Metal Oxide Semiconductor)イメージセンサやその他の種類の撮像装置に置き換えてもよい。
The solid-state image sensor 108 is not limited to a CCD image sensor, and may be replaced with a CMOS (Complementary Metal Oxide Semiconductor) image sensor or other types of image pickup devices.
図4に示されるように、電子スコープ100の接続部内には、ドライバ信号処理回路110が備えられている。ドライバ信号処理回路110には、画素信号がフィールド周期で固体撮像素子108より入力される。ドライバ信号処理回路110は、固体撮像素子108より入力される画素信号に対して所定の処理を施した後、プロセッサ200の画像処理回路220へ出力する。
As shown in FIG. 4, a driver signal processing circuit 110 is provided in the connection portion of the electronic scope 100. A pixel signal is input to the driver signal processing circuit 110 from the solid-state imaging device 108 in a field cycle. The driver signal processing circuit 110 performs predetermined processing on the pixel signal input from the solid-state image sensor 108 and then outputs the processed signal to the image processing circuit 220 of the processor 200.
ドライバ信号処理回路110はまた、メモリ112にアクセスして電子スコープ100の固有情報を読み出す。メモリ112に記録される電子スコープ100の固有情報には、例えば、固体撮像素子108の画素数や感度、動作可能なフィールドレート、型番等が含まれる。ドライバ信号処理回路110は、メモリ112より読み出された固有情報をシステムコントローラ202に出力する。
The driver signal processing circuit 110 also accesses the memory 112 and reads the unique information of the electronic scope 100. The unique information of the electronic scope 100 recorded in the memory 112 includes, for example, the number and sensitivity of the solid-state image sensor 108, the operable field rate, the model number, and the like. The driver signal processing circuit 110 outputs the unique information read from the memory 112 to the system controller 202.
システムコントローラ202は、電子スコープ100の固有情報に基づいて各種演算を行い、制御信号を生成する。システムコントローラ202は、生成された制御信号を用いて、プロセッサ200に接続されている電子スコープに適した処理がなされるようにプロセッサ200内の各種回路の動作やタイミングを制御する。
The system controller 202 performs various calculations based on the unique information of the electronic scope 100 and generates a control signal. The system controller 202 controls the operation and timing of various circuits in the processor 200 using the generated control signal so that processing suitable for the electronic scope connected to the processor 200 is performed.
タイミングコントローラ204は、システムコントローラ202によるタイミング制御に従って、ドライバ信号処理回路110にクロックパルスを供給する。ドライバ信号処理回路110は、タイミングコントローラ204から供給されるクロックパルスに従って、固体撮像素子108をプロセッサ200側で処理される映像のフィールドレートに同期したタイミングで駆動制御する。
The timing controller 204 supplies clock pulses to the driver signal processing circuit 110 according to the timing control by the system controller 202. The driver signal processing circuit 110 drives and controls the solid-state imaging device 108 at a timing synchronized with the field rate of the video processed on the processor 200 side in accordance with the clock pulse supplied from the timing controller 204.
信号処理部の一例である画像処理回路220は、ドライバ信号処理回路110より1フィールド周期で入力される画素信号に対して色補完、マトリクス演算、Y/C分離等の所定の信号処理を施した後、モニタ表示用の画面データを生成し、生成されたモニタ表示用の画面データを所定のビデオフォーマット信号に変換する。変換されたビデオフォーマット信号は、モニタ300に出力される。これにより、被写体の画像がモニタ300の表示画面に表示される。
The image processing circuit 220, which is an example of a signal processing unit, performs predetermined signal processing such as color interpolation, matrix calculation, and Y / C separation on the pixel signal input from the driver signal processing circuit 110 in one field cycle. Thereafter, screen data for monitor display is generated, and the generated screen data for monitor display is converted into a predetermined video format signal. The converted video format signal is output to the monitor 300. Thereby, the image of the subject is displayed on the display screen of the monitor 300.
また、画像処理回路220は、分析処理回路230を備えている。分析処理回路230は、特殊観察モードにおいて、取得した画素信号に基づいて分光学的な分析処理(信号処理)を行い、血液量や酸素飽和度等の生体組織の生体情報との相関を有する指標の値を計算し、計算結果を視覚的に表示するための画像データを生成する。
Further, the image processing circuit 220 includes an analysis processing circuit 230. The analysis processing circuit 230 performs spectroscopic analysis processing (signal processing) based on the acquired pixel signal in the special observation mode, and has an index having a correlation with biological information of biological tissue such as blood volume and oxygen saturation. Is calculated, and image data for visually displaying the calculation result is generated.
上述のように、本実施形態の電子内視鏡システム1は、光学フィルタ262を使用せず、ランプ208から放射された白色光(通常光Ln)を照明光として使用してする通常観察モードと、白色光を光学フィルタ262に通して得られるフィルタ光Lfを照明光として使用して分光学的な分析を行う特殊観察モードと、特殊観察用の補正値を取得するためのベースライン測定モードの3つのモードで動作するように構成されている。各モードの切り替えは、電子スコープ100の操作部又はプロセッサ200の操作パネル214に対するユーザ操作によって行われる。
As described above, the electronic endoscope system 1 according to the present embodiment does not use the optical filter 262, and the normal observation mode in which white light (normal light Ln) emitted from the lamp 208 is used as illumination light. The special observation mode for performing spectroscopic analysis using the filter light Lf obtained by passing the white light through the optical filter 262 as illumination light, and the baseline measurement mode for obtaining a correction value for special observation It is configured to operate in three modes. Switching between the modes is performed by a user operation on the operation unit of the electronic scope 100 or the operation panel 214 of the processor 200.
通常観察モードでは、システムコントローラ202は、光学フィルタ装置260を制御して光学フィルタ262を光路上から退避させ、被写体に通常光Lnを照射して撮像を行う。そして、固体撮像素子108を使用して撮像された画像データを、必要に応じて画像処理を施した後に、ビデオ信号に変換して、モニタ300に表示させる。
In the normal observation mode, the system controller 202 controls the optical filter device 260 to retract the optical filter 262 from the optical path, and performs imaging by irradiating the subject with the normal light Ln. Then, the image data captured using the solid-state image sensor 108 is subjected to image processing as necessary, and then converted into a video signal and displayed on the monitor 300.
特殊観察モード及びベースライン測定モードでは、システムコントローラ202は、光学フィルタ装置260を制御して光学フィルタ262を光路上に配置し、被写体にフィルタ光Lfを照射して撮像を行う。そして、特殊観察モードでは、固体撮像素子108を使用して撮像された画像データに基づいて、後述する分析処理を行う。
In the special observation mode and the baseline measurement mode, the system controller 202 controls the optical filter device 260 to place the optical filter 262 on the optical path, and performs imaging by irradiating the subject with the filter light Lf. In the special observation mode, analysis processing to be described later is performed based on image data captured using the solid-state image sensor 108.
ベースライン測定モードは、実際の内視鏡観察を行う前に、無彩色の拡散板や標準反射板等の色基準板を被写体として、フィルタ光Lfによる照明下で撮像を行い、後述する特殊観察モードの規格化処理に使用するデータを取得するモードである。
In the baseline measurement mode, before performing actual endoscopic observation, a color reference plate such as an achromatic diffuser or a standard reflector is used as an object for imaging under illumination with the filter light Lf, and special observation described later. In this mode, data used for mode normalization processing is acquired.
ベースライン測定モードにおいてフィルタ光Lfを用いて撮像した3原色の画像データR(x,y)、G(x,y)、B(x,y)は、それぞれベースライン画像データBLR(x,y)、BLG(x,y)、BLB(x,y)として、分析処理回路230の内部メモリに記憶される。なお、R(x,y)、G(x,y)、B(x,y)及びBLR(x,y)、BLG(x,y)、BLB(x,y)は、それぞれ画素(x,y)の画像データ及びベースライン画像データの値である。また、画素(x,y)は、固体撮像素子108の撮像面の水平方向の座標x及び垂直方向の座標yにより特定される。
The image data R (x, y), G (x, y), and B (x, y) of the three primary colors captured using the filter light Lf in the baseline measurement mode are the baseline image data BL R (x, y, y), BL G (x, y), and BL B (x, y) are stored in the internal memory of the analysis processing circuit 230. Note that R (x, y), G (x, y), B (x, y), BL R (x, y), BL G (x, y), and BL B (x, y) are pixels, respectively. This is the value of the image data (x, y) and the baseline image data. The pixel (x, y) is specified by the horizontal coordinate x and the vertical coordinate y of the imaging surface of the solid-state imaging device 108.
[光学フィルタの構成と特性]
図6は、光学フィルタ262の透過スペクトルである。光学フィルタ262は、少なくとも可視域において、波長域W2、W7及びWRの3つの波長領域の光のみを選択的に透過させる光学特性を有する1枚の誘電体多層膜フィルタである。光学フィルタ262は、各波長域W2、W7及びWRにおいて平坦な透過特性を有しているが、波長域W7における透過率は他の波長域W2及びWRよりも低く調整されている。これは、本実施形態で使用するランプ207の発光スペクトルが波長域W7内にピークを有しているため、波長域W7における透過率を下げることにより、光学フィルタ262を透過した後の各波長域W2、W7、WRの光量を略均一に揃えるためである。このフィルタの透過率特性は実際に用いる光源の分光特性、固体撮像素子108の感度特性に鑑みて決めることができる。なお、光学フィルタ262は、照明光Lを透過させる透過型の光学フィルタに限定されない。例えば、光学フィルタ262は、波長域W2、W7及びWRの3つの波長領域の光のみを選択的に反射させる反射型の光学フィルタを用いてもよい。或いは、光学フィルタ262は、波長域W2、W7及びWRの3つの波長領域以外の光を吸収する吸収型の光学フィルタを用いてもよい。 [Configuration and characteristics of optical filter]
FIG. 6 is a transmission spectrum of theoptical filter 262. The optical filter 262 is a single dielectric multilayer filter having optical characteristics that selectively transmits only light in the three wavelength regions of the wavelength regions W2, W7, and WR at least in the visible region. The optical filter 262 has a flat transmission characteristic in each of the wavelength ranges W2, W7, and WR, but the transmittance in the wavelength range W7 is adjusted to be lower than that in the other wavelength ranges W2 and WR. This is because the emission spectrum of the lamp 207 used in the present embodiment has a peak in the wavelength band W7, so that each wavelength band after passing through the optical filter 262 is reduced by reducing the transmittance in the wavelength band W7. This is because the light amounts of W2, W7, and WR are substantially uniform. The transmittance characteristics of this filter can be determined in view of the spectral characteristics of the light source actually used and the sensitivity characteristics of the solid-state image sensor 108. The optical filter 262 is not limited to a transmission type optical filter that transmits the illumination light L. For example, the optical filter 262 may be a reflective optical filter that selectively reflects only light in three wavelength regions of the wavelength regions W2, W7, and WR. Alternatively, the optical filter 262 may be an absorption type optical filter that absorbs light outside the three wavelength regions of the wavelength regions W2, W7, and WR.
図6は、光学フィルタ262の透過スペクトルである。光学フィルタ262は、少なくとも可視域において、波長域W2、W7及びWRの3つの波長領域の光のみを選択的に透過させる光学特性を有する1枚の誘電体多層膜フィルタである。光学フィルタ262は、各波長域W2、W7及びWRにおいて平坦な透過特性を有しているが、波長域W7における透過率は他の波長域W2及びWRよりも低く調整されている。これは、本実施形態で使用するランプ207の発光スペクトルが波長域W7内にピークを有しているため、波長域W7における透過率を下げることにより、光学フィルタ262を透過した後の各波長域W2、W7、WRの光量を略均一に揃えるためである。このフィルタの透過率特性は実際に用いる光源の分光特性、固体撮像素子108の感度特性に鑑みて決めることができる。なお、光学フィルタ262は、照明光Lを透過させる透過型の光学フィルタに限定されない。例えば、光学フィルタ262は、波長域W2、W7及びWRの3つの波長領域の光のみを選択的に反射させる反射型の光学フィルタを用いてもよい。或いは、光学フィルタ262は、波長域W2、W7及びWRの3つの波長領域以外の光を吸収する吸収型の光学フィルタを用いてもよい。 [Configuration and characteristics of optical filter]
FIG. 6 is a transmission spectrum of the
[特殊観察モードにおける分析処理]
次に、特殊観察モードにおいて、分析処理回路230によって行われる分析処理(信号処理)について説明する。本分析処理では、被写体である生体組織の生体情報の分析が行われる。詳しくは、生体組織の血液(ヘモグロビン)の含有量を示す指標、及び、酸素飽和度(ヘモグロビンのうち酸化ヘモグロビンが占める割合)を示す指標が計算される。図7は、分析処理を説明するフローチャートである。 [Analysis processing in special observation mode]
Next, analysis processing (signal processing) performed by theanalysis processing circuit 230 in the special observation mode will be described. In this analysis process, the biological information of the biological tissue that is the subject is analyzed. Specifically, an index indicating the content of blood (hemoglobin) in a living tissue and an index indicating oxygen saturation (a ratio of hemoglobin to oxyhemoglobin) are calculated. FIG. 7 is a flowchart illustrating the analysis process.
次に、特殊観察モードにおいて、分析処理回路230によって行われる分析処理(信号処理)について説明する。本分析処理では、被写体である生体組織の生体情報の分析が行われる。詳しくは、生体組織の血液(ヘモグロビン)の含有量を示す指標、及び、酸素飽和度(ヘモグロビンのうち酸化ヘモグロビンが占める割合)を示す指標が計算される。図7は、分析処理を説明するフローチャートである。 [Analysis processing in special observation mode]
Next, analysis processing (signal processing) performed by the
処理ステップS1では、固体撮像素子108を用いた被写体の撮像処理が行われ、3原色の画像データR(x,y)、G(x,y)、B(x,y)が分析処理回路230に入力される。
In the processing step S1, the subject is imaged using the solid-state image sensor 108, and the image data R (x, y), G (x, y), and B (x, y) of the three primary colors are analyzed. Is input.
処理ステップS2では、分析処理回路230により、入力された画像データR(x,y)、G(x,y)、B(x,y)を用いて、以下の分析処理(処理ステップS3~S6)の対象となる画素(x,y)を選別する画素選別処理が行われる。
In the processing step S2, the following analysis processing (processing steps S3 to S6) is performed using the image data R (x, y), G (x, y), and B (x, y) input by the analysis processing circuit 230. The pixel selection process for selecting the pixel (x, y) that is the target of () is performed.
被写体である生体組織のうち、血液を含んでいない箇所や、生体組織の色がヘモグロビン以外の物質により支配的な影響を受けている箇所の画像データは、画像データから得られる色情報に基づいて血液量や酸素飽和度を計算しても意味のある値が得られないため、単なるノイズとなる。このようなノイズを算出して医師に提供すると、適切な診断の妨げとなるだけでなく、分析処理回路230に無用な負荷を与えて処理速度を低下させるという弊害が生じる。そこで、本実施形態では、分析処理に適した画素(すなわち、血液の分光学的特徴が記録された画素)が選別され、選別された画素に対してのみ分析処理が行われるように構成されている。
Image data of a portion of the biological tissue that is the subject that does not contain blood or a portion where the color of the biological tissue is dominantly influenced by a substance other than hemoglobin is based on color information obtained from the image data. Even if the blood volume or oxygen saturation is calculated, a meaningful value cannot be obtained, so that it is merely noise. If such noise is calculated and provided to the doctor, it not only hinders an appropriate diagnosis, but also causes an adverse effect of reducing the processing speed by applying an unnecessary load to the analysis processing circuit 230. Therefore, in this embodiment, a pixel suitable for analysis processing (that is, a pixel in which the spectroscopic characteristics of blood are recorded) is selected, and the analysis processing is performed only on the selected pixel. Yes.
画素選別処理S2では、画像データが以下の数式2、数式3及び数式4の条件を全て充足する画素のみが分析処理の対象画素として選別される。
(数2)
B(x,y)/G(x,y)>a1
(数3)
R(x,y)/G(x,y)>a2
(数4)
R(x,y)/B(x,y)>a3
ここで、a1、a2、a3は正の定数である。 In the pixel sorting process S2, only pixels whose image data satisfies all the conditions of the followingformulas 2, 3, and 4 are sorted as the analysis target pixels.
(Equation 2)
B (x, y) / G (x, y)> a1
(Equation 3)
R (x, y) / G (x, y)> a2
(Equation 4)
R (x, y) / B (x, y)> a3
Here, a1, a2, and a3 are positive constants.
(数2)
B(x,y)/G(x,y)>a1
(数3)
R(x,y)/G(x,y)>a2
(数4)
R(x,y)/B(x,y)>a3
ここで、a1、a2、a3は正の定数である。 In the pixel sorting process S2, only pixels whose image data satisfies all the conditions of the following
(Equation 2)
B (x, y) / G (x, y)> a1
(Equation 3)
R (x, y) / G (x, y)> a2
(Equation 4)
R (x, y) / B (x, y)> a3
Here, a1, a2, and a3 are positive constants.
上記の3つの条件式は、血液の透過スペクトルにおける、「G成分<B成分<R成分」の値の大小関係に基づいて設定されている。なお、上記の3つの条件式のうちの1つ又は2つのみを使用して(例えば、血液に特有の赤色に注目して数式3及び/又は数式4のみを使用して)画素選別処理S2を行っても良い。
The above three conditional expressions are set based on the magnitude relationship of the values of “G component <B component <R component” in the blood transmission spectrum. It should be noted that pixel selection processing S2 using only one or two of the above three conditional expressions (for example, using only Expression 3 and / or Expression 4 focusing on the red color peculiar to blood). May be performed.
処理ステップS3では、画素選別処理S2で選別された画素の画像データに対する規格化処理が行われる。本実施形態の規格化処理S3は、電子内視鏡システム1自体の光学的特性(例えば光学フィルタ262の透過率や固体撮像素子108の受光感度)を補正して、定量的な分析を可能にするための処理である。
In processing step S3, normalization processing is performed on the image data of the pixels selected in the pixel selection processing S2. The normalization process S3 of the present embodiment corrects the optical characteristics of the electronic endoscope system 1 itself (for example, the transmittance of the optical filter 262 and the light receiving sensitivity of the solid-state imaging device 108), and enables quantitative analysis. It is a process to do.
規格化処理においては、分析処理回路230は、光学フィルタ262を透過したフィルタ光Lfを用いて取得した画像データR(x,y)及びベースライン画像データBLR(x,y)から、次の数式5により、規格化画像データRs(x,y)が計算される。
(数5)
Rs(x,y)=R(x,y)/BLR(x,y) In the normalization process, theanalysis processing circuit 230 calculates the following from the image data R (x, y) and the baseline image data BL R (x, y) acquired using the filter light Lf that has passed through the optical filter 262. The normalized image data Rs (x, y) is calculated by Equation 5.
(Equation 5)
Rs (x, y) = R (x, y) / BL R (x, y)
(数5)
Rs(x,y)=R(x,y)/BLR(x,y) In the normalization process, the
(Equation 5)
Rs (x, y) = R (x, y) / BL R (x, y)
同様に、次の数式6及び数式7により、規格化画像データGs(x,y)及びBs(x,y)が計算される。
(数6)
Gs(x,y)=G(x,y)/BLG(x,y)
(数7)
Bs(x,y)=B(x,y)/BLB(x,y) Similarly, normalized image data Gs (x, y) and Bs (x, y) are calculated by the following formulas 6 and 7.
(Equation 6)
Gs (x, y) = G (x, y) / BL G (x, y)
(Equation 7)
Bs (x, y) = B (x, y) / BL B (x, y)
(数6)
Gs(x,y)=G(x,y)/BLG(x,y)
(数7)
Bs(x,y)=B(x,y)/BLB(x,y) Similarly, normalized image data Gs (x, y) and Bs (x, y) are calculated by the following formulas 6 and 7.
(Equation 6)
Gs (x, y) = G (x, y) / BL G (x, y)
(Equation 7)
Bs (x, y) = B (x, y) / BL B (x, y)
なお、以下の説明では、規格化画像データRs(x,y)、Gs(x,y)、Bs(x,y)を使用するが、規格化処理を行わずに、規格化画像データRs(x,y)、Gs(x,y)、Bs(x,y)に替えて画像データR(x,y)、G(x,y)、B(x,y)を使用して指標の計算を行ってもよい。
In the following description, standardized image data Rs (x, y), Gs (x, y), and Bs (x, y) are used, but the standardized image data Rs ( Index calculation using image data R (x, y), G (x, y), B (x, y) instead of x, y), Gs (x, y), Bs (x, y) May be performed.
処理ステップS4では、以下の数式8により、酸素飽和度との相関を有する第1指標Xが計算される。
(数8)
X=Bs(x,y)/Gs(x,y) In the processing step S4, the first index X having a correlation with the oxygen saturation is calculated by the following formula 8.
(Equation 8)
X = Bs (x, y) / Gs (x, y)
(数8)
X=Bs(x,y)/Gs(x,y) In the processing step S4, the first index X having a correlation with the oxygen saturation is calculated by the following formula 8.
(Equation 8)
X = Bs (x, y) / Gs (x, y)
画像データGs(x,y)は、光学フィルタ262を透過した波長域W7の光によって形成された光学像を表すものである。また、画像データBs(x,y)は、光学フィルタ262を透過した波長域W2の光によって形成された光学像を表すものである。上述のように、生体組織による反波長域W2の光の射率(すなわち、画像データBs(x,y)の値)は、酸素飽和度及び血液量の両者に依存する。一方、生体組織による波長域W7の光の反射率(すなわち、画像データGs(x,y)の値)は、酸素飽和度には依存せず、血液量に依存する。そのため、規格化された反射率Bs(x,y)を規格化された反射率Gs(x,y)で除算することにより、血液量の寄与が相殺された指標を得ることができる。また、この除算により、生体組織の表面状態の寄与や生体組織への照明光(フィルタ光Lf)の入射角の寄与も相殺され、酸素飽和度の寄与のみを有する指標を得ることができる。従って、第1指標Xは、酸素飽和度の良い指標となる。
Image data Gs (x, y) represents an optical image formed by light in the wavelength region W7 that has passed through the optical filter 262. The image data Bs (x, y) represents an optical image formed by light in the wavelength region W2 that has passed through the optical filter 262. As described above, the emissivity of light in the anti-wavelength region W2 by the living tissue (that is, the value of the image data Bs (x, y)) depends on both the oxygen saturation and the blood volume. On the other hand, the reflectance of light in the wavelength region W7 by the living tissue (that is, the value of the image data Gs (x, y)) does not depend on the oxygen saturation but depends on the blood volume. Therefore, by dividing the normalized reflectance Bs (x, y) by the normalized reflectance Gs (x, y), an index in which the blood volume contribution is offset can be obtained. Further, by this division, the contribution of the surface state of the living tissue and the contribution of the incident angle of the illumination light (filter light Lf) to the living tissue are offset, and an index having only the contribution of oxygen saturation can be obtained. Therefore, the first index X is an index with good oxygen saturation.
処理ステップS5では、以下の数式9により、生体組織中の血液量との相関を有する第2指標Yが計算される。
(数9)
Y=Gs(x,y)/Rs(x,y) In the processing step S5, the second index Y having a correlation with the blood volume in the living tissue is calculated by the following formula 9.
(Equation 9)
Y = Gs (x, y) / Rs (x, y)
(数9)
Y=Gs(x,y)/Rs(x,y) In the processing step S5, the second index Y having a correlation with the blood volume in the living tissue is calculated by the following formula 9.
(Equation 9)
Y = Gs (x, y) / Rs (x, y)
上述したように、規格化された反射率Gs(x,y)は、酸素飽和度には依存せず、血液量に依存する値である。一方、規格化された反射率Rs(すなわち、画像データRs(x,y)の値)は、血液による吸収が殆ど無い波長域WRの光の生体組織による反射率であるため、酸素飽和度にも血液量にも依存しない。そのため、規格化された反射率Gsを規格化された反射率Rsで除算することにより、生体組織の表面状態の寄与や生体組織への照明光(フィルタ光Lf)の入射角の寄与が相殺され、血液量の寄与のみを有する指標を得ることができる。従って、第2指標Yは、血液量の良い指標となる。
As described above, the normalized reflectance Gs (x, y) is a value that does not depend on the oxygen saturation but depends on the blood volume. On the other hand, the normalized reflectance Rs (that is, the value of the image data Rs (x, y)) is the reflectance by the living tissue of the light in the wavelength region WR that is hardly absorbed by blood, and therefore, the oxygen saturation is reduced. It does not depend on blood volume. Therefore, by dividing the normalized reflectance Gs by the normalized reflectance Rs, the contribution of the surface state of the living tissue and the contribution of the incident angle of the illumination light (filter light Lf) to the living tissue are offset. An index having only blood volume contribution can be obtained. Therefore, the second index Y is a good index for blood volume.
処理ステップS6では、第1指標X及び第2指標Yに基づいて、酸素飽和度と血液量の論理演算結果を表す第3指標Zが計算される。
In processing step S6, based on the first index X and the second index Y, a third index Z representing the logical operation result of oxygen saturation and blood volume is calculated.
たとえば、悪性腫瘍の組織では、血管新生により正常な組織よりも血液量が多く、尚且つ、酸素の代謝が顕著であるため酸素飽和度は正常な組織よりも低いことが知られている。そこで、分析処理回路230は、数式8により計算した酸素飽和度を示す第1指標Xが所定の基準値(第1基準値)よりも小さく、且つ、数式9により計算した血液量を示す第2指標Yが所定の基準値(第2基準値)よりも大きな画素を抽出して、抽出した画素の第3指標Zの値を、悪性腫瘍の疑いがあることを示す「1」に設定し、その他の画素の第3指標Zの値を「0」に設定する。
For example, it is known that a tissue of a malignant tumor has a blood volume higher than that of a normal tissue due to angiogenesis, and oxygen metabolism is remarkable, so that oxygen saturation is lower than that of a normal tissue. Therefore, the analysis processing circuit 230 has a second index indicating the blood volume calculated by Expression 9 and the first index X indicating the oxygen saturation calculated by Expression 8 is smaller than a predetermined reference value (first reference value). A pixel whose index Y is larger than a predetermined reference value (second reference value) is extracted, and the value of the third index Z of the extracted pixel is set to “1” indicating that a malignant tumor is suspected. The values of the third index Z of other pixels are set to “0”.
また、第1指標X、第2指標Y及び第3指標Zをそれぞれ2値の指標とし、第1指標Xと第2指標Yとの論理積又は論理和として第3指標Zを計算する構成としてもよい。この場合、例えば、数式8の右辺の値が第1基準値未満の場合にX=1(酸素飽和度が正常値よりも低い)、第1基準値以上の場合にX=0(酸素飽和度が正常値)とし、数式9の右辺の値が第2基準値以上の場合にY=1(血液量が正常値よりも多い)、第2基準値未満の場合にY=0(血液量が正常値)として、Z=X・Y(論理積)又はZ=X+Y(論理和)によりZを計算することもできる。
Further, the first index X, the second index Y, and the third index Z are each a binary index, and the third index Z is calculated as a logical product or logical sum of the first index X and the second index Y. Also good. In this case, for example, X = 1 (the oxygen saturation is lower than the normal value) when the value on the right side of Formula 8 is less than the first reference value, and X = 0 (the oxygen saturation is greater than the first reference value). Is normal value), Y = 1 (the blood volume is greater than the normal value) when the value on the right side of Equation 9 is greater than or equal to the second reference value, and Y = 0 (the blood volume is less than the second reference value). As a normal value, Z can also be calculated by Z = X · Y (logical product) or Z = X + Y (logical sum).
上記は、第3指標Zを2値の指標とした場合の例であるが、第3指標Zを悪性腫瘍の疑いの度合を示す多値(あるいは実数等の連続値)の指標としてもよい。この場合、例えば、第1指標X(x,y)の第1基準値や平均値からの偏差と、第2指標Y(x,y)の第2基準値や平均値からの偏差に基づいて、悪性腫瘍の疑いの度合を示す第3指標Z(x,y)を計算する構成とすることができる。第3指標Z(x,y)は、例えば、第1指標X(x,y)の偏差と第2基準値の偏差との和(又は加重平均)や積として計算することができる。
The above is an example in which the third index Z is a binary index, but the third index Z may be a multi-value (or continuous value such as a real number) indicating the degree of suspicion of malignant tumor. In this case, for example, based on the deviation of the first index X (x, y) from the first reference value or average value and the deviation of the second index Y (x, y) from the second reference value or average value. The third index Z (x, y) indicating the degree of suspicion of malignant tumor may be calculated. The third index Z (x, y) can be calculated, for example, as the sum (or weighted average) or product of the deviation of the first index X (x, y) and the deviation of the second reference value.
処理ステップS7では、第1指標X(x,y)、第2指標Y(x,y)又は第3指標Z(x,y)のうち、予めユーザが指定したものを画素値(輝度)とする指標画像データが生成される。なお、本処理ステップS7において、第1指標X(x,y)、第2指標Y(x,y)及び第3指標Z(x,y)の全て(又は、いずれか2つ)の指標画像データを生成する構成としてもよい。
In the processing step S7, a pixel value (luminance) that is designated in advance by the user among the first index X (x, y), the second index Y (x, y), or the third index Z (x, y) is used. Index image data to be generated is generated. In this processing step S7, all (or any two) index images of the first index X (x, y), the second index Y (x, y), and the third index Z (x, y). It is good also as a structure which produces | generates data.
処理ステップS8では、画像データR(x,y)、G(x,y)、B(x,y)に対する色補正処理が行われる。光学フィルタ262を通したフィルタ光Lfは、R(波長域WR)、G(波長域W7)、B(波長域W2)の3原色のスペクトル成分を含むため、フィルタ光Lfを使用してカラー内視鏡画像を撮像することができる。しかしながら、フィルタ光Lfのスペクトルは帯域が限定されているため、フィルタ光Lfを使用して撮像した画像は、通常光Lnを使用して撮像した画像と比べて、色合いが不自然になる場合がある。そこで、本処理ステップS8では、フィルタ光Lfを使用して撮像した画像データR(x,y)、G(x,y)、B(x,y)に対して、通常光Lnを使用した場合に得られる画像に色合いを近づけるための色補正処理が行われる。これにより、擬似的に、通常光Lnを使用して撮像した画像(擬似通常観察画像)を得ることができる。
In processing step S8, color correction processing is performed on the image data R (x, y), G (x, y), and B (x, y). Since the filter light Lf that has passed through the optical filter 262 includes spectral components of the three primary colors of R (wavelength band WR), G (wavelength band W7), and B (wavelength band W2), the filter light Lf is used in the color. An endoscopic image can be taken. However, since the spectrum of the filter light Lf has a limited band, an image captured using the filter light Lf may be unnatural in color compared to an image captured using the normal light Ln. is there. Therefore, in this processing step S8, when the normal light Ln is used for the image data R (x, y), G (x, y), and B (x, y) imaged using the filter light Lf Color correction processing is performed to bring the hue close to the obtained image. Thereby, it is possible to obtain an image (pseudo normal observation image) picked up using the normal light Ln in a pseudo manner.
色補正処理S8は、例えば画像データR(x,y)、G(x,y)、B(x,y)に対して、予め取得した補正値CR、CG、CBを加算又は乗算することによって行われる。あるいは、カラーマトリクスMfを用意し、カラーマトリクス演算により色補正を行う構成としてもよい。補正値CR、CG、CBやカラーマトリクスMfは、例えばフィルタ光Lfで照明した色基準板を電子内視鏡システム1によって撮像して得た画像データに基づいて予め設定され、分析処理回路230の内部メモリに記憶される。また、色補正処理S8を行わない設定とすることもできる。
The color correction processing S8 adds or multiplies correction values C R , C G , and C B acquired in advance to, for example, image data R (x, y), G (x, y), and B (x, y). Is done by doing. Alternatively, a color matrix Mf may be prepared and color correction may be performed by color matrix calculation. The correction values C R , C G , C B and the color matrix Mf are set in advance based on image data obtained by imaging the color reference plate illuminated with the filter light Lf by the electronic endoscope system 1, for example, and analyzed. It is stored in the internal memory of the circuit 230. It is also possible to set so that the color correction process S8 is not performed.
処理ステップS9では、色補正処理S8を施した画像データや処理S7において生成した指標画像データ等に基づいて、モニタ300に表示するための画面データが生成される。画面データ生成処理S9では、例えば、内視鏡画像(擬似通常観察画像)と一種類以上の指標画像とを1画面上に並べて表示する複数画面表示、内視鏡画像のみを表示する内視鏡画像表示、ユーザが指定した一種類以上の指標画像のみを表示する指標画像表示等の各種の画面データを生成することができる。生成する画面データの種類は、電子スコープ100の操作部又はプロセッサ200の操作パネル214に対するユーザ操作によって選択される。
In process step S9, screen data to be displayed on the monitor 300 is generated based on the image data subjected to the color correction process S8, the index image data generated in process S7, and the like. In the screen data generation processing S9, for example, an endoscope image (pseudo normal observation image) and one or more types of index images are displayed side by side on a single screen, or an endoscope that displays only an endoscope image. Various screen data such as an image display and an index image display that displays only one or more types of index images specified by the user can be generated. The type of screen data to be generated is selected by a user operation on the operation unit of the electronic scope 100 or the operation panel 214 of the processor 200.
図8は、モニタ300に表示される画面の例である。図8(a)が内視鏡画像であり、図6(b)が酸素飽和度を示す第1指標X(x,y)の指標画像である。なお、図8の画像は、中指の近位指節間関節付近を輪ゴムで圧迫した状態の右手を観察したものである。図8(b)には、右中指の圧迫部よりも遠位側において、圧迫によって血流が阻害されたことにより、酸素飽和度が低くなっていることが示されている。また、圧迫部の近位側直近では、動脈血が滞留して、局所的に酸素飽和度が高くなっていることが読み取れる。
FIG. 8 is an example of a screen displayed on the monitor 300. FIG. 8A is an endoscopic image, and FIG. 6B is an index image of the first index X (x, y) indicating oxygen saturation. Note that the image in FIG. 8 is an observation of the right hand in a state where the vicinity of the proximal interphalangeal joint of the middle finger is pressed with a rubber band. FIG. 8B shows that the oxygen saturation is lowered due to the blood flow being blocked by the compression on the distal side of the compression part of the right middle finger. Further, it can be seen that arterial blood stays in the immediate vicinity of the compressed portion, and the oxygen saturation is locally high.
特殊観察モードにおいて、内視鏡画像と指標画像とをモニタ300上に2画面表示させながら内視鏡観察を行うことにより、血液量と酸素飽和度に特徴的変化がある悪性腫瘍をより確実に発見することが可能になる。また、悪性腫瘍が疑われる箇所を発見したときには、電子スコープ100の操作により、特殊観察モードから通常観察モードに迅速に切り替えて、より色再現性の高い通常観察画像を全画面表示させ、更に精密な診断を行うことができる。本実施形態の電子内視鏡システム1は、電子スコープ100の操作により、光学フィルタ262を光路上に自動的に挿抜して、画像処理の方法を変更するだけで、通常観察モードと特殊観察モードを容易且つ速やかに切り替えることができるように構成されている。
In the special observation mode, by performing endoscopic observation while displaying an endoscopic image and an index image on the monitor 300 on two screens, a malignant tumor having a characteristic change in blood volume and oxygen saturation can be more reliably detected. It becomes possible to discover. In addition, when a place where a malignant tumor is suspected is found, the electronic scope 100 is operated to quickly switch from the special observation mode to the normal observation mode, and the normal observation image with higher color reproducibility is displayed on the full screen. Can be diagnosed. The electronic endoscope system 1 according to the present embodiment can be operated in the normal observation mode and the special observation mode only by changing the image processing method by automatically inserting and removing the optical filter 262 on the optical path by operating the electronic scope 100. Is configured to be able to easily and quickly be switched.
また、本実施形態の電子内視鏡システム1では、3つの波長域W2、W7及びWRを分離する光学フィルタ262が採用され、更に、3つの波長域W2、W7及びWRが固体撮像素子108のBフィルタ、Gフィルタ及びRフィルタをそれぞれ透過する構成が採用されている。これらの構成により、1フレーム(2フィールド)の撮像により1フレームの内視鏡画像と指標画像を生成することが可能となる。そのため、特許文献2に開示されている内視鏡システムのように酸素飽和度の計算に複数フレームの画像データを使用しないため、特殊観察モードにおいて撮影画像のフレームレートが低下するという問題を生じさせることなく内視鏡画像と指標画像を同時に表示することができる。
Further, in the electronic endoscope system 1 of the present embodiment, an optical filter 262 that separates the three wavelength ranges W2, W7, and WR is employed, and further, the three wavelength ranges W2, W7, and WR are included in the solid-state image sensor 108. A configuration that transmits each of the B filter, the G filter, and the R filter is employed. With these configurations, it is possible to generate an endoscopic image and an index image of one frame by imaging one frame (two fields). Therefore, unlike the endoscope system disclosed in Patent Document 2, a plurality of frames of image data are not used for calculation of oxygen saturation, which causes a problem that the frame rate of a captured image decreases in the special observation mode. An endoscopic image and an index image can be displayed at the same time.
また、本実施形態によれば、光学フィルタ262は、3つの波長域W2、W7及びWRの光を透過させる特性を有している。そのため、特殊観察モードにおいて、照明光の光路に、それぞれ異なる透過特性を有する複数の光学フィルタを順次挿入する必要が無い。例えば、波長域W2の光のみを透過させる光学フィルタ、波長域W7の光のみを透過させる光学フィルタ、波長域WRの光のみを透過させる光学フィルタの3つの光学フィルタを択一的に照明光の光路に挿入して画像データを取得する場合、光学フィルタをフレームレートに同期させて移動させる移動機構が必要となる。そして、このような移動機構をもたせると、プロセッサ200が比較的に大型化・複雑化し、また、移動機構自体が可動部を含むため比較的に耐久性が低くなるというデメリットを来し得る。更に、複数の光学フィルタを照明光の光路に順次挿入する場合、光学フィルタが光路を横切る度に被写体に照射される照明光の光量が変動し、安定した明るさの画像データを得られない場合がある。しかし、本実施形態によれば、特殊観察モードでの撮像処理中に光学フィルタ262を駆動させる必要が無いため、プロセッサ200(光源装置)の大型化や耐久性の低下や、照明光の光量の変動を抑制することができる。
Further, according to the present embodiment, the optical filter 262 has a characteristic of transmitting light in the three wavelength ranges W2, W7, and WR. Therefore, in the special observation mode, there is no need to sequentially insert a plurality of optical filters having different transmission characteristics in the optical path of the illumination light. For example, an optical filter that transmits only light in the wavelength band W2, an optical filter that transmits only light in the wavelength band W7, and an optical filter that transmits only light in the wavelength band WR are alternatively selected from the three optical filters. When acquiring image data by inserting it into the optical path, a moving mechanism for moving the optical filter in synchronization with the frame rate is required. If such a moving mechanism is provided, the processor 200 becomes relatively large and complicated, and the moving mechanism itself includes a movable part, so that the durability becomes relatively low. Furthermore, when a plurality of optical filters are sequentially inserted into the optical path of the illumination light, the amount of illumination light applied to the subject fluctuates each time the optical filter crosses the optical path, and image data with stable brightness cannot be obtained. There is. However, according to the present embodiment, it is not necessary to drive the optical filter 262 during the imaging process in the special observation mode, so that the processor 200 (light source device) is increased in size and durability, and the amount of illumination light is reduced. Variations can be suppressed.
なお、本実施形態における光学フィルタ262の透過スペクトルは、図6に示すものに限定されない。光学フィルタ262を透過する波長域W2、W7及びWRの光の光量(詳しくは、最大光透過率)は、固体撮像素子108のオンチップカラーフィルタ(Rフィルタ、Gフィルタ及びBフィルタ)の透過スペクトルに応じて変更することができる。例えば、固体撮像素子108のGフィルタの光透過率を低くする一方、光学フィルタ262の波長域W7における光透過率を高くすることができる。
Note that the transmission spectrum of the optical filter 262 in the present embodiment is not limited to that shown in FIG. The amount of light (specifically, maximum light transmittance) in the wavelength ranges W2, W7, and WR transmitted through the optical filter 262 is the transmission spectrum of the on-chip color filter (R filter, G filter, and B filter) of the solid-state image sensor 108. It can be changed according to. For example, the light transmittance of the G filter of the solid-state image sensor 108 can be lowered, while the light transmittance of the optical filter 262 in the wavelength region W7 can be increased.
また、特許文献2に開示されている内視鏡システムのように2つのフレームの画像データを用いて酸素飽和度を計算する場合、固体撮像素子に対して被写体が移動すると、2つのフレーム間で撮像画像中の被写体像の位置が変化する場合がある。この場合、2つのフレームの画像を用いて酸素飽和度を正しく計算することができないという場合や、被写体像のエッジが強調されてしまうという場合が生じ得る。これに対し、本実施形態によれば、1つのフレームの撮像画像を用いて酸素飽和度等の生体情報が計算される。そのため、撮像処理中に被写体が移動したとしても、エッジが強調されることなく、生体情報を示す指標を正しく計算することができる。
Further, when the oxygen saturation is calculated using the image data of two frames as in the endoscope system disclosed in Patent Document 2, when the subject moves with respect to the solid-state image sensor, the two frames are used. The position of the subject image in the captured image may change. In this case, there may be a case where the oxygen saturation cannot be correctly calculated using the images of two frames, or the edge of the subject image is emphasized. On the other hand, according to the present embodiment, biological information such as oxygen saturation is calculated using the captured image of one frame. Therefore, even if the subject moves during the imaging process, the index indicating the biological information can be correctly calculated without enhancing the edge.
以上が本発明の例示的な一実施形態の説明である。本発明の実施形態は、上記に説明したものに限定されず、本発明の技術的思想の範囲において様々な変形が可能である。例えば明細書中に例示的に明示される実施形態等又は自明な実施形態等を適宜組み合わせた内容も本願の実施形態に含まれる。
This completes the description of an exemplary embodiment of the present invention. Embodiments of the present invention are not limited to those described above, and various modifications are possible within the scope of the technical idea of the present invention. For example, the embodiment of the present application also includes an embodiment that is exemplarily specified in the specification or a combination of obvious embodiments and the like as appropriate.
例えば、第1実施形態は、特殊観察モードで使用する青色の波長領域として波長域W2を使用した例であるが、波長域W2に替えて波長域W1を使用することもできる。図1に示すように、波長域W1は、波長域W2よりも、酸素化ヘモグロビンと還元ヘモグロビンとの光透過率T(すなわち、吸収)の差が大きい。そのため、波長域W1を使用することにより、酸素飽和度の変化をより高感度で検出することが可能になる。
For example, the first embodiment is an example in which the wavelength region W2 is used as the blue wavelength region used in the special observation mode, but the wavelength region W1 can be used instead of the wavelength region W2. As shown in FIG. 1, the wavelength region W1 has a larger difference in light transmittance T (that is, absorption) between oxygenated hemoglobin and reduced hemoglobin than the wavelength region W2. Therefore, by using the wavelength region W1, it is possible to detect a change in oxygen saturation with higher sensitivity.
また、上記の実施形態は、分光学的な分析結果をグレースケール又はモノクロの指標画像により表示する例であるが、分析結果の表示方法はこれに限定されない。例えば、指標値に応じて画像データR(x,y)、G(x,y)、B(x,y)に変更を加える構成としてもよい。例えば、指標値が基準値を超えた画素に対して、明度を高くする処理や、色相を変化させる処理(例えば、R成分を増加させて赤味を強くする処理や、色相を所定角度だけ回転させる処理)、画素を明滅させる(あるいは、周期的に色相を変化させる)処理を行うことができる。
Further, the above embodiment is an example in which the spectroscopic analysis result is displayed by a gray scale or monochrome index image, but the display method of the analysis result is not limited to this. For example, the image data R (x, y), G (x, y), and B (x, y) may be changed according to the index value. For example, for a pixel whose index value exceeds the reference value, a process for increasing the brightness, a process for changing the hue (for example, a process for increasing the red component by increasing the R component, or rotating the hue by a predetermined angle) And a process of blinking the pixels (or changing the hue periodically).
(第2実施形態)
次に、本発明の第2実施形態について説明する。第2実施形態は、第1実施形態と同様に、本発明を電子内視鏡システムに適用したものである。第2実施形態の電子内視鏡システムは、オンチップカラーフィルタを有していないモノクロ(グレースケール)画像撮像用の固体撮像素子を使用した、所謂面順次方式を採用している。図9は、第2実施形態の電子内視鏡システム2の構成を示すブロック図である。図9に示されるように、第2実施形態の電子内視鏡システム2は、光学フィルタ装置270を備えている。光学フィルタ装置270は、回転式ターレット273と、回転式ターレット273に接続されたモータ274、モータ274を駆動制御するモータ駆動回路275を備える。ここでは、モータ274及びモータ駆動回路275がフィルタ駆動部の一例を構成する。また、回転式ターレット270に、光学フィルタ272が取り付けられている。なお、以下では、説明の便宜の為、第1の実施形態と同等の構成要素には同一の符号を用いることとする。 (Second Embodiment)
Next, a second embodiment of the present invention will be described. In the second embodiment, as in the first embodiment, the present invention is applied to an electronic endoscope system. The electronic endoscope system according to the second embodiment employs a so-called frame sequential system that uses a solid-state imaging device for monochrome (grayscale) image capturing that does not have an on-chip color filter. FIG. 9 is a block diagram illustrating a configuration of the electronic endoscope system 2 according to the second embodiment. As shown in FIG. 9, the electronic endoscope system 2 of the second embodiment includes anoptical filter device 270. The optical filter device 270 includes a rotary turret 273, a motor 274 connected to the rotary turret 273, and a motor drive circuit 275 that drives and controls the motor 274. Here, the motor 274 and the motor drive circuit 275 constitute an example of a filter drive unit. An optical filter 272 is attached to the rotary turret 270. In the following description, for convenience of explanation, the same reference numerals are used for components equivalent to those in the first embodiment.
次に、本発明の第2実施形態について説明する。第2実施形態は、第1実施形態と同様に、本発明を電子内視鏡システムに適用したものである。第2実施形態の電子内視鏡システムは、オンチップカラーフィルタを有していないモノクロ(グレースケール)画像撮像用の固体撮像素子を使用した、所謂面順次方式を採用している。図9は、第2実施形態の電子内視鏡システム2の構成を示すブロック図である。図9に示されるように、第2実施形態の電子内視鏡システム2は、光学フィルタ装置270を備えている。光学フィルタ装置270は、回転式ターレット273と、回転式ターレット273に接続されたモータ274、モータ274を駆動制御するモータ駆動回路275を備える。ここでは、モータ274及びモータ駆動回路275がフィルタ駆動部の一例を構成する。また、回転式ターレット270に、光学フィルタ272が取り付けられている。なお、以下では、説明の便宜の為、第1の実施形態と同等の構成要素には同一の符号を用いることとする。 (Second Embodiment)
Next, a second embodiment of the present invention will be described. In the second embodiment, as in the first embodiment, the present invention is applied to an electronic endoscope system. The electronic endoscope system according to the second embodiment employs a so-called frame sequential system that uses a solid-state imaging device for monochrome (grayscale) image capturing that does not have an on-chip color filter. FIG. 9 is a block diagram illustrating a configuration of the electronic endoscope system 2 according to the second embodiment. As shown in FIG. 9, the electronic endoscope system 2 of the second embodiment includes an
図10は、回転式ターレット273の正面図である。光学フィルタ272は、波長域W2の光のみを透過させるバンドパスフィルタ272B、波長域W7の光のみを透過させるバンドパスフィルタ272G、波長域WRの光のみを透過させるバンドパスフィルタ272Rを有する。バンドパスフィルタ272B、272G、272Rは、それぞれ、第1、第2、第3バンドパスフィルタの一例である。図10に示すように、各バンドパスフィルタ272B、272G、272Rは、回転式ターレット273の円周方向に並べて配置されている。各バンドパスフィルタ272B、272G、272Rは扇形状を有しており、フレーム周期に応じた角度ピッチ(ここでは約120°の角度ピッチ)で配置されている。本実施形態では光学フィルタ272の1回転が1フレームに対応する。
FIG. 10 is a front view of the rotary turret 273. The optical filter 272 includes a bandpass filter 272B that transmits only light in the wavelength band W2, a bandpass filter 272G that transmits only light in the wavelength band W7, and a bandpass filter 272R that transmits only light in the wavelength band WR. Bandpass filters 272B, 272G, and 272R are examples of first, second, and third bandpass filters, respectively. As shown in FIG. 10, the band pass filters 272 </ b> B, 272 </ b> G, 272 </ b> R are arranged side by side in the circumferential direction of the rotary turret 273. Each band- pass filter 272B, 272G, 272R has a fan shape and is arranged at an angular pitch corresponding to the frame period (here, an angular pitch of about 120 °). In this embodiment, one rotation of the optical filter 272 corresponds to one frame.
モータ駆動回路275は、システムコントローラ202による制御下でモータ274を駆動する。回転式ターレット273がモータ274によって回転動作することにより、3つのバンドパスフィルタ272B、272G、272Rが、順次照明光の光路に挿入される。これにより、ランプ208から射出された照明光Lから、スペクトルの異なる3種類の照明光Lが、撮像と同期したタイミングで取り出される。具体的には、回転式ターレット273は、回転動作中、バンドパスフィルタ272Bにより波長域W2の照明光を、光学フィルタ272Gにより波長域W7の照明光を、バンドパスフィルタ272Rにより波長域WRの照明光を択一的に取り出す。取り出された照明光は、順次被写体に照射される。回転式ターレット273の回転位置や回転の位相は、回転式ターレット273の外周付近に形成された開口(不図示)をフォトインタラプタ276によって検出することにより制御される。
The motor drive circuit 275 drives the motor 274 under the control of the system controller 202. When the rotary turret 273 is rotated by the motor 274, the three band pass filters 272B, 272G, and 272R are sequentially inserted into the optical path of the illumination light. Thereby, three types of illumination light L having different spectra are extracted from the illumination light L emitted from the lamp 208 at a timing synchronized with imaging. Specifically, during the rotating operation, the rotary turret 273 emits illumination light in the wavelength region W2 by the bandpass filter 272B, illumination light in the wavelength region W7 by the optical filter 272G, and illumination in the wavelength region WR by the bandpass filter 272R. Take out light alternatively. The extracted illumination light is sequentially applied to the subject. The rotational position and rotational phase of the rotary turret 273 are controlled by detecting an opening (not shown) formed near the outer periphery of the rotary turret 273 with a photo interrupter 276.
固体撮像素子108´は、波長域W2の照明光が被写体に照射されている間に受光した光の光量に応じた電荷を画素信号Bとして出力する。固体撮像素子108´は、波長域W7の照明光が被写体に照射されている間に受光した光の光量に応じた電荷を画素信号Gとして出力する。固体撮像素子108´は、波長域WRの照明光が被写体に照射されている間に受光した光の光量に応じた電荷を画素信号Rとして出力する。これにより、第1実施形態において説明した分析処理に使用される画素信号R、G、Bを得ることができる。
The solid-state image sensor 108 ′ outputs, as a pixel signal B, a charge corresponding to the amount of light received while the subject is irradiated with illumination light in the wavelength region W2. The solid-state imaging device 108 ′ outputs, as a pixel signal G, a charge corresponding to the amount of light received while the object is irradiated with illumination light in the wavelength region W7. The solid-state imaging device 108 ′ outputs a charge corresponding to the amount of light received while the subject is irradiated with illumination light in the wavelength region WR as a pixel signal R. Thereby, the pixel signals R, G, and B used for the analysis processing described in the first embodiment can be obtained.
第1実施形態において説明したように、画素信号R、G、Bは、通常の内視鏡画像の表示と、生体情報の指標を表す指標画像の表示の両方に使用される。そのため、第2実施形態の電子内視鏡システム2では、指標画像を表示させるために新たに別の光学フィルタや光源装置を使用する必要が無い。そのため、撮影画像のフレームレートを落とすことなく内視鏡画像と指標画像を同時に表示させることができる。また、第2実施形態の電子内視鏡システム2では、被写体の撮像処理にオンチップカラーフィルタを有していないモノクロ画像撮像用の固体撮像素子108´が使用されるため、オンチップカラーフィルタを有する固体撮像素子を用いる場合に比べて高精細な撮影画像を得ることができる。
As described in the first embodiment, the pixel signals R, G, and B are used for both displaying a normal endoscopic image and displaying an index image representing an index of biological information. Therefore, in the electronic endoscope system 2 of the second embodiment, it is not necessary to newly use another optical filter or light source device in order to display the index image. Therefore, the endoscopic image and the index image can be displayed simultaneously without reducing the frame rate of the captured image. Further, in the electronic endoscope system 2 of the second embodiment, the solid-state imaging device 108 ′ for monochrome image capturing that does not have the on-chip color filter is used for subject imaging processing. A high-definition photographed image can be obtained as compared with the case of using the solid-state imaging device.
(第3実施形態)
次に、本発明の第3実施形態について説明する。第1、第2実施形態は、本発明を電子内視鏡システムに適用した例であるが、他の種類のデジタルカメラ(例えば、デジタル一眼レフカメラやデジタルビデオカメラ)を使用したシステムに本発明を適用することもできる。第3実施形態は、本発明を、デジタルビデオカメラを備える撮像システムに適用したものである。図11は、第3実施形態の撮像システム3の構成を示すブロック図である。撮像システム3は、光源装置30、光学フィルタ32、デジタルビデオカメラ(撮像装置)34、モニタ36を備えている。 (Third embodiment)
Next, a third embodiment of the present invention will be described. The first and second embodiments are examples in which the present invention is applied to an electronic endoscope system, but the present invention is applied to a system using another type of digital camera (for example, a digital single-lens reflex camera or a digital video camera). Can also be applied. In the third embodiment, the present invention is applied to an imaging system including a digital video camera. FIG. 11 is a block diagram illustrating a configuration of theimaging system 3 according to the third embodiment. The imaging system 3 includes a light source device 30, an optical filter 32, a digital video camera (imaging device) 34, and a monitor 36.
次に、本発明の第3実施形態について説明する。第1、第2実施形態は、本発明を電子内視鏡システムに適用した例であるが、他の種類のデジタルカメラ(例えば、デジタル一眼レフカメラやデジタルビデオカメラ)を使用したシステムに本発明を適用することもできる。第3実施形態は、本発明を、デジタルビデオカメラを備える撮像システムに適用したものである。図11は、第3実施形態の撮像システム3の構成を示すブロック図である。撮像システム3は、光源装置30、光学フィルタ32、デジタルビデオカメラ(撮像装置)34、モニタ36を備えている。 (Third embodiment)
Next, a third embodiment of the present invention will be described. The first and second embodiments are examples in which the present invention is applied to an electronic endoscope system, but the present invention is applied to a system using another type of digital camera (for example, a digital single-lens reflex camera or a digital video camera). Can also be applied. In the third embodiment, the present invention is applied to an imaging system including a digital video camera. FIG. 11 is a block diagram illustrating a configuration of the
光源装置30は、被写体Sを照明する照明光Lを射出する。照明光Lは、主に可視域から不可視である赤外光領域に広がるスペクトルを持つ光(又は少なくとも可視域を含む白色光)である。被写体Sにおいて反射された照明光L(反射光)は、光学フィルタ32に入射される。
The light source device 30 emits illumination light L that illuminates the subject S. The illumination light L is light having a spectrum (or white light including at least the visible range) that mainly extends from the visible range to the invisible infrared range. The illumination light L (reflected light) reflected from the subject S enters the optical filter 32.
光学フィルタ32の光学特性は、第1実施形態の光学フィルタ262の光学特性と同じである。すなわち、光学フィルタ32は、波長域W2、W7及びWRの3つの波長領域の光のみを選択的に透過させる。光学フィルタ32を透過した反射光は、撮像装置34に入射される。
The optical characteristics of the optical filter 32 are the same as the optical characteristics of the optical filter 262 of the first embodiment. That is, the optical filter 32 selectively transmits only light in the three wavelength regions of the wavelength regions W2, W7, and WR. The reflected light that has passed through the optical filter 32 enters the imaging device 34.
撮像装置34は、固体撮像素子や、固体撮像素子から出力された画素信号に対して信号処理を施す信号処理回路等を備えている。固体撮像素子は、各画素上に、Rフィルタ、Gフィルタ、Bフィルタのいわゆるオンチップカラーフィルタを備えている。固体撮像素子は、受光した反射光の光量に応じて、画素信号R、G、Bを出力する。
The imaging device 34 includes a solid-state imaging device, a signal processing circuit that performs signal processing on a pixel signal output from the solid-state imaging device, and the like. The solid-state imaging device includes a so-called on-chip color filter such as an R filter, a G filter, and a B filter on each pixel. The solid-state image sensor outputs pixel signals R, G, and B according to the amount of received reflected light.
撮像装置34は、画素信号R、G、Bに基づいて、第1実施形態の画像処理回路220と同様に、通常の内視鏡画像と生体情報の指標を表す指標画像を生成する。撮像装置34で生成された内視鏡画像および指標画像は、モニタ36に表示される。
The imaging device 34 generates a normal endoscopic image and an index image representing an index of biological information based on the pixel signals R, G, and B, similarly to the image processing circuit 220 of the first embodiment. The endoscopic image and the index image generated by the imaging device 34 are displayed on the monitor 36.
このように、第3実施形態では、光学フィルタ32は、光源装置30の照明光Lの射出方向前方(光源装置30と被写体Sとの間)ではなく、固体撮像素子の前方(固体撮像素子と被写体Sとの間)に配置される。これにより、被写体を照明する照明光Lの分光特性を変化させることなく、内視鏡画像と指標画像の両方を表示することができる。また、第3実施形態では、撮像装置34を被写体Sから離して配置可能であるため、撮像システム3による分析処理と術者による被写体Sの直接観察を同時に行うことができる。また、第3実施形態では、分析処理時に照明光Lの分光特性を変化させないため、被写体Sを直接観察している術者から見たときに、照明光Lによって被写体Sの色味が変化してしまうことを防止することができる。
As described above, in the third embodiment, the optical filter 32 is not in front of the emission direction of the illumination light L of the light source device 30 (between the light source device 30 and the subject S), but in front of the solid-state imaging device (with the solid-state imaging device). Between the subject S). Thus, both the endoscopic image and the index image can be displayed without changing the spectral characteristics of the illumination light L that illuminates the subject. In the third embodiment, since the imaging device 34 can be arranged away from the subject S, analysis processing by the imaging system 3 and direct observation of the subject S by the surgeon can be performed simultaneously. In the third embodiment, since the spectral characteristics of the illumination light L are not changed during the analysis process, the color of the subject S changes due to the illumination light L when viewed from an operator who directly observes the subject S. Can be prevented.
また、第3実施形態では、第1実施形態と同様に1フレーム(2フィールド)の撮像により内視鏡画像と指標画像を生成することが可能である。よって、特許文献2のようにフレーム毎に光源装置を切り替える必要がないため、フレームレートの低下を生じさせることなく内視鏡画像と指標画像を同時に表示することができる。
Also, in the third embodiment, it is possible to generate an endoscopic image and an index image by imaging one frame (two fields) as in the first embodiment. Therefore, since it is not necessary to switch the light source device for each frame as in Patent Document 2, it is possible to simultaneously display the endoscopic image and the index image without causing a decrease in the frame rate.
また、第1、第2実施形態では、光学フィルタ262、272は、光源装置(ランプ208)の前方に配置され、第3実施形態では、光学フィルタ32は固体撮像素子の前方に配置されているが、本発明はこれに限定されない。光学フィルタは、光源装置から固体撮像素子までの照明光の光路上のいずれかの位置に配置することができる。
In the first and second embodiments, the optical filters 262 and 272 are disposed in front of the light source device (lamp 208). In the third embodiment, the optical filter 32 is disposed in front of the solid-state imaging device. However, the present invention is not limited to this. The optical filter can be disposed at any position on the optical path of the illumination light from the light source device to the solid-state imaging device.
例えば、第1実施形態の電子内視鏡システム1において、光学フィルタ262は、配光レンズ104の前方、対物レンズ106の前方又は対物レンズ106と固体撮像素子108の間に配置されていてもよい。また、第3実施形態の撮像システム3において、光学フィルタ32は、光源装置30の前方に配置されていてもよい。
For example, in the electronic endoscope system 1 of the first embodiment, the optical filter 262 may be disposed in front of the light distribution lens 104, in front of the objective lens 106, or between the objective lens 106 and the solid-state image sensor 108. . In the imaging system 3 of the third embodiment, the optical filter 32 may be disposed in front of the light source device 30.
また、光学フィルタは、波長選択可能な反射部材であってよく、例えば、ダイクロイックミラーでもよい。この場合、ダイクロイックミラーは、フィルタ光Lfとする照明光を反射し、フィルタ光Lf以外の光は透過する性質を有する。
Also, the optical filter may be a wavelength selectable reflecting member, for example, a dichroic mirror. In this case, the dichroic mirror has a property of reflecting illumination light as the filter light Lf and transmitting light other than the filter light Lf.
Claims (10)
- 照明光を射出する1つの光源装置と、
前記照明光に含まれる少なくとも2つの特定波長域の光を選択する波長選択部と、
被写体である生体組織からの光を受光し、受光した光に応じた画素信号を出力する撮像素子と、
前記撮像素子から出力された画素信号に対して所定の信号処理を施す信号処理部と、
を備え、
前記信号処理部は、前記撮像素子から前記少なくとも2つの特定波長域の光に応じて出力された前記画素信号に基づいて、前記生体組織に含まれる所定の生体物質の濃度を示す指標を算出する、
計算システム。 One light source device for emitting illumination light;
A wavelength selection unit that selects light of at least two specific wavelength regions included in the illumination light;
An image sensor that receives light from a living tissue as a subject and outputs a pixel signal corresponding to the received light;
A signal processing unit that performs predetermined signal processing on the pixel signal output from the image sensor;
With
The signal processing unit calculates an index indicating a concentration of a predetermined biological material contained in the biological tissue based on the pixel signal output from the imaging element according to the light in the at least two specific wavelength ranges. ,
Calculation system. - 前記撮像素子は、各画素の受光面上にカラー撮影のための3色のカラーフィルタを有し、該3色のうちの2色の波長域が前記2つの特定波長域をそれぞれ含む、
請求項1に記載の計算システム。 The imaging device has three color filters for color photography on the light receiving surface of each pixel, and the two color wavelength ranges of the three colors include the two specific wavelength ranges, respectively.
The calculation system according to claim 1. - 前記カラーフィルタは、透過させる光の波長域が互いに異なるRフィルタ、Gフィルタ、Bフィルタを含み、
前記Gフィルタが透過させる一方の前記特定波長域は、前記ヘモグロビンの所定の2つの等吸収点によって区画される波長域を含み、
前記Bフィルタが透過させる他方の前記特定波長域は、前記ヘモグロビンの、前記所定の2つの等吸収点とは異なる2つの等吸収点によって区画される波長域を含む、
請求項2に記載の計算システム。 The color filter includes an R filter, a G filter, and a B filter having different wavelength ranges of light to be transmitted,
The one specific wavelength range that the G filter transmits includes a wavelength range defined by two predetermined isosbestic points of the hemoglobin,
The other specific wavelength range transmitted by the B filter includes a wavelength range defined by two isosbestic points different from the predetermined two isosbestic points of the hemoglobin.
The calculation system according to claim 2. - 前記Rフィルタが透過させる光の波長域は、600nm以上の第1波長域を含み、
前記Gフィルタが透過させる光の波長域は、528nm以上且つ584nm以下の第2波長域を含み、
前記Bフィルタが透過させる光の波長域は、452nm以上且つ502nm以下の第3波長域を含む、
請求項3に記載の計算システム。 The wavelength range of light transmitted by the R filter includes a first wavelength range of 600 nm or more,
The wavelength range of light transmitted by the G filter includes a second wavelength range of 528 nm or more and 584 nm or less,
The wavelength range of light transmitted by the B filter includes a third wavelength range of 452 nm or more and 502 nm or less,
The calculation system according to claim 3. - 前記波長選択部は、前記照明光に含まれる、前記第1波長域、前記第2波長域及び前記第3波長域の光を選択する、
請求項3又は請求項4に記載の計算システム。 The wavelength selection unit selects light in the first wavelength range, the second wavelength range, and the third wavelength range included in the illumination light.
The calculation system according to claim 3 or 4. - 前記波長選択部は、前記少なくとも2つの特定波長域の光を選択的に透過又は反射させる単一の光学フィルタである、
請求項2から請求項5の何れか一項に記載の計算システム。 The wavelength selection unit is a single optical filter that selectively transmits or reflects light in the at least two specific wavelength ranges.
The calculation system according to any one of claims 2 to 5. - 前記波長選択部は、前記少なくとも2つの特定波長域にそれぞれ対応する少なくとも2つのバンドパスフィルタを有し、
前記少なくとも2つのバンドパスフィルタを択一的に前記照明光の光路に挿入するフィルタ駆動部を更に備える、
請求項1に記載の計算システム。 The wavelength selection unit has at least two bandpass filters respectively corresponding to the at least two specific wavelength ranges,
A filter driving unit that alternatively inserts the at least two band-pass filters into the optical path of the illumination light;
The calculation system according to claim 1. - 前記波長選択部は、第1バンドパスフィルタ、第2バンドパスフィルタ及び第3バンドパスフィルタを有し、
前記第1バンドパスフィルタは、600nm以上の波長域の光を選択的に透過させ、
前記第2バンドパスフィルタは、528nm以上且つ584nm以下の第2波長域の光を選択的に透過させ、
前記第3バンドパスフィルタは、452nm以上且つ502nm以下の第3波長域の光を選択的に透過させる、
請求項7に記載の計算システム。 The wavelength selection unit includes a first bandpass filter, a second bandpass filter, and a third bandpass filter,
The first band pass filter selectively transmits light in a wavelength region of 600 nm or more,
The second bandpass filter selectively transmits light in a second wavelength range of 528 nm or more and 584 nm or less;
The third band pass filter selectively transmits light in a third wavelength range of 452 nm or more and 502 nm or less;
The calculation system according to claim 7. - 前記波長選択部は、前記光源装置と前記生体組織との間に配置され、
前記生体組織は、前記波長選択部によって前記特定波長域の光に選択された前記照明光によって照明される、
請求項1から請求項8の何れか一項に記載の計算システム。 The wavelength selection unit is disposed between the light source device and the living tissue,
The biological tissue is illuminated by the illumination light selected by the wavelength selection unit as light in the specific wavelength range.
The calculation system according to any one of claims 1 to 8. - 前記波長選択部は、
前記生体組織と前記撮像素子との間に配置され、
前記生体組織で反射された反射光から前記特定波長の光を選択し、
前記撮像素子は、前記波長選択部によって前記特定波長域の光に選択された前記反射光を受光する、
請求項1から請求項8の何れか一項に記載の計算システム。 The wavelength selector is
Arranged between the biological tissue and the imaging device;
Selecting light of the specific wavelength from the reflected light reflected by the biological tissue,
The image sensor receives the reflected light selected as the light in the specific wavelength range by the wavelength selection unit,
The calculation system according to any one of claims 1 to 8.
Priority Applications (3)
| Application Number | Priority Date | Filing Date | Title |
|---|---|---|---|
| CN201780013504.9A CN108697307A (en) | 2016-02-26 | 2017-01-10 | computing system |
| DE112017001021.7T DE112017001021T5 (en) | 2016-02-26 | 2017-01-10 | CALCULATION SYSTEM |
| US16/079,527 US20190069768A1 (en) | 2016-02-26 | 2017-01-10 | Calculation system |
Applications Claiming Priority (2)
| Application Number | Priority Date | Filing Date | Title |
|---|---|---|---|
| JP2016-035684 | 2016-02-26 | ||
| JP2016035684A JP2017148392A (en) | 2016-02-26 | 2016-02-26 | Calculation system |
Publications (1)
| Publication Number | Publication Date |
|---|---|
| WO2017145529A1 true WO2017145529A1 (en) | 2017-08-31 |
Family
ID=59685048
Family Applications (1)
| Application Number | Title | Priority Date | Filing Date |
|---|---|---|---|
| PCT/JP2017/000397 WO2017145529A1 (en) | 2016-02-26 | 2017-01-10 | Calculation system |
Country Status (5)
| Country | Link |
|---|---|
| US (1) | US20190069768A1 (en) |
| JP (1) | JP2017148392A (en) |
| CN (1) | CN108697307A (en) |
| DE (1) | DE112017001021T5 (en) |
| WO (1) | WO2017145529A1 (en) |
Cited By (1)
| Publication number | Priority date | Publication date | Assignee | Title |
|---|---|---|---|---|
| WO2019198293A1 (en) * | 2018-04-11 | 2019-10-17 | ソニー株式会社 | Microscope system and medical light source device |
Families Citing this family (29)
| Publication number | Priority date | Publication date | Assignee | Title |
|---|---|---|---|---|
| EP3590402A4 (en) * | 2017-03-03 | 2020-03-11 | Fujifilm Corporation | Endoscope system, processor device, and endoscope system operation method |
| US11885954B2 (en) | 2018-08-31 | 2024-01-30 | Hoya Corporation | Endoscope system |
| CN112889350A (en) * | 2018-09-18 | 2021-06-01 | Ai智者有限公司 | System and process for identification and illumination of anatomical parts of a person and of items at such parts |
| US11069280B2 (en) | 2018-10-25 | 2021-07-20 | Baylor University | System and method for a multi-primary wide gamut color system |
| US11403987B2 (en) | 2018-10-25 | 2022-08-02 | Baylor University | System and method for a multi-primary wide gamut color system |
| US11410593B2 (en) | 2018-10-25 | 2022-08-09 | Baylor University | System and method for a multi-primary wide gamut color system |
| US10950161B2 (en) | 2018-10-25 | 2021-03-16 | Baylor University | System and method for a six-primary wide gamut color system |
| US11043157B2 (en) | 2018-10-25 | 2021-06-22 | Baylor University | System and method for a six-primary wide gamut color system |
| US11315467B1 (en) | 2018-10-25 | 2022-04-26 | Baylor University | System and method for a multi-primary wide gamut color system |
| US11037481B1 (en) | 2018-10-25 | 2021-06-15 | Baylor University | System and method for a multi-primary wide gamut color system |
| US10950162B2 (en) | 2018-10-25 | 2021-03-16 | Baylor University | System and method for a six-primary wide gamut color system |
| US11488510B2 (en) | 2018-10-25 | 2022-11-01 | Baylor University | System and method for a multi-primary wide gamut color system |
| US11030934B2 (en) | 2018-10-25 | 2021-06-08 | Baylor University | System and method for a multi-primary wide gamut color system |
| US11532261B1 (en) | 2018-10-25 | 2022-12-20 | Baylor University | System and method for a multi-primary wide gamut color system |
| US11062638B2 (en) | 2018-10-25 | 2021-07-13 | Baylor University | System and method for a multi-primary wide gamut color system |
| US11289000B2 (en) | 2018-10-25 | 2022-03-29 | Baylor University | System and method for a multi-primary wide gamut color system |
| US11373575B2 (en) | 2018-10-25 | 2022-06-28 | Baylor University | System and method for a multi-primary wide gamut color system |
| US11069279B2 (en) | 2018-10-25 | 2021-07-20 | Baylor University | System and method for a multi-primary wide gamut color system |
| US11587491B1 (en) | 2018-10-25 | 2023-02-21 | Baylor University | System and method for a multi-primary wide gamut color system |
| US10607527B1 (en) | 2018-10-25 | 2020-03-31 | Baylor University | System and method for a six-primary wide gamut color system |
| US11289003B2 (en) | 2018-10-25 | 2022-03-29 | Baylor University | System and method for a multi-primary wide gamut color system |
| US11189210B2 (en) | 2018-10-25 | 2021-11-30 | Baylor University | System and method for a multi-primary wide gamut color system |
| US11341890B2 (en) | 2018-10-25 | 2022-05-24 | Baylor University | System and method for a multi-primary wide gamut color system |
| US10997896B2 (en) | 2018-10-25 | 2021-05-04 | Baylor University | System and method for a six-primary wide gamut color system |
| US11475819B2 (en) | 2018-10-25 | 2022-10-18 | Baylor University | System and method for a multi-primary wide gamut color system |
| JP7301595B2 (en) * | 2019-05-09 | 2023-07-03 | 富士フイルム株式会社 | Endoscopic system, processor device, and method of operating the endoscope system |
| JP7166448B2 (en) * | 2019-05-21 | 2022-11-07 | 富士フイルム株式会社 | Endoscope system, method of operating endoscope system, image processing device, and program for image processing device |
| WO2021026158A1 (en) * | 2019-08-05 | 2021-02-11 | GYRUS ACMI, INC., d/b/a Olympus Surgical Technologies America | Signal coordinated delivery of laser therapy |
| CN117136549A (en) * | 2021-05-07 | 2023-11-28 | Oppo广东移动通信有限公司 | Camera system, method for skin characteristic analysis and non-transitory computer readable medium storing program instructions for implementing the method |
Citations (3)
| Publication number | Priority date | Publication date | Assignee | Title |
|---|---|---|---|---|
| JP2003527916A (en) * | 2000-03-28 | 2003-09-24 | ボード・オブ・リージェンツ,ザ・ユニヴァーシティ・オヴ・テキサス・システム | Method and apparatus for diagnostic multispectral digital imaging |
| WO2012124227A1 (en) * | 2011-03-15 | 2012-09-20 | オリンパスメディカルシステムズ株式会社 | Medical device |
| JP2016022043A (en) * | 2014-07-17 | 2016-02-08 | Hoya株式会社 | Method for creating image showing concentration distribution of biological substances in biological tissue |
Family Cites Families (3)
| Publication number | Priority date | Publication date | Assignee | Title |
|---|---|---|---|---|
| DE4330460C2 (en) * | 1993-09-08 | 1996-05-23 | Siemens Ag | Device for examining tissue with light of different wavelengths |
| JP2012245223A (en) | 2011-05-30 | 2012-12-13 | Hoya Corp | Electronic endoscope apparatus and spectral image optimization method |
| JP2013099464A (en) | 2011-11-09 | 2013-05-23 | Fujifilm Corp | Endoscope system, processor device in endoscope system, and image display method |
-
2016
- 2016-02-26 JP JP2016035684A patent/JP2017148392A/en active Pending
-
2017
- 2017-01-10 WO PCT/JP2017/000397 patent/WO2017145529A1/en active Application Filing
- 2017-01-10 US US16/079,527 patent/US20190069768A1/en not_active Abandoned
- 2017-01-10 CN CN201780013504.9A patent/CN108697307A/en active Pending
- 2017-01-10 DE DE112017001021.7T patent/DE112017001021T5/en not_active Withdrawn
Patent Citations (3)
| Publication number | Priority date | Publication date | Assignee | Title |
|---|---|---|---|---|
| JP2003527916A (en) * | 2000-03-28 | 2003-09-24 | ボード・オブ・リージェンツ,ザ・ユニヴァーシティ・オヴ・テキサス・システム | Method and apparatus for diagnostic multispectral digital imaging |
| WO2012124227A1 (en) * | 2011-03-15 | 2012-09-20 | オリンパスメディカルシステムズ株式会社 | Medical device |
| JP2016022043A (en) * | 2014-07-17 | 2016-02-08 | Hoya株式会社 | Method for creating image showing concentration distribution of biological substances in biological tissue |
Cited By (1)
| Publication number | Priority date | Publication date | Assignee | Title |
|---|---|---|---|---|
| WO2019198293A1 (en) * | 2018-04-11 | 2019-10-17 | ソニー株式会社 | Microscope system and medical light source device |
Also Published As
| Publication number | Publication date |
|---|---|
| US20190069768A1 (en) | 2019-03-07 |
| JP2017148392A (en) | 2017-08-31 |
| DE112017001021T5 (en) | 2018-11-29 |
| CN108697307A (en) | 2018-10-23 |
Similar Documents
| Publication | Publication Date | Title |
|---|---|---|
| WO2017145529A1 (en) | Calculation system | |
| JP6204314B2 (en) | Electronic endoscope system | |
| CN105615894B (en) | Analysis device and analysis method | |
| JP6467562B2 (en) | Endoscope system | |
| US10925527B2 (en) | Endoscope apparatus | |
| JP6385465B2 (en) | Endoscope device | |
| JP6615369B2 (en) | Endoscope system | |
| JP6284451B2 (en) | Endoscope device | |
| CN110087528B (en) | Endoscope system and image display device | |
| JP2021035549A (en) | Endoscope system | |
| CN111989023B (en) | Endoscope system and method for operating same | |
| WO2018043728A1 (en) | Endoscope system and feature amount calculation method | |
| US10791973B2 (en) | Analysis device and method of analysis | |
| JP6783168B2 (en) | Endoscopic system and analyzer | |
| JP7214886B2 (en) | Image processing device and its operating method | |
| CN117918771A (en) | Endoscope system and method for operating same | |
| WO2018037505A1 (en) | Endoscope system |
Legal Events
| Date | Code | Title | Description |
|---|---|---|---|
| 121 | Ep: the epo has been informed by wipo that ep was designated in this application |
Ref document number: 17755971 Country of ref document: EP Kind code of ref document: A1 |
|
| 122 | Ep: pct application non-entry in european phase |
Ref document number: 17755971 Country of ref document: EP Kind code of ref document: A1 |