WO2017130349A1 - 塩基配列決定装置、キャピラリアレイ電気泳動装置及び方法 - Google Patents
塩基配列決定装置、キャピラリアレイ電気泳動装置及び方法 Download PDFInfo
- Publication number
- WO2017130349A1 WO2017130349A1 PCT/JP2016/052495 JP2016052495W WO2017130349A1 WO 2017130349 A1 WO2017130349 A1 WO 2017130349A1 JP 2016052495 W JP2016052495 W JP 2016052495W WO 2017130349 A1 WO2017130349 A1 WO 2017130349A1
- Authority
- WO
- WIPO (PCT)
- Prior art keywords
- signal
- deconvolution
- base sequence
- peak
- sequence determination
- Prior art date
- Legal status (The legal status is an assumption and is not a legal conclusion. Google has not performed a legal analysis and makes no representation as to the accuracy of the status listed.)
- Ceased
Links
Images




Classifications
-
- C—CHEMISTRY; METALLURGY
- C12—BIOCHEMISTRY; BEER; SPIRITS; WINE; VINEGAR; MICROBIOLOGY; ENZYMOLOGY; MUTATION OR GENETIC ENGINEERING
- C12Q—MEASURING OR TESTING PROCESSES INVOLVING ENZYMES, NUCLEIC ACIDS OR MICROORGANISMS; COMPOSITIONS OR TEST PAPERS THEREFOR; PROCESSES OF PREPARING SUCH COMPOSITIONS; CONDITION-RESPONSIVE CONTROL IN MICROBIOLOGICAL OR ENZYMOLOGICAL PROCESSES
- C12Q1/00—Measuring or testing processes involving enzymes, nucleic acids or microorganisms; Compositions therefor; Processes of preparing such compositions
- C12Q1/68—Measuring or testing processes involving enzymes, nucleic acids or microorganisms; Compositions therefor; Processes of preparing such compositions involving nucleic acids
- C12Q1/6869—Methods for sequencing
-
- C—CHEMISTRY; METALLURGY
- C12—BIOCHEMISTRY; BEER; SPIRITS; WINE; VINEGAR; MICROBIOLOGY; ENZYMOLOGY; MUTATION OR GENETIC ENGINEERING
- C12N—MICROORGANISMS OR ENZYMES; COMPOSITIONS THEREOF; PROPAGATING, PRESERVING, OR MAINTAINING MICROORGANISMS; MUTATION OR GENETIC ENGINEERING; CULTURE MEDIA
- C12N15/00—Mutation or genetic engineering; DNA or RNA concerning genetic engineering, vectors, e.g. plasmids, or their isolation, preparation or purification; Use of hosts therefor
- C12N15/09—Recombinant DNA-technology
-
- C—CHEMISTRY; METALLURGY
- C12—BIOCHEMISTRY; BEER; SPIRITS; WINE; VINEGAR; MICROBIOLOGY; ENZYMOLOGY; MUTATION OR GENETIC ENGINEERING
- C12Q—MEASURING OR TESTING PROCESSES INVOLVING ENZYMES, NUCLEIC ACIDS OR MICROORGANISMS; COMPOSITIONS OR TEST PAPERS THEREFOR; PROCESSES OF PREPARING SUCH COMPOSITIONS; CONDITION-RESPONSIVE CONTROL IN MICROBIOLOGICAL OR ENZYMOLOGICAL PROCESSES
- C12Q1/00—Measuring or testing processes involving enzymes, nucleic acids or microorganisms; Compositions therefor; Processes of preparing such compositions
- C12Q1/68—Measuring or testing processes involving enzymes, nucleic acids or microorganisms; Compositions therefor; Processes of preparing such compositions involving nucleic acids
-
- G—PHYSICS
- G01—MEASURING; TESTING
- G01N—INVESTIGATING OR ANALYSING MATERIALS BY DETERMINING THEIR CHEMICAL OR PHYSICAL PROPERTIES
- G01N27/00—Investigating or analysing materials by the use of electric, electrochemical, or magnetic means
- G01N27/26—Investigating or analysing materials by the use of electric, electrochemical, or magnetic means by investigating electrochemical variables; by using electrolysis or electrophoresis
- G01N27/416—Systems
- G01N27/447—Systems using electrophoresis
- G01N27/44704—Details; Accessories
- G01N27/44717—Arrangements for investigating the separated zones, e.g. localising zones
- G01N27/44721—Arrangements for investigating the separated zones, e.g. localising zones by optical means
- G01N27/44726—Arrangements for investigating the separated zones, e.g. localising zones by optical means using specific dyes, markers or binding molecules
-
- G—PHYSICS
- G16—INFORMATION AND COMMUNICATION TECHNOLOGY [ICT] SPECIALLY ADAPTED FOR SPECIFIC APPLICATION FIELDS
- G16B—BIOINFORMATICS, i.e. INFORMATION AND COMMUNICATION TECHNOLOGY [ICT] SPECIALLY ADAPTED FOR GENETIC OR PROTEIN-RELATED DATA PROCESSING IN COMPUTATIONAL MOLECULAR BIOLOGY
- G16B30/00—ICT specially adapted for sequence analysis involving nucleotides or amino acids
-
- B—PERFORMING OPERATIONS; TRANSPORTING
- B01—PHYSICAL OR CHEMICAL PROCESSES OR APPARATUS IN GENERAL
- B01L—CHEMICAL OR PHYSICAL LABORATORY APPARATUS FOR GENERAL USE
- B01L3/00—Containers or dishes for laboratory use, e.g. laboratory glassware; Droppers
-
- B—PERFORMING OPERATIONS; TRANSPORTING
- B01—PHYSICAL OR CHEMICAL PROCESSES OR APPARATUS IN GENERAL
- B01L—CHEMICAL OR PHYSICAL LABORATORY APPARATUS FOR GENERAL USE
- B01L3/00—Containers or dishes for laboratory use, e.g. laboratory glassware; Droppers
- B01L3/50—Containers for the purpose of retaining a material to be analysed, e.g. test tubes
- B01L3/502—Containers for the purpose of retaining a material to be analysed, e.g. test tubes with fluid transport, e.g. in multi-compartment structures
- B01L3/5027—Containers for the purpose of retaining a material to be analysed, e.g. test tubes with fluid transport, e.g. in multi-compartment structures by integrated microfluidic structures, i.e. dimensions of channels and chambers are such that surface tension forces are important, e.g. lab-on-a-chip
-
- C—CHEMISTRY; METALLURGY
- C12—BIOCHEMISTRY; BEER; SPIRITS; WINE; VINEGAR; MICROBIOLOGY; ENZYMOLOGY; MUTATION OR GENETIC ENGINEERING
- C12Q—MEASURING OR TESTING PROCESSES INVOLVING ENZYMES, NUCLEIC ACIDS OR MICROORGANISMS; COMPOSITIONS OR TEST PAPERS THEREFOR; PROCESSES OF PREPARING SUCH COMPOSITIONS; CONDITION-RESPONSIVE CONTROL IN MICROBIOLOGICAL OR ENZYMOLOGICAL PROCESSES
- C12Q2565/00—Nucleic acid analysis characterised by mode or means of detection
- C12Q2565/10—Detection mode being characterised by the assay principle
- C12Q2565/125—Electrophoretic separation
Definitions
- the present invention relates to a technique for automatically determining a base sequence.
- a capillary electrophoresis type sequencer determines a base sequence by electrophoresis of a nucleic acid sample.
- the capillary electrophoresis type sequencer observes wavelength spectra emitted from dyes corresponding to four types of bases (A (adenine), G (guanine), C (cytosine), T (thymine)) as time-series input signals.
- the base sequence is determined.
- Such processing for determining a base sequence from a time-series input signal is called “base call”.
- the peak corresponding to each base is detected from the input signal subjected to color conversion and mobility correction, and the sequence is determined according to the order of the positions of those peaks.
- a steep peak is not always observed, and the peak width may increase as the peaks overlap, and multiple overlapping peaks may be observed as one peak on the input signal. is there. In this case, analysis is inaccurate unless one peak on the input signal is decomposed into a plurality of original peaks and the correct position of each peak is determined.
- Patent Document 1 There is a method described in Patent Document 1 as a method for determining the sequence with high accuracy even if there is such an overlap of peaks.
- the summary of Patent Document 1 includes “(A) a base peak extraction step of extracting a base peak from electrophoresis data including peaks of four types of base types obtained by electrophoretic separation of a sample nucleic acid; (B) extraction.
- the base sequence is determined by sequentially scanning between adjacent base peaks in the forward and backward direction of the time series, comparing the interval between base peaks with the peak interval reference value, and adding an interpolation peak to the peak missing section. Is done. "
- Patent Document 1 describes a technique of “comparing the interval between base peaks with the peak interval reference value and adding an interpolated peak to a peak missing section”.
- the method of adding a peak to a missing section even if a section to which a peak is to be added can be determined, it is not possible to determine which base type peak should be added. For example, as shown in FIG. 1, consider a case where waveforms overlap in time between base type A and base type G. There is a minute peak P1 in base type A, but if peak P1 cannot be detected for some reason such as noise, it is clear which peak P1 is added to base type A or base type G at that time is not.
- the present invention provides a technique capable of determining a base sequence with high accuracy even when the peak resolution is low.
- the present invention adopts, for example, the configurations described in the claims.
- the present specification includes a plurality of means for solving the above-mentioned problems, but one example thereof is “(1) A mobility that outputs a mobility correction signal obtained by correcting a mobility of a time-series signal of a wavelength spectrum corresponding to each base.
- a degree correction unit and (2) a process of calculating a deconvolution signal of the mobility correction signal for each of a plurality of parameter candidates of the point spread function, and calculating a peak interval variance for the calculated deconvolution signal Processing, specifying a parameter of the point spread function using the calculated variance, and outputting the deconvolution signal corresponding to the point spread function having the specified parameter as an updated deconvolution signal; (3) a peak extraction unit that extracts a peak waveform from the updated post-convolution signal and outputs an updated peak extraction signal; and (4) the update peak extraction unit.
- Enter the rear signal a sequence specific portion determining the nucleotide sequence, there is a sequencing device "with.
- the base sequence can be determined with high accuracy even when the peak resolution is low.
- FIG. 1 is a diagram illustrating an overall configuration of a capillary electrophoresis apparatus according to a first embodiment.
- 1 is a diagram illustrating a configuration of a fluorescence detection device according to Embodiment 1.
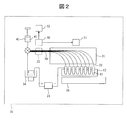
- FIG. 2 shows a configuration example of the capillary array electrophoresis apparatus 10.
- the capillary array electrophoresis apparatus 10 includes a plurality of sample containers 11 (each sample container 11 containing different samples) each containing a sample (hereinafter referred to as “sample”) obtained by adding a fluorescent label to DNA as a measurement object.
- a fluorescence detection device 50 and a control board 51 are included.
- the capillary array 30 is an aggregate of a plurality of capillaries 33.
- Each capillary 33 is hollow.
- the length of the capillary 33 is 30 cm or less.
- the length of the capillary 33 may be 30 cm or more (for example, 36 cm or more).
- one end of each capillary 33 is inserted into the sample in the sample container 11.
- the sample moves from the sample container 11 into the capillary 33, and then electrophoreses in the capillary.
- the pump unit 42 injects an electrophoresis medium 41 (for example, a polymer) into each capillary 33.
- an electrophoresis medium 41 for example, a polymer
- the high voltage power supply 21 applies a high voltage (for example, the maximum voltage is 20 kV) to both ends of the individual capillaries 33 filled with the electrophoresis medium 41.
- a high voltage for example, the maximum voltage is 20 kV
- each sample passes through each capillary 33 and is electrophoresed from the sample container 11 to the detection position 32.
- Each sample that has passed through the detection position 32 is electrophoresed toward the discharge position 34. Since the migration speed of the sample differs depending on the base length, the sample reaches the detection position 32 in order from the DNA having the short base length.
- the fluorescence detection device 50 irradiates excitation light sequentially from the sample that has reached the detection position 32, and detects the fluorescence signal intensity and wavelength emitted by the fluorescent label.
- the fluorescence detection device 50 determines the DNA base sequence based on the detected wavelength of the fluorescence signal and outputs the DNA base sequence to the control substrate 51. Further, the fluorescence detection device 50 displays the determined base sequence and other information on the screen of the display device 52.
- the control board 51 transfers the base sequence of the fluorescence signal analyzed by the fluorescence detection device 50 to an external terminal (not shown).
- the external terminal here preferably has a display device for confirming the analysis result.
- FIG. 3 shows an internal configuration example of the fluorescence detection device 50.
- the fluorescence detection device 50 includes an excitation light source 61, a shutter 62, an excitation light lens 63, an optical filter 66, a fluorescence lens 67, a diffraction grating 68, a CCD (Charge-Coupled Device) 69, and a CCD control unit 70. And an ADC (Analog-to-digital-converter) 71, a signal processing unit 72, and a memory 73.
- ADC Analog-to-digital-converter
- the excitation light source 61 is a light source that continuously emits excitation light 64. All the capillaries 33 corresponding to the detection positions 32 are irradiated with the excitation light 64.
- the shutter 62 repeats opening and closing at predetermined intervals. The shutter 62 transmits the excitation light 64 emitted from the excitation light source 61 when it is open and blocks it when it is closed.
- the excitation light lens 63 condenses the excitation light 64 that passes through the shutter 62.
- the excitation light 64 collected by the excitation light lens 63 is irradiated toward the detection position 32.
- the fluorescent label added to the DNA passing through the detection position 32 of each capillary 33 by electrophoresis is excited by being irradiated with the excitation light 64 and emits a fluorescence signal 65.
- the optical filter 66 cuts light other than the fluorescent signal 65 emitted from the fluorescent label.
- the fluorescent lens 67 condenses the fluorescent signal 65 that passes through the optical filter 66.
- the fluorescent signal 65 collected by the fluorescent lens 67 is spectrally divided for each wavelength by the diffraction grating 68 and irradiated to the light receiving surface of the CCD 69 which is a light receiving element (light receiving portion).
- a signal charge is generated on the light receiving surface of the CCD 69.
- the conversion circuit of the CCD 69 converts the signal charge into a voltage (analog) and outputs it to the ADC 71.
- the CCD 69 may be any of a frame transfer type, a full frame transfer type, an interline transfer type, and a frame inter transfer type.
- the ADC 71 converts the analog signal output from the CCD 69 into a digital signal.
- the ADC 71 outputs the converted digital signal to the signal processing unit 72.
- the signal processing unit 72 acquires the fluorescence signal intensity (corresponding to the fluorescence signal intensity of the light receiving surface combined as one pixel in a pseudo manner) from the output digital signal.
- the signal processing unit 72 of the present embodiment executes signal processing for determining the DNA base sequence based on the wavelength of the fluorescence signal obtained from the digital signal.
- the signal processing unit 72 stores the fluorescence signal intensity and wavelength obtained from the output digital signal in the memory 73.
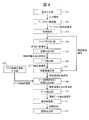
- FIG. 4 shows a functional configuration of the signal processing unit 72.
- the function of the signal processing unit 72 is realized through execution of a program by a computer.
- the signal input unit 101 receives an input signal that is a digital signal from the ADC 71.
- the input signal is a time series of wavelength spectra emitted from the dyes corresponding to each of the four types of bases A (adenine), G (guanine), C (cytosine), and T (thymine). is there.
- the wavelength spectrum at each time is an array of real values obtained by discretizing each wavelength, and the array length N is an integer of 4 or more such as 10 or 20, for example. Therefore, the input signal is an N channel real value signal.
- the baseline removal unit 102 executes a baseline removal process and obtains a signal after baseline removal from an input signal (N-channel real value signal).
- the baseline removal process may use a known method such as subtracting the minimum value of the neighborhood section at each time.
- the color conversion unit 103 performs color conversion processing, and calculates a color-converted signal in which each channel is a 4-channel signal corresponding to each of four types of bases from the signal after baseline removal (N-channel real value signal). .
- a known method such as multiplication of a pseudo inverse matrix of a color conversion matrix that has been calibrated in advance may be used for the color conversion process.
- the block cutout unit 104 executes block cutout processing that divides the signal of each channel of the color-converted signal into small sections (hereinafter also referred to as “blocks”) with the time when the intensity is sufficiently small as a boundary, and corresponds to each block
- the signal to be output is output as a signal after clipping.
- FIG. 5 shows an example of cutting out blocks. As shown in FIG. 5, one cutout signal is composed of a single waveform. By dividing into blocks, it is possible to reduce the amount of calculation such as a subsequent deconvolution process or a deconvolution process with a peak interval constraint. Thereby, shortening of processing time and reduction of memory consumption can be realized.
- the deconvolution unit 105 performs a deconvolution process on the cut-out signal, and calculates an initial deconvolution signal.
- the deconvolution process has different difficulties depending on whether the point spread function (PSF) is known or unknown.
- PSF point spread function
- the deconvolution process is a process of calculating a signal after deconvolution using the input signal (post-cutout signal) and the PSF. In this case, deconvolution can be performed with relatively high accuracy by a method using a Wiener filter or the like.
- the deconvolution unit 105 needs to perform deconvolution under conditions where the PSF is unknown.
- This process is a process of calculating both the PSF and the deconvolution signal using the input signal, and is called “blind deconvolution”. For example, based on Nonnegative Matrix Factorization (NMF), such deconvolution with simultaneous optimization can be performed.
- NMF Nonnegative Matrix Factorization
- NMF there is a method of obtaining a global solution by avoiding a local solution, such as sparse regularization such as L1 regularization and L1 / L2 regularization, but sufficient accuracy can be obtained even when used in the capillary electrophoresis apparatus 10. It is difficult.
- the deconvolution unit 105 of the present embodiment solution candidates are reduced by the method described below to avoid local solutions.
- the deconvolution unit 105 limits the PSF to a Gaussian function and limits the unknown parameter to only the standard deviation ⁇ . By limiting the unknown parameters of PSF in this way, local solutions can be avoided.
- the deconvolution unit 105 performs deconvolution processing for each finite number of standard deviations ⁇ discretized using the corresponding Gaussian function as PSF, and obtains a deconvolution signal for each standard deviation ⁇ .
- the deconvolution unit 105 narrows down the solution candidates to only a set of a standard deviation ⁇ and a deconvolution signal that satisfy the following conditions (1), (2), and (3).
- (1) e ( ⁇ ) calculated below is below a certain threshold
- the deconvolution unit 105 performs a convolution process using a Gaussian function corresponding to the standard deviation ⁇ and a deconvolution signal using the Gaussian function. Run and calculate the post-convolution signal.
- the deconvolution unit 105 calculates the error e ( ⁇ ) between the post-convolution signal and the input signal for each standard deviation ⁇ based on the mean square error and the Cullback-Liber divergence.
- E ( ⁇ ) corresponding to a solution in which the number of is too much than the original is as small as e ( ⁇ ) corresponding to the original solution, and the solution having a smaller number of peaks than the original.
- E ( ⁇ ) corresponding to ⁇ is larger than e ( ⁇ ) corresponding to the original solution, so that ⁇ where e ( ⁇ ) changes sharply, that is, the solution corresponding to the inflection point ⁇ _r is the original value. It can be said that it is close to the solution.
- the deconvolution unit 105 calculates a standard deviation ⁇ and a deconvolution signal for each block.
- the standard deviation of the i-th block is ⁇ _i. It can be assumed that the standard deviation ⁇ does not vary greatly in a short time. Under this assumption, the deconvolution unit 105 is also equipped with a function (an inter-block recalculation function) that further increases the accuracy of deconvolution.
- the deconvolution unit 105 determines whether or not the difference between the standard deviation ⁇ of a certain block and the average value of the standard deviations of the blocks appearing before and after the block exceeds a threshold T.
- the deconvolution unit 105 performs deconvolution again with the PSF having the value given by Expression 2 as a standard deviation, and calculates a new post-convolution signal.
- K is a constant of a certain natural number (1, 2, 3,).
- the standard deviation ⁇ i of the i-th block is “1.2”, which is significantly different from the average value “3.15” of the standard deviation of the preceding and succeeding blocks.
- the recalculation function considering a plurality of blocks may be a mechanism that the deconvolution unit 105 automatically executes, or an operator can specify the execution or non-execution of the function on the user interface screen as will be described later. You may do it.
- the screen shown in FIG. 5 may be presented to the operator as an interface screen.
- the peak extraction unit 106 performs peak extraction processing and obtains a signal after peak extraction from the signal after initial deconvolution.
- a known method such as a calculation method for calculating the zero crossing of the first derivative may be used.
- the mobility correction unit 107 executes mobility correction processing, and calculates a mobility corrected signal from the peak extracted signal and the color converted signal.
- the mobility correction process is executed according to the following procedure.
- the mobility correction unit 107 substitutes the post-peak extraction signal for the “mobility correction in-progress peak signal” and substitutes the color-converted signal for the “mobility correction in-progress signal”.
- the mobility correction unit 107 corresponds to a base other than G (guanine) with respect to the peak signal during mobility correction, among the peaks PG of G (guanine), the peak adjacent to the rear of the time axis. For the peak PG, the average interval d (G) between the peak PG and the peak of another base adjacent on the time axis is calculated.
- the mobility correction unit 107 calculates a peak PA and its time axis for a peak PA corresponding to a base other than A (adenine) whose peak is adjacent on the time axis among the A (adenine) peak PA. Calculate the average distance d (A) between the peaks of other bases adjacent in the upper rear. Similarly, for the peak PT corresponding to the base other than T (thymine), the mobility correction unit 107 determines the peak PT and the time thereof for the peak PT corresponding to the base other than T (thymine). Calculate the average distance d (T) between the peaks of other bases on the back and adjacent on the axis.
- the mobility correction unit 107 determines the peak PC and its time for the peak adjacent to the rear of the time axis among C (cytosine) peak PCs. Calculate the average distance d (C) between the peaks of other bases adjacent on the rear axis. (3) The mobility correction unit 107 calculates an average value d_mean of d (G), d (A), d (T), and d (C). (4) The mobility correction unit 107 calculates d ′ (G), d ′ (A), d ′ (T), and d ′ (C) given by the following equations.
- the mobility correction unit 107 shifts the channel corresponding to G (guanine) of the peak signal during mobility correction by d ′ (G) backward on the time axis, and changes the channel of A (adenine) to d ′ ( A) is shifted backward on the time axis, the T (thymine) channel is shifted backward on the time axis by d '(T), and the C (cytosine) channel is shifted backward on the time axis by d' (C).
- the mobility correction unit 107 shifts the channel corresponding to G (guanine) of the mobility correction intermediate signal by d ′ (G) backward on the time axis, and changes the channel corresponding to A (adenine) to d ′.
- the mobility correction unit 107 overwrites when d ′ (G), d ′ (A), d ′ (T), and d ′ (C) are sufficiently small (smaller than each threshold).
- the mobility correction in-progress signal is substituted into the mobility corrected signal and the process ends. Otherwise, the process returns to (2).
- the peak interval tolerance input unit 109 executes a process of accepting an input of the peak interval dispersion tolerance ⁇ by the operator through the interface screen displayed on the screen of the display device 52.
- ⁇ means an allowable value of how much dispersion of the peak interval is allowed. Since the operator can set ⁇ through the peak interval tolerance input unit 109, the operator can make a base call with high accuracy using the optimal ⁇ depending on the magnitude of noise.
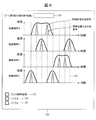
- FIG. 6 shows an example of the interface screen 200 displayed by the peak interval tolerance input unit 109.
- the waveforms of the signal after degree correction and the signal after update deconvolution are displayed.
- the interface screen 200 is provided with an input field 201 for the tolerance ⁇ of dispersion of peak intervals.
- the interface screen 200 displays an updated post-convolution signal calculated using the input tolerance ⁇ . Therefore, when the value of the tolerance ⁇ is changed, the waveform of the displayed update deconvolution signal also changes. The operator can easily determine whether or not the input tolerance ⁇ is an appropriate value by checking the updated post-convolution signal calculated using the tolerance ⁇ .
- the peak interval tolerance input unit 109 also displays the peak position 202 extracted based on the updated post-convolution signal calculated using the input tolerance ⁇ .
- the peak position 202 is indicated by a one-dot chain line.
- the operator can easily determine whether or not the input allowable value ⁇ is an appropriate value by checking whether or not the interval between the peak positions 202 is constant. The closer the interval between the peak positions 202 is, the closer the allowable value ⁇ is to the appropriate value. Further, the operator can easily determine whether or not the deconvolution process is appropriately executed by comparing the mobility-corrected signal displayed on the interface screen 200 with the updated deconvolution signal. . That is, it is possible to easily determine whether or not the input allowable value ⁇ is an appropriate value.
- the interface screen 200 includes a check field 203 for selecting whether or not to execute the inter-block recalculation function of the deconvolution unit 105, a check field 204 for instructing execution of calculation processing when noise is large, noise Is also provided with a check field 205 for instructing execution of calculation processing when.
- the processing content when the check column 203 is checked has already been described with reference to FIG. Processing contents when the check column 204 or 205 is checked will be described later.
- FIG. 6 is an example of the interface screen 200, and the input field 201 and the chuck fields 203 to 205 may not be displayed, or only a part may be displayed.
- the peak interval constrained deconvolution unit 108 performs deconvolution processing on the 4-channel mobility-corrected signal, and calculates a 4-channel updated deconvolution signal.
- the deconvolution processing unit 108 with the peak interval constraint avoids local solutions by reducing solution candidates as follows.
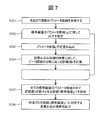
- FIG. 7 shows the processing operation of the deconvolution processing unit 108 with a peak interval constraint.
- the deconvolution processing unit with a peak interval constraint 108 limits the PSF to a Gaussian function and limits the unknown parameter to only the standard deviation ⁇ . By limiting the unknown parameters of PSF in this way, local solutions can be avoided.
- the deconvolution processing unit with peak interval restriction 108 lists the finite number of discretized standard deviations ⁇ as parameter candidates (step S301), and executes the following processing for each parameter candidate (step S302).
- the peak interval constrained deconvolution processing unit 108 performs deconvolution processing using a Gaussian function corresponding to the standard deviation to be processed as a PSF, and obtains a 4-channel deconvolution signal (step S303).
- the deconvolution processing unit with the peak interval constraint 108 sets e ( ⁇ ) and v ( ⁇ ) for the parameter candidates to be processed (that is, standard deviation ⁇ ) by the following procedures (1) and (2). Calculate (1) Similar to the above processing, the peak interval constrained deconvolution processing unit 108 performs convolution processing using a Gaussian function corresponding to the standard deviation ⁇ and a deconvolution signal using the Gaussian function, and performs 4-channel tatami mating. Calculate the signal after insertion. Next, the deconvolution processing unit with the peak interval constraint 108 calculates the error e ( ⁇ ) between the calculated post-convolution signal and the input signal based on the mean square error and the Cullback-Liber divergence.
- the peak constrained deconvolution processing unit 108 calculates, for each peak extracted from the calculated four-channel post-convolution signal, the interval between adjacent peaks that are specified ignoring the channel difference. . Details have already been described with reference to FIG. Next, the deconvolution processing unit with peak interval constraint 108 calculates the variance value v ( ⁇ ) for all peaks corresponding to the intervals. However, v ( ⁇ ) may not be a literal variance value but may be a standard deviation, a maximum deviation from an average value, or Median Absolute Deviation (MAD). In the present specification, the term “dispersion” is used in a collective sense.
- the peak interval constrained deconvolution processing unit 108 calculates the evaluation value c by using the following equation, for example (step S304).
- c e ( ⁇ ) + ⁇ ⁇ v ( ⁇ ) Equation 3
- ⁇ is a tolerance of dispersion of peak intervals.
- the deconvolution processing unit 108 with the peak interval constraint places importance on the variance v ( ⁇ ) of the peak interval by setting the tolerance ⁇ large. As a result, an acceptable solution can be obtained even if the convolution error e ( ⁇ ) is large.
- the deconvolution processing unit 108 with the peak interval constraint places importance on the convolution error e ( ⁇ ) by setting the tolerance ⁇ small, and even if the variance v ( ⁇ ) of the peak interval is large. An acceptable solution is obtained.
- the determination as to whether or not the noise is large may be automatically executed by the deconvolution processing unit 108 with a peak interval constraint. Further, as shown in FIG. 6, the deconvolution processing unit with a peak interval constraint 108 detects that the operator is checking one of the check fields 204 or 205 on the interface screen 200, and according to the check contents. A mechanism for changing the magnitude of the tolerance ⁇ may be adopted.
- the peak interval constrained deconvolution processing unit 108 searches for the standard deviation that minimizes the evaluation value c (step S305), and the 4-channel convolution signal corresponding to the specified standard deviation is updated by the 4-channel update deconvolution. It outputs as a back signal (step S306).
- the updated post-convolution signal obtained in this way satisfies the constraint that the peak interval is substantially constant. Since such a solution is likely to be an original solution, the result is a deconvolution result with sufficient accuracy.
- a standard deviation that takes the maximum value may be searched.
- the above processing is executed for each block (see FIG. 5). Note that the processing of the deconvolution unit with a peak interval constraint 108 can improve the accuracy by using the results calculated for a plurality of blocks, like the deconvolution unit 105 described above. Again, the standard deviation ⁇ of the i-th block is ⁇ _i. Again, it is assumed that the standard deviation ⁇ does not vary greatly in a short time.
- the peak interval constrained deconvolution unit 108 determines whether or not the difference between the standard deviation ⁇ of a certain block and the average value of the standard deviations of the blocks appearing before and after the block exceeds a threshold T.
- the deconvolution unit with peak interval constraint 108 performs deconvolution again with the PSF with the value given by Expression 5 as a standard deviation, and calculates a new post-convolution signal.
- K is a constant of a certain natural number (1, 2, 3,).
- the peak extraction unit 110 executes processing for extracting a peak waveform, and calculates a 4-channel updated peak extraction signal from a 4-channel updated deconvolution signal.
- the peak extraction process involves calculating the first-order differential zero-crossing of the post-update deconvolution signal and replacing the signal value of the post-update peak extraction signal at the time when the zero-crossing exists with the signal value of the post-update deconvolution signal. May be used.
- spline interpolation is performed on the signal after the update deconvolution, and the first derivative value of the signal after the spline interpolation is calculated. Thereby, peak extraction robust against noise is possible.
- the peak extraction unit 110 may perform determination processing based on the following determination rule for all peaks for the purpose of further improving accuracy, and delete a peak determined to be “deleted” as a result of determination.
- Judgment rule If d ⁇ 0, delete. However, d is a discriminant function depending on the following x_1 and x_2.
- ⁇ X_1 Intensity of the peak of interest-Average value of neighboring peaks
- ⁇ x_2 Intensity of the channel of the peak of interest at the time of the peak of interest in the signal after mobility correction / Over the channel of the time of the peak of interest in the signal after mobility correction
- a linear discriminant function d w_1 * x_1 + w_2 * x_2 + w_3 may be used for d, and SVM (Support Vector Machine) may be used, or a decision tree may be used.
- the array specifying unit 111 executes the array specifying process and outputs a result array from the four-channel update peak extracted signal.
- a label string is generated by arranging the base type labels G, A, T, and C corresponding to each peak in the post-update peak extraction signal in time order. This label string is a result array.
- the array output unit 112 outputs the result array to a storage device such as a hard disk or an SSD (Solid State Drive) or presents it using the display device 52.
- the capillary array electrophoresis apparatus 10 is equipped with a function for executing the deconvolution process with a restriction on the peak interval. Thereby, even when the separation degree of peaks is low (particularly, when waveforms of different base types overlap in time), the base sequence can be determined with high accuracy.
- a portable (small) sequencer or a sequencer with a short measurement time is considered to have a low peak resolution, so the method of this embodiment is effective for these sequencers.
- Example 2 In this embodiment, a case will be described in which the capillary array electrophoresis apparatus 10 employs a function for machine learning of various parameters.
- the basic apparatus of the capillary array electrophoresis apparatus 10 in this embodiment is the same as that in the first embodiment. In the following, it is assumed that a plurality of input signals obtained by measuring a sample having a known base sequence under the same measurement conditions are input to the signal input unit 101.
- the signal processing unit 72 changes the tolerance ⁇ in a certain step ⁇ within a certain range [ ⁇ _min, ⁇ ⁇ _max], and executes a series of processes described in the first embodiment using each ⁇ , thereby obtaining a base sequence. decide. Thereafter, the signal processing unit 72 calculates the matching rate p ( ⁇ ) between the base sequence determined using each tolerance ⁇ and the correct sequence, and the tolerance p ( ⁇ ) is maximized. Set ⁇ .
- the signal processing unit 72 tunes the parameters w_1, w_2, and w_3 of the deletion determination rule of the peak extraction unit 110 described in the first embodiment.
- the signal processing unit 72 since the sample whose base sequence is known is measured, the originally existing peak was extracted correctly, the originally nonexistent peak was erroneously extracted, or the originally existing peak was mistakenly extracted. It can be seen whether each peak is correct or not, such as whether it was not performed or a peak that did not exist originally was correctly excluded. The correctness is used as a teacher signal, and the signal processing unit 72 performs supervised learning together with the output signal d.
- the signal processing unit 72 may use an algorithm such as error correction learning.
- the signal processing unit 72 can use an SMO (Sequential Minimal Optimization) algorithm for supervised learning.
- the signal processing unit 72 can perform supervised learning using an algorithm such as ID3 or C4.5.
- the result of learning step 1 and the result of learning step 2 are dependent on each other. Therefore, the signal processing unit 72 performs optimal parameter tuning as a whole by alternately performing the learning step 1 and the learning step 2.
- FIG. 8 shows another configuration example of the capillary array electrophoresis apparatus 10A.
- the base sequence determination process is executed by the signal processing unit 72 of the fluorescence detection device 50.
- the signal processing unit 72 is provided with a base sequence analysis function.
- an external device 53 such as a computer externally attached to the capillary array electrophoresis apparatus 10A.
- an external device 53 is connected to the control substrate 51.
- the external device 53 has sufficient calculation resources for executing signal processing executed by the signal processing unit 72.
- the external device 53 is provided with a display device for checking processing results and the like.
- the communication between the control board 51 and the external device 53 may be wired or wireless.
- the external device 53 is a desktop PC, a notebook PC, a smartphone, or a portable information terminal.
- the present invention is not limited to the above-described embodiments, and includes various modifications.
- the above-described embodiments have been described in detail for easy understanding of the present invention, and are not necessarily limited to those having all the configurations described.
- a part of the configuration of one embodiment can be replaced with the configuration of another embodiment, and the configuration of another embodiment can be added to the configuration of one embodiment.
- another configuration can be added, deleted, or replaced.
- each of the above-described configurations, functions, processing units, processing means, and the like may be realized by hardware by designing a part or all of them with, for example, an integrated circuit.
- Each of the above-described configurations, functions, and the like may be realized by software by interpreting and executing a program that realizes each function by the processor.
- Information such as programs, tables, and files for realizing each function can be stored in a recording device such as a memory, a hard disk, and an SSD, or a recording medium such as an IC (integrated circuit) card, an SD card, and a DVD.
- control lines and information lines indicate what is considered necessary for the explanation, and not all the control lines and information lines on the product are necessarily shown. Actually, it may be considered that almost all the components are connected to each other.
- deconvolution part with peak interval restriction 109 ... Peak interval tolerance input section
- 110 Peak extraction unit, 111 ... sequence specifying part, 112 ... array output unit, 200 ... interface screen, 201 ... Input field for tolerance ⁇ , 202 ... peak position, 203 ... check box, 204 ... check box, 205 ... Check column.
Landscapes
- Life Sciences & Earth Sciences (AREA)
- Chemical & Material Sciences (AREA)
- Health & Medical Sciences (AREA)
- Organic Chemistry (AREA)
- Engineering & Computer Science (AREA)
- Proteomics, Peptides & Aminoacids (AREA)
- Physics & Mathematics (AREA)
- Zoology (AREA)
- Wood Science & Technology (AREA)
- Molecular Biology (AREA)
- General Health & Medical Sciences (AREA)
- Genetics & Genomics (AREA)
- Bioinformatics & Cheminformatics (AREA)
- Biotechnology (AREA)
- Biochemistry (AREA)
- Analytical Chemistry (AREA)
- General Engineering & Computer Science (AREA)
- Biophysics (AREA)
- Immunology (AREA)
- Microbiology (AREA)
- Spectroscopy & Molecular Physics (AREA)
- Biomedical Technology (AREA)
- Electrochemistry (AREA)
- Pathology (AREA)
- General Physics & Mathematics (AREA)
- Chemical Kinetics & Catalysis (AREA)
- Plant Pathology (AREA)
- Theoretical Computer Science (AREA)
- Bioinformatics & Computational Biology (AREA)
- Medical Informatics (AREA)
- Evolutionary Biology (AREA)
- Investigating, Analyzing Materials By Fluorescence Or Luminescence (AREA)
- Measuring Or Testing Involving Enzymes Or Micro-Organisms (AREA)
- Apparatus Associated With Microorganisms And Enzymes (AREA)
Abstract
Description
(1-1)全体構成
図2に、キャピラリアレイ電気泳動装置10の構成例を示す。キャピラリアレイ電気泳動装置10は、測定対象物であるDNAに蛍光標識を付加したサンプル(以下「サンプル」という。)が入った複数のサンプル容器11(各サンプル容器11には、異なるサンプルが入っている)収容するサンプルトレイ12と、サンプルトレイ12を搬送する搬送器20と、サンプル容器11内のサンプルの電気泳動路となるキャピラリアレイ30と、キャピラリアレイ30内に電気泳動媒体41を注入するポンプユニット42と、キャピラリアレイ30の両端に高電圧を印加する高圧電源21と、キャピラリアレイ30内を一定の温度に保つ恒温槽31と、サンプルが電気泳動する経路上に設けられる検出位置32と、蛍光検出装置50と、制御基板51とを有する。
図4に、信号処理部72の機能構成を示す。本実施例の場合、信号処理部72の機能は、コンピュータによるプログラムの実行を通じて実現される。信号入力部101は、ADC71からデジタル信号である入力信号を受け取る。前述したように、入力信号は、各塩基種別A(アデニン)、G(グアニン)、C(シトシン)、T(チミン)の4種の各塩基に対応する色素から発せられる波長スペクトルの時系列である。各時刻の波長スペクトルは、各波長を離散化した実数値の配列であり、その配列長Nはたとえば10や20など 4以上の整数である。そのため、入力信号はNチャンネル実数値信号である。
(1) 以下で計算されるe(σ)がある閾値以下であること
まず、逆畳み込み部105は、標準偏差σに対応するガウス関数とそれを用いた逆畳み込み信号とを用いて畳み込み処理を実行し、畳込み後信号を計算する。次に、逆畳み込み部105は、標準偏差σごとに畳込み後信号と入力信号との誤差e(σ)を、平均二乗誤差やカルバック・ライブラーダイバージェンスに基づいて計算する。次に、誤差e(σ)が、ある閾値以下である標準偏差σのみを選択する。この条件により、畳み込み生成モデルに従う解のみをパラメータ候補に絞ることができる。
(2) 逆畳み込み後信号から抽出される各ピークの間隔について、ブロック内でのピーク間隔の最小値が、ある閾値以上であること
この条件に従って、ピーク間隔が短すぎる解の候補を除外すると、局所解を避けることができる。
(3) σが、e(σ)の変曲点σ_rの近傍であること
逆畳み込み部105は、例えば誤差e(σ)のσに関する2次微分値e”(σ)の正のピークを変曲点として検出し、そのピークの位置を変曲点σ_rに代入する。この条件により、ピークの個数が本来よりも多すぎるような解を除外することができる。これは以下の理由による。ピークの個数が本来よりも多すぎるような解に対応するe(σ)は、本来の解に対応するe(σ)と同程度に小さい値となる。また、ピークの個数が本来よりも小さい解に対応するe(σ)は、本来の解に対応するe(σ)より大きい値となる。そこで、e(σ)が急峻に変化するσ、すなわち変曲点σ_rに対応する解が本来の解に近いといえる。


(1) 移動度補正部107は、ピーク抽出後信号を「移動度補正途中ピーク信号」に代入し、色変換後信号を「移動度補正途中信号」に代入する。
(2) 移動度補正部107は、移動度補正途中ピーク信号に対し、G(グアニン)のピークPGのうち、その時間軸上の後方で隣接するピークがG(グアニン)以外の塩基に対応するピークPGについて、ピークPGとその時間軸上の後方で隣接する他の塩基のピークとの平均間隔d(G)を計算する。同様に、移動度補正部107は、A(アデニン)のピークPAのうち、時間軸上の後方で隣接するピークがA(アデニン)以外の塩基に対応するピークPAについて、ピークPAとその時間軸上の後方で隣接する他の塩基のピークとの平均間隔d(A)を計算する。同様に、移動度補正部107は、T(チミン)のピークPTのうち、その時間軸上の後方で隣接するピークがT(チミン)以外の塩基に対応するピークPTについて、ピークPTとその時間軸上の後方で隣接する他の塩基のピークとの平均間隔d(T)を計算する。同様に、移動度補正部107は、C(シトシン)のピークPCのうち、その時間軸上の後方で隣接するピークがC(シトシン)以外の塩基に対応するピークPCについて、ピークPCとその時間軸上の後方で隣接する他の塩基のピークとの平均間隔d(C)を計算する。
(3) 移動度補正部107は、d(G)、d(A)、d(T)、d(C)の平均値d_meanを計算する。
(4) 移動度補正部107は、以下の式で与えられるd’(G)、d’(A)、d’(T)、d’(C)を計算する。
d’(G) = d(G) - d_mean
d’(A) = d(A) - d_mean
d’(T) = d(T) - d_mean
d’(C) = d(C) - d_mean
(5) 移動度補正部107は、移動度補正途中ピーク信号のG(グアニン)に対応するチャンネルをd’(G)だけ時間軸上後方にシフトし、A(アデニン)のチャンネルをd’(A)だけ時間軸上後方にシフトし、T(チミン)のチャンネルをd’(T)だけ時間軸上後方にシフトし、C(シトシン)のチャンネルをd’(C)だけ時間軸上後方にシフトし、シフト後の信号で移動度補正途中ピーク信号を上書きする。
(6) 移動度補正部107は、移動度補正途中信号のG(グアニン)に対応するチャンネルをd’(G)だけ時間軸上後方にシフトし、A(アデニン)に対応するチャンネルをd’(A)だけ時間軸上後方にシフトし、T(チミン)に対応するチャンネルをd’(T)だけ時間軸上後方にシフトし、C(シトシン)に対応するチャンネルをd’(C)だけ時間軸上後方にシフトし、シフト後の信号で移動度補正途中信号を上書きする。
(7) 移動度補正部107は、d’(G)、d’(A)、d’(T)、d’(C)のいずれもが十分に小さい場合(各閾値より小さい場合)、上書きした移動度補正途中信号を移動度補正後信号に代入して終了し、そうでなければ(2)の処理に戻る。
(1) 前述の処理と同様、ピーク間隔制約付逆畳み込み処理部108は、標準偏差σに対応するガウス関数とそれを用いた逆畳み込み信号とを用いて畳み込み処理を実行し、4チャンネルの畳込み後信号を計算する。次に、ピーク間隔制約付逆畳み込み処理部108は、算出された畳込み後信号と入力信号との誤差e(σ)を、平均二乗誤差やカルバック・ライブラーダイバージェンスに基づいて計算する。
(2) ピーク間隔制約付逆畳み込み処理部108は、算出された4チャンネルの畳込み後信号から抽出される各ピークについて、チャンネルの違いを無視して特定される隣接ピークとの間隔を計算する。詳細については図6を用いて既に説明した。次に、ピーク間隔制約付逆畳み込み処理部108は、それら間隔に対応する全てのピークについて分散値v(σ)を計算する。ただし、v(σ)は文字通りの分散値ではなく、標準偏差や平均値からの偏差の最大値やMedian Absolute Deviation (MAD)であってもよい。本明細書では、これらを総称する意味で「分散」の用語を用いる。
c=e(σ) + α×v(σ) …式3
αは、前述したように、ピーク間隔の分散の許容度である。例えばノイズが大きい場合、ピーク間隔制約付逆畳み込み処理部108は、許容度αを大きく設定することでピーク間隔の分散v(σ)を重視する。これにより、畳み込みの誤差e(σ)が大きくても許容した解が得られる。一方、ノイズが小さい場合、ピーク間隔制約付逆畳み込み処理部108は、許容度αを小さく設定することで畳み込みの誤差e(σ)を重視し、ピーク間隔の分散v(σ)が大きくても許容した解が得られる。


ただし、dは、以下のx_1とx_2に依存する識別関数である。
・x_1 = 注目ピークの強度 - 近傍ピークの強度の平均値
・x_2 = 移動度補正後信号における注目ピークの時刻の注目ピークのチャンネルの強度 / 移動度補正後信号における注目ピークの時刻のチャンネルに亘っての平均強度
例えばdには、線形識別関数d = w_1 * x_1 + w_2 * x_2 + w_3を用いてもよく、SVM(Support Vector Machine)を用いてもよく、決定木を用いても良い。
以上説明したように、本実施例のキャピラリアレイ電気泳動装置10には、ピーク間隔に制約を付けた上で逆畳み込み処理を実行する機能を搭載する。これにより、ピークの分離度が低い場合(特に、異なる塩基種別の波形が時間的に重なっている場合)でも、高精度に塩基配列を決定することができる。特に可搬型(小型)のシーケンサや測定時間が短いシーケンサではピークの分離度が低くなり易いと考えられるため、本実施例の手法はこれらのシーケンサに効果的である。
本実施例では、キャピラリアレイ電気泳動装置10に、各種のパラメータを機械学習する機能を採用する場合について説明する。なお、本実施例におけるキャピラリアレイ電気泳動装置10の基本的な装置は実施例1と同じである。以下では、同じ測定条件で既知の塩基配列の試料を測定した複数の入力信号が信号入力部101に入力されるものとする。
図8に、キャピラリアレイ電気泳動装置10Aの他の構成例を示す。図8には、図2との対応部分に同一符号を付して示す。実施例1の場合、塩基配列の決定処理を蛍光検出装置50の信号処理部72で実行しているが、本実施例の蛍光検出装置50Aでは信号処理部72に塩基配列の解析機能を搭載せず、キャピラリアレイ電気泳動装置10Aに対して外付けされるコンピュータ等の外部装置53で実行する。このため、図8に示すキャピラリアレイ電気泳動装置10Aでは、制御基板51に対して外部装置53が接続されている。外部装置53は、信号処理部72で実行される信号処理を実行するのに十分な計算資源を有するものとする。また、外部装置53には、処理結果等の確認用に表示装置が設けられている。なお、制御基板51と外部装置53との通信は、有線方式でも無線方式でもよい。例えば外部装置53は、デスクトップPC、ノートPC、スマートフォン、携帯情報端末である。
本発明には、上述した実施例に限定されるものではなく、様々な変形例が含まれる。例えば、上述した実施例は本発明を分かりやすく説明するために詳細に説明したものであり、必ずしも説明した全ての構成を備えるものに限定されるものではない。また、ある実施例の構成の一部を他の実施例の構成に置き換えることが可能であり、また、ある実施例の構成に他の実施例の構成を加えることも可能である。また、各実施例の構成の一部については、他の構成の追加、削除又は置換が可能である。
11…サンプル容器、
12…サンプルトレイ、
20…搬送器、
21…高圧電源、
30…キャピラリアレイ、
31…恒温槽、
32…検出位置、
33…キャピラリ、
34…排出位置、
41…電気泳動媒体、
42…ポンプユニット、
50…蛍光検出装置、
51…制御基板、
52…表示装置、
72…信号処理部、
101…信号入力部、
102…ベースライン除去部、
103…色変換部、
104…ブロック切り出し部、
105…逆畳み込み部、
106…ピーク抽出部、
107…移動度補正部、
108…ピーク間隔制約付逆畳み込み部、
109…ピーク間隔許容度入力部、
110…ピーク抽出部、
111…配列特定部、
112…配列出力部、
200…インターフェース画面、
201…許容度αの入力欄、
202…ピーク位置、
203…チェック欄、
204…チェック欄、
205…チェック欄。
Claims (15)
- 各塩基に対応する波長スペクトルの時系列信号を移動度補正した移動度補正信号を出力する移動度補正部と、
点拡がり関数の複数のパラメータ候補について、前記移動度補正信号の逆畳み込み後信号をそれぞれ算出する処理と、算出された逆畳み込み後信号についてピーク間隔の分散を計算する処理と、計算された分散を用いて前記点拡がり関数のパラメータを特定する処理と、特定されたパラメータを有する前記点拡がり関数に対応する前記逆畳み込み信号を更新逆畳み込み信号として出力する処理と、を実行する逆畳み込み部と、
前記更新逆畳み込み後信号からピーク波形を抽出し、更新ピーク抽出後信号を出力するピーク抽出部と、
前記更新ピーク抽出後信号を入力し、塩基配列を決定する配列特定部と
を有する塩基配列決定装置。 - 請求項1に記載の塩基配列決定装置において、
前記逆畳み込み部は、前記複数のパラメータ候補について算出された前記逆畳み込み後信号のそれぞれについて畳み込み誤差とピーク間隔の分散を計算し、前記畳み込み誤差と前記分散の大きさとによって計算される評価値に基づいて前記更新逆畳み込み信号の算出に使用する前記点拡がり関数のパラメータを特定する
ことを特徴とする塩基配列決定装置。 - 請求項2に記載の塩基配列決定装置において、
前記評価値の計算時に使用する、前記分散に乗算する重み係数を与える許容度を、インターフェース画面に対する入力を通じて受け付ける入力部を更に有する
ことを特徴とする塩基配列決定装置。 - 請求項3に記載の塩基配列決定装置において、
前記許容度の入力値の変更に応じて、前記インターフェース画面に表示される前記更新逆畳み込み後信号の波形が変化する
ことを特徴とする塩基配列決定装置。 - 請求項1に記載の塩基配列決定装置において、
前記逆畳み込み部による前記逆畳み込み後信号のピーク間隔の前記分散の計算時に、複数の時間区間について計算される前記分散の計算結果を用いるか否かを、インターフェース画面に表示されるチェック欄へのチェックの有無を通じて受け付ける入力部を更に有する
ことを特徴とする塩基配列決定装置。 - 請求項1に記載の塩基配列決定装置において、
前記逆畳み込み部は、前記逆畳み込み後信号のピーク間隔の前記分散の計算結果を、当該計算結果に対応する時間区間以外の複数の時間区間について計算される前記分散の計算結果を用いて修正し、修正後の前記分散を用いて前記点拡がり関数のパラメータを特定する
ことを特徴とする塩基配列決定装置。 - 請求項1に記載の塩基配列決定装置において、
前記逆畳み込み部は、前記更新逆畳み込み後信号の算出に使用する前記点拡がり関数のパラメータを特定する処理の実行前に、以下の(1)~(3)を満たす逆畳み込み後信号が得られるパラメータ候補のみを抽出する
ことを特徴とする塩基配列決定装置。
(1)前記逆畳み込み後信号と前記移動度補正信号との間の畳み込み誤差が所定の閾値以下である。
(2)前記逆畳み込み後信号から抽出されるピークの間隔の最小値が閾値以上である。
(3)前記点拡がり関数のパラメータ候補が、前記畳み込み誤差の変曲点の近傍に存在する。 - サンプルが電気泳動されるキャピラリアレイと、
前記キャピラリアレイに泳動電圧を印加する高圧電源と、
前記キャピラリアレイからの蛍光を検出する受光部と、
前記受光部からの信号を処理して前記サンプルの塩基配列を決定する請求項1に記載の塩基配列決定装置と
を有するキャピラリアレイ電気泳動装置。 - 信号処理部とメモリを有する塩基配列決定装置で実行される塩基配列決定方法において、
前記信号処理部が、各塩基に対応する波長スペクトルの時系列信号を移動度補正した移動度補正信号を出力する処理と、
前記信号処理部が、点拡がり関数の複数のパラメータ候補について、前記移動度補正信号の逆畳み込み後信号をそれぞれ算出する処理と、
前記信号処理部が、算出された逆畳み込み後信号のそれぞれについてピーク間隔の分散を計算する処理と、
前記信号処理部が、計算された分散を用いて前記点拡がり関数のパラメータを特定する処理と、特定されたパラメータを有する前記点拡がり関数に対応する前記逆畳み込み信号を更新逆畳み込み信号として出力する処理と、
前記信号処理部が、前記更新逆畳み込み後信号からピーク波形を抽出し、更新ピーク抽出後信号を出力する処理と、
前記信号処理部が、前記更新ピーク抽出後信号を入力し、塩基配列を決定する処理と
を有する塩基配列決定方法。 - 請求項9に記載の塩基配列決定方法において、
前記信号処理部が、前記複数のパラメータ候補について算出された前記逆畳み込み後信号のそれぞれについて畳み込み誤差とピーク間隔の分散を計算し、前記畳み込み誤差と前記分散の大きさとによって計算される評価値に基づいて前記更新逆畳み込み信号の算出に使用する前記点拡がり関数のパラメータを特定する
ことを特徴とする塩基配列決定方法。 - 請求項10に記載の塩基配列決定方法において、
前記信号処理部が、前記評価値の計算時に使用する、前記分散に乗算する重み係数を与える許容度の入力欄をインターフェース画面に表示する
ことを特徴とする塩基配列決定方法。 - 請求項11に記載の塩基配列決定方法において、
前記信号処理部は、前記許容度の入力値の変更に応じて、前記インターフェース画面に表示する前記更新逆畳み込み後信号の波形を変化させる
ことを特徴とする塩基配列決定方法。 - 請求項9に記載の塩基配列決定方法において、
前記信号処理部が、前記逆畳み込み部による前記逆畳み込み後信号のピーク間隔の前記分散の計算時に、複数の時間区間について計算される前記分散の計算結果を用いるか否かを指示するためのチェック欄をインターフェース画面に表示する
ことを特徴とする塩基配列決定方法。 - 請求項9に記載の塩基配列決定方法において、
前記信号処理部が、前記逆畳み込み後信号のピーク間隔の前記分散の計算結果を、当該計算結果に対応する時間区間以外の複数の時間区間について計算される前記分散の計算結果を用いて修正し、修正後の前記分散を用いて前記点拡がり関数のパラメータを特定する
ことを特徴とする塩基配列決定方法。 - 請求項9に記載の塩基配列決定方法において、
前記信号処理部が、前記更新逆畳み込み後信号の算出に使用する前記点拡がり関数のパラメータを特定する処理の実行前に、以下の(1)~(3)を満たす逆畳み込み後信号が得られるパラメータ候補のみを抽出する
ことを特徴とする塩基配列決定方法。
(1)前記逆畳み込み後信号と前記移動度補正信号との間の畳み込み誤差が所定の閾値以下である。
(2)前記逆畳み込み後信号から抽出されるピークの間隔の最小値が閾値以上である。
(3)前記点拡がり関数のパラメータ候補が、前記畳み込み誤差の変曲点の近傍に存在する。
Priority Applications (6)
| Application Number | Priority Date | Filing Date | Title |
|---|---|---|---|
| PCT/JP2016/052495 WO2017130349A1 (ja) | 2016-01-28 | 2016-01-28 | 塩基配列決定装置、キャピラリアレイ電気泳動装置及び方法 |
| GB1811729.1A GB2563748B (en) | 2016-01-28 | 2016-01-28 | Base sequence determination apparatus, capillary array electrophoresis apparatus, and method |
| US16/071,956 US11377685B2 (en) | 2016-01-28 | 2016-01-28 | Base sequence determination apparatus, capillary array electrophoresis apparatus, and method |
| CN201680079412.6A CN108473925B (zh) | 2016-01-28 | 2016-01-28 | 碱基序列确定装置、毛细管阵列电泳装置和方法 |
| JP2017563471A JP6514369B2 (ja) | 2016-01-28 | 2016-01-28 | 塩基配列決定装置、キャピラリアレイ電気泳動装置及び方法 |
| DE112016005844.6T DE112016005844B4 (de) | 2016-01-28 | 2016-01-28 | Basensequenz-Bestimmungsvorrichtung, Kapillarfeld-Elektrophoresevorrichtung und Verfahren |
Applications Claiming Priority (1)
| Application Number | Priority Date | Filing Date | Title |
|---|---|---|---|
| PCT/JP2016/052495 WO2017130349A1 (ja) | 2016-01-28 | 2016-01-28 | 塩基配列決定装置、キャピラリアレイ電気泳動装置及び方法 |
Publications (1)
| Publication Number | Publication Date |
|---|---|
| WO2017130349A1 true WO2017130349A1 (ja) | 2017-08-03 |
Family
ID=59397702
Family Applications (1)
| Application Number | Title | Priority Date | Filing Date |
|---|---|---|---|
| PCT/JP2016/052495 Ceased WO2017130349A1 (ja) | 2016-01-28 | 2016-01-28 | 塩基配列決定装置、キャピラリアレイ電気泳動装置及び方法 |
Country Status (6)
| Country | Link |
|---|---|
| US (1) | US11377685B2 (ja) |
| JP (1) | JP6514369B2 (ja) |
| CN (1) | CN108473925B (ja) |
| DE (1) | DE112016005844B4 (ja) |
| GB (1) | GB2563748B (ja) |
| WO (1) | WO2017130349A1 (ja) |
Cited By (3)
| Publication number | Priority date | Publication date | Assignee | Title |
|---|---|---|---|---|
| WO2020054292A1 (ja) * | 2018-09-10 | 2020-03-19 | 株式会社日立ハイテクノロジーズ | スペクトル校正装置及びスペクトル校正方法 |
| WO2022244058A1 (ja) * | 2021-05-17 | 2022-11-24 | 株式会社日立ハイテク | 塩基配列の解析方法及び遺伝子解析装置 |
| US20250102463A1 (en) * | 2020-04-30 | 2025-03-27 | Promega Corporation | Laser illumination techniques for capillary electrophoresis |
Citations (3)
| Publication number | Priority date | Publication date | Assignee | Title |
|---|---|---|---|---|
| JPH08173197A (ja) * | 1994-12-28 | 1996-07-09 | Hitachi Electron Eng Co Ltd | Dna塩基配列決定のための波形ピーク決定方法およびdna塩基配列決定装置 |
| JP2003161725A (ja) * | 2002-10-10 | 2003-06-06 | Hitachi Ltd | クロマトグラム解析方法 |
| WO2008050426A1 (en) * | 2006-10-26 | 2008-05-02 | Shimadzu Corporation | Method of determining base sequence of nucleic acid |
Family Cites Families (8)
| Publication number | Priority date | Publication date | Assignee | Title |
|---|---|---|---|---|
| JP3690271B2 (ja) * | 2000-11-29 | 2005-08-31 | 株式会社島津製作所 | 核酸の塩基配列決定のためのマトリックス値を得る方法 |
| JP3498706B2 (ja) * | 2001-01-05 | 2004-02-16 | 株式会社島津製作所 | 核酸の塩基配列決定方法 |
| US20100266177A1 (en) * | 2002-05-07 | 2010-10-21 | Applied Biosystems, Llc | Signal processing by iterative deconvolution of time series data |
| US7850683B2 (en) * | 2005-05-20 | 2010-12-14 | Myoscience, Inc. | Subdermal cryogenic remodeling of muscles, nerves, connective tissue, and/or adipose tissue (fat) |
| US20100292102A1 (en) * | 2009-05-14 | 2010-11-18 | Ali Nouri | System and Method For Preventing Synthesis of Dangerous Biological Sequences |
| US10241075B2 (en) * | 2010-12-30 | 2019-03-26 | Life Technologies Corporation | Methods, systems, and computer readable media for nucleic acid sequencing |
| US8885235B2 (en) * | 2012-11-30 | 2014-11-11 | Xerox Corporation | Scanner calibration correcting for foreign matter debris |
| JP6087128B2 (ja) * | 2012-12-17 | 2017-03-01 | 株式会社日立ハイテクノロジーズ | 遺伝子型解析装置及び遺伝子型解析方法 |
-
2016
- 2016-01-28 CN CN201680079412.6A patent/CN108473925B/zh active Active
- 2016-01-28 GB GB1811729.1A patent/GB2563748B/en active Active
- 2016-01-28 WO PCT/JP2016/052495 patent/WO2017130349A1/ja not_active Ceased
- 2016-01-28 DE DE112016005844.6T patent/DE112016005844B4/de active Active
- 2016-01-28 US US16/071,956 patent/US11377685B2/en active Active
- 2016-01-28 JP JP2017563471A patent/JP6514369B2/ja active Active
Patent Citations (3)
| Publication number | Priority date | Publication date | Assignee | Title |
|---|---|---|---|---|
| JPH08173197A (ja) * | 1994-12-28 | 1996-07-09 | Hitachi Electron Eng Co Ltd | Dna塩基配列決定のための波形ピーク決定方法およびdna塩基配列決定装置 |
| JP2003161725A (ja) * | 2002-10-10 | 2003-06-06 | Hitachi Ltd | クロマトグラム解析方法 |
| WO2008050426A1 (en) * | 2006-10-26 | 2008-05-02 | Shimadzu Corporation | Method of determining base sequence of nucleic acid |
Cited By (11)
| Publication number | Priority date | Publication date | Assignee | Title |
|---|---|---|---|---|
| WO2020054292A1 (ja) * | 2018-09-10 | 2020-03-19 | 株式会社日立ハイテクノロジーズ | スペクトル校正装置及びスペクトル校正方法 |
| JP2020041876A (ja) * | 2018-09-10 | 2020-03-19 | 株式会社日立ハイテクノロジーズ | スペクトル校正装置及びスペクトル校正方法 |
| GB2590833A (en) * | 2018-09-10 | 2021-07-07 | Hitachi High Tech Corp | Spectral calibration apparatus and spectral calibration method |
| JP7022670B2 (ja) | 2018-09-10 | 2022-02-18 | 株式会社日立ハイテク | スペクトル校正装置及びスペクトル校正方法 |
| GB2590833B (en) * | 2018-09-10 | 2022-06-22 | Hitachi High Tech Corp | Spectral calibration apparatus and spectral calibration method |
| US11692937B2 (en) | 2018-09-10 | 2023-07-04 | Hitachi High-Tech Corporation | Spectral calibration apparatus and spectral calibration method |
| US20250102463A1 (en) * | 2020-04-30 | 2025-03-27 | Promega Corporation | Laser illumination techniques for capillary electrophoresis |
| WO2022244058A1 (ja) * | 2021-05-17 | 2022-11-24 | 株式会社日立ハイテク | 塩基配列の解析方法及び遺伝子解析装置 |
| GB2620335A (en) * | 2021-05-17 | 2024-01-03 | Hitachi High Tech Corp | Method for analyzing base sequences and gene analyzer |
| JP7640687B2 (ja) | 2021-05-17 | 2025-03-05 | 株式会社日立ハイテク | 塩基配列の解析方法及び遺伝子解析装置 |
| GB2620335B (en) * | 2021-05-17 | 2025-04-09 | Hitachi High Tech Corp | Analysis method of base sequence and gene analyzer |
Also Published As
| Publication number | Publication date |
|---|---|
| CN108473925B (zh) | 2025-12-30 |
| GB201811729D0 (en) | 2018-08-29 |
| DE112016005844B4 (de) | 2023-06-15 |
| US11377685B2 (en) | 2022-07-05 |
| US20190032126A1 (en) | 2019-01-31 |
| JP6514369B2 (ja) | 2019-05-15 |
| JPWO2017130349A1 (ja) | 2018-10-11 |
| DE112016005844T5 (de) | 2018-08-30 |
| GB2563748B (en) | 2022-01-19 |
| GB2563748A (en) | 2018-12-26 |
| CN108473925A (zh) | 2018-08-31 |
Similar Documents
| Publication | Publication Date | Title |
|---|---|---|
| Vasa et al. | ShapeFinder: a software system for high-throughput quantitative analysis of nucleic acid reactivity information resolved by capillary electrophoresis | |
| US8407012B2 (en) | Methods and systems of DNA sequencing | |
| US8392126B2 (en) | Method and system for determining the accuracy of DNA base identifications | |
| Carapito et al. | MSDA, a proteomics software suite for in‐depth M ass S pectrometry D ata A nalysis using grid computing | |
| Boskova et al. | Inference of epidemiological dynamics based on simulated phylogenies using birth-death and coalescent models | |
| US8761496B2 (en) | Image processing apparatus for calculating a degree of similarity between images, method of image processing, processing apparatus for calculating a degree of approximation between data sets, method of processing, computer program product, and computer readable medium | |
| Vaser et al. | Yet another de novo genome assembler | |
| CN109475795B (zh) | 用于自动对准、校准和标准化电泳数据的系统和方法 | |
| WO2017130349A1 (ja) | 塩基配列決定装置、キャピラリアレイ電気泳動装置及び方法 | |
| CN109767811A (zh) | 用于预测肿瘤突变负荷的线型模型的构建方法、预测肿瘤突变负荷的方法及装置 | |
| JP7022670B2 (ja) | スペクトル校正装置及びスペクトル校正方法 | |
| Adelman et al. | Automated detection and removal of capillary electrophoresis artifacts due to spectral overlap | |
| Vyverman et al. | A long fragment aligner called ALFALFA | |
| Weerakoon et al. | LCSkPOA: enabling banded semi-global partial order alignments via efficient and accurate backbone generation through extended LCSk++ | |
| JP5781486B2 (ja) | シードの長さを考慮した塩基配列処理システム及び方法 | |
| US10910086B2 (en) | Methods and systems for detecting minor variants in a sample of genetic material | |
| Hu et al. | Joint precursor elution profile inference via regression for peptide detection in data-independent acquisition mass spectra | |
| Zou | Correcting for Sample Heterogeneity in Methylome-Wide Association Studies | |
| Skotare | Multivariate integration and visualization of multiblock data in chemical and biological applications | |
| JP7075011B2 (ja) | 情報処理装置、パッチ適用確認システム、パッチ適用確認方法、およびパッチ適用確認プログラム | |
| Hasam et al. | A Pipeline for Peptide Detection Using Multiple Decoys |
Legal Events
| Date | Code | Title | Description |
|---|---|---|---|
| 121 | Ep: the epo has been informed by wipo that ep was designated in this application |
Ref document number: 16887936 Country of ref document: EP Kind code of ref document: A1 |
|
| ENP | Entry into the national phase |
Ref document number: 2017563471 Country of ref document: JP Kind code of ref document: A |
|
| WWE | Wipo information: entry into national phase |
Ref document number: 112016005844 Country of ref document: DE |
|
| ENP | Entry into the national phase |
Ref document number: 201811729 Country of ref document: GB Kind code of ref document: A Free format text: PCT FILING DATE = 20160128 |
|
| WWE | Wipo information: entry into national phase |
Ref document number: 1811729.1 Country of ref document: GB |
|
| 122 | Ep: pct application non-entry in european phase |
Ref document number: 16887936 Country of ref document: EP Kind code of ref document: A1 |