WO2017130280A1 - 水素需要量予測システム、水素需要量予測方法および水素需要量予測装置 - Google Patents
水素需要量予測システム、水素需要量予測方法および水素需要量予測装置 Download PDFInfo
- Publication number
- WO2017130280A1 WO2017130280A1 PCT/JP2016/052049 JP2016052049W WO2017130280A1 WO 2017130280 A1 WO2017130280 A1 WO 2017130280A1 JP 2016052049 W JP2016052049 W JP 2016052049W WO 2017130280 A1 WO2017130280 A1 WO 2017130280A1
- Authority
- WO
- WIPO (PCT)
- Prior art keywords
- hydrogen
- amount
- prediction
- pattern
- demand
- Prior art date
- Legal status (The legal status is an assumption and is not a legal conclusion. Google has not performed a legal analysis and makes no representation as to the accuracy of the status listed.)
- Ceased
Links
Images










Classifications
-
- B—PERFORMING OPERATIONS; TRANSPORTING
- B60—VEHICLES IN GENERAL
- B60L—PROPULSION OF ELECTRICALLY-PROPELLED VEHICLES; SUPPLYING ELECTRIC POWER FOR AUXILIARY EQUIPMENT OF ELECTRICALLY-PROPELLED VEHICLES; ELECTRODYNAMIC BRAKE SYSTEMS FOR VEHICLES IN GENERAL; MAGNETIC SUSPENSION OR LEVITATION FOR VEHICLES; MONITORING OPERATING VARIABLES OF ELECTRICALLY-PROPELLED VEHICLES; ELECTRIC SAFETY DEVICES FOR ELECTRICALLY-PROPELLED VEHICLES
- B60L50/00—Electric propulsion with power supplied within the vehicle
- B60L50/50—Electric propulsion with power supplied within the vehicle using propulsion power supplied by batteries or fuel cells
- B60L50/70—Electric propulsion with power supplied within the vehicle using propulsion power supplied by batteries or fuel cells using power supplied by fuel cells
-
- H—ELECTRICITY
- H01—ELECTRIC ELEMENTS
- H01M—PROCESSES OR MEANS, e.g. BATTERIES, FOR THE DIRECT CONVERSION OF CHEMICAL ENERGY INTO ELECTRICAL ENERGY
- H01M8/00—Fuel cells; Manufacture thereof
- H01M8/06—Combination of fuel cells with means for production of reactants or for treatment of residues
- H01M8/0606—Combination of fuel cells with means for production of reactants or for treatment of residues with means for production of gaseous reactants
-
- C—CHEMISTRY; METALLURGY
- C01—INORGANIC CHEMISTRY
- C01B—NON-METALLIC ELEMENTS; COMPOUNDS THEREOF; METALLOIDS OR COMPOUNDS THEREOF NOT COVERED BY SUBCLASS C01C
- C01B3/00—Hydrogen; Gaseous mixtures containing hydrogen; Separation of hydrogen from mixtures containing it; Purification of hydrogen; Reversible storage of hydrogen
-
- Y—GENERAL TAGGING OF NEW TECHNOLOGICAL DEVELOPMENTS; GENERAL TAGGING OF CROSS-SECTIONAL TECHNOLOGIES SPANNING OVER SEVERAL SECTIONS OF THE IPC; TECHNICAL SUBJECTS COVERED BY FORMER USPC CROSS-REFERENCE ART COLLECTIONS [XRACs] AND DIGESTS
- Y02—TECHNOLOGIES OR APPLICATIONS FOR MITIGATION OR ADAPTATION AGAINST CLIMATE CHANGE
- Y02E—REDUCTION OF GREENHOUSE GAS [GHG] EMISSIONS, RELATED TO ENERGY GENERATION, TRANSMISSION OR DISTRIBUTION
- Y02E60/00—Enabling technologies; Technologies with a potential or indirect contribution to GHG emissions mitigation
- Y02E60/30—Hydrogen technology
- Y02E60/32—Hydrogen storage
-
- Y—GENERAL TAGGING OF NEW TECHNOLOGICAL DEVELOPMENTS; GENERAL TAGGING OF CROSS-SECTIONAL TECHNOLOGIES SPANNING OVER SEVERAL SECTIONS OF THE IPC; TECHNICAL SUBJECTS COVERED BY FORMER USPC CROSS-REFERENCE ART COLLECTIONS [XRACs] AND DIGESTS
- Y02—TECHNOLOGIES OR APPLICATIONS FOR MITIGATION OR ADAPTATION AGAINST CLIMATE CHANGE
- Y02E—REDUCTION OF GREENHOUSE GAS [GHG] EMISSIONS, RELATED TO ENERGY GENERATION, TRANSMISSION OR DISTRIBUTION
- Y02E60/00—Enabling technologies; Technologies with a potential or indirect contribution to GHG emissions mitigation
- Y02E60/30—Hydrogen technology
- Y02E60/50—Fuel cells
-
- Y—GENERAL TAGGING OF NEW TECHNOLOGICAL DEVELOPMENTS; GENERAL TAGGING OF CROSS-SECTIONAL TECHNOLOGIES SPANNING OVER SEVERAL SECTIONS OF THE IPC; TECHNICAL SUBJECTS COVERED BY FORMER USPC CROSS-REFERENCE ART COLLECTIONS [XRACs] AND DIGESTS
- Y02—TECHNOLOGIES OR APPLICATIONS FOR MITIGATION OR ADAPTATION AGAINST CLIMATE CHANGE
- Y02T—CLIMATE CHANGE MITIGATION TECHNOLOGIES RELATED TO TRANSPORTATION
- Y02T90/00—Enabling technologies or technologies with a potential or indirect contribution to GHG emissions mitigation
- Y02T90/40—Application of hydrogen technology to transportation, e.g. using fuel cells
Definitions
- Embodiments of the present invention relate to a hydrogen demand prediction system, a hydrogen demand prediction method, and a hydrogen demand prediction apparatus.
- FCV Fuel Cell Vehicle
- the problem to be solved by the present invention is to provide a hydrogen demand forecasting system, a hydrogen demand forecasting method, and a hydrogen demand forecasting apparatus capable of suppressing the occurrence of waiting for hydrogen filling.
- the hydrogen demand prediction system in the embodiment obtains a hydrogen storage requirement of a fuel cell vehicle that is driven by a hydrogen production unit that produces hydrogen and a fuel cell that generates electricity using the hydrogen produced by the hydrogen production unit.
- Input data including the past hydrogen filling record of the fuel cell vehicle is input from the management unit, and the input data is calculated based on a daily amount that is a total amount of hydrogen charged on a demand forecast target day, and a predetermined value for the day.
- assembly of the learning phase of prediction for 24 hours by hydrogen MMS of the hydrogen demand prediction system in 7th Embodiment The figure which shows an example of the process sequence of the pattern model construction
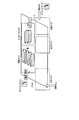
- FIG. 1 is a diagram illustrating a configuration example of a hydrogen demand prediction system according to an embodiment.
- the hydrogen demand prediction system in the embodiment includes a hydrogen station 20, a WMS (Warehouse Management System) 31, an ASN (Advanced Shipping Shipping) 32, databases (DB (Data Base)) 41 and 42, hydrogen. It has MMS (Mobility Management System) 50.
- the databases 41 and 42 are configured by a storage device such as a nonvolatile memory, for example.
- the power generation facility (PV or wind power generation facility) 10 is a facility having a power generation function derived from natural energy, such as PV or wind power generation.
- the hydrogen station 20 includes a water electrolysis device 21, a hydrogen storage container 22, a compressor 23, a pressure accumulator 24, a dispenser 25, and a hydrogen EMS (Energy Management System) 26.
- the water electrolysis device 21 uses the power generated by the power generation facility 10 to produce hydrogen by water electrolysis.
- the hydrogen storage container 22 stores hydrogen produced by the water electrolysis device 21. This stored hydrogen can be supplied to a fuel cell 61 of a consumer such as a building or a household.
- the fuel cell 61 supplies the generated electricity to the consumer 62 and supplies hot water obtained by using the exhaust heat generated by the power generation to the consumer 62.
- the compressor 23 compresses the hydrogen stored in the hydrogen storage container 22 so as to have a pressure necessary for filling the FC vehicle.
- the pressure accumulator 24 stores hydrogen compressed by the compressor 23.
- the dispenser 25 fills the FC vehicle with hydrogen compressed by the compressor 23 and stored in the accumulator 24.
- the water electrolysis apparatus 21 may produce hydrogen by water electrolysis using power generated by a power generation facility (for example, thermal power generation facility) that is not derived from natural energy or power of the power system.
- a power generation facility for example, thermal power generation facility
- the hydrogen EMS 26 predicts the hydrogen demand of a customer (for example, the customer 62) supplied with hydrogen from a hydrogen storage facility other than the dispenser 25 for the FC vehicle.
- the hydrogen EMS 26 formulates a hydrogen production plan based on the prediction result and the hydrogen storage requirement of the FC vehicle obtained from the hydrogen MMS 50, and controls the water electrolysis device 21 and the compressor 23 based on the plan. To do.
- the WMS 31 and ASN32 are a kind of logistics system.
- the WMS 31 is a warehouse management system and stores product management information in the database 41.
- the ASN 32 stores, in the database 42, a prior shipment notice as content detail information that is sent to the delivery destination before the product reaches the distribution center.
- the database 42 also stores calendar data 33 and weather forecast data 34.
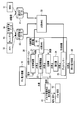
- FIG. 2 is a block diagram illustrating a functional configuration example of the hydrogen MMS of the hydrogen demand prediction system according to the first embodiment.
- the hydrogen MMS 50 includes UI (User Interface) 50a, 50c, 50e, a classification / dispenser setting unit 50b, a database 50d, 50f, a predicted performance display unit 50g, a predicted result correction unit 50h, and a prediction for 24 hours.
- the UIs 50a, 50c, and 50e may be a single UI.
- the databases 50d and 50f may be composed of one storage device.
- FIG. 3 is a diagram illustrating an example of a warehouse area used by a fuel cell vehicle related to the hydrogen demand prediction system according to the first embodiment.
- FIG. 4 is a diagram illustrating an example of a hydrogen MMS sequence of the hydrogen demand prediction system according to the first embodiment.
- the hydrogen MMS 50 (1) past data input from the WMS 31 or UI 50c operated by the operator and accumulated in the DB 50d, and (2) input from the ASN 32, calendar data 33, weather forecast data 34, and UI 50e operated by the operator.
- the 24-hour prediction unit 50i makes a hydrogen demand prediction for 24 hours (S1), and based on the prediction result, the hydrogen storage requirement calculation unit 50k The storage requirement amount is calculated (S2) and notified to the hydrogen EMS 26 from the communication unit 50m.
- the hydrogen EMS 26 formulates a hydrogen production plan (S3), and at the timing when the FC forklift is actually filled with hydrogen (S4), the hydrogen MMS 50 makes a re-predictive execution decision (S5), When the error of the actual value of hydrogen filling with respect to the prediction result in S1 is large, the re-prediction unit 50j performs re-prediction (S6).
- the hydrogen storage requirement calculation unit 50k calculates the hydrogen storage requirement amount based on the re-prediction result (S7), and notifies the hydrogen EMS 26 from the communication unit 50m. After this notification, the hydrogen EMS 26 makes a hydrogen production plan again (S8).
- the warehouse area classification which is a category related to demand forecasting, is the classification shown in FIG. 3, if four FC forklifts are dedicated to each area, these areas become each classification.
- the category / dispenser setting unit 50b displays the category setting information input by the operator operating the UI 50a and the location where the dispenser 25 is installed.
- the FC forklift in charge of each section associates the section with the dispenser for setting which dispenser 25 is to be filled with hydrogen based on such information. .
- the hydrogen MMS 50 can notify the hydrogen EMS 26 of the hydrogen storage request amount based on the hydrogen demand prediction for each dispenser (the dispensers installed nearby are regarded as the same).
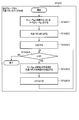
- FIG. 5 is a diagram illustrating an example of a 24-hour prediction procedure using the hydrogen MMS of the hydrogen demand prediction system according to the first embodiment.
- the 24-hour prediction unit 50i of the hydrogen MMS 50 performs a learning phase (S11) and then performs a prediction phase (S12) in order to predict hydrogen demand for 24 hours.
- FIG. 6 is a diagram illustrating an example of a processing procedure of a learning phase of prediction for 24 hours by hydrogen MMS of the hydrogen demand prediction system in the first embodiment.
- FIG. 7 is a diagram illustrating an example of the amount of charged hydrogen related to the hydrogen MMS of the hydrogen demand prediction system according to the first embodiment.
- the 24-hour prediction unit 50i of the hydrogen MMS 50 is connected to past performance data of the amount of hydrogen charged to the FC forklift as shown in FIG. 6 and FIG. Factor (attribute) to be used.
- the 24-hour prediction unit 50i performs factor classification for the pattern obtained by the daily amount / pattern division (S11b), and performs factor classification for the daily amount data obtained by the daily amount / pattern division (S11c).
- the 24-hour prediction unit 50i constructs a daily amount model that is a daily hydrogen demand prediction model based on the factor classification result for the daily amount data (S11d), and based on the factor classification result for the pattern, A pattern model that is a hydrogen demand prediction model is constructed (S11e).
- Fig. 7 shows the integrated value of the amount of hydrogen charged per hour.
- the prediction unit 50i for 24 hours calculates the total amount of hydrogen filling in a certain hour unit (calculates the total in one hour unit), and uses this total amount for the first time in the next one hour unit.
- the amount of hydrogen charged at the time of The past performance data shown in FIG. 6 can be obtained by obtaining the integrated value of the charged hydrogen amount from the first time of the day based on the estimated amount 50i for 24 hours and the charged hydrogen amount.
- the first time in the next hour unit may be the time in the previous hour unit.
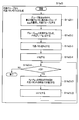
- FIG. 8 is a diagram illustrating an example of a daily / pattern division processing procedure in a learning phase of prediction for 24 hours by hydrogen MMS of the hydrogen demand prediction system in the first embodiment.
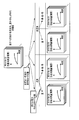
- FIG. 9 is a diagram illustrating an example of the daily amount / pattern division in the learning phase of 24-hour prediction by hydrogen MMS of the hydrogen demand prediction system according to the first embodiment.
- the prediction unit 50i for 24 hours sets the total amount M of the charged hydrogen amount for one day indicated by the past actual data of the charged hydrogen amount as the daily amount of the day (S11a1).
- the 24-hour prediction unit 50i performs 1 / M of the charged hydrogen amount at each time indicated by the past actual data of the charged hydrogen amount, that is, apportions the total amount per day as 1.
- FIG. 10 is a diagram illustrating an example of a processing procedure for factor classification in a learning phase of prediction for 24 hours by hydrogen MMS of the hydrogen demand prediction system in the first embodiment.
- FIG. 11 is a diagram illustrating an example of factor classification in a learning phase of prediction for 24 hours by hydrogen MMS of the hydrogen demand prediction system in the first embodiment. 10 and 11, the factor classification for the pattern will be described as an example, but the same applies to the factor classification for the daily amount data.
- the prediction unit 50i for 24 hours reads the factor F ⁇ f 1 , f 2 ,... F n ⁇ that affects the pattern of the past performance data stored in the DB 50d when the operator operates the UI 50c. Is prepared (S11b1).
- the end of the month is a period from the 28th to the 31st of a certain month, for example, and the non-end of the month is a period other than the end of the month.
- the 24-hour prediction unit 50i calculates the average value of the remaining data by excluding the maximum and minimum daily amounts at the specified ratio stored in the DB 50d by the operator operating the UI 50c ( S11d2). For example, as shown in FIG. 11, the daily amount of hydrogen charged for each day classified in the summer at the end of the month is 10, 68, 69, 71, 74, 75, 77, 88, 89, 840 in total. When the specified ratio is 0.2, the number to be excluded is two. In this case, the minimum value of 11 and the maximum value of 840 are excluded from the above 10 data, and the average of the remaining 8 daily doses of 76.375 is obtained. This is the daily amount of hydrogen charged.
- the maximum value and the minimum value are excluded according to the specified ratio 0.2, but the above ratio is not specified, and the charged hydrogen amount for each day in a certain class is not excluded from the daily amount. An average value may be calculated.
- FIG. 15 is a diagram illustrating an example of a processing procedure of a prediction phase of prediction for 24 hours by hydrogen MMS of the hydrogen demand prediction system according to the first embodiment.
- the 24-hour prediction unit 50i searches the daily quantity model and the pattern model for a model that matches the factor of the demand prediction target day as the daily quantity and pattern on the prediction target day (S12a).
- the 24-hour prediction unit 50i obtains a demand prediction result as an absolute amount of the amount of hydrogen charged on the demand prediction target day by multiplying the searched pattern model by the searched daily amount of the daily amount model (S12b).
- FIG. 16 is a diagram illustrating an example of a re-prediction processing procedure using the hydrogen MMS of the hydrogen demand prediction system according to the first embodiment.
- FIG. 17 is a diagram illustrating an example of re-prediction using the hydrogen MMS of the hydrogen demand prediction system according to the first embodiment.
- the re-prediction unit 50j obtains the square error sum for each unit time determined to perform the re-prediction from all the past performance data before being divided into the daily amount and the pattern. The data with the smallest error sum is selected, and this is used as the re-prediction result.
- FIG. 18 is a diagram illustrating an example of a processing procedure of hydrogen storage requirement calculation by the hydrogen MMS of the hydrogen demand prediction system according to the first embodiment. Specifically, the hydrogen storage requirement calculation unit 50k adds the demand prediction results of the sections corresponding to the same dispenser 25 for each time with respect to the demand prediction results of each section (S7b). Then, the hydrogen storage request amount calculation unit 50k adds a margin to each prediction result, and sets this result as the hydrogen storage request amount for each dispenser 25 (S7c).
- the hydrogen storage request amount calculation unit 50k notifies the hydrogen EMS 26 of the hydrogen storage request amount obtained in S7c via the communication unit 50m (S7e).
- FIG. 19 is a diagram showing another example of the processing procedure for calculating the hydrogen storage requirement amount by the hydrogen MMS of the hydrogen demand prediction system in the first embodiment. 18 differs from FIG. 18 in that the hydrogen storage requirement calculation processing is divided into a case where the filling record is notified from the hydrogen EMS 26 and a case where it is not.
- the hydrogen storage request amount calculation unit 50k for the demand prediction result for each section, the demand prediction result for the section corresponding to the same dispenser 25. Are added for each time (S7b). Then, the hydrogen storage request amount calculation unit 50k adds a margin to each prediction result, and sets this result as the hydrogen storage request amount for each dispenser 25 (S7c).
- the hydrogen storage request amount calculation unit 50k fills from the value of the next unit time of the hydrogen storage request amount of the dispenser 25 that has been filled. A hydrogen storage requirement amount obtained by subtracting the amount is obtained (S7d). It is assumed that the hydrogen storage requirement before this subtraction has already been obtained in the previous prediction.
- the hydrogen storage request amount calculation unit 50k notifies the hydrogen EMS 26 of the hydrogen storage request amount obtained in S7c or S7d via the communication unit 50m (S7e).
- the hydrogen demand prediction system it is possible to construct a daily prediction model and a pattern prediction model for each set category, and the set category It is possible to calculate the hydrogen storage requirement amount for each dispenser in consideration of the correspondence between the dispenser and the dispenser. As a result, it is possible to make a hydrogen demand prediction that reflects the difference in the amount of work for each physical distribution operation (arrival, shipment, etc.) using an FC forklift, and it can be expected that the demand prediction accuracy will be improved.
- FIG. 20 is a diagram illustrating an example of a processing procedure of a learning phase of prediction for 24 hours by hydrogen MMS of the hydrogen demand prediction system in the second embodiment.
- the processing from S11a to S11e described in the first embodiment is performed, and the 24-hour prediction unit 50i constructs a distribution model based on the factor classification result for the pattern in S11b (S11f).
- FIG. 22 is a diagram illustrating an example of a processing procedure of a prediction phase of prediction for 24 hours when a distribution model is constructed by hydrogen MMS in the hydrogen demand prediction system according to the second embodiment.
- the processing of S12a and S12b (see FIG. 15) described in the first embodiment is performed, and the 24-hour prediction unit 50i matches the factor of the demand prediction target date from the distribution model.
- the model is retrieved and set as the distribution of the target day (S12c).
- the determination of the re-prediction is performed when the re-prediction determination threshold is exceeded.
- the determination of the re-prediction is performed by determining the actual filling value in S12c above. Whether or not it is within the N% confidence interval of the distribution model. N is preset by the operator.
- FIG. 23 is a diagram illustrating an example of a processing procedure of a learning phase of 24-hour prediction by hydrogen MMS of the hydrogen demand prediction system in the third embodiment.
- the details of the daily amount / pattern division in the third embodiment correspond to performing the processing shown in FIG. 8 for each factor classification.
- the details of the daily amount model construction in the third embodiment correspond to performing the processing shown in FIG. 12 for each factor classification.
- the details of the pattern model construction in the third embodiment correspond to performing the processing shown in FIG. 14 for each factor classification.
- the factor classification is performed prior to the daily amount / pattern division, whereby the consistency between the daily amount and the pattern can be maintained, and the maintainability can be improved.
- the factor classification is performed for each of the daily amount and the pattern.
- the factor classification for one data past performance data
- the amount of work can be reduced.
- the 24-hour prediction unit 50i constructs the distribution model described in the second embodiment for the pattern in each factor described in the third embodiment.
- FIG. 24 is a diagram illustrating an example of a processing procedure of a learning phase of prediction for 24 hours by hydrogen MMS of the hydrogen demand prediction system in the fourth embodiment.
- the processing of S11g, S11a, S11d, and S11e described in the third embodiment is performed, and the 24-hour prediction unit 50i constructs a distribution model based on the pattern obtained by dividing the factor classification result in S11a. (S11f).
- S11f Details of the factor classification daily amount / pattern division, daily amount model construction, and pattern model construction in the fourth embodiment are the same as those in the third embodiment, and details of distribution model construction in the fourth embodiment are shown in FIG.
- the processing flow of the prediction phase in the fourth embodiment is the same as the processing shown in FIG. 22, and the details of the re-prediction in the fourth embodiment are described in the second embodiment. This is the same as the above processing.
- the length of time belonging to these divided time zones does not necessarily have to be the same. For example, late night (0-4 o'clock), early morning (5-6 o'clock), morning (7-8 o'clock), start of work After (9-10), Before lunch (11), Lunch break (12), Immediately after lunch break (1-2), Noon (3-4), Scheduled (5), After scheduled (6-7), Night (8-10) ), Before midnight (11), or the like.
- the demand prediction using the characteristics of each time zone is performed by classifying into a plurality of predetermined time zones and constructing a hydrogen demand forecast pattern model for each time zone.
- the demand forecast accuracy can be improved.
- the re-prediction unit 50j uses all of the past result data, that is, the data with the smallest sum of squares of the error between the demand prediction result and the hydrogen filling result, that is, Data close to the current performance was selected and used as the re-prediction result.
- the re-prediction unit 50j uses a time series based on the time series changes of the past several hours or the past several days in the past performance data. Re-predict by analysis. Examples of the time series analysis method include an exponential smoothing model, an autoregressive integrated moving average (ARIMA) model, a winters model, and the like.
- the re-prediction unit 50j converts the integrated value of the charged hydrogen amount at a certain time into a change amount (instantaneous value) of the charged hydrogen amount from a predetermined time before this time. In addition, the converted data is used for re-prediction.
- the 24-hour prediction unit 50 i constructs a pattern model by obtaining an average value of the amount of hydrogen charged (integrated) at each time.
- the 24-hour prediction unit 50i calculates the difference at each time between a certain group and a certain pattern, and the total value of this difference at all times. Based on the similarity calculated by the above, the patterns are grouped, the moving average is calculated for each time in the pattern in the group with the largest number of patterns, and based on this, it is used for demand forecasting
- a pattern model is constructed by generating a representative pattern model.
- the 24-hour prediction unit 50i calculates an error between a certain group and a certain pattern (S11e17). Details of the calculation of this error will be described later.
- the above S11e13 to S11e21 are carried out until it is done. If it is confirmed that i ⁇ N is not satisfied (S11e22), the 24-hour prediction unit 50i generates a representative pattern model from the representative group (S11e23). The generation of the representative pattern model will be described later.
- the 24-hour prediction unit 50i selects the group g j from the group set Gr (S11e17-1).
- the 24-hour prediction unit 50i obtains a square error DIFF between the value of the pattern Pi at the time t and the average value AVG (S11e17-6).
- MAX_DIFF DIFF (S11e17-7).
- the 24-hour prediction unit 50i selects the group g max having the largest number of patterns belonging to the group set Gr and designates it as a representative group (S11e23-1).
- the seventh embodiment by calculating the moving average for each time for the pattern in the group with the largest number of patterns, the representative pattern is obtained, and importance is attached as it approaches the present from the past. Therefore, it can be expected to improve demand forecasting accuracy.
- the 24-hour prediction unit 50 i constructs a pattern model by obtaining an average value of the amount of hydrogen charged (integrated) at each time.
- the 24-hour prediction unit 50i divides similar patterns into groups, obtains a moving average for each time in the pattern in the group having the largest number of patterns belonging thereto, Based on the above, a pattern model was constructed by generating a representative pattern model.
- the prediction unit 50i for 24 hours classifies the pattern group of the charged hydrogen amount (integration) in each classification classified by the factor using the correlation coefficient, A representative pattern is generated by selecting a group having the most belonging patterns in the group and obtaining an average value for each time.
- 28, 29, and 30 are diagrams illustrating an example of a processing procedure for building a pattern model in a learning phase of prediction for 24 hours by hydrogen MMS in the hydrogen demand prediction system according to the eighth embodiment.
- the 24-hour prediction unit 50i performs the processing from S11e1 to S11e15 described in the seventh embodiment.
- the 24-hour prediction unit 50i selects the group g j from the group set Gr (S11e31).
- the 24-hour prediction unit 50i generates a representative pattern model from a certain group (S11e32). This generation will be described later.
- the 24-hour prediction unit 50i obtains a correlation coefficient Cji between the representative pattern Pj and the pattern Pi of the group gj (S11e33).
- This correlation coefficient Cji can be obtained by the following equations (2), (3), (4).
- Pj in the formula (2) is a value of the pattern Pj at time t.
- Pi in the formula (2) is a value of the pattern Pi at time t.
- T 25 in the equations (3) and (4).
- the 24-hour prediction unit 50i satisfies the condition satisfying the maximum among the correlation coefficients C0i to CLi and the threshold value or more.
- the pattern Pi is registered in. If there is no group that satisfies the condition, the 24-hour prediction unit 50i creates a new group to which only the pattern Pi belongs and registers it in the group set Gr (S11e34).
- the above S11e13 to S11e21 are carried out until it is done. If it is confirmed that i ⁇ N is not satisfied (S11e22), the 24-hour prediction unit 50i generates a representative pattern model from the representative group (S11e23). This generation will be described later.
- the 24-hour prediction unit 50i determines whether or not t ⁇ 25 (S11e32-4). If t ⁇ 25 (YES in S11e32-4), 24 hours prediction unit 50i is a value at P 0 ⁇ P the average value of M-1 at time t representative pattern Pi at time t (S11e32- 5).
- the 24-hour prediction unit 50i performs the processing of S11e23-1 to S11e23-5 described in the seventh embodiment.
- the 24-hour prediction unit 50i sets the average value at time t of P 0 to P M-1 as the value at time t of the representative pattern Pr (S11e23- 21).
- the eighth embodiment by classifying a group by looking at the overall correlation, patterns that are similar to the overall time but that are similar to the overall time are detected for the partial group. Therefore, the demand prediction accuracy can be improved.
- the hydrogen storage requirement calculation unit 50k calculates the margin of the charged hydrogen amount using the re-prediction determination difference of the equation (1) and the coefficients ⁇ and ⁇ .
- the hydrogen storage requirement calculation unit 50k obtains a margin using a probability distribution.
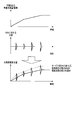
- FIG. 31 is a diagram illustrating an example of margin setting using a probability distribution by hydrogen MMS of the hydrogen demand prediction system according to the ninth embodiment.
- the operator sets a predetermined target service rate using the UI 50g or the like.
- This service rate means the probability that the amount of hydrogen required by the FC forklift can be filled. If the service rate is 100%, it can be filled with a probability of 100%. However, this service rate is a probability based on past data.
- the hydrogen storage requirement calculation unit 50k obtains the probability distribution of the charged hydrogen amount by obtaining the dispersion of the time characteristic of the predicted charged hydrogen amount (integrated) at each time.
- the hydrogen storage requirement calculation unit 50k selects the position of the confidence interval corresponding to the set service rate for each time in this distribution, and the amount of hydrogen charged (integrated) connecting the selected positions at each time, It is regarded as the amount of hydrogen charged with a margin added. For example, if the service rate is 95%, the 95% confidence interval portion of the variance at each time is selected.
- the hydrogen storage requirement calculation unit 50k adds the margin to the predicted charged hydrogen amount (integrated), and adds the margin to the charged hydrogen amount corresponding to the characteristic curve as shown by the dotted line in FIG. Calculated as the amount of hydrogen storage required.
- the ninth embodiment by obtaining the margin of the charged hydrogen amount using the probability distribution, it is not necessary for the operator to set a plurality of coefficients for calculating the margin, and labor is reduced. In addition, since the margin is determined using the actual value of the charged hydrogen amount, it is possible to obtain a hydrogen storage demand with higher utility value.
- FIG. 32 is a diagram for explaining a physical arrangement method and a communication function between the hydrogen MMS and the hydrogen EMS of the hydrogen demand prediction system according to the tenth embodiment.
- FIG. 32A in the conventional configuration, a system configuration in which an operation pattern determination program corresponding to hydrogen EMS and a load prediction program corresponding to hydrogen MMS are realized by the same program operating on the same device. It has become.
- the hydrogen MMS 50 and the hydrogen EMS 26 exchange information via a DB (database), or as shown in FIG.
- DB database
- FIG. 32B a configuration in which the hydrogen MMS 50 and the hydrogen EMS 26 exchange information via a shared file, or a configuration in which the hydrogen MMS 50 and the hydrogen EMS 26 directly communicate with each other as illustrated in FIG.
- the hydrogen MMS 50 and the hydrogen EMS 26 may be realized in the same program or in the same executable file. Further, the hydrogen MMS 50 and the hydrogen EMS 26 may be realized in another program executed on the same device or in another execution format file. Further, the hydrogen MMS 50 and the hydrogen EMS 26 may be realized in another program executed on different devices or in another executable file.
- the hydrogen EMS 26 controls hydrogen production. For this reason, it is desirable that the hydrogen EMS 26 be disposed near an apparatus for hydrogen production such as the water electrolysis apparatus 21.
- the hydrogen MMS 50 is preferably disposed near the dispenser 25.
- the hydrogen EMS 26 and the hydrogen MMS 50 can be realized by separate devices. Thereby, it can respond to the case where the geographical position for performing hydrogen production and storing this in the hydrogen storage container 22 is separated from the geographical position where the dispenser 25 is disposed. This corresponds to the case where the hydrogen stored in the hydrogen storage container 22 is transported by a tank truck or the like and stored in another hydrogen storage container 22 corresponding to the position where the dispenser 25 is disposed.
- FIG. 33 is a diagram illustrating a configuration example of a hydrogen demand prediction system according to the tenth embodiment.
- FIG. 34 is a block diagram illustrating a functional configuration example of the hydrogen MMS of the hydrogen demand prediction system according to the tenth embodiment.
- the hydrogen MMS 50 can directly receive the hydrogen filling record from, for example, the dispenser 25 without using the hydrogen EMS 26.
- the hydrogen MMS 50 can directly receive the hydrogen filling record from the pressure accumulator 24 without using the hydrogen EMS 26.
- FIG. 35 is a block diagram illustrating a functional configuration example of the hydrogen MMS of the hydrogen demand prediction system in the eleventh embodiment.
- the hydrogen MMS 50 further includes a charged hydrogen amount estimation unit 50n.
- the DB 50d stores past data of work (arrivals, shipments, etc.) transmitted from the WMS 31 and performed in each section.
- the DB 50d stores past data (experience values) of information on work estimated to be performed in each section by the operator operating the UI 50c.
- the DB 50d is a unit fuel consumption (hydrogen consumption per operation) for each operation of the FC forklift (claw raising / lowering, movement, etc.) and an average performed by the operation in each division by the operator operating the UI 50c. Forklift operation ratio information.
- the DB 50 f stores demand forecast target date data of work expected to be performed in each section from the ASN 32, and stores calendar data 33 and weather forecast data 34.
- the charged hydrogen amount estimating unit 50n includes past data stored in the DB 50d from the WMS 31, past data (experience values) stored in the DB 50d from the UI 50c, unit fuel consumption for each operation of the FC forklift, and the average forklift.
- the operation ratio, the demand forecast target date data stored in the DB 50d, the calendar data 33, and the weather forecast data 34 are acquired as information regarding work in each section.
- the charged hydrogen amount estimation unit 50n estimates the fuel consumption of the FC forklift in each past section based on the acquired information.
- the 24-hour prediction unit 50i regards this estimated fuel consumption as the past hydrogen-filled hydrogen amount and uses it in the learning phase.
- the 24-hour prediction unit 50i uses the work indicated by this data for demand prediction. It can be used as a factor when building various models.
- the eleventh embodiment since the ratio of the operation of the FC forklift to the fuel consumption varies depending on the operation, the past hydrogen-filled hydrogen amount can be obtained. Can be improved.
- the method described in each embodiment is a program (software means) that can be executed by a computer (computer), such as a magnetic disk (floppy (registered trademark) disk, hard disk, etc.), optical disk (CD-ROM, It can be stored in a recording medium such as a DVD, MO, etc., semiconductor memory (ROM, RAM, flash memory, etc.), or transmitted and distributed by a communication medium.
- the program stored on the medium side includes a setting program that configures software means (including not only the execution program but also a table and data structure) in the computer.
- a computer that implements this apparatus reads a program recorded on a recording medium, constructs software means by a setting program as the case may be, and executes the above-described processing by controlling the operation by this software means.
- the recording medium referred to in this specification is not limited to distribution, but includes a storage medium such as a magnetic disk or a semiconductor memory provided in a computer or a device connected via a network.
Landscapes
- Engineering & Computer Science (AREA)
- Life Sciences & Earth Sciences (AREA)
- Sustainable Energy (AREA)
- Sustainable Development (AREA)
- Chemical & Material Sciences (AREA)
- Organic Chemistry (AREA)
- Power Engineering (AREA)
- Mechanical Engineering (AREA)
- Transportation (AREA)
- Chemical Kinetics & Catalysis (AREA)
- Electrochemistry (AREA)
- General Chemical & Material Sciences (AREA)
- Manufacturing & Machinery (AREA)
- Combustion & Propulsion (AREA)
- Inorganic Chemistry (AREA)
- Hydrogen, Water And Hydrids (AREA)
- Electric Propulsion And Braking For Vehicles (AREA)
- Fuel Cell (AREA)
- Management, Administration, Business Operations System, And Electronic Commerce (AREA)
Abstract
実施形態における水素需要量予測システムは、燃料電池車両の過去の水素充填実績データを含む入力データを、1日の充填水素量の日量と、1日の充填水素量の総量で正規化したパタンとに分割して、日量とパタンのそれぞれの予測モデルを構築し、それぞれの予測モデルに対し因子で分類し、予測対象日の因子と、分類した予測モデルに基づく、予測対象日の日量とパタンの検索結果を掛け合わせて、充填水素量の絶対量としての予測結果を求める24時間分予測部と、予測結果にマージン分の充填水素量を加算して、燃料電池車両による水素貯蔵要求量を計算する水素貯蔵要求量計算部とを有する。
Description
本発明の実施形態は、水素需要量予測システム、水素需要量予測方法および水素需要量予測装置に関する。
クリーンな次世代エネルギーとして水素が注目されており、この水素を燃料とする燃料電池(FC:Fuel Cell)車両が増加すると予想されている。物流事業での倉庫等で使われるフォークリフトについても、これまで利用されてきたディーゼルエンジン方式やバッテリ方式のフォークリフトに代わり、FCフォークリフト(燃料電池式フォークリフト(以下、FC車両と称することがある))が増加してくると予想されている。
水素は、主に水素ステーションの水電解装置により製造される。水電解には電気が必要である。また、水電解装置の水素製造能力は予め決まっているため、FCフォークリフトが水素の充填のために水素ステーションに来るタイミングによっては、必要な水素が水素ステーションで用意できておらず、充填待ちを発生させてしまう可能性がある。
充填待ち発生を抑制する水素製造計画を立てるためには、FCフォークリフトが水素充填を行うタイミングと必要な充填水素量を予測(需要予測)するシステムが必要となる。
従来より、蓄圧器の充填実績データに基づいて需要予測を行うという提案はなされている。しかし、この提案では一般の燃料電池自動車(FCV:Fuel Cell Vehicle)を想定しており、また、具体的な需要予測の方法は明示されていない。
本発明が解決しようとする課題は、水素充填待ち発生を抑制することが可能な水素需要量予測システム、水素需要量予測方法および水素需要量予測装置を提供することである。
実施形態における水素需要量予測システムは、水素を製造する水素製造手段と、前記水素製造手段が製造した水素により発電する燃料電池で駆動する燃料電池車両の水素貯蔵要求量を求めることで、前記燃料電池車両の水素需要予測を行う需要予測手段と、前記水素貯蔵要求量に基づいて、前記水素製造手段を制御するための水素製造計画を管理する管理手段とを備え、前記需要予測手段は、前記燃料電池車両の過去の水素充填実績を含む入力データを前記管理手段から入力し、前記入力データを、需要予測対象日の1日の充填水素量の総量である日量と、前記1日の所定の充填タイミングにおける充填水素量を前記総量で除して正規化したパタンとに分割して、前記日量と前記パタンのそれぞれの水素需要予測モデルを構築し、前記日量の予測モデルは、前記日量に影響を与える因子により分類され、前記パタンの予測モデルは、前記パタンに影響を与える因子により分類され、前記需要予測対象日の因子と前記分類された予測モデルとに基づく、前記需要予測対象日の前記日量と前記パタンの検索結果を掛け合わせて、前記需要予測対象日における充填水素量の絶対量としての予測結果を求める24時間分予測部と、前記予測結果にマージン分の充填水素量を加算して、前記水素貯蔵要求量を計算し、前記計算した水素貯蔵要求量を前記管理手段に通知する水素貯蔵要求量計算部とを有する。
以下、実施形態について図面を用いて説明する。図1は、実施形態における水素需要量予測システムの構成例を示す図である。図1に示すように、実施形態における水素需要量予測システムは、水素ステーション20、WMS(Warehouse Management System)31、ASN(Advanced Shipping Notice)32、データベース(DB(Data Base))41,42、水素MMS(Mobility Management System)50を有する。データベース41,42は、例えば不揮発性メモリなどの記憶装置で構成される。
発電設備(PVや風力発電用設備)10は、PVや風力発電など、自然エネルギー由来の発電機能を有する設備である。
水素ステーション20は、水電解装置21、水素貯蔵容器22、圧縮機23、蓄圧器24、ディスペンサー(dispenser)25、水素EMS(Energy Management System)26を有する。
水素ステーション20は、水電解装置21、水素貯蔵容器22、圧縮機23、蓄圧器24、ディスペンサー(dispenser)25、水素EMS(Energy Management System)26を有する。
水電解装置21は、発電設備10による発電電力を利用して、水電解によって水素を製造する。水素貯蔵容器22は、水電解装置21により製造された水素を貯蔵する。この貯蔵された水素は、ビルや家庭といった需要家の燃料電池61に供給することができる。この燃料電池61は、発電した電気を需要家62に供給し、また、この発電によって発生した排熱を利用して得た温水を需要家62に供給する。圧縮機23は、FC車両に充填するために必要な圧力になるように、水素貯蔵容器22に貯蔵された水素を圧縮する。蓄圧器24は、圧縮機23による圧縮された水素を貯蔵する。ディスペンサー25は、圧縮機23により圧縮されて蓄圧器24に貯蔵された水素をFC車両に充填する。水素EMS26は、発電設備10による発電可能量予測や、FC車両用のディスペンサー25以外の水素貯蔵設備から水素が供給される需要家(例えば需要家62)の水素需要予測を行う。水素EMS26は、これらの予測結果と、水素MMS50から得られる、FC車両の水素貯蔵要求量とに基づいて、水素製造計画を立案し、この計画に基づいて、水電解装置21や圧縮機23を制御する。
なお、水電解装置21は、自然エネルギー由来ではない発電設備(例えば、火力発電設備)による発電電力や電力系統の電力を利用して、水電解によって水素を製造してもよい。その場合、水素EMS26は、発電設備10による発電可能量予測はしないので、FC車両用のディスペンサー25以外の水素貯蔵設備から水素が供給される需要家(例えば需要家62)の水素需要予測を行う。水素EMS26は、この予測結果と、水素MMS50から得られる、FC車両の水素貯蔵要求量とに基づいて、水素製造計画を立案し、この計画に基づいて、水電解装置21や圧縮機23を制御する。
WMS31とASN32は物流システムの一種である。WMS31は倉庫管理システムであり、商品の管理情報をデータベース41に格納する。ASN32は、商品が物流センタに届く前に納品先に送られる内容明細情報としての事前出荷通知をデータベース42に格納する。このデータベース42には、カレンダーデータ33や気象予測データ34も格納される。
水素MMS50は、WMS31、ASN32、気象予測データ34、ディスペンサー25から得られる情報を基に、FCフォークリフトの水素需要予測を行う。
(第1の実施形態)
次に、第1の実施形態について説明する。まず、水素MMS50の全体について説明する。図2は、第1の実施形態における水素需要量予測システムの水素MMSの機能構成例を示すブロック図である。図2に示すように、水素MMS50は、UI(User Interface)50a,50c,50e、区分・ディスペンサー設定部50b、データベース50d,50f、予測実績表示部50g、予測結果修正部50h、24時間分予測部50i、再予測部50j、水素貯蔵要求量計算部50k、通信部50mを有する。UI50a,50c,50eは、1つのUIであってもよい。データベース50d,50fは1つの記憶装置で構成されてもよい。
次に、第1の実施形態について説明する。まず、水素MMS50の全体について説明する。図2は、第1の実施形態における水素需要量予測システムの水素MMSの機能構成例を示すブロック図である。図2に示すように、水素MMS50は、UI(User Interface)50a,50c,50e、区分・ディスペンサー設定部50b、データベース50d,50f、予測実績表示部50g、予測結果修正部50h、24時間分予測部50i、再予測部50j、水素貯蔵要求量計算部50k、通信部50mを有する。UI50a,50c,50eは、1つのUIであってもよい。データベース50d,50fは1つの記憶装置で構成されてもよい。
図3は、第1の実施形態における水素需要量予測システムに関わる燃料電池車両が利用する倉庫のエリアの一例を示す図である。図4は、第1の実施形態における水素需要量予測システムの水素MMSのシーケンスの一例を示す図である。
水素MMS50では、(1)WMS31や、オペレータが操作したUI50cから入力してDB50dに蓄積された過去データと、(2)ASN32、カレンダーデータ33、気象予測データ34、オペレータが操作したUI50eから入力してDB50fに蓄積された予測対象日データとに基づいて、24時間分予測部50iが24時間分の水素需要予測を行ない(S1)、その予測結果に基づいて水素貯蔵要求量計算部50kが水素貯蔵要求量を計算して(S2)、通信部50mから水素EMS26に通知する。
上記の通知後に水素EMS26が水素製造計画を立案して(S3)、FCフォークリフトが実際に水素の充填を行なって完了したタイミングで(S4)、水素MMS50が再予測実施判断を行い(S5)、S1での予測結果に対する水素充填の実績値の誤差が大きい場合は再予測部50jによる再予測を行う(S6)。この場合、再予測結果に基づいて水素貯蔵要求量計算部50kが水素貯蔵要求量を計算して(S7)、通信部50mから水素EMS26に通知する。この通知後に水素EMS26が水素製造計画を再度立案する(S8)。
水素MMS50では、(1)WMS31や、オペレータが操作したUI50cから入力してDB50dに蓄積された過去データと、(2)ASN32、カレンダーデータ33、気象予測データ34、オペレータが操作したUI50eから入力してDB50fに蓄積された予測対象日データとに基づいて、24時間分予測部50iが24時間分の水素需要予測を行ない(S1)、その予測結果に基づいて水素貯蔵要求量計算部50kが水素貯蔵要求量を計算して(S2)、通信部50mから水素EMS26に通知する。
上記の通知後に水素EMS26が水素製造計画を立案して(S3)、FCフォークリフトが実際に水素の充填を行なって完了したタイミングで(S4)、水素MMS50が再予測実施判断を行い(S5)、S1での予測結果に対する水素充填の実績値の誤差が大きい場合は再予測部50jによる再予測を行う(S6)。この場合、再予測結果に基づいて水素貯蔵要求量計算部50kが水素貯蔵要求量を計算して(S7)、通信部50mから水素EMS26に通知する。この通知後に水素EMS26が水素製造計画を再度立案する(S8)。
24時間分予測部50iによる水素需要予測は、各区分に対して行われる。この区分とは、FCフォークリフトが担当する作業によって分けて、水素需要予測のための単位として定義する。
需要予測に関わる区分である、倉庫のエリアの区分が図3に示す区分であったとして、4台のFCフォークリフトがそれぞれのエリア専任であれば、これらのエリアが各区分となる。ディスペンサー25が複数台あって、それぞれが離れた場所に設置されている場合、区分・ディスペンサー設定部50bは、オペレータがUI50aを操作することで入力した区分設定情報、および、ディスペンサー25の設置場所を示す設定情報を得ると、これらの情報に基づいて、それぞれの区分を担当するFCフォークリフトが、どのディスペンサー25に水素を充填しに行くかを設定するための、区分とディスペンサーとの対応付けを行なう。
この対応付けを行うことで、水素MMS50は、水素需要予測に基づく水素貯蔵要求量を、ディスペンサー(近くに設置されたディスペンサーは同一とみなす)毎として、水素EMS26に通知することができる。
このように区分毎に水素需要予測を行うことで、それぞれの区分毎のFCフォークリフトの作業の特徴に合わせた水素需要予測が可能となり、需要予測精度を向上させることが出来る。
また、予測実績表示部50gは、予測した充填水素量(積算)と、水素貯蔵要求量と「過去実績データの充填水素量(積算)とをグラフにて画面表示する。
予測結果修正部50hは、予測実績表示部50gに表示された、予測した充填水素量(積算)と水素貯蔵要求量を、オペレータによるUI50eに対する任意の修正のための操作により修正して、新たな需要予測結果として水素貯蔵要求量計算部50kに出力する。
予測結果修正部50hは、予測実績表示部50gに表示された、予測した充填水素量(積算)と水素貯蔵要求量を、オペレータによるUI50eに対する任意の修正のための操作により修正して、新たな需要予測結果として水素貯蔵要求量計算部50kに出力する。
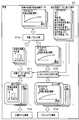
次に、24時間分予測について説明する。図5は、第1の実施形態における水素需要量予測システムの水素MMSによる24時間分予測の手順の一例を示す図である。
水素MMS50の24時間分予測部50iは、24時間分の水素需要予測のために、学習フェーズを実施し(S11)、次に予測フェーズを実施する(S12)。
次に、上記の学習フェーズについて説明する。図6は、第1の実施形態における水素需要量予測システムの水素MMSによる24時間分予測の学習フェーズの処理手順の一例を示す図である。図7は、第1の実施形態における水素需要量予測システムの水素MMSに関わる充填水素量の一例を示す図である。
水素MMS50の24時間分予測部50iは、24時間分の水素需要予測のために、図6や図7に示すような、FCフォークリフトに対する充填水素量の過去実績データと、この過去実績データに紐づく因子(属性)とを用いる。この因子は、例えば、需要予測対象日の年月日、季節、曜日、当日の予想天候、前日の天候、前々日の天候、当日の予想気温、前日の気温、前々日の気温である。
24時間分予測部50iは、充填水素量の過去実績データをDB50dから読み出し、このデータに対する日量・パタン分割を行う(S11a)。日量は充填水素量1日分の総量を示す。パタンは、この1日の中での1時間単位での充填水素量の変化を表すもので、1日の所定の充填タイミングにおける充填水素量を1日の充填水素量の総量で除して正規化したものである。
水素MMS50の24時間分予測部50iは、24時間分の水素需要予測のために、図6や図7に示すような、FCフォークリフトに対する充填水素量の過去実績データと、この過去実績データに紐づく因子(属性)とを用いる。この因子は、例えば、需要予測対象日の年月日、季節、曜日、当日の予想天候、前日の天候、前々日の天候、当日の予想気温、前日の気温、前々日の気温である。
24時間分予測部50iは、充填水素量の過去実績データをDB50dから読み出し、このデータに対する日量・パタン分割を行う(S11a)。日量は充填水素量1日分の総量を示す。パタンは、この1日の中での1時間単位での充填水素量の変化を表すもので、1日の所定の充填タイミングにおける充填水素量を1日の充填水素量の総量で除して正規化したものである。
24時間分予測部50iは、日量・パタン分割により得たパタンに対する因子分類を行い(S11b)、また、日量・パタン分割により得た日量データに対する因子分類を行う(S11c)。
24時間分予測部50iは、日量データに対する因子分類結果に基づいて、日量の水素需要予測モデルである日量モデルを構築し(S11d)、また、パタンに対する因子分類結果に基づいて、パタンの水素需要予測モデルであるパタンモデルを構築する(S11e)。上記の日量・パタン分割、各因子分類、日量モデル構築、およびパタンモデル構築の各処理については後述する。
また、WMS31とASN32が利用できる場合、FCフォークリフトが取り扱う商品の入荷や出荷に対する物流量とタイミングの情報を利用可能であるため、これらを過去実績データに紐づく因子とすることが出来る。24時間分予測部50iは、WMS31から過去の物流量とタイミングの情報を得て水素需要予測のための学習フェーズに利用し、ASN32から需要予測対象日の当日の物流量とタイミングの情報を得て水素需要予測のための学習フェーズに利用する。これにより需要予測精度を向上させることが出来る。
図7では1時間単位での充填水素量の積算値が示される。24時間分予測部50iは、ある1時間単位の時間の中での水素充填量の総量を求め(1時間単位での合計を求め)、この総量を、次の1時間単位の時間での最初の時刻での充填水素量とする。24時間分予測部50i、この充填水素量に基づいて、1日の最初の時刻からの充填水素量の積算値を求めることで、図6に示した過去実績データを求めることができる。上記の、次の1時間単位の最初の時刻は、1つ前の1時間単位の時間での時刻であっても良い。
次に、日量・パタン分割の処理について説明する。図8は、第1の実施形態における水素需要量予測システムの水素MMSによる24時間分予測の学習フェーズの日量・パタン分割の処理手順の一例を示す図である。図9は、第1の実施形態における水素需要量予測システムの水素MMSによる24時間分予測の学習フェーズの日量・パタン分割の一例を示す図である。
24時間分予測部50iは、充填水素量の過去実績データで示される、1日分の充填水素量の総量Mを、その日の日量とする(S11a1)。そして、24時間分予測部50iは、充填水素量の過去実績データで示される、1時間単位での各時刻での充填水素量を1/Mし、つまり1日の総量を1として按分を行い、その日のパタンとする(S11b)。これにより日量・パタン分割がなされる。
24時間分予測部50iは、充填水素量の過去実績データで示される、1日分の充填水素量の総量Mを、その日の日量とする(S11a1)。そして、24時間分予測部50iは、充填水素量の過去実績データで示される、1時間単位での各時刻での充填水素量を1/Mし、つまり1日の総量を1として按分を行い、その日のパタンとする(S11b)。これにより日量・パタン分割がなされる。
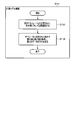
次に因子分類について説明する。図10は、第1の実施形態における水素需要量予測システムの水素MMSによる24時間分予測の学習フェーズの因子分類の処理手順の一例を示す図である。図11は第1の実施形態における水素需要量予測システムの水素MMSによる24時間分予測の学習フェーズの因子分類の一例を示す図である。図10、図11では、パタンに対する因子分類を例として説明するが、日量データに対する因子分類についても同様である。
24時間分予測部50iは、オペレータがUI50cを操作することでDB50dに格納された、過去実績データのパタンに影響を与える因子F{f1,f2,…fn}を読み出すことで、因子を準備する(S11b1)。
24時間分予測部50iは、変数i=1とし(S11b2)、i<Nであるか否かを判定する(S11b3)。i<Nであれば(S11b3のYES)、分析対象のデータ群を因子fiで分類する(S11b4)。24時間分予測部50iは、変数i=i+1とし(S11b5)、S11b3に戻る。また、i<Nでなければ(S11b3のNO)、因子分類が終了する。
24時間分予測部50iは、変数i=1とし(S11b2)、i<Nであるか否かを判定する(S11b3)。i<Nであれば(S11b3のYES)、分析対象のデータ群を因子fiで分類する(S11b4)。24時間分予測部50iは、変数i=i+1とし(S11b5)、S11b3に戻る。また、i<Nでなければ(S11b3のNO)、因子分類が終了する。
例えば、図11に示した例では、パタンに影響を与える因子F={f1(=月末か非月末か),f2(=夏かそれ以外か)}の場合、まずは、分類前のパタンが、f1(=月末か非月末か)で月末および非月末の2つに分類される。ここでは月末とは、例えばある月の28日から31日までの期間とし、非月末とは、この月末以外の期間とする。この分類結果に対し、f2(=夏かそれ以外か)}でさらに分類され、月末の夏、月末の春・秋・冬、非月末の夏、非月末の春・秋・冬の計4つに分類される。
次に、上記の日量モデル構築について説明する。図12は、第1の実施形態における水素需要量予測システムの水素MMSによる24時間分予測の学習フェーズの日量モデル構築の処理手順の一例を示す図である。図13は、第1の実施形態における水素需要量予測システムの水素MMSによる24時間分予測の学習フェーズの日量モデル構築の一例を示す図である。
24時間分予測部50iは、オペレータがUI50cを操作することでDB50dに格納された、過去実績データの日量に影響を与える因子F{f1,f2,…fn}で分類された各分類を取得する(S11d1)。24時間分予測部50iは、オペレータがUI50cを操作することでDB50dに格納された、指定された割合で、日量の最大値と最小値を除外して、残りのデータの平均値を求める(S11d2)。
例えば、図11に示すように月末の夏で分類された各日の充填水素量の日量が11,68,69,71,74,75,77,88,89,840の計10個であって、上記の指定された割合が0.2である場合、上記の除外する数は2個である。この場合、上記の10個のデータのうち最小値である11と最大値である840が除外され、残りの8個の日量の平均76.375が求められ、この値が日量モデルでの充填水素量の日量となる。
ここでは、指定された割合0.2に応じて最大値と最小値を除外したが、上記の割合を指定せず、ある分類の各日の充填水素量の日量からの除外を行わずに平均値を計算しても良い。
24時間分予測部50iは、オペレータがUI50cを操作することでDB50dに格納された、過去実績データの日量に影響を与える因子F{f1,f2,…fn}で分類された各分類を取得する(S11d1)。24時間分予測部50iは、オペレータがUI50cを操作することでDB50dに格納された、指定された割合で、日量の最大値と最小値を除外して、残りのデータの平均値を求める(S11d2)。
例えば、図11に示すように月末の夏で分類された各日の充填水素量の日量が11,68,69,71,74,75,77,88,89,840の計10個であって、上記の指定された割合が0.2である場合、上記の除外する数は2個である。この場合、上記の10個のデータのうち最小値である11と最大値である840が除外され、残りの8個の日量の平均76.375が求められ、この値が日量モデルでの充填水素量の日量となる。
ここでは、指定された割合0.2に応じて最大値と最小値を除外したが、上記の割合を指定せず、ある分類の各日の充填水素量の日量からの除外を行わずに平均値を計算しても良い。
次に、上記のパタンモデル構築について説明する。図14は、第1の実施形態における水素需要量予測システムの水素MMSによる24時間分予測の学習フェーズのパタンモデル構築の処理手順の一例を示す図である。
まず、24時間分予測部50iは、オペレータがUI50cを操作することでDB50dに格納された、過去実績データのパタンに影響を与える因子F{f1,f2,…fn}で分類された各分類を取得する(S11e1)。24時間分予測部50iは、ある分類の中の充填水素量(積算)パタンをP={P1,P2,…Pn}とする(S11e2)。
まず、24時間分予測部50iは、オペレータがUI50cを操作することでDB50dに格納された、過去実績データのパタンに影響を与える因子F{f1,f2,…fn}で分類された各分類を取得する(S11e1)。24時間分予測部50iは、ある分類の中の充填水素量(積算)パタンをP={P1,P2,…Pn}とする(S11e2)。
24時間分予測部50iは、変数t=0とし(S11e3)、t<25であるか否かを判定する(S11e4)。t<25であれば(S11e4のYES)、24時間分予測部50iは、P1~Pnでの時刻tでの充填水素量(積算)の平均値Pavg_tを求める(S11e5)。24時間分予測部50iは、変数t=t+1とし(S11e6)、S11e4に戻る。また、t<25でなければ(S11e4のNO)、パタンモデル構築が終了する。
上記では、日量に関わる因子に応じた分類と、パタンに関わる分類とを行い、これらの分対結果に基づいてモデル構築する処理を示したが、これらの因子分類とモデル構築とを、ニューラルネットワークを用いて纏めて実現してもよい。また、日量に対する因子分類と日量モデル構築を纏めた処理のみをニューラルネットワークを用いて実現しても良いし、パタンに対する因子分類とパタンモデル構築とを纏めた処理のみをニューラルネットワークを用いて実現しても良い。
次に、上記の予測フェーズについて説明する。図15は、第1の実施形態における水素需要量予測システムの水素MMSによる24時間分予測の予測フェーズの処理手順の一例を示す図である。
上記の学習フェーズの後、24時間分予測部50iは、日量モデルおよびパタンモデルの中から、需要予測対象日の因子に合うモデルを予測対象日における日量およびパタンとして検索する(S12a)。24時間分予測部50iは、検索した日量モデルの日量を、検索したパタンモデルに乗ずることで、需要予測対象日の充填水素量の絶対量としての需要予測結果を求める(S12b)。
上記の学習フェーズの後、24時間分予測部50iは、日量モデルおよびパタンモデルの中から、需要予測対象日の因子に合うモデルを予測対象日における日量およびパタンとして検索する(S12a)。24時間分予測部50iは、検索した日量モデルの日量を、検索したパタンモデルに乗ずることで、需要予測対象日の充填水素量の絶対量としての需要予測結果を求める(S12b)。
具体的には、このS12bでは、パタンモデルの全時刻の値に対し、充填水素量の総量に対応する日量が乗じられる。上記の検索したパタンモデルでの各時刻の値が0.2,0.3,0.5,…1(1日の総量)となっている場合、日量が100であれば、日量をパタンモデルに乗じたときの各時刻の値は20,30,50,…100となる。
次に、再予測について説明する。FCフォークリフトが実際に水素の充填を行って完了したタイミングで、水素需要予測結果と水素の充填実績との間に大きい誤差がある場合、例えば水素の充填実績の値が再予測判定閾値を超えた場合は、再予測部50jは、24時間分予測とは異なる方法にて需要予測をやり直す。
図16は、第1の実施形態における水素需要量予測システムの水素MMSによる再予測の処理手順の一例を示す図である。図17は、第1の実施形態における水素需要量予測システムの水素MMSによる再予測の一例を示す図である。
再予測部50jは、日量とパタンに分割する前の過去実績データ全ての中から、再予測を行うと判定された単位時刻毎の自乗誤差和を得て、過去実績データ全てのうち、自乗誤差和が最も小さいデータを選択し、これを再予測結果とする。
再予測部50jは、日量とパタンに分割する前の過去実績データ全ての中から、再予測を行うと判定された単位時刻毎の自乗誤差和を得て、過去実績データ全てのうち、自乗誤差和が最も小さいデータを選択し、これを再予測結果とする。
詳細には、再予測部50jは、日量とパタンに分割する前の過去実績データ全てをDB50dから取得する(S6a)。再予測部50jは、ある分類の中の充填水素量(積算)パタンをP={P1,P2,…Pn}とする(S6b)。
再予測部50jは、変数t=0とし(S6c)、t≦現時刻であるか否かを判定する(S6d)。この現時刻とは、水素の充填実績の値が再予測判定閾値を超えた時刻である。t≦現時刻であれば(S6dのYES)、再予測部50jは、t=0~現時刻での時刻tでの充填水素量(積算)の過去データとの誤差を求める(S6e)。再予測部50jは、変数t=t+1とし(S6f)、S6dに戻る。
また、t≦現時刻でなければ(S6dのNO)、ここまで求めた誤差の自乗和を求め(S6g)、過去実績データの全ての中で、誤差の自乗和が最小のデータ、つまり実際の前記充填水素量の変化に最も類似するデータを選択し、これを再予測結果とし(S6h)、再予測が終了する。
次に、上記の水素貯蔵要求量の計算について説明する。図18は、第1の実施形態における水素需要量予測システムの水素MMSによる水素貯蔵要求量計算の処理手順の一例を示す図である。
具体的には、水素貯蔵要求量計算部50kは、区分ごとの需要予測結果について、同一のディスペンサー25に対応する区分の需要予測結果を各時刻について加算する(S7b)。そして、水素貯蔵要求量計算部50kは、各予測結果に対してマージンを加算し、この結果を各ディスペンサー25に対する水素貯蔵要求量とする(S7c)。
具体的には、水素貯蔵要求量計算部50kは、区分ごとの需要予測結果について、同一のディスペンサー25に対応する区分の需要予測結果を各時刻について加算する(S7b)。そして、水素貯蔵要求量計算部50kは、各予測結果に対してマージンを加算し、この結果を各ディスペンサー25に対する水素貯蔵要求量とする(S7c)。
水素貯蔵要求量計算部50kは、S7cで求めた水素貯蔵要求量を通信部50mを介して水素EMS26に通知する(S7e)。
上記のS7cで説明したマージンは以下の式(1)で求めることができる。
マージン=再予測判定差分×α+β …式(1)
再予測判定差分:再予測を実施するか否かの判定のための、充填実績と需要予測との差分の閾値
α≧1.0
β:水素ステーション20による水素製造能力と式(1)の再予測判定差分との差異を考慮した係数
再予測判定差分の閾値、係数α,βは、オペレータがUI50eを操作して設定することができる。
再予測判定差分:再予測を実施するか否かの判定のための、充填実績と需要予測との差分の閾値
α≧1.0
β:水素ステーション20による水素製造能力と式(1)の再予測判定差分との差異を考慮した係数
再予測判定差分の閾値、係数α,βは、オペレータがUI50eを操作して設定することができる。
また、図19は、第1の実施形態における水素需要量予測システムの水素MMSによる水素貯蔵要求量計算の処理手順の別の例を示す図である。図18とは、水素貯蔵要求量計算の処理は、水素EMS26から充填実績が通知されたときである場合と、そうでない場合とで分かれる点で異なる。
具体的には、充填実績が通知されたときでない場合は(S7aのNO)、水素貯蔵要求量計算部50kは、区分ごとの需要予測結果について、同一のディスペンサー25に対応する区分の需要予測結果を各時刻について加算する(S7b)。そして、水素貯蔵要求量計算部50kは、各予測結果に対してマージンを加算し、この結果を各ディスペンサー25に対する水素貯蔵要求量とする(S7c)。
一方、充填実績が通知されたときである場合は(S7aのYES)、水素貯蔵要求量計算部50kは、この充填が実施されたディスペンサー25の水素貯蔵要求量の次の単位時刻の値から充填量分を減算した水素貯蔵要求量を求める(S7d)。この減算前の水素貯蔵要求量は前回の予測で既に求められているとする。
水素貯蔵要求量計算部50kは、S7cまたはS7dで求めた水素貯蔵要求量を通信部50mを介して水素EMS26に通知する(S7e)。
上記のS7cで説明したマージンは式(1)で求めることができる。
以上のように、第1の実施形態における水素需要量予測システムでは、日量の予測モデルとパタンの予測モデルとを、設定された区分毎に構築することを可能とし、かつ、設定された区分とディスペンサーとの対応とを考慮して、ディスペンサー単位で水素貯蔵要求量を算出することを可能とする。これにより、FCフォークリフトを用いた物流作業(入荷、出荷など)毎の作業量の違いを反映した水素需要予測を可能とし、需要予測精度を向上させることが期待できる。
また、日量とパタンとのそれぞれに分けて予測モデルを構築して予測することで、日量に影響を与える因子(発生する物流作業量が大きな要因と考えられる)と、パタン(1日の中で充填を行うタイミング)に与える因子(物流作業量に加え、作業員の心理的要因も関連すると考えられる)とが異なっていることを考慮した水素需要予測を可能とし、需要予測精度を向上させることが期待できる。
また、初めて導入するFCフォークリフトについて過去データが存在しない場合でも、過去の他方式のフォークリフトでの作業履歴と作業ルールに基づいて、作業員が経験的に充填量と充填タイミングを推測できた場合に、この推測結果を過去データとして利用することを可能とし、適用可能性を向上させることが期待できる。
(第2の実施形態)
次に、第2の実施形態について説明する。なお、以下の各実施形態における、第1の実施形態と同様の説明は省略する。
第2の実施形態では、24時間分予測部50iは、第1の実施形態で説明した各因子の中のパタンに対して各時刻の分散を計算することで分布モデルを構築する。
次に、第2の実施形態について説明する。なお、以下の各実施形態における、第1の実施形態と同様の説明は省略する。
第2の実施形態では、24時間分予測部50iは、第1の実施形態で説明した各因子の中のパタンに対して各時刻の分散を計算することで分布モデルを構築する。
次に、第2の実施形態での学習フェーズについて説明する。図20は、第2の実施形態における水素需要量予測システムの水素MMSによる24時間分予測の学習フェーズの処理手順の一例を示す図である。
この学習フェーズでは、第1の実施形態で説明したS11aからS11eの処理がなされ、24時間分予測部50iは、S11bでの、パタンに対する因子分類結果に基づいて分布モデルを構築する(S11f)。
この学習フェーズでは、第1の実施形態で説明したS11aからS11eの処理がなされ、24時間分予測部50iは、S11bでの、パタンに対する因子分類結果に基づいて分布モデルを構築する(S11f)。
次に、この分布モデルの構築の詳細について説明する。図21は、第2の実施形態における水素需要量予測システムの水素MMSによる分布モデル構築の処理手順の一例を示す図である。
24時間分予測部50iは、オペレータがUI50cを操作することでDB50dに格納された、過去実績データのパタンに影響を与える因子F{f1,f2,…fn}で分類された各分類を取得する(S11f1)。24時間分予測部50iは、同じ因子分類の複数のパタンについて、各時刻での分布(各時刻での分散)を求め、これを分布モデルとする(S11f2)。
24時間分予測部50iは、オペレータがUI50cを操作することでDB50dに格納された、過去実績データのパタンに影響を与える因子F{f1,f2,…fn}で分類された各分類を取得する(S11f1)。24時間分予測部50iは、同じ因子分類の複数のパタンについて、各時刻での分布(各時刻での分散)を求め、これを分布モデルとする(S11f2)。
次に、第2の実施形態での予測フェーズについて説明する。図22は、第2の実施形態における水素需要量予測システムの水素MMSによる分布モデル構築時の24時間分予測の予測フェーズの処理手順の一例を示す図である。
上記の学習フェーズの後、第1の実施形態で説明したS12aおよびS12b(図15参照)の処理がなされ、24時間分予測部50iは、分布モデルの中から、需要予測対象日の因子に合うモデルを検索し、対象日の分布とする(S12c)。
上記の学習フェーズの後、第1の実施形態で説明したS12aおよびS12b(図15参照)の処理がなされ、24時間分予測部50iは、分布モデルの中から、需要予測対象日の因子に合うモデルを検索し、対象日の分布とする(S12c)。
次に、第2の実施形態での再予測について説明する。第1の実施形態では再予測実施の判定は、再予測判定閾値を超えた場合としたが、第2の実施形態では、再予測実施の判定は、充填の実績値が上記のS12cで求めた分布モデルのN%の信頼区間に入っているか否かとする。Nは、オペレータによってあらかじめ設定される。
このように、第2の実施形態では、分布モデルを構築して需要予測の再予測に利用することで、第1の実施形態のように再予測の判定を一意に決めるよりも、より現実に合わせて再予測の判定を行うことが出来る。
(第3の実施形態)
次に、第3の実施形態について説明する。図6に示すように、第1の実施形態では、24時間分予測部50iは、充填水素量の過去実績データを日量とパタンとに分割した後に因子分類を行った。これに対し、第3の実施形態では、24時間分予測部50iは、充填水素量の過去実績データに対する因子分類を行った後に、この分類結果を日量とパタンに分割して、日量モデル構築とパタンモデル構築を行なう。図23は、第3の実施形態における水素需要量予測システムの水素MMSによる24時間分予測の学習フェーズの処理手順の一例を示す図である。
24時間分予測部50iは、充填水素量の過去実績データをDB50dから読み出し、このデータに対する因子分類を行う(S11g)。24時間分予測部50iは、因子分類結果に対する日量・パタン分割を行う(S11a)。24時間分予測部50iは、因子分類結果のうちの日量データに基づいて、日量モデルを構築し、(S11d)、また、因子分類結果のうちのパタンデータに基づいてパタンモデルを構築する(S11e)。
次に、第3の実施形態について説明する。図6に示すように、第1の実施形態では、24時間分予測部50iは、充填水素量の過去実績データを日量とパタンとに分割した後に因子分類を行った。これに対し、第3の実施形態では、24時間分予測部50iは、充填水素量の過去実績データに対する因子分類を行った後に、この分類結果を日量とパタンに分割して、日量モデル構築とパタンモデル構築を行なう。図23は、第3の実施形態における水素需要量予測システムの水素MMSによる24時間分予測の学習フェーズの処理手順の一例を示す図である。
24時間分予測部50iは、充填水素量の過去実績データをDB50dから読み出し、このデータに対する因子分類を行う(S11g)。24時間分予測部50iは、因子分類結果に対する日量・パタン分割を行う(S11a)。24時間分予測部50iは、因子分類結果のうちの日量データに基づいて、日量モデルを構築し、(S11d)、また、因子分類結果のうちのパタンデータに基づいてパタンモデルを構築する(S11e)。
第3の実施形態における因子分類の詳細は図10に示した処理と同様である。ただし、S11b1では、24時間分予測部50iは、オペレータがUI50cを操作することでDB50dに格納された、過去実績データに影響を与える因子を読み出す。
第3の実施形態における日量・パタン分割の詳細は、各因子分類のそれぞれに対して図8に示した処理を行うことに相当する。第3の実施形態における日量モデル構築の詳細は、各因子分類のそれぞれに対して図12に示した処理を行うことに相当する。第3の実施形態におけるパタンモデル構築の詳細は、各因子分類のそれぞれに対して図14に示した処理を行うことに相当する。
以上のように、第3の実施形態では、因子分類を日量・パタン分割より先に行うことで、日量とパタンとの一貫性を保つことができ、保守性を高めることができる。また、第1の実施形態では、日量およびパタンのそれぞれに対して因子分類を行ったが、第3の実施形態では、1つのデータ(過去実績データ)に対する因子分類を行えるので、オペレータによる入力作業量を削減できる。
(第4の実施形態)
次に、第4の実施形態について説明する。第4の実施形態では、24時間分予測部50iは、第3の実施形態で説明した、各因子の中のパタンに対して第2の実施形態で説明した分布モデルを構築する。
次に、第4の実施形態について説明する。第4の実施形態では、24時間分予測部50iは、第3の実施形態で説明した、各因子の中のパタンに対して第2の実施形態で説明した分布モデルを構築する。
次に、第4の実施形態での学習フェーズについて説明する。図24は、第4の実施形態における水素需要量予測システムの水素MMSによる24時間分予測の学習フェーズの処理手順の一例を示す図である。
この学習フェーズでは、第3の実施形態で説明したS11g、S11a、S11d、S11eの処理がなされ、24時間分予測部50iは、因子分類結果がS11aで分割されたパタンに基づいて分布モデルを構築する(S11f)。
第4の実施形態における因子分類日量・パタン分割、日量モデル構築、パタンモデル構築の詳細は第3の実施形態と同様であり、第4の実施形態における分布モデル構築の詳細は図21に示した処理と同様であり、第4の実施形態における予測フェーズの処理フローは図22に示した処理と同様であり、第4に実施形態における再予測の詳細は、第2の実施形態で説明した処理と同様である。
この学習フェーズでは、第3の実施形態で説明したS11g、S11a、S11d、S11eの処理がなされ、24時間分予測部50iは、因子分類結果がS11aで分割されたパタンに基づいて分布モデルを構築する(S11f)。
第4の実施形態における因子分類日量・パタン分割、日量モデル構築、パタンモデル構築の詳細は第3の実施形態と同様であり、第4の実施形態における分布モデル構築の詳細は図21に示した処理と同様であり、第4の実施形態における予測フェーズの処理フローは図22に示した処理と同様であり、第4に実施形態における再予測の詳細は、第2の実施形態で説明した処理と同様である。
このように、第4の実施形態では、第2の実施形態と第3の実施形態の特徴をあわせもつことができる。
(第5の実施形態)
次に、第5の実施形態について説明する。図14に示すように、第1の実施形態では、24時間分予測部50iは、1時間ごとの水素需要予測のパタンモデル構築を行った。これに対し、第5の実施形態では、24時間分予測部50iは、需要予測対象日を2時間以上の時間帯を含む所定の複数の時間帯に分類し、これらの時間帯ごとのパタンモデル構築を行う。
次に、第5の実施形態について説明する。図14に示すように、第1の実施形態では、24時間分予測部50iは、1時間ごとの水素需要予測のパタンモデル構築を行った。これに対し、第5の実施形態では、24時間分予測部50iは、需要予測対象日を2時間以上の時間帯を含む所定の複数の時間帯に分類し、これらの時間帯ごとのパタンモデル構築を行う。
これらの区分された時間帯に属する時間の長さは、必ずしも同じである必要は無く、例えば、深夜(0‐4時)、早朝(5‐6時)、朝(7‐8時)、始業後(9‐10)、昼前(11)、昼休み(12)、昼休み直後(1‐2)、昼(3‐4)、定時(5)、定時後(6‐7)、夜(8‐10)、深夜前(11)、などの時間帯に分類してもよい。
このように、第5の実施形態では、所定の複数の時間帯に分類し、これらの時間帯ごとの水素需要予測のパタンモデル構築を行うことで、各時間帯の特徴を利用した需要予測を可能とし、需要予測精度の向上が期待できる。
(第6の実施形態)
次に、第6の実施形態について説明する。図16に示すように、第1の実施形態では、再予測部50jは、過去実績データの全てを利用して、需要予測結果と水素充填実績との誤差の自乗和が最小であるデータ、つまり現在の実績と近いデータを選択して、再予測結果としていた。
次に、第6の実施形態について説明する。図16に示すように、第1の実施形態では、再予測部50jは、過去実績データの全てを利用して、需要予測結果と水素充填実績との誤差の自乗和が最小であるデータ、つまり現在の実績と近いデータを選択して、再予測結果としていた。
これに対し、第6の実施形態では、再予測部50jは、再予測の他の方法として、過去実績データのうちの、過去数時間または過去数日分の時系列変化を基に、時系列分析による再予測を行なう。時系列分析手法としては、指数平滑モデル、自己回帰和分移動平均(ARIMA:Auto Regressive Integrated Moving Average)モデル、ウィンターズモデルなどが挙げられるが、いずれの方法でもよい。
時系列分析による再予測を行う場合、再予測部50jは、ある時刻での充填水素量の積算値を、この時刻から前の所定の時刻からの充填水素量の変化量(瞬時値)に変換しておき、この変換したデータを再予測に用いる。
時系列分析による再予測を行う場合、再予測部50jは、ある時刻での充填水素量の積算値を、この時刻から前の所定の時刻からの充填水素量の変化量(瞬時値)に変換しておき、この変換したデータを再予測に用いる。
これにより、第6の実施形態では、通常の需要予測については、因子分類により行い、再予測については時系列分析により行うので、それぞれで特徴の異なる需要予測を実施することが出来るので、需要予測の多様性を高めることが出来、需要予測精度の向上が期待出来る。
(第7の実施形態)
次に、第7の実施形態について説明する。図14に示すように、第1の実施形態では、24時間分予測部50iは、各時刻での充填水素量(積算)の平均値を求めることでパタンモデルを構築していた。これに対し、第7の実施形態では、24時間分予測部50iは、パタンモデルの構築時に、あるグループとあるパタンとの間の各時刻での差分と、この差分の全時刻での合計値により計算された類似度に基づき、パタンをグループ分けし、所属するパタン数が最も多いグループの中のパタンにおける各時刻に対して移動平均を計算し、これに基づいて、需要予測に利用するための、代表するパタンモデルを生成することでパタンモデルを構築する。
次に、第7の実施形態について説明する。図14に示すように、第1の実施形態では、24時間分予測部50iは、各時刻での充填水素量(積算)の平均値を求めることでパタンモデルを構築していた。これに対し、第7の実施形態では、24時間分予測部50iは、パタンモデルの構築時に、あるグループとあるパタンとの間の各時刻での差分と、この差分の全時刻での合計値により計算された類似度に基づき、パタンをグループ分けし、所属するパタン数が最も多いグループの中のパタンにおける各時刻に対して移動平均を計算し、これに基づいて、需要予測に利用するための、代表するパタンモデルを生成することでパタンモデルを構築する。
図25、図26、図27は、第7の実施形態における水素需要量予測システムの水素MMSによる24時間分予測の学習フェーズのパタンモデル構築の処理手順の一例を示す図である。
まず、24時間分予測部50iは、オペレータがUI50cを操作することでDB50dに格納された、過去実績データのパタンに影響を与える因子F{f1,f2,…fn}で分類された各分類を取得する(S11e1)。24時間分予測部50iは、ある分類の中の充填水素量(積算)パタンをP={P1,P2,…Pn}とする(S11e2)。
まず、24時間分予測部50iは、オペレータがUI50cを操作することでDB50dに格納された、過去実績データのパタンに影響を与える因子F{f1,f2,…fn}で分類された各分類を取得する(S11e1)。24時間分予測部50iは、ある分類の中の充填水素量(積算)パタンをP={P1,P2,…Pn}とする(S11e2)。
24時間分予測部50iは、グループの集合Gr={g0}とし、g0={P0}とする(S11e11)。24時間分予測部50iは、i=0とする(S11e12)。
24時間分予測部50iは、i<Nであるか否かを判定する(S11e13)。i<Nであれば(S11e13のYES)、24時間分予測部50iは、j=0とする(S11e14)。
24時間分予測部50iは、i<Nであるか否かを判定する(S11e13)。i<Nであれば(S11e13のYES)、24時間分予測部50iは、j=0とする(S11e14)。
24時間分予測部50iは、j<グループの集合Grの要素数Lであるか否かを判定する(S11e15)。j<グループの集合Grの要素数Lであれば(S11e15のYES)、24時間分予測部50iは、SUM_DIFF=0とし、MAX_DIFF=0とする(S11e16)。DIFFについては後述する。
24時間分予測部50iは、ある1つのグループと、ある1つのパタンとの間の誤差を算出する(S11e17)。この誤差の算出の詳細は後述する。
24時間分予測部50iは、ある1つのグループと、ある1つのパタンとの間の誤差を算出する(S11e17)。この誤差の算出の詳細は後述する。
SUM_DIFF<閾値_SUM_DIFF、かつMAX_DIFF<閾値_MAX_DIFFの場合、24時間分予測部50iは、パタンPiを、グループgjに所属させる(S11e18)。
24時間分予測部50iは、j=j+1とし(S11e19)、S11e15に戻る。また、j<グループの集合Grの要素数Lでなければ(S11e15のNO)、つまりパタンPiがどのグループにも所属させられていなかったら、24時間分予測部50iは、パタンPiのみが所属する新しいグループを作り、グループの集合Grに登録する(S11e20)。
24時間分予測部50iは、i=i+1とし(S11e21)、S11e13に戻る。24時間分予測部50iは、i<Nでなくなるまで(S11e13のNO)、つまり因子F={F0,F1,・・・}で分類された、全分類の中のパタンに対して実施されるまで上記のS11e13~S11e21を実施する。i<Nでないことを確認すると(S11e22)、24時間分予測部50iは、代表グループから代表パタンモデルを生成する(S11e23)。この代表パタンモデルの生成については後述する。
次に、上記のS11e17に対応する、ある1つのグループと、ある1つのパタンとの誤差の算出について、図26を参照して説明する。
24時間分予測部50iは、グループの集合Grの中から、グループgjを選択する(S11e17-1)。
24時間分予測部50iは、グループの集合Grの中から、グループgjを選択する(S11e17-1)。
24時間分予測部50iは、t=0とする(S11e17-2)。
24時間分予測部50iは、t<25であるか否かを判定する(S11e17-3)。t<25であれば(S11e17-3のYES)、24時間分予測部50iは、グループgj内に所属するパタン群について、時刻tでの値の平均値AVGを求める(S11e17-4)。
24時間分予測部50iは、t<25であるか否かを判定する(S11e17-3)。t<25であれば(S11e17-3のYES)、24時間分予測部50iは、グループgj内に所属するパタン群について、時刻tでの値の平均値AVGを求める(S11e17-4)。
24時間分予測部50iは、パタンPiの時刻tでの値と、平均値AVGとの二乗誤差DIFFを求める(S11e17-6)。
24時間分予測部50iは、SUM_DIFF+=DIFFを求める(S11e17-6)。この「+=」は加算代入演算子である。
24時間分予測部50iは、SUM_DIFF+=DIFFを求める(S11e17-6)。この「+=」は加算代入演算子である。
MAX_DIFF<DIFFであれば、24時間分予測部50iは、MAX_DIFF=DIFFとする(S11e17-7)。
24時間分予測部50iは、t=t+1とし(S11e17-8)、S11e17-3に戻る。t<25でなければ(S11e17-3のNO)、ある1つのグループと、ある1つのパタンとの、誤差の算出が終了する。
次に、上記のS11e23に対応する、代表グループからの代表パタンモデルの生成について図27を参照して説明する。
24時間分予測部50iは、グループ集合Grの中で、最も所属するパタン数の多いグループgmaxを選択し、これを代表グループとする(S11e23-1)。
24時間分予測部50iは、グループ集合Grの中で、最も所属するパタン数の多いグループgmaxを選択し、これを代表グループとする(S11e23-1)。
24時間分予測部50iは、グループgmaxに所属するパタンを、P={P0,P1,…PM-1}とする(S11e23-2)。
24時間分予測部50iは、代表パタンをPrとし(S11e23-3)、t=0とする(S11e23-4)。
24時間分予測部50iは、代表パタンをPrとし(S11e23-3)、t=0とする(S11e23-4)。
24時間分予測部50iは、t<25であるか否かを判定する(S11e23-5)。t<25であれば(S11e23-5のYES)、24時間分予測部50iは、V=0とし(S11e23-6)、i=0とする(S11e23-7)。
24時間分予測部50iは、i<Mであるか否かを判定する(S11e23-8)。
i<Mであれば(S11e23-8のYES)、24時間分予測部50iは、各時刻に対する移動平均として、V=w1*V+w2*時刻tでのPiの値を求める(S11e23-9)。w1およびw2は重み付けの係数であり、任意に設定できる。
i<Mであれば(S11e23-8のYES)、24時間分予測部50iは、各時刻に対する移動平均として、V=w1*V+w2*時刻tでのPiの値を求める(S11e23-9)。w1およびw2は重み付けの係数であり、任意に設定できる。
24時間分予測部50iは、i=i+1とし(S11e23-10)、S11e23-8に戻る。i<Mでなければ(S11e23-8のNO)、24時間分予測部50iは、代表パタンPrの時刻tでの値をVとし(S11e23-11)、t=t+1とし(S11e23-12)、S11e23-5に戻る。t<25でなければ(S11e23-5のNO)、代表グループからの代表パタンモデルの生成が終了する。
以上のように、第7の実施形態では、パタン数が最大のグループ中のパタンに対して、各時刻に対する移動平均を計算することにより代表パタンを求めることで、過去から現在に近づくにつれて重要視するようなパタンモデルを構築できるので、需要予測精度の向上が期待できる。
(第8の実施形態)
次に、第8の実施形態について説明する。図14に示すように、第1の実施形態では、24時間分予測部50iは、各時刻での充填水素量(積算)の平均値を求めることでパタンモデルを構築していた。また、第7の実施形態では、24時間分予測部50iは、類似するパタンをグループ分けし、所属するパタン数が最も多いグループの中のパタンにおける各時刻に対して移動平均を求めて、これに基づいて、代表するパタンモデルを生成することでパタンモデルを構築していた。
次に、第8の実施形態について説明する。図14に示すように、第1の実施形態では、24時間分予測部50iは、各時刻での充填水素量(積算)の平均値を求めることでパタンモデルを構築していた。また、第7の実施形態では、24時間分予測部50iは、類似するパタンをグループ分けし、所属するパタン数が最も多いグループの中のパタンにおける各時刻に対して移動平均を求めて、これに基づいて、代表するパタンモデルを生成することでパタンモデルを構築していた。
これに対し、第8の実施形態では、24時間分予測部50iは、因子で分類された各分類の中の充填水素量(積算)のパタン群を、相関係数を使ってグループ分類し、グループ内の所属パタンが最も多いグループを選択し、各時刻に対して平均値を求める事で、代表パタンを生成する。図28、図29、図30は、第8の実施形態における水素需要量予測システムの水素MMSによる24時間分予測の学習フェーズのパタンモデル構築の処理手順の一例を示す図である。
まず、24時間分予測部50iは、第7の実施形態で説明したS11e1~S11e15までの処理を行なう。
まず、24時間分予測部50iは、第7の実施形態で説明したS11e1~S11e15までの処理を行なう。
j<グループの集合Grの要素数Lであれば(S11e15のYES)、24時間分予測部50iは、グループの集合Grの中から、グループgjを選択する(S11e31)。
24時間分予測部50iは、あるグループから代表パタンモデルを生成する(S11e32)。この生成については後述する。
24時間分予測部50iは、グループgjの代表パタンPjとパタンPiとの相関係数Cjiを求める(S11e33)。
この相関係数Cjiは、以下の式(2),(3),(4)で求めることができる。
この相関係数Cjiは、以下の式(2),(3),(4)で求めることができる。
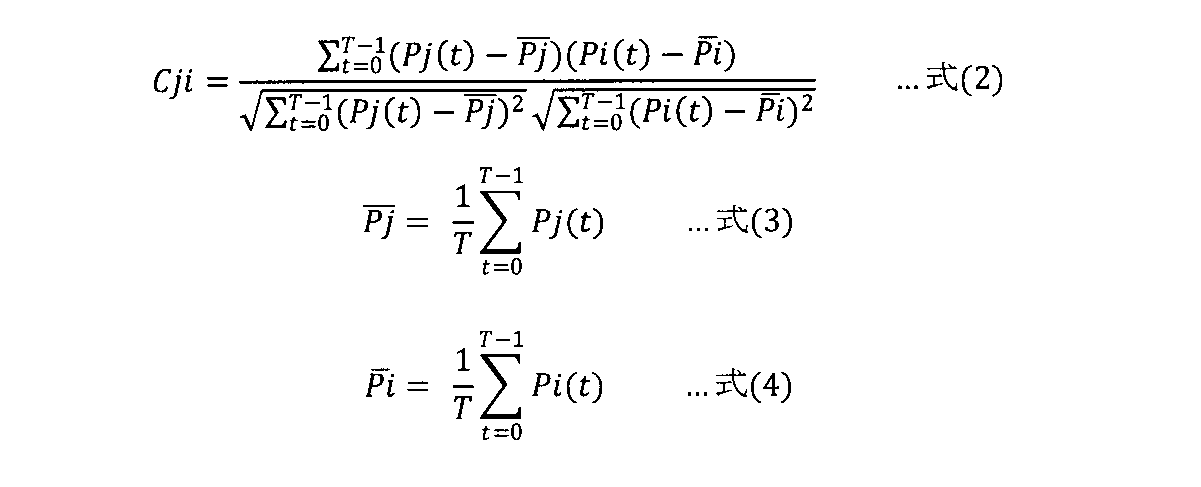
式(2)などのPjは、パタンPjの時刻tでの値である。式(2)などのPiは、パタンPiの時刻tでの値である。また、式(3),(4)のT=25である。
24時間分予測部50iは、j=j+1とし(S11e34)、S11e15に戻る。
24時間分予測部50iは、j=j+1とし(S11e34)、S11e15に戻る。
また、j<グループの集合Grの要素数Lでなければ(S11e15のNO)、24時間分予測部50iは、相関係数C0i~CLiの中で最大、かつ、閾値以上となる条件を満たすグループにパタンPiを登録する。ここで、条件を満たすグループがない場合は、24時間分予測部50iは、パタンPiのみが所属する新しいグループを作り、グループの集合Grに登録する(S11e34)。
24時間分予測部50iは、i=i+1とし(S11e21)、S11e13に戻る。
24時間分予測部50iは、i<Nでなくなるまで(S11e13のNO)、つまり因子F={F0,F1,・・・}で分類された、全分類の中のパタンに対して実施されるまで上記のS11e13~S11e21を実施する。i<Nでないことを確認すると(S11e22)、24時間分予測部50iは、代表グループから代表パタンモデルを生成する(S11e23)。この生成については後述する。
次に、第8の実施形態における上記のS11e32に対応する、あるグループからの代表パタンモデルの生成について図29を参照して説明する。
24時間分予測部50iは、グループgjに所属するパタンを、P={P0,P1,…PM-1}とする(S11e32-1)。
24時間分予測部50iは、代表パタンをPiとし(S11e32-2)、t=0とする(S11e32-3)。
24時間分予測部50iは、グループgjに所属するパタンを、P={P0,P1,…PM-1}とする(S11e32-1)。
24時間分予測部50iは、代表パタンをPiとし(S11e32-2)、t=0とする(S11e32-3)。
24時間分予測部50iは、t<25であるか否かを判定する(S11e32-4)。t<25であれば(S11e32-4のYES)、24時間分予測部50iは、P0~PM-1の時刻tの平均値を代表パタンPiの時刻tでの値とする(S11e32-5)。
24時間分予測部50iは、t=t+1とし(S11e32-6)、S11e32-4に戻る。t<25でなければ(S11e32-4のNO)、あるグループからの代表パタンモデルの生成が終了する。
次に、第8の実施形態における上記のS11e23に対応する、代表グループから代表パタンモデルを生成することについて図30を参照して説明する。
まず、24時間分予測部50iは、第7の実施形態で説明したS11e23-1~S11e23-5の処理を行う。
まず、24時間分予測部50iは、第7の実施形態で説明したS11e23-1~S11e23-5の処理を行う。
t<25であれば(S11e23-5のYES)、24時間分予測部50iは、P0~PM-1の時刻tの平均値を代表パタンPrの時刻tでの値とする(S11e23-21)。
24時間分予測部50iは、t=t+1とし(S11e23-22)、S11e23-5に戻る。t<25でなければ(S11e23-5のNO)、代表グループからの代表パタンモデルの生成が終了する。
以上のように、第8の実施形態では、全体の相関を見てグループを分類することで、部分的な時刻について、たまたま異常である一方で全体の時刻としては類似していたパタンを同一グループに分類することができるので、需要予測精度の向上が期待できる。
(第9の実施形態)
次に、第9の実施形態について説明する。第1の実施形態では、水素貯蔵要求量計算部50kは、式(1)の再予測判定差分と、係数αおよびβとを用いて充填水素量のマージンを求めていた。これに対し、第9の実施形態では、水素貯蔵要求量計算部50kは、確率分布を用いてマージンを求める。
次に、第9の実施形態について説明する。第1の実施形態では、水素貯蔵要求量計算部50kは、式(1)の再予測判定差分と、係数αおよびβとを用いて充填水素量のマージンを求めていた。これに対し、第9の実施形態では、水素貯蔵要求量計算部50kは、確率分布を用いてマージンを求める。
図31は、第9の実施形態における水素需要量予測システムの水素MMSによる確率分布を利用したマージン設定の一例を示す図である。
まず、オペレータは、UI50gなどを用いて、所定の目標サービス率を設定する。このサービス率は、FCフォークリフトが必要とする水素量が充填できる確率を意味する。サービス率が100%であれば、100%の確率で充填できる。ただし、このサービス率は、あくまでも過去データに基づく確率である。
まず、オペレータは、UI50gなどを用いて、所定の目標サービス率を設定する。このサービス率は、FCフォークリフトが必要とする水素量が充填できる確率を意味する。サービス率が100%であれば、100%の確率で充填できる。ただし、このサービス率は、あくまでも過去データに基づく確率である。
水素貯蔵要求量計算部50kは、予測された充填水素量(積算)の時間特性の分散を各時刻について求めることで充填水素量の確率分布を求める。水素貯蔵要求量計算部50kは、この分布における、設定されたサービス率に相当する信頼区間の位置を各時刻について選択し、この選択した位置を各時刻で繋げた充填水素量(積算)を、マージンを加えた充填水素量とみなす。例えば、サービス率が95%であれば、各時刻の分散の95%の信頼区間の部分が選択される。
水素貯蔵要求量計算部50kは、このマージンを上記の予測された充填水素量(積算)に加えた、図31中の点線で示されるような特性曲線に対応する充填水素量を、マージンを加えた水素貯蔵要求量として求める。
このように、第9の実施形態では、確率分布を使って充填水素量のマージンを求めることで、マージンを計算するための複数の係数をオペレータが設定する必要が無くなり、手間が削減される。また、充填水素量の実際の値を用いてマージンが決められるため、より利用価値の高い水素貯蔵要求量を得ることが出来る。
(第10の実施形態)
次に、第10の実施形態について説明する。この第10の実施形態は、水素EMS26と水素MMS50の物理的な配置方法や通信機能について説明するものである。
次に、第10の実施形態について説明する。この第10の実施形態は、水素EMS26と水素MMS50の物理的な配置方法や通信機能について説明するものである。
図32は、第10の実施形態における水素需要量予測システムの水素MMSと水素EMSとの物理的な配置方法と通信機能について説明する図である。図32(a)に示すように、従来の構成では、水素EMSに相当する運転パタン決定プログラムと、水素MMSに相当する負荷予測プログラムとが、同じ機器で動作する同じプログラムで実現されるシステム構成になっている。
これに対し、第10の実施形態では、図32(b)に示すように、DB(データベース)を介して水素MMS50と水素EMS26とが情報をやり取りする構成や、図32(c)に示すように、共有ファイルを介して水素MMS50と水素EMS26とが情報をやり取りする構成や、図32(d)に示すように、水素MMS50と水素EMS26とが直接通信する構成とする。
また、水素MMS50と水素EMS26とは、同じプログラム内、または同じ実行形式ファイルで実現されても良い。また、水素MMS50と水素EMS26とは、同じ機器上で実行される別のプログラム内または別の実行形式ファイル内で実現されても良い。
さらに、水素MMS50と水素EMS26とは、異なる機器上で実行される別のプログラム内、または別の実行形式ファイル内で実現されてもよい。
さらに、水素MMS50と水素EMS26とは、異なる機器上で実行される別のプログラム内、または別の実行形式ファイル内で実現されてもよい。
上記のように、水素EMS26は水素製造を制御する。このため、水素EMS26は水電解装置21などの水素製造のための装置の近くに配置されるのが望ましい。また、水素MMS50は、ディスペンサー25の近くに配置されることが望ましい。
第10の実施形態では、水素EMS26と水素MMS50を別々の機器で実現できる。これにより、水素製造を行って、これを水素貯蔵容器22に貯蔵するための地理的位置と、ディスペンサー25が配置される地理的位置とが離れている場合に対応できる。これは、水素貯蔵容器22に貯蔵された水素がタンクローリ車などで輸送され、この水素が、ディスペンサー25が配置された位置に対応する別の水素貯蔵容器22に貯蔵される場合に対応する。
図33は、第10の実施形態における水素需要量予測システムの構成例を示す図である。図34は、第10の実施形態における水素需要量予測システムの水素MMSの機能構成例を示すブロック図である。
図33および図34に示すように、水素MMS50は、水素EMS26を介さずに、例えばディスペンサー25から水素の充填実績を直接受信することができる。また、ディスペンサー25に限らず、水素MMS50は、蓄圧器24から水素の充填実績を、水素EMS26を介さずに直接受信することができる。
図33および図34に示すように、水素MMS50は、水素EMS26を介さずに、例えばディスペンサー25から水素の充填実績を直接受信することができる。また、ディスペンサー25に限らず、水素MMS50は、蓄圧器24から水素の充填実績を、水素EMS26を介さずに直接受信することができる。
(第11の実施形態)
次に、第11の実施形態について説明する。図35は、第11の実施形態における水素需要量予測システムの水素MMSの機能構成例を示すブロック図である。図35に示すように、第11の実施形態では、水素MMS50は、充填水素量推定部50nをさらに有する。
次に、第11の実施形態について説明する。図35は、第11の実施形態における水素需要量予測システムの水素MMSの機能構成例を示すブロック図である。図35に示すように、第11の実施形態では、水素MMS50は、充填水素量推定部50nをさらに有する。
DB50dは、WMS31から送信された、各区分で実施された作業(入荷、出荷など)の過去データを格納する。また、DB50dは、オペレータがUI50cを操作することによる、各区分で実施されると推定される作業の情報の過去データ(経験値)を格納する。
さらに、DB50dは、オペレータがUI50cを操作することによる、FCフォークリフトの動作(爪の上げ下げ、移動など)毎の単位消費燃料(動作毎の水素消費量)と、各区分での作業で行われる平均的なフォークリフト動作比率の情報とを格納する。
このフォークリフト動作比率とは、各区分(入荷、出荷など)での、各作業(荷卸し、搬送、など)についての、動作(爪の上げ下げ、移動など)の比率である。例えば、荷卸しという作業について、爪上げ下げの単位消費燃料が9(kg-H2/m)、移動の単位消費燃料が3(kg-H2/m)の場合は、フォークリフト動作比率は「爪の上げ下げ:移動=3:1」などで表される。
また、DB50fは、ASN32からの、各区分で実施されると予想される作業の需要予測対象日データを格納し、また、カレンダーデータ33、気象予測データ34を格納する。
充填水素量推定部50nは、WMS31からDB50dに格納された過去データ、UI50cからDB50dに格納された過去データ(経験値)、上記のFCフォークリフトの動作毎の単位消費燃料、上記の平均的なフォークリフト動作比率、DB50dに格納される需要予測対象日データ、カレンダーデータ33、気象予測データ34を、各区分での作業に関する情報として取得する。充填水素量推定部50nは、この取得した情報に基づいて、過去の各区分でのFCフォークリフトの消費燃料を推定する。
24時間分予測部50iは、この推定した消費燃料を、過去の水素充填水素量とみなして、学習フェーズで利用する。
また、ASN32から、各区分で実施されると予想される作業の需要予測対象日データを取得することが出来る場合は、24時間分予測部50iは、このデータで示される作業を、需要予測用の各種モデルを構築する際の因子とすることが出来る。
このように、第11の実施形態では、FCフォークリフトの動作が燃料消費に与える比率が、その動作毎に異なることを利用して過去の水素充填水素量を求めることができるので、需要予測精度を向上させることができる。
なお、本発明のいくつかの実施形態を説明したが、これらの実施形態は、例として提示したものであり、発明の範囲を限定することは意図していない。これら新規な実施形態は、その他の様々な形態で実施されることが可能であり、発明の要旨を逸脱しない範囲で、種々の省略、置き換え、変更を行うことができる。これら実施形態やその変形は、発明の範囲や要旨に含まれるとともに、特許請求の範囲に記載された発明とその均等の範囲に含まれる。
また、各実施形態に記載した手法は、計算機(コンピュータ)に実行させることができるプログラム(ソフトウエア手段)として、例えば磁気ディスク(フロッピー(登録商標)ディスク、ハードディスク等)、光ディスク(CD‐ROM、DVD、MO等)、半導体メモリ(ROM、RAM、フラッシュメモリ等)等の記録媒体に格納し、また通信媒体により伝送して頒布することもできる。なお、媒体側に格納されるプログラムには、計算機に実行させるソフトウエア手段(実行プログラムのみならずテーブルやデータ構造も含む)を計算機内に構成させる設定プログラムをも含む。本装置を実現する計算機は、記録媒体に記録されたプログラムを読み込み、また場合により設定プログラムによりソフトウエア手段を構築し、このソフトウエア手段によって動作が制御されることにより上述した処理を実行する。なお、本明細書でいう記録媒体は、頒布用に限らず、計算機内部あるいはネットワークを介して接続される機器に設けられた磁気ディスクや半導体メモリ等の記憶媒体を含むものである。
10…発電設備、20…水素ステーション、21…水電解装置、22…水素貯蔵容器、23…圧縮機、24…蓄圧器、25…ディスペンサー、26…水素EMS(Energy Management System)、31…WMS(Warehouse Management System)、32…ASN(Advanced Shipping Notice)、41,42…データベース、50…水素MMS(Mobility Management System)、50a,50c,50e…UI(User Interface)、50b…区分・ディスペンサー設定部、50i…24時間分予測部、50j…再予測部、50k…水素貯蔵要求量計算部、50m…通信部、50n…充填水素量推定部。
Claims (15)
- 水素を製造する水素製造手段と、
前記水素製造手段が製造した水素により発電する燃料電池で駆動する燃料電池車両の水素貯蔵要求量を求めることで、前記燃料電池車両の水素需要予測を行う需要予測手段と、
前記水素貯蔵要求量に基づいて、前記水素製造手段を制御するための水素製造計画を管理する管理手段とを備え、
前記需要予測手段は、
前記燃料電池車両の過去の水素充填実績を含む入力データを前記管理手段から入力し、
前記入力データを、需要予測対象日の1日の充填水素量の総量である日量と、前記1日の所定の充填タイミングにおける充填水素量を前記総量で除して正規化したパタンとに分割して、前記日量と前記パタンのそれぞれの水素需要予測モデルを構築し、
前記日量の予測モデルは、前記日量に影響を与える因子により分類され、前記パタンの予測モデルは、前記パタンに影響を与える因子により分類され、
前記需要予測対象日の因子と前記分類された予測モデルとに基づく、前記需要予測対象日の前記日量と前記パタンの検索結果を掛け合わせて、前記需要予測対象日における充填水素量の絶対量としての予測結果を求める24時間分予測部と、
前記予測結果にマージン分の充填水素量を加算して、前記水素貯蔵要求量を計算し、
前記計算した水素貯蔵要求量を前記管理手段に通知する水素貯蔵要求量計算部と
を有する水素需要量予測システム。 - 前記水素貯蔵要求量計算部は、
前記管理手段から前記水素充填実績を入力した時である場合は、前回予測した前記水素貯蔵要求量から充填された水素量を減算して新たな水素貯蔵要求量を計算する
請求項1記載の水素需要量予測システム。 - 前記需要予測手段は、
前記予測結果で示される充填水素量と実際の充填水素量との差分が所定の条件を満たして大きい場合、前記日量と前記パタンとに分割する前の前記入力データの中から、前記需要予測対象日の当日の開始時刻から、前記差分が前記条件を満たして大きくなる時刻までについて、実際の前記充填水素量の変化に最も類似する前記入力データを前記充填水素量の再予測結果とし、前記再予測結果を新たな水素貯蔵要求量として前記管理手段に通知する再予測部をさらに有する
請求項1に記載の水素需要量予測システム。 - 前記24時間分予測部は、
前記入力データにおける前記正規化したパタンに対して、前記パタンに影響を与える因子に応じた分類を行い、各分類のデータにおける各時刻での平均値を、この時刻の予測値とすることで、前記因子に対応した前記パタンの予測モデルを構築する
請求項1に記載の水素需要量予測システム。 - 前記水素貯蔵要求量計算部は、
前記再予測部による再予測結果を判定するための、前記予測結果で示される充填水素量と実際の充填水素量との差分の閾値と、所定の1以上の係数との乗算値に、前記水素製造手段による水素製造能力と前記閾値との差異を考慮した係数を加算した値を前記充填水素量のマージンとして設定する
請求項3に記載の水素需要量予測システム。 - 前記24時間分予測部は、
前記入力データを、前記1日の充填水素量の日量と、前記正規化したパタンとに分割し、
前記分割した前記パタンを、前記パタンに影響を与える因子により分類し、
前記分類したパタンについて、各時刻の分散を計算することで分布モデルを構築し、
充填水素量の実績値が、前記分布モデルの該当時刻の分布の中で所定のパーセンテージの信頼区間に入っているか否かに応じて、前記再予測部による再予測を実施するか否かを判定する
請求項3に記載の水素需要量予測システム。 - 前記24時間分予測部は、
前記入力データを、前記入力データに影響を与える因子により分類し、
前記分類した入力データを、前記1日の充填水素量の日量と、前記正規化したパタンとに分割して、前記それぞれの水素需要予測モデルを構築し、
前記分割した前記パタンについて、各時刻の分散を計算することで分布モデルを構築し、
前記再予測部は、
充填水素量の実績値が、前記分布モデルの該当時刻の分布の中で、所定のパーセンテージの信頼区間に入っているか否かに応じて、前記再予測部による再予測を実施するか否かを判定する
請求項3に記載の水素需要量予測システム。 - 前記24時間分予測部は、
前記入力データを、前記1日の充填水素量の日量と、前記需要予測対象日における所定の複数の時間帯における充填水素量を前記1日の充填水素量の総量で除して正規化したパタンとに分割して、前記日量と前記パタンのそれぞれの予測モデルを構築する
請求項1に記載の水素需要量予測システム。 - 前記再予測部は、
前記予測結果で示される充填水素量と実際の充填水素量との差分が所定の条件を満たして大きい場合、前記日量と前記パタンとに分割する前の前記入力データの中の一部の期間での時系列変化を基に、時系列分析手法により、前記需要予測対象日の当日の開始時刻から、前記差分が前記条件を満たして大きくなる時刻までについて、実際の前記充填水素量の変化に最も類似する前記入力データを前記充填水素量の再予測結果とする
請求項3に記載の水素需要量予測システム。 - 前記24時間分予測部は、
前記入力データにおける前記正規化したパタンに対して、前記パタンに影響を与える因子に応じた分類を行い、
前記パタンにおける、所定の各時刻での差分と、前記各時刻の全てについての前記差分の合計値とに基づく類似度に基づいて、前記分類したパタンをグループ分類し、
前記グループ分類の結果における、所属するパタン数が最大であるグループ中のパタンに対して、各時刻における移動平均を計算することで前記因子に対応した前記パタンの予測モデルを構築する
請求項1に記載の水素需要量予測システム。 - 前記24時間分予測部は、
前記入力データにおける前記正規化したパタンに対して、前記パタンに影響を与える因子に応じた分類を行い、
相関係数を用いて前記分類したパタンをグループ分類し、
前記グループ分類の結果における、所属するパタン数が最大であるグループ中のパタンに対して、各時刻における平均値を計算することで前記因子に対応した前記パタンの予測モデルを構築する
請求項1に記載の水素需要量予測システム。 - 前記水素貯蔵要求量計算部は、
前記分布モデルにおける各時刻の分散に対して、所定の目標サービス率に相当する信頼区間に対応する充填水素量を前記充填水素量のマージンとみなして、
このマージンを前記予測結果で示される充填水素量と合わせた値に基づいて、前記水素貯蔵要求量を計算する
請求項6または7に記載の水素需要量予測システム。 - 前記需要予測手段は、
各区分で実施された作業を示す情報、各区分で実施されると推定される作業を示す情報、前記燃料電池車両の動作毎の単位消費燃料の情報、および、各区分での作業に対する、この作業のための前記燃料電池車両の動作の平均的な比率の情報を格納する格納手段と、
前記格納手段に格納された情報に基づいて、前記燃料電池車両の消費燃料を過去の充填水素量として推定する推定手段と
をさらに有する請求項1に記載の水素需要量予測システム。 - 燃料電池で駆動する燃料電池車両の水素貯蔵要求量を求めることで、前記燃料電池車両の水素需要予測を行う水素需要量予測方法において、
前記水素貯蔵要求量に基づいて、水素を製造する水素製造装置を制御するための水素製造計画を管理し、
前記燃料電池車両の過去の水素充填実績を含む入力データを入力し、
前記入力データを、需要予測対象日の1日の充填水素量の総量である日量と、前記1日の所定の充填タイミングにおける充填水素量を前記総量で除して正規化したパタンとに分割して、前記日量と前記パタンのそれぞれの水素需要予測モデルを構築し、
前記日量の予測モデルは、前記日量に影響を与える因子により分類され、前記パタンの予測モデルは、前記パタンに影響を与える因子により分類され、
前記需要予測対象日の因子と前記分類された予測モデルとに基づく、前記需要予測対象日の前記日量と前記パタンの検索結果を掛け合わせて、前記需要予測対象日における充填水素量の絶対量としての予測結果を求め、
前記予測結果にマージン分の充填水素量を加算して、前記水素貯蔵要求量を計算し、
前記計算した水素貯蔵要求量を前記水素製造計画に用いる
水素需要量予測方法。 - 燃料電池で駆動する燃料電池車両の水素貯蔵要求量を求めることで、前記燃料電池車両の水素需要予測を行う水素需要量予測装置において、
水素を製造する水素製造手段を制御するための水素製造計画を管理する管理装置から、前記燃料電池車両の過去の水素充填実績を含む入力データを入力し、
前記入力データを、需要予測対象日の1日の充填水素量の総量である日量と、前記1日の所定の充填タイミングにおける充填水素量を前記総量で除して正規化したパタンとに分割して、前記日量と前記パタンのそれぞれの水素需要予測モデルを構築し、
前記日量の予測モデルは、前記日量に影響を与える因子により分類され、前記パタンの予測モデルは、前記パタンに影響を与える因子により分類され、
前記需要予測対象日の因子と前記分類された予測モデルとに基づく、前記需要予測対象日の前記日量と前記パタンの検索結果を掛け合わせて、前記需要予測対象日における充填水素量の絶対量としての予測結果を求める24時間分予測部と、
前記予測結果にマージン分の充填水素量を加算して、前記水素貯蔵要求量を計算し、
前記計算した水素貯蔵要求量を前記管理装置に通知する水素貯蔵要求量計算部と
を有する水素需要量予測装置。
Priority Applications (2)
| Application Number | Priority Date | Filing Date | Title |
|---|---|---|---|
| JP2017563420A JP6633655B2 (ja) | 2016-01-25 | 2016-01-25 | 水素需要量予測システム |
| PCT/JP2016/052049 WO2017130280A1 (ja) | 2016-01-25 | 2016-01-25 | 水素需要量予測システム、水素需要量予測方法および水素需要量予測装置 |
Applications Claiming Priority (1)
| Application Number | Priority Date | Filing Date | Title |
|---|---|---|---|
| PCT/JP2016/052049 WO2017130280A1 (ja) | 2016-01-25 | 2016-01-25 | 水素需要量予測システム、水素需要量予測方法および水素需要量予測装置 |
Publications (1)
| Publication Number | Publication Date |
|---|---|
| WO2017130280A1 true WO2017130280A1 (ja) | 2017-08-03 |
Family
ID=59397633
Family Applications (1)
| Application Number | Title | Priority Date | Filing Date |
|---|---|---|---|
| PCT/JP2016/052049 Ceased WO2017130280A1 (ja) | 2016-01-25 | 2016-01-25 | 水素需要量予測システム、水素需要量予測方法および水素需要量予測装置 |
Country Status (2)
| Country | Link |
|---|---|
| JP (1) | JP6633655B2 (ja) |
| WO (1) | WO2017130280A1 (ja) |
Cited By (6)
| Publication number | Priority date | Publication date | Assignee | Title |
|---|---|---|---|---|
| JP2019047710A (ja) * | 2017-09-07 | 2019-03-22 | トヨタ自動車株式会社 | 燃料電池車 |
| CN111242511A (zh) * | 2020-02-27 | 2020-06-05 | 云南电网有限责任公司电力科学研究院 | 氢油生产控制方法 |
| CN113519104A (zh) * | 2019-03-04 | 2021-10-19 | 旭化成株式会社 | 计划装置、控制装置、方法及程序 |
| CN115470961A (zh) * | 2021-06-11 | 2022-12-13 | 丰田自动车株式会社 | 信息处理装置、信息处理方法以及程序 |
| CN115689618A (zh) * | 2021-07-27 | 2023-02-03 | 丰田自动车株式会社 | 信息处理装置、信息处理方法以及存储介质 |
| US12054072B2 (en) | 2019-09-18 | 2024-08-06 | Honda Motor Co., Ltd. | Information processing system |
Families Citing this family (1)
| Publication number | Priority date | Publication date | Assignee | Title |
|---|---|---|---|---|
| KR102866679B1 (ko) * | 2023-02-16 | 2025-09-30 | 강원대학교산학협력단 | 기상 데이터를 기반으로 학습된 인공지능 모델을 통해, 수소 충전소의 수요 예측량을 산출하는 전자 장치, 제어 방법, 및 컴퓨터 프로그램 |
Citations (5)
| Publication number | Priority date | Publication date | Assignee | Title |
|---|---|---|---|---|
| JPS57155621A (en) * | 1982-02-10 | 1982-09-25 | Hitachi Ltd | Estimated controlling method |
| JP2005344996A (ja) * | 2004-06-02 | 2005-12-15 | Noritz Corp | 熱源装置 |
| JP2006001797A (ja) * | 2004-06-17 | 2006-01-05 | Toho Gas Co Ltd | 水素製造装置の運転制御装置 |
| JP2006179358A (ja) * | 2004-12-24 | 2006-07-06 | Seinan Sogo Kaihatsu Kk | 水素貯蔵装置を設置した燃料電池発電システム及びその燃料電池発電方法 |
| JP2010218394A (ja) * | 2009-03-18 | 2010-09-30 | Fuji Electric Systems Co Ltd | エネルギー需要予測装置 |
-
2016
- 2016-01-25 JP JP2017563420A patent/JP6633655B2/ja active Active
- 2016-01-25 WO PCT/JP2016/052049 patent/WO2017130280A1/ja not_active Ceased
Patent Citations (5)
| Publication number | Priority date | Publication date | Assignee | Title |
|---|---|---|---|---|
| JPS57155621A (en) * | 1982-02-10 | 1982-09-25 | Hitachi Ltd | Estimated controlling method |
| JP2005344996A (ja) * | 2004-06-02 | 2005-12-15 | Noritz Corp | 熱源装置 |
| JP2006001797A (ja) * | 2004-06-17 | 2006-01-05 | Toho Gas Co Ltd | 水素製造装置の運転制御装置 |
| JP2006179358A (ja) * | 2004-12-24 | 2006-07-06 | Seinan Sogo Kaihatsu Kk | 水素貯蔵装置を設置した燃料電池発電システム及びその燃料電池発電方法 |
| JP2010218394A (ja) * | 2009-03-18 | 2010-09-30 | Fuji Electric Systems Co Ltd | エネルギー需要予測装置 |
Cited By (10)
| Publication number | Priority date | Publication date | Assignee | Title |
|---|---|---|---|---|
| JP2019047710A (ja) * | 2017-09-07 | 2019-03-22 | トヨタ自動車株式会社 | 燃料電池車 |
| CN113519104A (zh) * | 2019-03-04 | 2021-10-19 | 旭化成株式会社 | 计划装置、控制装置、方法及程序 |
| US12249830B2 (en) | 2019-03-04 | 2025-03-11 | Asahi Kasei Kabushiki Kaisha | Planning apparatus, controlling apparatus, method, and recording medium for a hydrogen production system |
| US12054072B2 (en) | 2019-09-18 | 2024-08-06 | Honda Motor Co., Ltd. | Information processing system |
| CN111242511A (zh) * | 2020-02-27 | 2020-06-05 | 云南电网有限责任公司电力科学研究院 | 氢油生产控制方法 |
| CN111242511B (zh) * | 2020-02-27 | 2023-06-30 | 云南电网有限责任公司电力科学研究院 | 氢油生产控制方法 |
| CN115470961A (zh) * | 2021-06-11 | 2022-12-13 | 丰田自动车株式会社 | 信息处理装置、信息处理方法以及程序 |
| JP2022189386A (ja) * | 2021-06-11 | 2022-12-22 | トヨタ自動車株式会社 | 情報処理装置、情報処理方法及びプログラム |
| JP7567673B2 (ja) | 2021-06-11 | 2024-10-16 | トヨタ自動車株式会社 | 情報処理装置、情報処理方法及びプログラム |
| CN115689618A (zh) * | 2021-07-27 | 2023-02-03 | 丰田自动车株式会社 | 信息处理装置、信息处理方法以及存储介质 |
Also Published As
| Publication number | Publication date |
|---|---|
| JP6633655B2 (ja) | 2020-01-22 |
| JPWO2017130280A1 (ja) | 2018-08-16 |
Similar Documents
| Publication | Publication Date | Title |
|---|---|---|
| JP6633655B2 (ja) | 水素需要量予測システム | |
| JP5596220B2 (ja) | エネルギー消費管理のためのシステム、方法及びコンピュータプログラム | |
| US11593690B2 (en) | Data prediction system and data prediction method | |
| KR101168153B1 (ko) | 건물의 에너지 수요 예측 방법 및 그 시스템 | |
| US20190228329A1 (en) | Prediction system and prediction method | |
| CN104937804A (zh) | 电力需求预测装置、方法和程序以及需求抑制计划制定装置 | |
| CN111670448B (zh) | 用于实时电池操作模式预测和控制的多自主体共享机器学习方法 | |
| JP2014217091A (ja) | 情報処理システム | |
| CN104412481A (zh) | 能源管理服务器、能源管理方法以及程序 | |
| US20140129272A1 (en) | System and method for managing service restoration in a utility network | |
| CN119740950B (zh) | 一种快递订单重分配优化管理方法和系统 | |
| Sevlian et al. | Value of aggregation in smart grids | |
| WO2023082553A1 (zh) | 采购数据的确定方法及其装置、计算机可读存储介质 | |
| KR101705869B1 (ko) | 열 에너지 수요 예측에 기반한 복합 설비 최적 운영 시스템 및 그 방법 | |
| JP5953207B2 (ja) | 需要計画管理システム | |
| KR20120046310A (ko) | 재고 계획 작성 장치 및 재고 계획 작성 방법 | |
| CN109858668B (zh) | 一种雷电气候下电力负荷区域协调预测方法 | |
| JP2015106316A (ja) | エネルギー管理システム | |
| CN102930353B (zh) | 一种小区用电负荷的预测方法及装置 | |
| CN113673830A (zh) | 基于非侵入式负荷监测技术的自适应家庭能量管理方法 | |
| Schwarz et al. | Improving the computational efficiency of stochastic programs using automated algorithm configuration: an application to decentralized energy systems | |
| CN108346009A (zh) | 一种基于用户模型自学习的电力生产配置方法和装置 | |
| CN112330017B (zh) | 电力负荷预测方法、装置、电子设备和存储介质 | |
| WO2019117957A1 (en) | System device, and method for mode-based energy storage management using machine learning | |
| Kimata et al. | Operation planning for heat pump in a residential building |
Legal Events
| Date | Code | Title | Description |
|---|---|---|---|
| 121 | Ep: the epo has been informed by wipo that ep was designated in this application |
Ref document number: 16887867 Country of ref document: EP Kind code of ref document: A1 |
|
| ENP | Entry into the national phase |
Ref document number: 2017563420 Country of ref document: JP Kind code of ref document: A |
|
| NENP | Non-entry into the national phase |
Ref country code: DE |
|
| 122 | Ep: pct application non-entry in european phase |
Ref document number: 16887867 Country of ref document: EP Kind code of ref document: A1 |