WO2016143365A1 - Cvhr形状測定装置 - Google Patents
Cvhr形状測定装置 Download PDFInfo
- Publication number
- WO2016143365A1 WO2016143365A1 PCT/JP2016/050154 JP2016050154W WO2016143365A1 WO 2016143365 A1 WO2016143365 A1 WO 2016143365A1 JP 2016050154 W JP2016050154 W JP 2016050154W WO 2016143365 A1 WO2016143365 A1 WO 2016143365A1
- Authority
- WO
- WIPO (PCT)
- Prior art keywords
- cvhr
- acv
- dip
- shape
- fcv
- Prior art date
- Legal status (The legal status is an assumption and is not a legal conclusion. Google has not performed a legal analysis and makes no representation as to the accuracy of the status listed.)
- Ceased
Links
Images


Classifications
-
- A—HUMAN NECESSITIES
- A61—MEDICAL OR VETERINARY SCIENCE; HYGIENE
- A61B—DIAGNOSIS; SURGERY; IDENTIFICATION
- A61B5/00—Measuring for diagnostic purposes; Identification of persons
- A61B5/02—Detecting, measuring or recording for evaluating the cardiovascular system, e.g. pulse, heart rate, blood pressure or blood flow
- A61B5/024—Measuring pulse rate or heart rate
- A61B5/0245—Measuring pulse rate or heart rate by using sensing means generating electric signals, i.e. ECG signals
-
- A—HUMAN NECESSITIES
- A61—MEDICAL OR VETERINARY SCIENCE; HYGIENE
- A61B—DIAGNOSIS; SURGERY; IDENTIFICATION
- A61B5/00—Measuring for diagnostic purposes; Identification of persons
- A61B5/02—Detecting, measuring or recording for evaluating the cardiovascular system, e.g. pulse, heart rate, blood pressure or blood flow
- A61B5/024—Measuring pulse rate or heart rate
- A61B5/02405—Determining heart rate variability
-
- A—HUMAN NECESSITIES
- A61—MEDICAL OR VETERINARY SCIENCE; HYGIENE
- A61B—DIAGNOSIS; SURGERY; IDENTIFICATION
- A61B5/00—Measuring for diagnostic purposes; Identification of persons
- A61B5/08—Measuring devices for evaluating the respiratory organs
-
- A—HUMAN NECESSITIES
- A61—MEDICAL OR VETERINARY SCIENCE; HYGIENE
- A61B—DIAGNOSIS; SURGERY; IDENTIFICATION
- A61B5/00—Measuring for diagnostic purposes; Identification of persons
- A61B5/48—Other medical applications
- A61B5/4806—Sleep evaluation
- A61B5/4818—Sleep apnoea
Definitions
- the technology disclosed in this specification relates to an apparatus for measuring the amplitude of a heart rate periodic variation or a characteristic related thereto.
- the heart rate periodic variation is referred to as CVHR (cyclic variation of heart rate)
- ACV amplitude of cyclic variation
- Japanese Unexamined Patent Application Publication No. 2010-51387 discloses a technique for detecting CVHR associated with an apnea attack or a hypopnea attack of sleep respiratory disorder.
- the subject measures the frequency of CVHR (frequency of cyclic variation, FCV) per unit time of the subject (1 hour in the publication) using the technique, so that the subject is in obstructive sleep. It is said that it is possible to detect with high accuracy whether or not the patient is suffering from apnea syndrome (apnea sleep apnea syndrome, OSAS).
- FCV degree of health risk such as mortality within a predetermined period (hereinafter also referred to as health risk). That is, it has been found that FCV is insufficient as an index for predicting health risk.
- This specification discloses a technology that can more accurately predict the degree of health risk such as mortality within a predetermined period than before.
- the CVHR shape measuring device disclosed in the present specification includes CVHR detecting means and CVHR shape characteristic index acquiring means.
- the CVHR detecting means detects heart rate periodic fluctuation (CVHR) from data indicating a heartbeat or a pulse period or frequency in time series.
- the CVHR shape characteristic index acquisition unit obtains at least one of the following shape characteristic index: amplitude (ACV), slope, ratio of the amplitude to the duration, and area with respect to the CVHR waveform detected by the CVHR detection unit. get.
- the pulse is linked to the heartbeat. Therefore, in this specification, the periodic fluctuation of the pulse is also collectively referred to as “heart rate periodic fluctuation (CVHR)”.
- CVHR is defined as “a heart rate variability that appears periodically with an apnea or hypopnea attack during sleep”.
- CVHR is defined as “apnea or hypopnea. It is broadly defined as “Heart rate fluctuation”.
- heart rate variability associated with apnea or hypopnea not only during sleep but also during awakening is included as a CVHR-like phenomenon in a broad sense of CVHR. For this reason, CVHR in this specification is not restricted to what appears with the apnea attack or hypopnea attack which originates in sleep respiratory disorder.
- apnea or hypopnea in the present specification is not limited to those that occur naturally due to seizures, for example, artificially created by consciously stopping breathing or reducing the amount of breathing when waking Also included.
- the heart rate variability caused by this is also included in CVHR in a broad sense as a CVHR-like phenomenon.
- heart rate fluctuations caused by apnea or hypopnea are included in CVHR in a broad sense as a CVHR-like phenomenon without periodicity.
- physiological heart rate variability that is, heart rate variability other than heart rate variability caused by apnea or hypopnea is not included in CVHR.
- Each CVHR waveform has a first maximum value, a minimum value, and a second maximum value, respectively.
- the first maximum value is a point closest to the minimum value that appears earlier in the time series with respect to the minimum value
- the second maximum value is a minimum value that appears after the time series with respect to the minimum value. Is the closest point.
- the amplitude (ACV) is a distance between a straight line connecting the first maximum value and the second maximum value and the minimum value.
- the slope is obtained by dividing the amplitude by the elapsed time from the first maximum value to the minimum value and / or dividing the amplitude by the elapsed time from the minimum value to the second maximum value.
- the duration is an elapsed time from the first maximum value to the second maximum value. For this reason, the ratio of the amplitude to the duration is obtained by dividing the distance between the straight line connecting the first maximum value and the second maximum value and the minimum value by the elapsed time from the first maximum value to the second maximum value.
- the area is the size of a range surrounded by the CVHR waveform and a straight line connecting the first maximum value and the second maximum value.
- the “one CVHR” may be a CVHR obtained by one heart rate variability or a CVHR obtained by averaging a plurality of heart rate variability. Note that the CVHR shape characteristic index acquisition unit can acquire not only the amplitude (ACV) but also characteristics (for example, logarithm) related to ACV.
- CVHR is heart rate variability associated with apnea or hypopnea. For this reason, it can be said that the amplitude (ACV) of CVHR represents the strength of the heartbeat response to an apnea load or a low respiratory load.
- the other shape characteristic index (CVHR slope, ratio of amplitude to duration, area) is a value related to the strength of the heartbeat response to apnea load or hypopnea load.
- ACV ie, strength of heartbeat response to apnea / hypopnea load
- the degree of health risk such as mortality within a specified period (health risk) are greatly related.
- ACV can be a useful index to predict health risks. Specifically, the higher the ACV (ie, the stronger the heart rate response to apnea / hypopnea load), the lower the health risk, and the smaller the ACV (ie, the weaker heart rate response to apnea / hypopnea load). ) It has been found that health risks increase. It has also been found that other shape characteristic indexes (CVHR slope, ratio of amplitude to duration, area) can be useful indexes for predicting health risks. Specifically, the health risk decreases as the magnitude (absolute value) of the CVHR slope increases. In addition, the health risk decreases as the ratio of the amplitude of CVHR to the duration increases.
- the health risk decreases as the area of the CVHR increases.
- the CVHR detecting means detects CVHR
- the CVHR shape characteristic index obtaining means obtains at least one shape characteristic index of CVHR amplitude (ACV), slope, ratio of amplitude to duration, and area. get.
- the CVHR shape measuring apparatus can predict the health risk more accurately than before by referring to at least one of the shape property indexes acquired by the CVHR shape property index acquiring means.
- the health risk includes a morbidity rate, an onset rate, a recurrence rate (re-hospitalization rate), a disease progression degree, and the like in addition to the mortality rate within the predetermined period.
- the CVHR shape measuring device includes CVHR input means and CVHR shape characteristic index acquisition means.
- the CVHR input means inputs a periodically appearing heart rate periodic variation (CVHR) specified from data indicating a heartbeat or a pulse period or frequency in a time series.
- the CVHR shape characteristic index acquisition means obtains at least one of the following shape characteristic indices: amplitude (ACV), slope, ratio of the amplitude to the duration, and area with respect to the CVHR waveform input by the CVHR input means. get.
- This CVHR shape measuring apparatus does not detect CVHR. That is, CVHR detected outside the apparatus is input to the CVHR shape measuring apparatus. For this reason, it becomes possible to connect and use the CVHR shape measuring device with various devices capable of detecting CVHR.
- This computer program causes a computer to execute CVHR detection processing and CVHR shape characteristic index acquisition processing.
- CVHR detection process CVHR is detected from data indicating the period or frequency of the heartbeat or pulse in time series.
- CVHR shape characteristic index acquisition process the following shape characteristic index: amplitude (amplitude of cyclic variation, ACV), slope, ratio of the amplitude to the duration, and area with respect to the CVHR waveform detected in the CVHR detection process Get at least one of
- the present specification discloses another novel CVHR shape measuring apparatus that can solve the above-described problems.
- the CVHR shape measuring apparatus includes CVHR detection means, CVHR shape acquisition means, and evaluation means.
- the CVHR detecting means detects heart rate periodic fluctuation (CVHR) from data indicating a heartbeat or a pulse period or frequency in time series.
- the CVHR shape acquisition means acquires the waveform shape of the CVHR detected by the CVHR detection means.
- the evaluation means evaluates the health risk only from the shape of the CVHR acquired by the CVHR shape acquisition means. According to this CVHR shape measuring apparatus, the degree of health risk can be easily known.
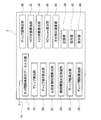
- FIG. 1 The block diagram which shows the structure of a CVHR shape measuring apparatus.
- (A) is a graph A showing the distribution of logarithmic values of ACV in a group having the same logarithmic value of FCV for each logarithmic value of FCV, and (b) is the logarithmic value of FCV in the graph of (a).
- a graph B showing the average relationship between the logarithmic values of ACV is shown, and
- (c) shows a graph C showing the relationship between the logarithmic value of FCV and the standard deviation of the logarithmic value of ACV in the graph of (a).
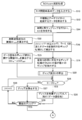
- FIG. 1 The flowchart of an ACVscore measurement process.
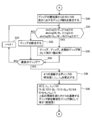
- FIG. 5 is a flowchart continued from FIG. 4.
- FIG. The flowchart following FIG. The flowchart of a dip depth calculation process.
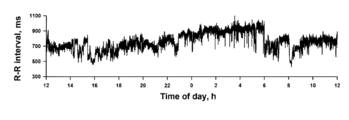
- RR interval time series data is schematically shown.
- RR interval time series data is schematically shown.
- (A) shows a state in which n CVHRs detected by the CVHR detection means are divided into n segments s1 to sn, and
- (b) is created by averaging the n segments s1 to sn.
- the average time series is shown.
- (A) shows the graph D of the addition average time series of the subject with a good prognosis
- (b) shows the graph E of the addition average time series of the subject who died one year later.
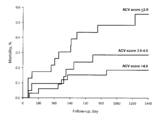
- Shown is a Kaplan-Meier curve of mortality in the population after ACVscore and acute myocardial infarction.
- Figure 6 shows Kaplan-Meier curves of mortality in another population after ACVscore and acute myocardial infarction.
- Figure 6 shows Kaplan-Meier curves of mortality in a population of ACVscore and end-stage renal failure hemodialysis patients.
- Figure 6 shows Kaplan-Meier curves of mortality in a population suffering from ACVscore and chronic heart failure. The figure for demonstrating each shape characteristic parameter
- the CVHR shape characteristic index acquisition unit performs ACV by averaging the data indicating the waveforms of a plurality of CVHR detected during a predetermined period of the data. At least one of the slope, the ratio of the amplitude to the duration, and the area may be acquired. Since the shape (waveform) of CVHR varies depending on the degree of breathing (apnea or hypopnea) or the duration of apnea or hypopnea, etc., there are variations in each shape characteristic index of each CVHR. For this reason, by adding and averaging a plurality of CVHR waveforms and obtaining each shape characteristic index of one CVHR waveform generated by the addition average, the reliability of each shape characteristic index is increased.
- the CVHR shape measuring apparatus disclosed in the present specification may further include an FCV acquisition unit and an ACV correction unit.
- the FCV acquisition unit may acquire the frequency (FCV) per unit time of the CVHR detected by the CVHR detection unit during a predetermined period.
- the ACV correction unit may correct the ACV based on the FCV value to obtain a corrected amplitude (ACVscore).
- FCVscore corrected amplitude
- FCVscore corrected amplitude
- FCVscore corrected amplitude
- the FCV acquisition unit can measure not only FCV but also characteristics related to FCV.
- the CVHR shape measuring device disclosed in the present specification can measure the amplitude (ACV) of the CVHR if CVHR occurs even once. That is, it is sufficient that even one CVHR appears in the data. If the period of the data exceeds the unit time, the FCV should be greater than 0 (eg, if the data period is 2 hours and the unit time is 1 hour, if one CVHR appears in the data, the FCV Becomes 0.5).
- the ACV correction unit uses the ACV acquired from the data during the predetermined period and the FCV acquired from the data during the predetermined period from which the ACV was acquired.
- the following two functions derived from a database accumulated in association with each other are used to correct ACV using an ACV average value function that is a function of FCV and a standard deviation function of ACV that is a function of FCV. There may be. From the average value obtained from the above average value function and the above standard deviation function, the ACV obtained by the CVHR shape characteristic index obtaining means corresponds to the FCV obtained from the data during the predetermined period from which the ACV was obtained. You may correct
- the “average value of ACV” means the average value of ACV of a plurality of subjects having the same FCV.
- the corrected amplitude (ACVscore) can be calculated as a kind of deviation value of ACV.
- the two functions may be a logarithmic value of FCV, an average value of logarithmic values of ACV, and a standard deviation of logarithmic values of ACV.
- the data may be data indicating any one of the RR interval, the pulse interval, and the heartbeat interval in time series. All of these data are data that can be easily acquired by a currently popular apparatus (for example, a Holter electrocardiograph, a wearable pulse wave meter, a heart rate rhythm meter, etc.). For this reason, it is not necessary to be hospitalized in order to acquire data, and data can be acquired easily.
- a currently popular apparatus for example, a Holter electrocardiograph, a wearable pulse wave meter, a heart rate rhythm meter, etc.
- the ACV value can be repeatedly measured safely and non-invasively in daily life. For this reason, the CVHR shape measuring device can be used as a means for managing health by itself.
- FIG. 1 is a block diagram showing the configuration of the CVHR shape measuring apparatus 2 of the present embodiment.
- the CVHR shape measuring apparatus 2 includes an RR interval time series data input unit 16, a dip detection unit 18, a dip depth calculation unit 20, a heart rate variability index calculation unit 22, an individual threshold value determination processing unit 24, and a dip width calculation unit 26.
- a dip interval calculation unit 28, a dip group specifying unit 30, an ACV logarithm calculation unit 32, an FCV logarithm calculation unit 34, an ACVscore calculation unit 36, other calculation units 38, a storage unit 40, an operation unit 42, and a display unit 44 are provided. Yes.
- the above-described units 16 to 38 and the like are realized when a computer mounted on the CVHR shape measuring apparatus 2 executes processing according to a program.
- the RR interval time series data input unit 16 is connected to the communication line 14.
- the communication line 14 is connected to an RR interval measuring device (in this embodiment, a Holter electrocardiograph).
- the RR interval time series data input unit 16 inputs human RR interval time series data measured and output by the RR interval measuring device.
- FIG. 2 shows an example of RR interval time series data. In FIG. 2, RR interval time-series data is measured over 24 hours.
- the dip detector 18 detects a plurality of local dip from the RR interval time series data. In the present embodiment, the dip detection unit 18 detects a plurality of local dips from the RR time-series data at the time of bed out of the 24-hour RR interval time-series data.
- bedtime means a time zone when the user is in the bed and may be awake.
- the bedtime may be specified by the subject's report. For example, 7 hours from 23:00 to 6am may be defined as a general bedtime.
- the data range input by the data input unit 16 is not limited to data for 24 hours, and may be, for example, data for 7 hours from 23:00 to next 6 o'clock.
- the dip detector 18 detects a dip group satisfying a predetermined dip shape from data such as a dip width and a dip depth. The dip detection method will be described in detail later.
- the dip depth calculation unit 20 calculates the depth of each dip group detected by the dip detection unit 18. A method for calculating the dip depth will be described in detail later.
- a polysomnograph may be used as the RR interval measuring device instead of the Holter electrocardiograph.
- RR interval time series data pulse interval time series data measured by a pulse wave meter may be used, or heart beat interval time series data measured by a heart rate meter may be used.
- a wearable pulse wave meter may be used as the pulse wave meter.
- the heart rate variability index calculation unit 22 calculates the amplitude of the high frequency component (0.15 Hz to 0.45 Hz) from the RR interval time series data.
- the heart rate variability index calculation unit 22 can extract a frequency component by any of the following calculation methods.
- the heart rate variability index calculation unit 22 may calculate the amplitude of the high frequency component by complex demodulation analysis.
- the heart rate variability index calculation unit 22 may calculate the amplitude of the high frequency component by fast Fourier transform or autoregressive analysis.
- the heart rate variability index calculation unit 22 may calculate the amplitude of the frequency component by wave bread transform or short-time Fourier transform.
- the heart rate variability index calculation unit 22 may calculate the root mean square of the difference value of the continuous RR interval as an estimated value of the amplitude of the high frequency component (root mean square of success difference).
- the individual threshold value determination processing unit 24 determines a data-specific threshold value regarding the depth of a dip that is a candidate for CVHR as a data-specific threshold value from the amplitude of the high-frequency component extracted by the heartbeat variability index calculating unit 22. In this embodiment, a value 2.5 times the amplitude of the high frequency component is adopted as the data specific threshold.
- the dip width calculation unit 26 calculates the width of each of the plurality of local dips (that is, the length of time in which each dip appears).
- the dip interval calculation unit 28 calculates the interval between each two consecutive dip. The dip interval is the time from the center value of the dip width to the center value of the dip width of the adjacent dip.
- the dip group identification unit 30 executes the following processes. (1) A dip group having a dip depth larger than the data specific threshold is specified as a significant dip group from a plurality of local dip. (2) A dip group having a predetermined similar shape is specified as a similar dip group from the significant dip groups specified in (1) above. (3) From among the similar dip groups identified in (2) above, a dip group that is continuous with a predetermined periodicity is identified as a periodic dip group. Each dip of the periodic dip group specified in (3) is CVHR.
- the dip group specified in the above (1) is called a significant dip group.
- the dip group specified in (2) above is called a similar dip group.
- the dip group specified in (3) above is called a periodic dip group.
- the dip detection unit 18, the dip depth calculation unit 20, the heart rate variability index calculation unit 22, the individual threshold value determination processing unit 24, the dip width calculation unit 26, the dip interval calculation unit 28, and the dip group specifying unit 30 are “CVHR”. It corresponds to an example of “detection means”.
- the ACV logarithm calculation unit 32 adds and averages each dip (CVHR waveform) of the periodic dip group identified by the dip group identification unit 30, and calculates the amplitude as the amplitude (ACV) of the heart rate periodic variation. The logarithm is calculated.
- the ACV logarithm calculation unit 32 corresponds to an example of “CVHR shape characteristic index acquisition unit”.
- the FCV logarithm calculation unit 34 calculates the frequency per hour (that is, FCV) of CVHR appearing in the RR interval time series data to be processed, and calculates the logarithm thereof.
- the FCV logarithm calculation unit 34 corresponds to an example of “FCV acquisition unit”.
- the ACVscore calculation unit 36 corrects the logarithmic value of the ACV calculated by the ACV logarithm calculation unit 32 based on the logarithmic value of the FCV calculated by the FCV logarithm calculation unit 34, and calculates the corrected amplitude (ACVscore).
- the ACVscore calculation unit 36 corresponds to an example of “ACV correction unit”.
- Graph A in FIG. 3A is a graph showing the distribution of the natural logarithm of ACV (hereinafter also simply referred to as the logarithm of ACV) for each value of the natural logarithm of FCV (hereinafter also simply referred to as the logarithm of FCV). is there.
- Graph A is created based on a large database in which Holter electrocardiogram data of 210,000 subjects are accumulated. “N of subject” in graph A indicates the number of subjects for each logarithmic value of FCV. The height of graph A represents the proportion of subjects with each logarithm of ACV in the population (210,000 cases).
- Graph B in FIG. 3B is a graph showing the average value (Mean) of the logarithm of ACV in graph A for each logarithmic value of FCV.
- the storage unit 40 (described later) stores the two functions f (x) and g (x).
- the ACVscore calculating unit 36 calculates ACVscore using functions f (x) and g (x) (described later).
- the other calculation part 38 performs various calculation processes other than the above. The arithmetic processing performed by the arithmetic unit 38 will be described in detail later.
- the storage unit 40 includes a ROM, an EEPROM, a RAM, and the like.
- the storage unit 40 can store various information.
- the storage unit 40 stores the two functions f (x) and g (x) described above.
- the storage unit 40 stores RR interval time series data input to the RR interval time series data input unit 16.
- the storage unit 40 stores the appearance time, width, and depth of each dip.
- the storage unit 40 stores various information regarding the dip group (that is, the waveform of CVHR) specified by the dip group specifying unit 30.
- the storage unit 40 stores the amplitude (ACV) of CVHR, the frequency per hour (FCV) of CVHR, and the corrected amplitude (ACVscore).
- the operation unit 42 has a plurality of keys. The user can input various information to each part of the CVHR shape measuring apparatus 2 by operating the operation unit 42.
- the display unit 44 can display various information on the screen.
- the contents of the ACVscore calculation process executed by the computer program installed in the CVHR shape measuring apparatus 2 will be described. 4 to 9 show flowcharts of the ACVscore calculation process.
- the RR interval time series data input unit 16 inputs RR interval time series data via the communication line 14 (S10).
- RR interval time series data input in S10 includes non-physiologic arrhythmias such as extrasystole and cardiac block, and data fluctuations due to artifacts. Therefore, the calculation unit 38 performs calculation processing for removing data fluctuations caused by non-physiologic arrhythmia and artifacts (S12). As a result, fluctuations in data caused by causes other than physiological heartbeat fluctuations and heartbeat fluctuations due to apnea and hypopnea can be eliminated.
- the calculation unit 38 interpolates RR interval time series data. For example, when step interpolation is performed, an interpolation function is used between each RR interval such that the function value takes a constant value equal to the value of the RR interval. Subsequently, the calculation unit 38 resamples the value of the interpolation function at a frequency of 2 Hz. Thus, RR interval time series data X (t) sampled at equal intervals is created. Subsequently, the dip detection unit 18 sets the time t at which the following (Equation 1) is satisfied for all T in the range of ⁇ 5 to 5 seconds on the time series data X (t), (S16).
- the dip detection unit 18 specifies the dip candidate as a dip when the vertex of the parabola inscribed in the dip candidate is smaller than the value of the parabola vertex inscribed in any of the dip candidates existing for 10 seconds before and after (S18). .
- the position where the parabola is inscribed in the dip specified by the dip detector 18 is the minimum value of the dip.
- the minimum value of the dip is also referred to as the bottom of the dip.
- the time when the bottom of the dip exists is also referred to as the dip bottom time.
- the dip depth calculation unit 20 calculates each dip depth Di in the plurality of local dip detected in S18. i is the ordinal number of the detected dip.
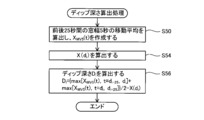
- FIG. 7 shows a flowchart of the calculation process of the dip depth Di.
- the dip depth calculation unit 20 executes the processing (S50 to S56) of FIG. 7 for each dip detected in S18.
- the dip depth calculation unit 20 calculates a moving average with a window width of 5 seconds for time-series data for 25 seconds before and after the center time of the dip.
- a time series obtained by correcting the phase shift of the obtained moving average value is defined as XMV5 (t) (S50).
- the center point of the dip in the time axis direction (X (di) is calculated at the central time di (S54).
- X (di) is a value near the bottom of the dip.
- the dip depth calculation unit 20 calculates the following ( The dip depth Di is calculated by the equation 2) (S56).
- the heart rate variability index calculation unit 22 calculates the amplitude HFAMP of the high frequency component (0.15 to 0.45 Hz) from the RR interval time series data by fast Fourier transform.
- the heart rate variability index calculation unit 22 sets the threshold value DDTH relating to the dip depth inherent in the data to a value that is 2.5 times HFAMP (S24).
- S24 HFAMP
- the amplitude HFAMP of the high frequency component is calculated for each data. Therefore, DDTH is a data-specific threshold adapted to the data.
- the dip group identification unit 30 determines whether the dip i is a significant dip based on whether the dip depth Di is greater than the data specific threshold DDTH (S25). In the case of YES here, the dip group specifying unit 30 leaves the dip i as a significant dip (S26). The dip group left in S26 is a significant dip group. Subsequently, the dip group specifying unit 30 determines whether or not the dip i is the last dip of the RR interval time series data (S28). In the case of YES here, the process proceeds to S30 in FIG. On the other hand, in the case of NO in S28, the dip group specifying unit 30 specifies the next dip (S29) and returns to S25. Thereby, the dip depth Di and the data specific threshold value DDTH are compared for the next dip.
- the dip group identification unit 30 removes dip i (S27). Subsequently, the dip group specifying unit 30 determines whether or not the dip i is the last dip of the RR interval time series data (S28). In the case of YES here, the process proceeds to S30 in FIG. On the other hand, in the case of NO in S28, the dip group specifying unit 30 specifies the next dip (S29) and returns to S25.
- the calculation unit 38 calculates a dip width Wi at a height 2/3 of Di from the bottom of the dip. Subsequently, the dip group specifying unit 30 determines whether or not all of the following (Equation 3), (Equation 4), and (Equation 5) are satisfied for each dip (S31).
- the dip group specifying unit 30 determines whether the shapes of successive dip i and dip i + 1 are similar from the width and depth of the dip. If YES in S31, the dip group identification unit 30 leaves dip i and dip i + 1 (S32). The dip group remaining in S32 is a similar dip group.
- the dip group specifying unit 30 determines whether or not the dip i is the last dip of the RR interval time series data (S34). If YES here, the process proceeds to S36. On the other hand, in the case of NO in S34, the dip group specifying unit 30 specifies the next dip (S35), and returns to S31. In S31, the dip group specifying unit 30 determines whether there is similarity for the next dip.
- the dip group identification unit 30 removes dip i (S33). Subsequently, the dip group specifying unit 30 determines whether or not the dip i is the last dip of the RR interval time series data (S34). If YES here, the process proceeds to S36. On the other hand, in the case of NO in S34, the dip group specifying unit 30 specifies the next dip (S35), and returns to S31.
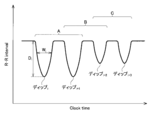
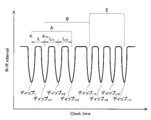
- FIG. 10 is a schematic diagram of RR interval time series data.
- a determination method for determining which dip is to be left after the dip group specifying unit 30 has finished the processing of S31 will be described in detail with reference to FIG. Dips i to i + 3 appear continuously in time series. Wi is the dip width of dip i. Di is the dip depth of dip i.
- the dip group specifying unit 30 determines the similarity of the combination A of dip i and dip i + 1. Subsequently, the similarity of the combination B of dip i + 1 and dip i + 2 is determined. Subsequently, the similarity of the combination C of dip i + 2 and dip i + 3 is determined.
- the dip group specifying unit 30 leaves both dip i and dip i + 1. Subsequently, when the combination B also satisfies the similarity, the dip group specifying unit 30 leaves the dip i + 1 and the dip i + 2. At this time, the dip i + 1 is left in both the processes of the combinations A and B. On the other hand, when the combination B does not satisfy the similarity, only the dip i + 2 is removed. The dip i + 1 that remains once in the combination A is not removed regardless of the result of the combination B.
- the dip group specifying unit 30 leaves the dip i + 2 and the dip i + 3. That is, dip i + 2 is removed in combination B but can remain in combination C.
- the calculation unit 38 calculates time differences Ii, Ii + 1, and Ii + 2 between two adjacent dips in the four consecutive dips in the dip group remaining in S34.
- the time difference Ii is a time difference between the center time di of the dip i and the center time di + 1 of the continuous dip i + 1.
- the dip group specifying unit 30 leaves four consecutive dip groups that satisfy all of the following (Expression 6), (Expression 7), and (Expression 8) (S38).
- the dip group specifying unit 30 determines whether or not the four dip groups forming the time differences Ii, Ii + 1, and Ii + 2 have periodicity based on the magnitude of the time difference and the variation in the magnitude of successive time differences. to decide.
- the dip group remaining in S38 is a periodic dip group.
- the CVHR shape measuring apparatus 2 detects the periodic dip group remaining in S38 as CVHR.
- FIG. 11 is a schematic diagram of RR interval time series data.
- a determination method for determining which dip group to leave in the processing of S38 by the dip group specifying unit 30 will be described in detail with reference to FIG.
- the dips i to i + 7 appear continuously in time series.
- the dip group specifying unit 30 determines the periodicity of the combination A composed of Ii to Ii + 2.
- the dip group specifying unit 30 determines the periodicity of the combination B composed of Ii + 1 to Ii + 3.
- the dip group specifying unit 30 determines by shifting the dip one by one in time series order, and determines the periodicity of the combination E composed of Ii + 4 to Ii + 6.
- the dip group specifying unit 30 leaves dip i to dip i + 3.
- the dip group specifying unit 30 leaves dip i + 1 to dip i + 4.
- dip i + 1 to dip i + 3 are left in the processing of both combinations A and B.
- the combination B does not satisfy the periodicity, only the dip i + 4 is removed from the dip i + 1 to the dip i + 4 constituting the combination B. Dips i + 1 to i + 3 once left in combination A are not removed regardless of the result of combination B.
- the dip group specifying unit 30 leaves all dip i + 4 to dip i + 7. That is, dip i + 4 is removed in combination B but can remain in combination E. Further, although there is a combination (not shown) between the combination B and the combination E, dip i + 4 to dip i + 7 are left when the combination E satisfies the periodicity regardless of the determination result.
- the ACV logarithm calculation unit 32 adds and averages all the CVHRs detected in S38, and calculates the logarithm of the CVHR amplitude (ACV) after the addition average.
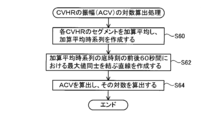
- FIG. 8 shows a flowchart of ACV logarithmic calculation processing. The ACV logarithm calculation unit 32 executes the processes (S60 to S64) of FIG.
- FIG. 12A shows n CVHRs detected in S38.
- the ACV logarithm calculation unit 32 adds and averages the segments s1, s2, s3,..., Sn for 60 seconds before and after the bottom times t1, t2, t3..., Tn of the n CVHRs detected in S38. To do. Specifically, the segments s1 to sn are aligned using the bottom times t1 to tn of the CVHR as anchor points, and all the segments s1 to sn are averaged for each time. Thereby, an addition average time series as shown by a solid line in FIG. 12B is created (S60). In FIG.
- the ACV logarithm calculation unit 32 creates a straight line L connecting the maximum value M1 of the addition average time series for 60 seconds before the base time and the maximum value M2 of the addition average time series for 60 seconds after the base time. (S62) (see the broken line in FIG. 12B).
- the ACV logarithm calculation unit 32 calculates the ACV by calculating the difference (distance) between the value of the addition average time series at the base time and the straight line L, and calculates the logarithm (S64).
- the FCV logarithm calculation unit 34 calculates the frequency per hour (FCV) of the CVHR detected in S38 and calculates the logarithm.
- the FCV logarithm calculation unit 34 preferably calculates the FCV from the bottom time of the first CVHR to the bottom time of the last CVHR in the RR interval time series data.
- FCV may be calculated as the average value per hour of the number of CVHRs that appear in the time from the bottom time of the first CVHR to the bottom time of the last CVHR, or the CVHR within a certain time interval. It may be calculated as a frequency per hour.
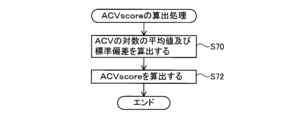
- FIG. 9 shows a flowchart of the ACVscore calculation process.
- the ACVscore calculation unit 36 executes the processes (S70 to S72) of FIG.
- the calculated logarithmic value of FCV is substituted, and the average value of the logarithm of ACV and the standard deviation of the logarithm of ACV are calculated (S70).
- the ACVscore calculating unit 36 calculates the logarithmic value of the ACV calculated in S40 (ln (ACV)) in the following (Equation 9) and the average value of the logarithm of ACV calculated in S70 (Mean (ln (ACV ))) And the standard deviation of the logarithm of ACV (SD (ln (ACV))) are substituted to calculate the corrected amplitude (ACVscore) (S72).
- ACVscore [ln (ACV) ⁇ Mean (ln (ACV))] / SD (ln (ACV)) ⁇ 1.0 + 5.0
- the display unit 44 displays the ACVscore calculated in S44 on the screen.
- the display unit 44 may display an ACVscore history, FCV (logarithmic value thereof), ACV logarithmic value calculated in S64, and / or a graph of the CVHR addition average time series created in S60, and the like. Good.
- the display unit 44 may display the appearance time of the CVHR together with the RR interval time series data, or together with the percutaneous arterial oxygen saturation (SpO 2 ) and other analysis results. May be.
- the display unit 44 may display a short time zone (for example, 30 minutes) in which the appearance frequency of CVHR is maximum, the appearance frequency of CVHR in the meantime, and the like.
- the audio output unit may announce ACVscore instead of the display unit 44.
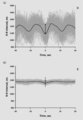
- FIGS. 13A and 13B show graphs D and E of CVHR addition average time series created in S60, respectively.
- Graph D in FIG. 13A is an example of a subject with a good prognosis
- graph E in FIG. 13B is an example of a subject who died one year later. Comparing the graph D and the graph E, the graph D vibrates greatly, while the graph E hardly vibrates. For this reason, the ACV of graph D is much larger than the ACV of graph E.
- ACV is an index before correction
- the comparison between the two is not completely fair, but the difference between the two ACVs is obvious, and subjects with a better prognosis than subjects who died after a certain period of time It can be seen that ACV (that is, the strength of the heartbeat response in apnea / hypopnea load) is large.
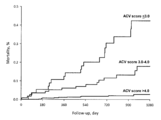
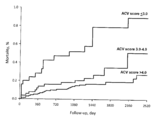
- FIGS. 14 (a) to (d) are Kaplan-Meier curves showing the relationship between ACVscore and mortality (Morality) of populations having the same disease state or condition.
- ACVscore has a strong relationship with various health risks other than mortality.
- the CVHR detecting means including the dip detecting unit 18 to the dip group specifying unit 30 detects heart rate periodic fluctuation (CVHR) is detected.
- the ACV logarithm calculation unit 32 measures the amplitude (ACV) of the CVHR and calculates the logarithm thereof.
- the magnitude of ACV and the degree of health risk (health risk) such as mortality within a predetermined period are closely related. For this reason, by referring to the ACV measured by the CVHR shape measuring apparatus 2, the human health risk can be predicted more accurately than before.
- the CVHR shape measuring apparatus 2 of this embodiment measures ACV by averaging each of a plurality of CVHRs. As a result, even when the shapes of the plurality of CVHRs are different, the reliability of the ACV is increased, and the strength of the human heartbeat response to the apnea load or the low respiratory load at bedtime is reflected more accurately. ACV can be obtained.
- the average value of the logarithm of ACV is proportional to the logarithm of FCV. For this reason, even if the ACVs of two subjects are the same, if the FCV of one subject is small and the FCV of the other subject is large, the health risk that the ACV value means is different.
- the ACVscore calculating unit 36 corrects the logarithmic value of the ACV calculated by the ACV logarithmic calculating unit 32 based on the logarithmic value of the FCV calculated by the FCV logarithmic calculating unit 34, and A finished amplitude (ACVscore) is calculated.
- ACVscore is a general-purpose index that is independent of the FCV value. For this reason, by using ACVscore, the health risk of the subject can be accurately predicted regardless of the FCV value. In addition, it is possible to accurately compare the health risks of subjects with significantly different FCVs.
- the function derived from the database for correction the versatility of the ACVscore can be improved.
- the database of this example accumulates 210,000 ACVs and FCVs of subjects suffering from various diseases such as acute myocardial infarction and end-stage renal failure, reliability is improved by using such a database.
- a high approximation function can be constructed.
- CVHR shape measuring apparatus 2 of the present embodiment data measured with a Holter electrocardiograph is used as RR interval time series data. For this reason, it is not necessary to be hospitalized for data acquisition as in the prior art, and data can be easily obtained.
- ACVscore can be obtained repeatedly in a non-invasive and safe manner in daily life. For this reason, by continuously measuring ACVscore and observing the transition of its value, CVHR shape measuring device can be used for treatment effects, lifestyle habits (drinking, smoking, etc.) or living environment (PM2.5, etc.). It can be used for the purpose of verifying the improvement effect.
- ACVscore can be used in the medical field as an indicator for health status, or can be used for own health management.
- ACVscore's predictive power of health risk is equal to or higher than predictive power of health risk when measuring 24-hour RR interval with Holter electrocardiograph etc. I found out. For this reason, if CVHR appears even once in the measurement data, data measurement for 24 hours becomes unnecessary.
- the CVHR shape measuring apparatus 2 of this embodiment uses the RR interval time series data at the time of bedtime, it is not necessary to wear a Holter electrocardiograph for 24 hours as in the prior art. This eliminates the trouble of wearing a Holter electrocardiograph during activities, makes it possible to measure data more easily and comfortably than before, and predicts health risks with accuracy equal to or higher than before.
- CVHR occurs with a very high probability of 96.9% for men and 96.0% for women.
- ACVscore can be calculated when CVHR occurs even once. For this reason, ACVscore is an index that can be measured by almost all subjects, and is highly convenient as an index.
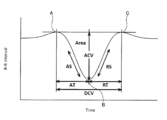
- FIG. 15 shows a smoothed CVHR waveform extracted from RR interval time-series data.
- the waveform of CVHR has points A, B, and C.
- Point B is a local minimum point.
- Point A is the local maximum point closest to point B, and appears before point B.
- Point C is the local maximum point closest to point B, and appears after point B.
- ACV is the distance between straight line AC and point B
- activation time AT Activation Time
- recovery time RT Recovery Time
- DCV Duration of Cyclic Variation
- AS activation slope
- RS recovery slope
- AS ACV / AT
- RS recovery slope
- the ratio of the amplitude of the CVHR waveform to the duration is defined as ACV / DCV
- the area of the CVHR waveform is defined as the size of the range surrounded by the CVHR waveform and the straight line AC.
- Tables 1 and 2 show each shape characteristic index (index) of the waveform of CVHR and the mortality risk by disease.
- HR indicates how many times the mortality rate is increased when each index decreases by one.
- the ⁇ 2 value indicates the high predictive power of mortality risk, and a larger value means higher predictive power.
- the significance probability P of indices other than FCV ie, natural logarithm of ACV, ACVscore, activation slope AS, recovery slope RS, ratio of amplitude to duration ACV / DCV, and area (Area)
- FCV significance probability
- Example 1 data was measured using a Holter electrocardiograph, but the apparatus used for data measurement is not limited to this.
- a bedside monitor, a sleep breathing disorder inspection device (CPAP device, etc.), a sensor combining a bedroom and bedding, a wristwatch sensor, a spectacle sensor, a clothing electrode, a tape sensor attached to the skin, or an implantable sensor Data may be measured using a sensor or the like.
- the heart rate or the pulse rate can be measured by various methods.
- heart rate or pulse rate is heart sound, blood vessel sound, skin temperature, body vibration, body center of gravity vibration, pulse wave (pressure, volume, blood flow velocity, tissue blood (hemoglobin absorption) amount, bioimpedance ) Or the like.
- the RR interval time series data at the time of bed is used, but the data used is not limited to that at the time of bed.
- CVHR can be detected, data at awakening may be used.
- human data is used.
- the present invention is not limited to human data, and data of animals (strictly, animals that breathe through the lungs) may be used. That is, the CVHR shape measuring device disclosed in the present specification may be intended for all animals that breathe through the lung, including humans.
- the CVHR shape measuring device 2 is connected to the RR interval measuring device via the communication line 14, but the present invention is not limited to this configuration.
- an algorithm for measuring ACV may be incorporated into a Holter electrocardiogram analyzer or a wearable pulse wave meter.
- the CVHR detection means is not limited to the method of the first embodiment.
- a known algorithm developed by the present inventors may be used.
- the CVHR detection method at least four CVHRs are detected as a group.
- an algorithm that can detect one CVHR may be used.
- the CVHR shape measuring device 2 may not include the display unit 44.
- the CVHR shape measuring apparatus 2 may be connected to another apparatus, and the ACV measurement result may be output from the other apparatus.
- the ACV calculation means is not limited to the method of the first embodiment.
- the ACV logarithm calculation unit 32 calculates the ACV by taking the average of the dip depths Di of all the CVHRs detected in S38 among the dip depths Di calculated by the dip depth calculation unit 20. May be.
- the ACV logarithm calculation unit 32 may execute the same processing as S62 for each CVHR. That is, the ACV logarithm calculation unit 32 may create a straight line connecting the maximum value for 60 seconds before the bottom time of the CVHR and the maximum value for 60 seconds after the bottom time of the CVHR. Then, the amplitude of the CVHR may be obtained by calculating the difference between the straight line and the value of the CVHR at the bottom time. This process may be performed for all CVHRs detected in S38, and the ACV may be calculated by taking the average of the respective amplitudes.
- ACV is corrected based on FCV.
- an index for example, AS, RS, ACV / DCV, or area
- These indices may be corrected based on elements other than FCV (for example, the width of CVHR).
- the dip recovery time RT may be used as an index for predicting the health risk.
Landscapes
- Health & Medical Sciences (AREA)
- Life Sciences & Earth Sciences (AREA)
- Engineering & Computer Science (AREA)
- Cardiology (AREA)
- Medical Informatics (AREA)
- Animal Behavior & Ethology (AREA)
- Pathology (AREA)
- Physics & Mathematics (AREA)
- Biomedical Technology (AREA)
- Heart & Thoracic Surgery (AREA)
- Veterinary Medicine (AREA)
- Molecular Biology (AREA)
- Surgery (AREA)
- Biophysics (AREA)
- General Health & Medical Sciences (AREA)
- Public Health (AREA)
- Physiology (AREA)
- Pulmonology (AREA)
- Signal Processing (AREA)
- Measuring Pulse, Heart Rate, Blood Pressure Or Blood Flow (AREA)
- Measurement Of The Respiration, Hearing Ability, Form, And Blood Characteristics Of Living Organisms (AREA)
- Measurement And Recording Of Electrical Phenomena And Electrical Characteristics Of The Living Body (AREA)
Priority Applications (2)
| Application Number | Priority Date | Filing Date | Title |
|---|---|---|---|
| US15/557,778 US20180070836A1 (en) | 2015-03-12 | 2016-01-05 | Cvhr shape measurement devices |
| DE112016001171.7T DE112016001171T5 (de) | 2015-03-12 | 2016-01-05 | CVHR-Formmessvorrichtung |
Applications Claiming Priority (2)
| Application Number | Priority Date | Filing Date | Title |
|---|---|---|---|
| JP2015-049863 | 2015-03-12 | ||
| JP2015049863A JP6372824B2 (ja) | 2015-03-12 | 2015-03-12 | Cvhr形状測定装置 |
Publications (1)
| Publication Number | Publication Date |
|---|---|
| WO2016143365A1 true WO2016143365A1 (ja) | 2016-09-15 |
Family
ID=56880042
Family Applications (1)
| Application Number | Title | Priority Date | Filing Date |
|---|---|---|---|
| PCT/JP2016/050154 Ceased WO2016143365A1 (ja) | 2015-03-12 | 2016-01-05 | Cvhr形状測定装置 |
Country Status (4)
| Country | Link |
|---|---|
| US (1) | US20180070836A1 (enExample) |
| JP (1) | JP6372824B2 (enExample) |
| DE (1) | DE112016001171T5 (enExample) |
| WO (1) | WO2016143365A1 (enExample) |
Cited By (2)
| Publication number | Priority date | Publication date | Assignee | Title |
|---|---|---|---|---|
| WO2020203935A1 (ja) * | 2019-04-03 | 2020-10-08 | 帝人株式会社 | 睡眠状態検出装置、睡眠状態検出方法及び睡眠状態検出プログラム |
| JP2020168212A (ja) * | 2019-04-03 | 2020-10-15 | 帝人株式会社 | 睡眠状態検出装置、睡眠状態検出方法及び睡眠状態検出プログラム |
Families Citing this family (1)
| Publication number | Priority date | Publication date | Assignee | Title |
|---|---|---|---|---|
| US20220399122A1 (en) * | 2019-11-01 | 2022-12-15 | Nec Corporation | Risk prediction apparatus, risk prediction method, and computer program |
Citations (3)
| Publication number | Priority date | Publication date | Assignee | Title |
|---|---|---|---|---|
| JP2003230541A (ja) * | 2002-02-08 | 2003-08-19 | Nippon Colin Co Ltd | 下肢上肢血圧指数測定装置 |
| JP2010051387A (ja) * | 2008-08-26 | 2010-03-11 | Nagoya City Univ | 睡眠呼吸障害の無呼吸発作又は低呼吸発作に伴うcvhrの検出装置 |
| US20100204586A1 (en) * | 2009-02-12 | 2010-08-12 | Cardionet, Inc. | Detecting Sleep Disorders Using Heart Activity |
-
2015
- 2015-03-12 JP JP2015049863A patent/JP6372824B2/ja active Active
-
2016
- 2016-01-05 US US15/557,778 patent/US20180070836A1/en not_active Abandoned
- 2016-01-05 DE DE112016001171.7T patent/DE112016001171T5/de not_active Withdrawn
- 2016-01-05 WO PCT/JP2016/050154 patent/WO2016143365A1/ja not_active Ceased
Patent Citations (3)
| Publication number | Priority date | Publication date | Assignee | Title |
|---|---|---|---|---|
| JP2003230541A (ja) * | 2002-02-08 | 2003-08-19 | Nippon Colin Co Ltd | 下肢上肢血圧指数測定装置 |
| JP2010051387A (ja) * | 2008-08-26 | 2010-03-11 | Nagoya City Univ | 睡眠呼吸障害の無呼吸発作又は低呼吸発作に伴うcvhrの検出装置 |
| US20100204586A1 (en) * | 2009-02-12 | 2010-08-12 | Cardionet, Inc. | Detecting Sleep Disorders Using Heart Activity |
Cited By (3)
| Publication number | Priority date | Publication date | Assignee | Title |
|---|---|---|---|---|
| WO2020203935A1 (ja) * | 2019-04-03 | 2020-10-08 | 帝人株式会社 | 睡眠状態検出装置、睡眠状態検出方法及び睡眠状態検出プログラム |
| JP2020168212A (ja) * | 2019-04-03 | 2020-10-15 | 帝人株式会社 | 睡眠状態検出装置、睡眠状態検出方法及び睡眠状態検出プログラム |
| JP7159099B2 (ja) | 2019-04-03 | 2022-10-24 | 帝人株式会社 | 睡眠状態検出装置、睡眠状態検出方法及び睡眠状態検出プログラム |
Also Published As
| Publication number | Publication date |
|---|---|
| DE112016001171T5 (de) | 2017-11-30 |
| JP6372824B2 (ja) | 2018-08-15 |
| US20180070836A1 (en) | 2018-03-15 |
| JP2016168188A (ja) | 2016-09-23 |
Similar Documents
| Publication | Publication Date | Title |
|---|---|---|
| JP6508417B2 (ja) | 睡眠現象のモニタリング | |
| KR101656611B1 (ko) | 무구속적으로 측정한 생체신호를 이용하여 산소탈포화지수를 획득하는 방법 | |
| Charlton et al. | Breathing rate estimation from the electrocardiogram and photoplethysmogram: A review | |
| US10492720B2 (en) | System and method for determining sleep stage | |
| EP1711104B1 (en) | Method and apparatus for ecg-derived sleep disordered breathing monitoring, detection and classification | |
| Khreis et al. | Breathing rate estimation using Kalman smoother with electrocardiogram and photoplethysmogram | |
| US9943237B2 (en) | Analysis of direct and indirect heartbeat data variations | |
| CN107072594B (zh) | 用于评估呼吸窘迫的方法和装置 | |
| JP5303802B2 (ja) | 心電図から導出された無呼吸/低呼吸指数 | |
| Dehkordi et al. | Pulse rate variability compared with heart rate variability in children with and without sleep disordered breathing | |
| CN109414204A (zh) | 用于确定针对对象的呼吸信息的方法和装置 | |
| JP5929020B2 (ja) | 意識状態推定装置及びプログラム | |
| US20160007870A1 (en) | A method of processing a signal representing a physiological rhythm | |
| CN110831492A (zh) | 用于确定睡眠统计数据的方法和装置 | |
| WO2017220526A1 (en) | A method and apparatus for determining respiratory information for a subject | |
| US10149647B2 (en) | Weaning readiness indicator, sleeping status recording device, and air providing system applying nonlinear time-frequency analysis | |
| Reddy et al. | Automated hilbert envelope based respiration rate measurement from PPG signal for wearable vital signs monitoring devices | |
| JP6372824B2 (ja) | Cvhr形状測定装置 | |
| JP6212943B2 (ja) | 複数のセンサを備えた生理学的適応性システム | |
| WO2017180617A1 (en) | Psychological acute stress measurement using a wireless sensor | |
| CN118873106B (zh) | 一种颈动脉-股动脉脉搏波速度确定方法及电子设备 | |
| JP2015109888A (ja) | 疲労の評価方法 | |
| McEvoy et al. | Contactless measurement of heart rate, heart rate variability and breathing rate based on facial video analysis | |
| Magdum | Development of graphical user interface for heart rate variability analysis of sleep-disordered breathing | |
| Charlton et al. | Breathing Rate Estimation from the Electrocardiogram and Photoplethysmogram: A |
Legal Events
| Date | Code | Title | Description |
|---|---|---|---|
| 121 | Ep: the epo has been informed by wipo that ep was designated in this application |
Ref document number: 16761337 Country of ref document: EP Kind code of ref document: A1 |
|
| DPE2 | Request for preliminary examination filed before expiration of 19th month from priority date (pct application filed from 20040101) | ||
| WWE | Wipo information: entry into national phase |
Ref document number: 112016001171 Country of ref document: DE Ref document number: 15557778 Country of ref document: US |
|
| 122 | Ep: pct application non-entry in european phase |
Ref document number: 16761337 Country of ref document: EP Kind code of ref document: A1 |