WO2016143365A1 - Cvhr shape measurement device - Google Patents
Cvhr shape measurement device Download PDFInfo
- Publication number
- WO2016143365A1 WO2016143365A1 PCT/JP2016/050154 JP2016050154W WO2016143365A1 WO 2016143365 A1 WO2016143365 A1 WO 2016143365A1 JP 2016050154 W JP2016050154 W JP 2016050154W WO 2016143365 A1 WO2016143365 A1 WO 2016143365A1
- Authority
- WO
- WIPO (PCT)
- Prior art keywords
- cvhr
- acv
- dip
- shape
- fcv
- Prior art date
Links
Images


Classifications
-
- A—HUMAN NECESSITIES
- A61—MEDICAL OR VETERINARY SCIENCE; HYGIENE
- A61B—DIAGNOSIS; SURGERY; IDENTIFICATION
- A61B5/00—Measuring for diagnostic purposes; Identification of persons
- A61B5/02—Detecting, measuring or recording pulse, heart rate, blood pressure or blood flow; Combined pulse/heart-rate/blood pressure determination; Evaluating a cardiovascular condition not otherwise provided for, e.g. using combinations of techniques provided for in this group with electrocardiography or electroauscultation; Heart catheters for measuring blood pressure
- A61B5/024—Detecting, measuring or recording pulse rate or heart rate
- A61B5/0245—Detecting, measuring or recording pulse rate or heart rate by using sensing means generating electric signals, i.e. ECG signals
-
- A—HUMAN NECESSITIES
- A61—MEDICAL OR VETERINARY SCIENCE; HYGIENE
- A61B—DIAGNOSIS; SURGERY; IDENTIFICATION
- A61B5/00—Measuring for diagnostic purposes; Identification of persons
- A61B5/02—Detecting, measuring or recording pulse, heart rate, blood pressure or blood flow; Combined pulse/heart-rate/blood pressure determination; Evaluating a cardiovascular condition not otherwise provided for, e.g. using combinations of techniques provided for in this group with electrocardiography or electroauscultation; Heart catheters for measuring blood pressure
- A61B5/024—Detecting, measuring or recording pulse rate or heart rate
- A61B5/02405—Determining heart rate variability
-
- A—HUMAN NECESSITIES
- A61—MEDICAL OR VETERINARY SCIENCE; HYGIENE
- A61B—DIAGNOSIS; SURGERY; IDENTIFICATION
- A61B5/00—Measuring for diagnostic purposes; Identification of persons
- A61B5/08—Detecting, measuring or recording devices for evaluating the respiratory organs
-
- A—HUMAN NECESSITIES
- A61—MEDICAL OR VETERINARY SCIENCE; HYGIENE
- A61B—DIAGNOSIS; SURGERY; IDENTIFICATION
- A61B5/00—Measuring for diagnostic purposes; Identification of persons
- A61B5/48—Other medical applications
- A61B5/4806—Sleep evaluation
- A61B5/4818—Sleep apnoea
Definitions
- the technology disclosed in this specification relates to an apparatus for measuring the amplitude of a heart rate periodic variation or a characteristic related thereto.
- the heart rate periodic variation is referred to as CVHR (cyclic variation of heart rate)
- ACV amplitude of cyclic variation
- Japanese Unexamined Patent Application Publication No. 2010-51387 discloses a technique for detecting CVHR associated with an apnea attack or a hypopnea attack of sleep respiratory disorder.
- the subject measures the frequency of CVHR (frequency of cyclic variation, FCV) per unit time of the subject (1 hour in the publication) using the technique, so that the subject is in obstructive sleep. It is said that it is possible to detect with high accuracy whether or not the patient is suffering from apnea syndrome (apnea sleep apnea syndrome, OSAS).
- FCV degree of health risk such as mortality within a predetermined period (hereinafter also referred to as health risk). That is, it has been found that FCV is insufficient as an index for predicting health risk.
- This specification discloses a technology that can more accurately predict the degree of health risk such as mortality within a predetermined period than before.
- the CVHR shape measuring device disclosed in the present specification includes CVHR detecting means and CVHR shape characteristic index acquiring means.
- the CVHR detecting means detects heart rate periodic fluctuation (CVHR) from data indicating a heartbeat or a pulse period or frequency in time series.
- the CVHR shape characteristic index acquisition unit obtains at least one of the following shape characteristic index: amplitude (ACV), slope, ratio of the amplitude to the duration, and area with respect to the CVHR waveform detected by the CVHR detection unit. get.
- the pulse is linked to the heartbeat. Therefore, in this specification, the periodic fluctuation of the pulse is also collectively referred to as “heart rate periodic fluctuation (CVHR)”.
- CVHR is defined as “a heart rate variability that appears periodically with an apnea or hypopnea attack during sleep”.
- CVHR is defined as “apnea or hypopnea. It is broadly defined as “Heart rate fluctuation”.
- heart rate variability associated with apnea or hypopnea not only during sleep but also during awakening is included as a CVHR-like phenomenon in a broad sense of CVHR. For this reason, CVHR in this specification is not restricted to what appears with the apnea attack or hypopnea attack which originates in sleep respiratory disorder.
- apnea or hypopnea in the present specification is not limited to those that occur naturally due to seizures, for example, artificially created by consciously stopping breathing or reducing the amount of breathing when waking Also included.
- the heart rate variability caused by this is also included in CVHR in a broad sense as a CVHR-like phenomenon.
- heart rate fluctuations caused by apnea or hypopnea are included in CVHR in a broad sense as a CVHR-like phenomenon without periodicity.
- physiological heart rate variability that is, heart rate variability other than heart rate variability caused by apnea or hypopnea is not included in CVHR.
- Each CVHR waveform has a first maximum value, a minimum value, and a second maximum value, respectively.
- the first maximum value is a point closest to the minimum value that appears earlier in the time series with respect to the minimum value
- the second maximum value is a minimum value that appears after the time series with respect to the minimum value. Is the closest point.
- the amplitude (ACV) is a distance between a straight line connecting the first maximum value and the second maximum value and the minimum value.
- the slope is obtained by dividing the amplitude by the elapsed time from the first maximum value to the minimum value and / or dividing the amplitude by the elapsed time from the minimum value to the second maximum value.
- the duration is an elapsed time from the first maximum value to the second maximum value. For this reason, the ratio of the amplitude to the duration is obtained by dividing the distance between the straight line connecting the first maximum value and the second maximum value and the minimum value by the elapsed time from the first maximum value to the second maximum value.
- the area is the size of a range surrounded by the CVHR waveform and a straight line connecting the first maximum value and the second maximum value.
- the “one CVHR” may be a CVHR obtained by one heart rate variability or a CVHR obtained by averaging a plurality of heart rate variability. Note that the CVHR shape characteristic index acquisition unit can acquire not only the amplitude (ACV) but also characteristics (for example, logarithm) related to ACV.
- CVHR is heart rate variability associated with apnea or hypopnea. For this reason, it can be said that the amplitude (ACV) of CVHR represents the strength of the heartbeat response to an apnea load or a low respiratory load.
- the other shape characteristic index (CVHR slope, ratio of amplitude to duration, area) is a value related to the strength of the heartbeat response to apnea load or hypopnea load.
- ACV ie, strength of heartbeat response to apnea / hypopnea load
- the degree of health risk such as mortality within a specified period (health risk) are greatly related.
- ACV can be a useful index to predict health risks. Specifically, the higher the ACV (ie, the stronger the heart rate response to apnea / hypopnea load), the lower the health risk, and the smaller the ACV (ie, the weaker heart rate response to apnea / hypopnea load). ) It has been found that health risks increase. It has also been found that other shape characteristic indexes (CVHR slope, ratio of amplitude to duration, area) can be useful indexes for predicting health risks. Specifically, the health risk decreases as the magnitude (absolute value) of the CVHR slope increases. In addition, the health risk decreases as the ratio of the amplitude of CVHR to the duration increases.
- the health risk decreases as the area of the CVHR increases.
- the CVHR detecting means detects CVHR
- the CVHR shape characteristic index obtaining means obtains at least one shape characteristic index of CVHR amplitude (ACV), slope, ratio of amplitude to duration, and area. get.
- the CVHR shape measuring apparatus can predict the health risk more accurately than before by referring to at least one of the shape property indexes acquired by the CVHR shape property index acquiring means.
- the health risk includes a morbidity rate, an onset rate, a recurrence rate (re-hospitalization rate), a disease progression degree, and the like in addition to the mortality rate within the predetermined period.
- the CVHR shape measuring device includes CVHR input means and CVHR shape characteristic index acquisition means.
- the CVHR input means inputs a periodically appearing heart rate periodic variation (CVHR) specified from data indicating a heartbeat or a pulse period or frequency in a time series.
- the CVHR shape characteristic index acquisition means obtains at least one of the following shape characteristic indices: amplitude (ACV), slope, ratio of the amplitude to the duration, and area with respect to the CVHR waveform input by the CVHR input means. get.
- This CVHR shape measuring apparatus does not detect CVHR. That is, CVHR detected outside the apparatus is input to the CVHR shape measuring apparatus. For this reason, it becomes possible to connect and use the CVHR shape measuring device with various devices capable of detecting CVHR.
- This computer program causes a computer to execute CVHR detection processing and CVHR shape characteristic index acquisition processing.
- CVHR detection process CVHR is detected from data indicating the period or frequency of the heartbeat or pulse in time series.
- CVHR shape characteristic index acquisition process the following shape characteristic index: amplitude (amplitude of cyclic variation, ACV), slope, ratio of the amplitude to the duration, and area with respect to the CVHR waveform detected in the CVHR detection process Get at least one of
- the present specification discloses another novel CVHR shape measuring apparatus that can solve the above-described problems.
- the CVHR shape measuring apparatus includes CVHR detection means, CVHR shape acquisition means, and evaluation means.
- the CVHR detecting means detects heart rate periodic fluctuation (CVHR) from data indicating a heartbeat or a pulse period or frequency in time series.
- the CVHR shape acquisition means acquires the waveform shape of the CVHR detected by the CVHR detection means.
- the evaluation means evaluates the health risk only from the shape of the CVHR acquired by the CVHR shape acquisition means. According to this CVHR shape measuring apparatus, the degree of health risk can be easily known.
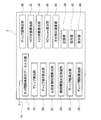
- FIG. 1 The block diagram which shows the structure of a CVHR shape measuring apparatus.
- (A) is a graph A showing the distribution of logarithmic values of ACV in a group having the same logarithmic value of FCV for each logarithmic value of FCV, and (b) is the logarithmic value of FCV in the graph of (a).
- a graph B showing the average relationship between the logarithmic values of ACV is shown, and
- (c) shows a graph C showing the relationship between the logarithmic value of FCV and the standard deviation of the logarithmic value of ACV in the graph of (a).
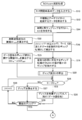
- FIG. 1 The flowchart of an ACVscore measurement process.
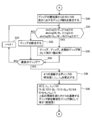
- FIG. 5 is a flowchart continued from FIG. 4.
- FIG. The flowchart following FIG. The flowchart of a dip depth calculation process.
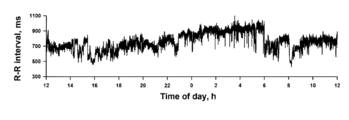
- RR interval time series data is schematically shown.
- RR interval time series data is schematically shown.
- (A) shows a state in which n CVHRs detected by the CVHR detection means are divided into n segments s1 to sn, and
- (b) is created by averaging the n segments s1 to sn.
- the average time series is shown.
- (A) shows the graph D of the addition average time series of the subject with a good prognosis
- (b) shows the graph E of the addition average time series of the subject who died one year later.
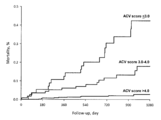
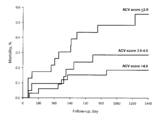
- Shown is a Kaplan-Meier curve of mortality in the population after ACVscore and acute myocardial infarction.
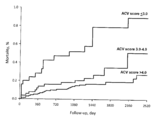
- Figure 6 shows Kaplan-Meier curves of mortality in another population after ACVscore and acute myocardial infarction.
- Figure 6 shows Kaplan-Meier curves of mortality in a population of ACVscore and end-stage renal failure hemodialysis patients.
- Figure 6 shows Kaplan-Meier curves of mortality in a population suffering from ACVscore and chronic heart failure. The figure for demonstrating each shape characteristic parameter
- the CVHR shape characteristic index acquisition unit performs ACV by averaging the data indicating the waveforms of a plurality of CVHR detected during a predetermined period of the data. At least one of the slope, the ratio of the amplitude to the duration, and the area may be acquired. Since the shape (waveform) of CVHR varies depending on the degree of breathing (apnea or hypopnea) or the duration of apnea or hypopnea, etc., there are variations in each shape characteristic index of each CVHR. For this reason, by adding and averaging a plurality of CVHR waveforms and obtaining each shape characteristic index of one CVHR waveform generated by the addition average, the reliability of each shape characteristic index is increased.
- the CVHR shape measuring apparatus disclosed in the present specification may further include an FCV acquisition unit and an ACV correction unit.
- the FCV acquisition unit may acquire the frequency (FCV) per unit time of the CVHR detected by the CVHR detection unit during a predetermined period.
- the ACV correction unit may correct the ACV based on the FCV value to obtain a corrected amplitude (ACVscore).
- FCVscore corrected amplitude
- FCVscore corrected amplitude
- FCVscore corrected amplitude
- the FCV acquisition unit can measure not only FCV but also characteristics related to FCV.
- the CVHR shape measuring device disclosed in the present specification can measure the amplitude (ACV) of the CVHR if CVHR occurs even once. That is, it is sufficient that even one CVHR appears in the data. If the period of the data exceeds the unit time, the FCV should be greater than 0 (eg, if the data period is 2 hours and the unit time is 1 hour, if one CVHR appears in the data, the FCV Becomes 0.5).
- the ACV correction unit uses the ACV acquired from the data during the predetermined period and the FCV acquired from the data during the predetermined period from which the ACV was acquired.
- the following two functions derived from a database accumulated in association with each other are used to correct ACV using an ACV average value function that is a function of FCV and a standard deviation function of ACV that is a function of FCV. There may be. From the average value obtained from the above average value function and the above standard deviation function, the ACV obtained by the CVHR shape characteristic index obtaining means corresponds to the FCV obtained from the data during the predetermined period from which the ACV was obtained. You may correct
- the “average value of ACV” means the average value of ACV of a plurality of subjects having the same FCV.
- the corrected amplitude (ACVscore) can be calculated as a kind of deviation value of ACV.
- the two functions may be a logarithmic value of FCV, an average value of logarithmic values of ACV, and a standard deviation of logarithmic values of ACV.
- the data may be data indicating any one of the RR interval, the pulse interval, and the heartbeat interval in time series. All of these data are data that can be easily acquired by a currently popular apparatus (for example, a Holter electrocardiograph, a wearable pulse wave meter, a heart rate rhythm meter, etc.). For this reason, it is not necessary to be hospitalized in order to acquire data, and data can be acquired easily.
- a currently popular apparatus for example, a Holter electrocardiograph, a wearable pulse wave meter, a heart rate rhythm meter, etc.
- the ACV value can be repeatedly measured safely and non-invasively in daily life. For this reason, the CVHR shape measuring device can be used as a means for managing health by itself.
- FIG. 1 is a block diagram showing the configuration of the CVHR shape measuring apparatus 2 of the present embodiment.
- the CVHR shape measuring apparatus 2 includes an RR interval time series data input unit 16, a dip detection unit 18, a dip depth calculation unit 20, a heart rate variability index calculation unit 22, an individual threshold value determination processing unit 24, and a dip width calculation unit 26.
- a dip interval calculation unit 28, a dip group specifying unit 30, an ACV logarithm calculation unit 32, an FCV logarithm calculation unit 34, an ACVscore calculation unit 36, other calculation units 38, a storage unit 40, an operation unit 42, and a display unit 44 are provided. Yes.
- the above-described units 16 to 38 and the like are realized when a computer mounted on the CVHR shape measuring apparatus 2 executes processing according to a program.
- the RR interval time series data input unit 16 is connected to the communication line 14.
- the communication line 14 is connected to an RR interval measuring device (in this embodiment, a Holter electrocardiograph).
- the RR interval time series data input unit 16 inputs human RR interval time series data measured and output by the RR interval measuring device.
- FIG. 2 shows an example of RR interval time series data. In FIG. 2, RR interval time-series data is measured over 24 hours.
- the dip detector 18 detects a plurality of local dip from the RR interval time series data. In the present embodiment, the dip detection unit 18 detects a plurality of local dips from the RR time-series data at the time of bed out of the 24-hour RR interval time-series data.
- bedtime means a time zone when the user is in the bed and may be awake.
- the bedtime may be specified by the subject's report. For example, 7 hours from 23:00 to 6am may be defined as a general bedtime.
- the data range input by the data input unit 16 is not limited to data for 24 hours, and may be, for example, data for 7 hours from 23:00 to next 6 o'clock.
- the dip detector 18 detects a dip group satisfying a predetermined dip shape from data such as a dip width and a dip depth. The dip detection method will be described in detail later.
- the dip depth calculation unit 20 calculates the depth of each dip group detected by the dip detection unit 18. A method for calculating the dip depth will be described in detail later.
- a polysomnograph may be used as the RR interval measuring device instead of the Holter electrocardiograph.
- RR interval time series data pulse interval time series data measured by a pulse wave meter may be used, or heart beat interval time series data measured by a heart rate meter may be used.
- a wearable pulse wave meter may be used as the pulse wave meter.
- the heart rate variability index calculation unit 22 calculates the amplitude of the high frequency component (0.15 Hz to 0.45 Hz) from the RR interval time series data.
- the heart rate variability index calculation unit 22 can extract a frequency component by any of the following calculation methods.
- the heart rate variability index calculation unit 22 may calculate the amplitude of the high frequency component by complex demodulation analysis.
- the heart rate variability index calculation unit 22 may calculate the amplitude of the high frequency component by fast Fourier transform or autoregressive analysis.
- the heart rate variability index calculation unit 22 may calculate the amplitude of the frequency component by wave bread transform or short-time Fourier transform.
- the heart rate variability index calculation unit 22 may calculate the root mean square of the difference value of the continuous RR interval as an estimated value of the amplitude of the high frequency component (root mean square of success difference).
- the individual threshold value determination processing unit 24 determines a data-specific threshold value regarding the depth of a dip that is a candidate for CVHR as a data-specific threshold value from the amplitude of the high-frequency component extracted by the heartbeat variability index calculating unit 22. In this embodiment, a value 2.5 times the amplitude of the high frequency component is adopted as the data specific threshold.
- the dip width calculation unit 26 calculates the width of each of the plurality of local dips (that is, the length of time in which each dip appears).
- the dip interval calculation unit 28 calculates the interval between each two consecutive dip. The dip interval is the time from the center value of the dip width to the center value of the dip width of the adjacent dip.
- the dip group identification unit 30 executes the following processes. (1) A dip group having a dip depth larger than the data specific threshold is specified as a significant dip group from a plurality of local dip. (2) A dip group having a predetermined similar shape is specified as a similar dip group from the significant dip groups specified in (1) above. (3) From among the similar dip groups identified in (2) above, a dip group that is continuous with a predetermined periodicity is identified as a periodic dip group. Each dip of the periodic dip group specified in (3) is CVHR.
- the dip group specified in the above (1) is called a significant dip group.
- the dip group specified in (2) above is called a similar dip group.
- the dip group specified in (3) above is called a periodic dip group.
- the dip detection unit 18, the dip depth calculation unit 20, the heart rate variability index calculation unit 22, the individual threshold value determination processing unit 24, the dip width calculation unit 26, the dip interval calculation unit 28, and the dip group specifying unit 30 are “CVHR”. It corresponds to an example of “detection means”.
- the ACV logarithm calculation unit 32 adds and averages each dip (CVHR waveform) of the periodic dip group identified by the dip group identification unit 30, and calculates the amplitude as the amplitude (ACV) of the heart rate periodic variation. The logarithm is calculated.
- the ACV logarithm calculation unit 32 corresponds to an example of “CVHR shape characteristic index acquisition unit”.
- the FCV logarithm calculation unit 34 calculates the frequency per hour (that is, FCV) of CVHR appearing in the RR interval time series data to be processed, and calculates the logarithm thereof.
- the FCV logarithm calculation unit 34 corresponds to an example of “FCV acquisition unit”.
- the ACVscore calculation unit 36 corrects the logarithmic value of the ACV calculated by the ACV logarithm calculation unit 32 based on the logarithmic value of the FCV calculated by the FCV logarithm calculation unit 34, and calculates the corrected amplitude (ACVscore).
- the ACVscore calculation unit 36 corresponds to an example of “ACV correction unit”.
- Graph A in FIG. 3A is a graph showing the distribution of the natural logarithm of ACV (hereinafter also simply referred to as the logarithm of ACV) for each value of the natural logarithm of FCV (hereinafter also simply referred to as the logarithm of FCV). is there.
- Graph A is created based on a large database in which Holter electrocardiogram data of 210,000 subjects are accumulated. “N of subject” in graph A indicates the number of subjects for each logarithmic value of FCV. The height of graph A represents the proportion of subjects with each logarithm of ACV in the population (210,000 cases).
- Graph B in FIG. 3B is a graph showing the average value (Mean) of the logarithm of ACV in graph A for each logarithmic value of FCV.
- the storage unit 40 (described later) stores the two functions f (x) and g (x).
- the ACVscore calculating unit 36 calculates ACVscore using functions f (x) and g (x) (described later).
- the other calculation part 38 performs various calculation processes other than the above. The arithmetic processing performed by the arithmetic unit 38 will be described in detail later.
- the storage unit 40 includes a ROM, an EEPROM, a RAM, and the like.
- the storage unit 40 can store various information.
- the storage unit 40 stores the two functions f (x) and g (x) described above.
- the storage unit 40 stores RR interval time series data input to the RR interval time series data input unit 16.
- the storage unit 40 stores the appearance time, width, and depth of each dip.
- the storage unit 40 stores various information regarding the dip group (that is, the waveform of CVHR) specified by the dip group specifying unit 30.
- the storage unit 40 stores the amplitude (ACV) of CVHR, the frequency per hour (FCV) of CVHR, and the corrected amplitude (ACVscore).
- the operation unit 42 has a plurality of keys. The user can input various information to each part of the CVHR shape measuring apparatus 2 by operating the operation unit 42.
- the display unit 44 can display various information on the screen.
- the contents of the ACVscore calculation process executed by the computer program installed in the CVHR shape measuring apparatus 2 will be described. 4 to 9 show flowcharts of the ACVscore calculation process.
- the RR interval time series data input unit 16 inputs RR interval time series data via the communication line 14 (S10).
- RR interval time series data input in S10 includes non-physiologic arrhythmias such as extrasystole and cardiac block, and data fluctuations due to artifacts. Therefore, the calculation unit 38 performs calculation processing for removing data fluctuations caused by non-physiologic arrhythmia and artifacts (S12). As a result, fluctuations in data caused by causes other than physiological heartbeat fluctuations and heartbeat fluctuations due to apnea and hypopnea can be eliminated.
- the calculation unit 38 interpolates RR interval time series data. For example, when step interpolation is performed, an interpolation function is used between each RR interval such that the function value takes a constant value equal to the value of the RR interval. Subsequently, the calculation unit 38 resamples the value of the interpolation function at a frequency of 2 Hz. Thus, RR interval time series data X (t) sampled at equal intervals is created. Subsequently, the dip detection unit 18 sets the time t at which the following (Equation 1) is satisfied for all T in the range of ⁇ 5 to 5 seconds on the time series data X (t), (S16).
- the dip detection unit 18 specifies the dip candidate as a dip when the vertex of the parabola inscribed in the dip candidate is smaller than the value of the parabola vertex inscribed in any of the dip candidates existing for 10 seconds before and after (S18). .
- the position where the parabola is inscribed in the dip specified by the dip detector 18 is the minimum value of the dip.
- the minimum value of the dip is also referred to as the bottom of the dip.
- the time when the bottom of the dip exists is also referred to as the dip bottom time.
- the dip depth calculation unit 20 calculates each dip depth Di in the plurality of local dip detected in S18. i is the ordinal number of the detected dip.
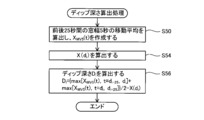
- FIG. 7 shows a flowchart of the calculation process of the dip depth Di.
- the dip depth calculation unit 20 executes the processing (S50 to S56) of FIG. 7 for each dip detected in S18.
- the dip depth calculation unit 20 calculates a moving average with a window width of 5 seconds for time-series data for 25 seconds before and after the center time of the dip.
- a time series obtained by correcting the phase shift of the obtained moving average value is defined as XMV5 (t) (S50).
- the center point of the dip in the time axis direction (X (di) is calculated at the central time di (S54).
- X (di) is a value near the bottom of the dip.
- the dip depth calculation unit 20 calculates the following ( The dip depth Di is calculated by the equation 2) (S56).
- the heart rate variability index calculation unit 22 calculates the amplitude HFAMP of the high frequency component (0.15 to 0.45 Hz) from the RR interval time series data by fast Fourier transform.
- the heart rate variability index calculation unit 22 sets the threshold value DDTH relating to the dip depth inherent in the data to a value that is 2.5 times HFAMP (S24).
- S24 HFAMP
- the amplitude HFAMP of the high frequency component is calculated for each data. Therefore, DDTH is a data-specific threshold adapted to the data.
- the dip group identification unit 30 determines whether the dip i is a significant dip based on whether the dip depth Di is greater than the data specific threshold DDTH (S25). In the case of YES here, the dip group specifying unit 30 leaves the dip i as a significant dip (S26). The dip group left in S26 is a significant dip group. Subsequently, the dip group specifying unit 30 determines whether or not the dip i is the last dip of the RR interval time series data (S28). In the case of YES here, the process proceeds to S30 in FIG. On the other hand, in the case of NO in S28, the dip group specifying unit 30 specifies the next dip (S29) and returns to S25. Thereby, the dip depth Di and the data specific threshold value DDTH are compared for the next dip.
- the dip group identification unit 30 removes dip i (S27). Subsequently, the dip group specifying unit 30 determines whether or not the dip i is the last dip of the RR interval time series data (S28). In the case of YES here, the process proceeds to S30 in FIG. On the other hand, in the case of NO in S28, the dip group specifying unit 30 specifies the next dip (S29) and returns to S25.
- the calculation unit 38 calculates a dip width Wi at a height 2/3 of Di from the bottom of the dip. Subsequently, the dip group specifying unit 30 determines whether or not all of the following (Equation 3), (Equation 4), and (Equation 5) are satisfied for each dip (S31).
- the dip group specifying unit 30 determines whether the shapes of successive dip i and dip i + 1 are similar from the width and depth of the dip. If YES in S31, the dip group identification unit 30 leaves dip i and dip i + 1 (S32). The dip group remaining in S32 is a similar dip group.
- the dip group specifying unit 30 determines whether or not the dip i is the last dip of the RR interval time series data (S34). If YES here, the process proceeds to S36. On the other hand, in the case of NO in S34, the dip group specifying unit 30 specifies the next dip (S35), and returns to S31. In S31, the dip group specifying unit 30 determines whether there is similarity for the next dip.
- the dip group identification unit 30 removes dip i (S33). Subsequently, the dip group specifying unit 30 determines whether or not the dip i is the last dip of the RR interval time series data (S34). If YES here, the process proceeds to S36. On the other hand, in the case of NO in S34, the dip group specifying unit 30 specifies the next dip (S35), and returns to S31.
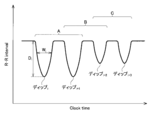
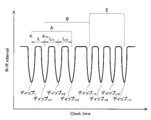
- FIG. 10 is a schematic diagram of RR interval time series data.
- a determination method for determining which dip is to be left after the dip group specifying unit 30 has finished the processing of S31 will be described in detail with reference to FIG. Dips i to i + 3 appear continuously in time series. Wi is the dip width of dip i. Di is the dip depth of dip i.
- the dip group specifying unit 30 determines the similarity of the combination A of dip i and dip i + 1. Subsequently, the similarity of the combination B of dip i + 1 and dip i + 2 is determined. Subsequently, the similarity of the combination C of dip i + 2 and dip i + 3 is determined.
- the dip group specifying unit 30 leaves both dip i and dip i + 1. Subsequently, when the combination B also satisfies the similarity, the dip group specifying unit 30 leaves the dip i + 1 and the dip i + 2. At this time, the dip i + 1 is left in both the processes of the combinations A and B. On the other hand, when the combination B does not satisfy the similarity, only the dip i + 2 is removed. The dip i + 1 that remains once in the combination A is not removed regardless of the result of the combination B.
- the dip group specifying unit 30 leaves the dip i + 2 and the dip i + 3. That is, dip i + 2 is removed in combination B but can remain in combination C.
- the calculation unit 38 calculates time differences Ii, Ii + 1, and Ii + 2 between two adjacent dips in the four consecutive dips in the dip group remaining in S34.
- the time difference Ii is a time difference between the center time di of the dip i and the center time di + 1 of the continuous dip i + 1.
- the dip group specifying unit 30 leaves four consecutive dip groups that satisfy all of the following (Expression 6), (Expression 7), and (Expression 8) (S38).
- the dip group specifying unit 30 determines whether or not the four dip groups forming the time differences Ii, Ii + 1, and Ii + 2 have periodicity based on the magnitude of the time difference and the variation in the magnitude of successive time differences. to decide.
- the dip group remaining in S38 is a periodic dip group.
- the CVHR shape measuring apparatus 2 detects the periodic dip group remaining in S38 as CVHR.
- FIG. 11 is a schematic diagram of RR interval time series data.
- a determination method for determining which dip group to leave in the processing of S38 by the dip group specifying unit 30 will be described in detail with reference to FIG.
- the dips i to i + 7 appear continuously in time series.
- the dip group specifying unit 30 determines the periodicity of the combination A composed of Ii to Ii + 2.
- the dip group specifying unit 30 determines the periodicity of the combination B composed of Ii + 1 to Ii + 3.
- the dip group specifying unit 30 determines by shifting the dip one by one in time series order, and determines the periodicity of the combination E composed of Ii + 4 to Ii + 6.
- the dip group specifying unit 30 leaves dip i to dip i + 3.
- the dip group specifying unit 30 leaves dip i + 1 to dip i + 4.
- dip i + 1 to dip i + 3 are left in the processing of both combinations A and B.
- the combination B does not satisfy the periodicity, only the dip i + 4 is removed from the dip i + 1 to the dip i + 4 constituting the combination B. Dips i + 1 to i + 3 once left in combination A are not removed regardless of the result of combination B.
- the dip group specifying unit 30 leaves all dip i + 4 to dip i + 7. That is, dip i + 4 is removed in combination B but can remain in combination E. Further, although there is a combination (not shown) between the combination B and the combination E, dip i + 4 to dip i + 7 are left when the combination E satisfies the periodicity regardless of the determination result.
- the ACV logarithm calculation unit 32 adds and averages all the CVHRs detected in S38, and calculates the logarithm of the CVHR amplitude (ACV) after the addition average.
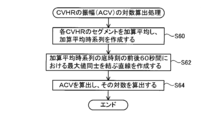
- FIG. 8 shows a flowchart of ACV logarithmic calculation processing. The ACV logarithm calculation unit 32 executes the processes (S60 to S64) of FIG.
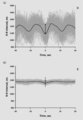
- FIG. 12A shows n CVHRs detected in S38.
- the ACV logarithm calculation unit 32 adds and averages the segments s1, s2, s3,..., Sn for 60 seconds before and after the bottom times t1, t2, t3..., Tn of the n CVHRs detected in S38. To do. Specifically, the segments s1 to sn are aligned using the bottom times t1 to tn of the CVHR as anchor points, and all the segments s1 to sn are averaged for each time. Thereby, an addition average time series as shown by a solid line in FIG. 12B is created (S60). In FIG.
- the ACV logarithm calculation unit 32 creates a straight line L connecting the maximum value M1 of the addition average time series for 60 seconds before the base time and the maximum value M2 of the addition average time series for 60 seconds after the base time. (S62) (see the broken line in FIG. 12B).
- the ACV logarithm calculation unit 32 calculates the ACV by calculating the difference (distance) between the value of the addition average time series at the base time and the straight line L, and calculates the logarithm (S64).
- the FCV logarithm calculation unit 34 calculates the frequency per hour (FCV) of the CVHR detected in S38 and calculates the logarithm.
- the FCV logarithm calculation unit 34 preferably calculates the FCV from the bottom time of the first CVHR to the bottom time of the last CVHR in the RR interval time series data.
- FCV may be calculated as the average value per hour of the number of CVHRs that appear in the time from the bottom time of the first CVHR to the bottom time of the last CVHR, or the CVHR within a certain time interval. It may be calculated as a frequency per hour.
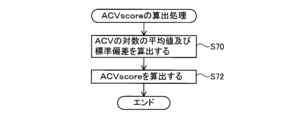
- FIG. 9 shows a flowchart of the ACVscore calculation process.
- the ACVscore calculation unit 36 executes the processes (S70 to S72) of FIG.
- the calculated logarithmic value of FCV is substituted, and the average value of the logarithm of ACV and the standard deviation of the logarithm of ACV are calculated (S70).
- the ACVscore calculating unit 36 calculates the logarithmic value of the ACV calculated in S40 (ln (ACV)) in the following (Equation 9) and the average value of the logarithm of ACV calculated in S70 (Mean (ln (ACV ))) And the standard deviation of the logarithm of ACV (SD (ln (ACV))) are substituted to calculate the corrected amplitude (ACVscore) (S72).
- ACVscore [ln (ACV) ⁇ Mean (ln (ACV))] / SD (ln (ACV)) ⁇ 1.0 + 5.0
- the display unit 44 displays the ACVscore calculated in S44 on the screen.
- the display unit 44 may display an ACVscore history, FCV (logarithmic value thereof), ACV logarithmic value calculated in S64, and / or a graph of the CVHR addition average time series created in S60, and the like. Good.
- the display unit 44 may display the appearance time of the CVHR together with the RR interval time series data, or together with the percutaneous arterial oxygen saturation (SpO 2 ) and other analysis results. May be.
- the display unit 44 may display a short time zone (for example, 30 minutes) in which the appearance frequency of CVHR is maximum, the appearance frequency of CVHR in the meantime, and the like.
- the audio output unit may announce ACVscore instead of the display unit 44.
- FIGS. 13A and 13B show graphs D and E of CVHR addition average time series created in S60, respectively.
- Graph D in FIG. 13A is an example of a subject with a good prognosis
- graph E in FIG. 13B is an example of a subject who died one year later. Comparing the graph D and the graph E, the graph D vibrates greatly, while the graph E hardly vibrates. For this reason, the ACV of graph D is much larger than the ACV of graph E.
- ACV is an index before correction
- the comparison between the two is not completely fair, but the difference between the two ACVs is obvious, and subjects with a better prognosis than subjects who died after a certain period of time It can be seen that ACV (that is, the strength of the heartbeat response in apnea / hypopnea load) is large.
- FIGS. 14 (a) to (d) are Kaplan-Meier curves showing the relationship between ACVscore and mortality (Morality) of populations having the same disease state or condition.
- ACVscore has a strong relationship with various health risks other than mortality.
- the CVHR detecting means including the dip detecting unit 18 to the dip group specifying unit 30 detects heart rate periodic fluctuation (CVHR) is detected.
- the ACV logarithm calculation unit 32 measures the amplitude (ACV) of the CVHR and calculates the logarithm thereof.
- the magnitude of ACV and the degree of health risk (health risk) such as mortality within a predetermined period are closely related. For this reason, by referring to the ACV measured by the CVHR shape measuring apparatus 2, the human health risk can be predicted more accurately than before.
- the CVHR shape measuring apparatus 2 of this embodiment measures ACV by averaging each of a plurality of CVHRs. As a result, even when the shapes of the plurality of CVHRs are different, the reliability of the ACV is increased, and the strength of the human heartbeat response to the apnea load or the low respiratory load at bedtime is reflected more accurately. ACV can be obtained.
- the average value of the logarithm of ACV is proportional to the logarithm of FCV. For this reason, even if the ACVs of two subjects are the same, if the FCV of one subject is small and the FCV of the other subject is large, the health risk that the ACV value means is different.
- the ACVscore calculating unit 36 corrects the logarithmic value of the ACV calculated by the ACV logarithmic calculating unit 32 based on the logarithmic value of the FCV calculated by the FCV logarithmic calculating unit 34, and A finished amplitude (ACVscore) is calculated.
- ACVscore is a general-purpose index that is independent of the FCV value. For this reason, by using ACVscore, the health risk of the subject can be accurately predicted regardless of the FCV value. In addition, it is possible to accurately compare the health risks of subjects with significantly different FCVs.
- the function derived from the database for correction the versatility of the ACVscore can be improved.
- the database of this example accumulates 210,000 ACVs and FCVs of subjects suffering from various diseases such as acute myocardial infarction and end-stage renal failure, reliability is improved by using such a database.
- a high approximation function can be constructed.
- CVHR shape measuring apparatus 2 of the present embodiment data measured with a Holter electrocardiograph is used as RR interval time series data. For this reason, it is not necessary to be hospitalized for data acquisition as in the prior art, and data can be easily obtained.
- ACVscore can be obtained repeatedly in a non-invasive and safe manner in daily life. For this reason, by continuously measuring ACVscore and observing the transition of its value, CVHR shape measuring device can be used for treatment effects, lifestyle habits (drinking, smoking, etc.) or living environment (PM2.5, etc.). It can be used for the purpose of verifying the improvement effect.
- ACVscore can be used in the medical field as an indicator for health status, or can be used for own health management.
- ACVscore's predictive power of health risk is equal to or higher than predictive power of health risk when measuring 24-hour RR interval with Holter electrocardiograph etc. I found out. For this reason, if CVHR appears even once in the measurement data, data measurement for 24 hours becomes unnecessary.
- the CVHR shape measuring apparatus 2 of this embodiment uses the RR interval time series data at the time of bedtime, it is not necessary to wear a Holter electrocardiograph for 24 hours as in the prior art. This eliminates the trouble of wearing a Holter electrocardiograph during activities, makes it possible to measure data more easily and comfortably than before, and predicts health risks with accuracy equal to or higher than before.
- CVHR occurs with a very high probability of 96.9% for men and 96.0% for women.
- ACVscore can be calculated when CVHR occurs even once. For this reason, ACVscore is an index that can be measured by almost all subjects, and is highly convenient as an index.
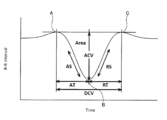
- FIG. 15 shows a smoothed CVHR waveform extracted from RR interval time-series data.
- the waveform of CVHR has points A, B, and C.
- Point B is a local minimum point.
- Point A is the local maximum point closest to point B, and appears before point B.
- Point C is the local maximum point closest to point B, and appears after point B.
- ACV is the distance between straight line AC and point B
- activation time AT Activation Time
- recovery time RT Recovery Time
- DCV Duration of Cyclic Variation
- AS activation slope
- RS recovery slope
- AS ACV / AT
- RS recovery slope
- the ratio of the amplitude of the CVHR waveform to the duration is defined as ACV / DCV
- the area of the CVHR waveform is defined as the size of the range surrounded by the CVHR waveform and the straight line AC.
- Tables 1 and 2 show each shape characteristic index (index) of the waveform of CVHR and the mortality risk by disease.
- HR indicates how many times the mortality rate is increased when each index decreases by one.
- the ⁇ 2 value indicates the high predictive power of mortality risk, and a larger value means higher predictive power.
- the significance probability P of indices other than FCV ie, natural logarithm of ACV, ACVscore, activation slope AS, recovery slope RS, ratio of amplitude to duration ACV / DCV, and area (Area)
- FCV significance probability
- Example 1 data was measured using a Holter electrocardiograph, but the apparatus used for data measurement is not limited to this.
- a bedside monitor, a sleep breathing disorder inspection device (CPAP device, etc.), a sensor combining a bedroom and bedding, a wristwatch sensor, a spectacle sensor, a clothing electrode, a tape sensor attached to the skin, or an implantable sensor Data may be measured using a sensor or the like.
- the heart rate or the pulse rate can be measured by various methods.
- heart rate or pulse rate is heart sound, blood vessel sound, skin temperature, body vibration, body center of gravity vibration, pulse wave (pressure, volume, blood flow velocity, tissue blood (hemoglobin absorption) amount, bioimpedance ) Or the like.
- the RR interval time series data at the time of bed is used, but the data used is not limited to that at the time of bed.
- CVHR can be detected, data at awakening may be used.
- human data is used.
- the present invention is not limited to human data, and data of animals (strictly, animals that breathe through the lungs) may be used. That is, the CVHR shape measuring device disclosed in the present specification may be intended for all animals that breathe through the lung, including humans.
- the CVHR shape measuring device 2 is connected to the RR interval measuring device via the communication line 14, but the present invention is not limited to this configuration.
- an algorithm for measuring ACV may be incorporated into a Holter electrocardiogram analyzer or a wearable pulse wave meter.
- the CVHR detection means is not limited to the method of the first embodiment.
- a known algorithm developed by the present inventors may be used.
- the CVHR detection method at least four CVHRs are detected as a group.
- an algorithm that can detect one CVHR may be used.
- the CVHR shape measuring device 2 may not include the display unit 44.
- the CVHR shape measuring apparatus 2 may be connected to another apparatus, and the ACV measurement result may be output from the other apparatus.
- the ACV calculation means is not limited to the method of the first embodiment.
- the ACV logarithm calculation unit 32 calculates the ACV by taking the average of the dip depths Di of all the CVHRs detected in S38 among the dip depths Di calculated by the dip depth calculation unit 20. May be.
- the ACV logarithm calculation unit 32 may execute the same processing as S62 for each CVHR. That is, the ACV logarithm calculation unit 32 may create a straight line connecting the maximum value for 60 seconds before the bottom time of the CVHR and the maximum value for 60 seconds after the bottom time of the CVHR. Then, the amplitude of the CVHR may be obtained by calculating the difference between the straight line and the value of the CVHR at the bottom time. This process may be performed for all CVHRs detected in S38, and the ACV may be calculated by taking the average of the respective amplitudes.
- ACV is corrected based on FCV.
- an index for example, AS, RS, ACV / DCV, or area
- These indices may be corrected based on elements other than FCV (for example, the width of CVHR).
- the dip recovery time RT may be used as an index for predicting the health risk.
Abstract
A cyclic variation of heart rate (CVHR) shape measurement device 2 is provided with CVHR detection means 18-30 and a CVHR shape property index acquisition means 32. The CVHR detection means 18-30 detect CVHR that appears periodically from time-series data showing the cycle or frequency of heart rate or pulse rate. The CVHR shape property index acquisition means 32 acquires at least one shape property index selected from among amplitude of cyclic variation (ACV), slope, ratio of ACV to duration and area, for the CVHR wave shape detected by the CVHR detection means.
Description
本明細書に開示する技術は、心拍数周期性変動の振幅又はこれに関連した特性を測定する装置に関する。なお、本明細書では、心拍数周期性変動をCVHR(cyclic variation of heart rate)と称し、心拍数周期性変動の振幅をACV(amplitude of cyclic variation)と称する。
The technology disclosed in this specification relates to an apparatus for measuring the amplitude of a heart rate periodic variation or a characteristic related thereto. In the present specification, the heart rate periodic variation is referred to as CVHR (cyclic variation of heart rate), and the amplitude of the heart rate periodic variation is referred to as ACV (amplitude of cyclic variation).
特開2010-51387号公報には、睡眠呼吸障害の無呼吸発作又は低呼吸発作に伴うCVHRを検出する技術が開示されている。特開2010-51387号公報では、当該技術を用いて被験者の単位時間(当該公報では1時間)当たりのCVHRの頻度(frequency of cyclic variation, FCV)を計測することにより、被験者が閉塞型睡眠時無呼吸症候群(obstructive sleep apnea syndrome, OSAS)に罹患しているか否かを高精度に検出できるとしている。
Japanese Unexamined Patent Application Publication No. 2010-51387 discloses a technique for detecting CVHR associated with an apnea attack or a hypopnea attack of sleep respiratory disorder. In Japanese Patent Laid-Open No. 2010-51387, the subject measures the frequency of CVHR (frequency of cyclic variation, FCV) per unit time of the subject (1 hour in the publication) using the technique, so that the subject is in obstructive sleep. It is said that it is possible to detect with high accuracy whether or not the patient is suffering from apnea syndrome (apnea sleep apnea syndrome, OSAS).
特開2010-51387号公報の技術では、CVHRを検出し、そのFCVを計測することで、睡眠時無呼吸症候群に罹患しているか否かを予測し、その重症度を推定する。しかしながら、発明者が鋭意研究した結果、FCVの多寡は、被験者の所定期間内における死亡率などの健康リスクの程度(以下、健康リスクとも称する)とはあまり関連性がないことが分かってきた。即ち、FCVは健康リスクを予測する指標としては不十分であることが分かってきた。
In the technology of Japanese Patent Application Laid-Open No. 2010-51387, CVHR is detected and its FCV is measured to predict whether or not the patient suffers from sleep apnea syndrome and to estimate its severity. However, as a result of intensive studies by the inventors, it has been found that the number of FCVs is not so much related to the degree of health risk such as mortality within a predetermined period (hereinafter also referred to as health risk). That is, it has been found that FCV is insufficient as an index for predicting health risk.
本明細書では、所定期間内における死亡率などの健康リスクの程度を従来よりも正確に予測できる技術を開示する。
This specification discloses a technology that can more accurately predict the degree of health risk such as mortality within a predetermined period than before.
本明細書が開示するCVHR形状測定装置は、CVHR検出手段と、CVHR形状特性指標取得手段と、を備える。CVHR検出手段は、心拍又は脈拍の周期又は周波数を時系列で示したデータから、心拍数周期性変動(CVHR)を検出する。CVHR形状特性指標取得手段は、CVHR検出手段で検出されたCVHRの波形に対して、次の形状特性指標:振幅(ACV)、傾き、持続時間に対する上記振幅の比、及び面積の少なくとも1つを取得する。なお、脈拍は、心拍と連動している。このため、本明細書では、脈拍の周期的な変動も「心拍数周期性変動(CVHR)」と総称する。
また、一般に、CVHRは、「睡眠時における無呼吸発作又は低呼吸発作に伴って周期的に出現する心拍変動」と定義されているが、本明細書では、CVHRを「無呼吸又は低呼吸に伴う心拍変動」と広義に定義する。即ち、本明細書では、睡眠時だけではなく覚醒時における無呼吸又は低呼吸に伴う心拍変動もCVHR様の現象として広義のCVHRに含むものとする。このため、本明細書におけるCVHRは、睡眠呼吸障害に起因して生じる無呼吸発作又は低呼吸発作に伴って現れるものに限られない。
また、本明細書における「無呼吸又は低呼吸」とは、発作により自然に生じるものに限定されず、例えば、覚醒時に意識的に呼吸を止めたり呼吸量を減らすなどして人為的に作り出したものも含まれる。これにより生じる心拍変動もCVHR様の現象として広義のCVHRに含むものとする。また、本明細書では、無呼吸又は低呼吸に伴い生じる心拍変動であれば、周期性がなくてもCVHR様の現象として広義のCVHRに含むものとする。別言すれば、本明細書では、生理的な心拍変動(即ち、無呼吸又は低呼吸に伴い生じる心拍変動以外の心拍変動)はCVHRに含まれない。 The CVHR shape measuring device disclosed in the present specification includes CVHR detecting means and CVHR shape characteristic index acquiring means. The CVHR detecting means detects heart rate periodic fluctuation (CVHR) from data indicating a heartbeat or a pulse period or frequency in time series. The CVHR shape characteristic index acquisition unit obtains at least one of the following shape characteristic index: amplitude (ACV), slope, ratio of the amplitude to the duration, and area with respect to the CVHR waveform detected by the CVHR detection unit. get. Note that the pulse is linked to the heartbeat. Therefore, in this specification, the periodic fluctuation of the pulse is also collectively referred to as “heart rate periodic fluctuation (CVHR)”.
In general, CVHR is defined as “a heart rate variability that appears periodically with an apnea or hypopnea attack during sleep”. In this specification, CVHR is defined as “apnea or hypopnea. It is broadly defined as “Heart rate fluctuation”. In other words, in this specification, heart rate variability associated with apnea or hypopnea not only during sleep but also during awakening is included as a CVHR-like phenomenon in a broad sense of CVHR. For this reason, CVHR in this specification is not restricted to what appears with the apnea attack or hypopnea attack which originates in sleep respiratory disorder.
In addition, “apnea or hypopnea” in the present specification is not limited to those that occur naturally due to seizures, for example, artificially created by consciously stopping breathing or reducing the amount of breathing when waking Also included. The heart rate variability caused by this is also included in CVHR in a broad sense as a CVHR-like phenomenon. Further, in this specification, heart rate fluctuations caused by apnea or hypopnea are included in CVHR in a broad sense as a CVHR-like phenomenon without periodicity. In other words, physiological heart rate variability (that is, heart rate variability other than heart rate variability caused by apnea or hypopnea) is not included in CVHR.
ここで、CVHRの各形状特性指標について説明する。個々のCVHRの波形は、それぞれ第1の極大値と、極小値と、第2の極大値を有する。第1の極大値は、極小値に対して時系列の先に出現する、極小値に最も近い点であり、第2の極大値は、極小値に対して時系列の後に出現する、極小値に最も近い点である。振幅(ACV)は、第1の極大値と第2の極大値を結ぶ直線と極小値との距離である。傾きは、振幅を、第1の極大値から極小値までの経過時間で除したもの、及び/又は振幅を、極小値から第2の極大値までの経過時間で除したものである。持続時間は、第1極大値から第2極大値までの経過時間である。このため、持続時間に対する振幅の比とは、第1の極大値と第2の極大値を結ぶ直線と極小値との距離を、第1極大値から第2極大値までの経過時間で除したものである。面積は、CVHRの波形と、第1の極大値と第2の極大値を結ぶ直線とによって囲まれた範囲の大きさである。なお、上記の「1つのCVHR」とは、1回の心拍変動によるCVHRでもよいし、複数回の心拍変動を平均したCVHRでもよい。なお、CVHR形状特性指標取得手段は、振幅(ACV)だけではなく、ACVに関連した特性(例えば、対数)も取得し得る。
Here, each shape characteristic index of CVHR will be described. Each CVHR waveform has a first maximum value, a minimum value, and a second maximum value, respectively. The first maximum value is a point closest to the minimum value that appears earlier in the time series with respect to the minimum value, and the second maximum value is a minimum value that appears after the time series with respect to the minimum value. Is the closest point. The amplitude (ACV) is a distance between a straight line connecting the first maximum value and the second maximum value and the minimum value. The slope is obtained by dividing the amplitude by the elapsed time from the first maximum value to the minimum value and / or dividing the amplitude by the elapsed time from the minimum value to the second maximum value. The duration is an elapsed time from the first maximum value to the second maximum value. For this reason, the ratio of the amplitude to the duration is obtained by dividing the distance between the straight line connecting the first maximum value and the second maximum value and the minimum value by the elapsed time from the first maximum value to the second maximum value. Is. The area is the size of a range surrounded by the CVHR waveform and a straight line connecting the first maximum value and the second maximum value. The “one CVHR” may be a CVHR obtained by one heart rate variability or a CVHR obtained by averaging a plurality of heart rate variability. Note that the CVHR shape characteristic index acquisition unit can acquire not only the amplitude (ACV) but also characteristics (for example, logarithm) related to ACV.
CVHRは、無呼吸又は低呼吸に伴う心拍変動である。このため、CVHRの振幅(ACV)は、無呼吸負荷又は低呼吸負荷に対する心拍応答の強さを表していると言える。また、その他の形状特性指標(CVHRの傾き、持続時間に対する振幅の比、面積)は、無呼吸負荷又は低呼吸負荷に対する心拍応答の強さに関連した値である。発明者が鋭意研究した結果、ACVの大きさ(即ち、無呼吸・低呼吸負荷に対する心拍応答の強さ)と所定期間内における死亡率などの健康リスクの程度(健康リスク)とは大きく関連しており、ACVが健康リスクを予測する有用な指標となり得ることが分かってきた。具体的には、ACVが大きいほど(即ち、無呼吸・低呼吸負荷に対する心拍応答が強いほど)健康リスクが低下し、ACVが小さいほど(即ち、無呼吸・低呼吸負荷に対する心拍応答が弱いほど)健康リスクが増加することが分かってきた。また、その他の形状特性指標(CVHRの傾き、持続時間に対する振幅の比、面積)に関しても、健康リスクを予測する有用な指標となり得ることが分かってきた。具体的には、CVHRの傾きの大きさ(絶対値)が大きいほど健康リスクが低下する。また、CVHRの持続時間に対する振幅の比が大きいほど健康リスクが低下する。また、CVHRの面積が大きいほど健康リスクが低下する。上記のCVHR形状測定装置では、CVHR検出手段がCVHRを検出し、CVHR形状特性指標取得手段がCVHRの振幅(ACV)、傾き、持続時間に対する振幅の比、及び面積の少なくとも1つの形状特性指標を取得する。CVHR形状測定装置は、CVHR形状特性指標取得手段が取得した形状特性指標の少なくとも1つを参照することにより、健康リスクを従来よりも正確に予測することができる。なお、健康リスクとは、上述した所定期間内における死亡率の他に、罹患率、発症率、再発率(再入院率)、疾患の進行度合いなどを含む。
CVHR is heart rate variability associated with apnea or hypopnea. For this reason, it can be said that the amplitude (ACV) of CVHR represents the strength of the heartbeat response to an apnea load or a low respiratory load. The other shape characteristic index (CVHR slope, ratio of amplitude to duration, area) is a value related to the strength of the heartbeat response to apnea load or hypopnea load. As a result of inventor's earnest research, the magnitude of ACV (ie, strength of heartbeat response to apnea / hypopnea load) and the degree of health risk such as mortality within a specified period (health risk) are greatly related. It has been found that ACV can be a useful index to predict health risks. Specifically, the higher the ACV (ie, the stronger the heart rate response to apnea / hypopnea load), the lower the health risk, and the smaller the ACV (ie, the weaker heart rate response to apnea / hypopnea load). ) It has been found that health risks increase. It has also been found that other shape characteristic indexes (CVHR slope, ratio of amplitude to duration, area) can be useful indexes for predicting health risks. Specifically, the health risk decreases as the magnitude (absolute value) of the CVHR slope increases. In addition, the health risk decreases as the ratio of the amplitude of CVHR to the duration increases. In addition, the health risk decreases as the area of the CVHR increases. In the CVHR shape measuring apparatus, the CVHR detecting means detects CVHR, and the CVHR shape characteristic index obtaining means obtains at least one shape characteristic index of CVHR amplitude (ACV), slope, ratio of amplitude to duration, and area. get. The CVHR shape measuring apparatus can predict the health risk more accurately than before by referring to at least one of the shape property indexes acquired by the CVHR shape property index acquiring means. The health risk includes a morbidity rate, an onset rate, a recurrence rate (re-hospitalization rate), a disease progression degree, and the like in addition to the mortality rate within the predetermined period.
また、本明細書は、上記の課題を解決することができる新規な別のCVHR形状測定装置を開示する。このCVHR形状測定装置は、CVHR入力手段と、CVHR形状特性指標取得手段と、を備える。CVHR入力手段は、心拍又は脈拍の周期又は周波数を時系列で示したデータから特定される、周期的に出現する心拍数周期性変動(CVHR)を入力する。CVHR形状特性指標取得手段は、CVHR入力手段で入力されたCVHRの波形に対して、次の形状特性指標:振幅(ACV)、傾き、持続時間に対する上記振幅の比、及び面積の少なくとも1つを取得する。このCVHR形状測定装置は、CVHRの検出を行わない。即ち、このCVHR形状測定装置には、装置の外部で検出されたCVHRが入力される。このため、CVHR形状測定装置を、CVHRを検出可能な種々の装置に接続して使用することが可能となる。
Also, the present specification discloses another novel CVHR shape measuring apparatus that can solve the above-described problems. The CVHR shape measuring device includes CVHR input means and CVHR shape characteristic index acquisition means. The CVHR input means inputs a periodically appearing heart rate periodic variation (CVHR) specified from data indicating a heartbeat or a pulse period or frequency in a time series. The CVHR shape characteristic index acquisition means obtains at least one of the following shape characteristic indices: amplitude (ACV), slope, ratio of the amplitude to the duration, and area with respect to the CVHR waveform input by the CVHR input means. get. This CVHR shape measuring apparatus does not detect CVHR. That is, CVHR detected outside the apparatus is input to the CVHR shape measuring apparatus. For this reason, it becomes possible to connect and use the CVHR shape measuring device with various devices capable of detecting CVHR.
また、本明細書は、上記の課題を解決することができる新規なコンピュータプログラムを開示する。このコンピュータプログラムは、CVHR検出処理と、CVHR形状特性指標取得処理と、をコンピュータに実行させる。CVHR検出処理は、心拍又は脈拍の周期又は周波数を時系列で示したデータからCVHRを検出する。CVHR形状特性指標取得処理は、CVHR検出処理で検出されたCVHRの波形に対して、次の形状特性指標:振幅(amplitude of cyclic variation,ACV)、傾き、持続時間に対する前記振幅の比、及び面積の少なくとも1つを取得する。このコンピュータプログラムを利用すると、所定期間内における死亡率などの健康リスクの程度を従来よりも正確に予測できるCVHR形状測定装置を実現できる。
Also, the present specification discloses a novel computer program that can solve the above problems. This computer program causes a computer to execute CVHR detection processing and CVHR shape characteristic index acquisition processing. In the CVHR detection process, CVHR is detected from data indicating the period or frequency of the heartbeat or pulse in time series. In the CVHR shape characteristic index acquisition process, the following shape characteristic index: amplitude (amplitude of cyclic variation, ACV), slope, ratio of the amplitude to the duration, and area with respect to the CVHR waveform detected in the CVHR detection process Get at least one of By using this computer program, it is possible to realize a CVHR shape measuring apparatus capable of predicting the degree of health risk such as mortality within a predetermined period more accurately than before.
また、本明細書は、上記の課題を解決することができる新規な別のCVHR形状測定装置を開示する。このCVHR形状測定装置は、CVHR検出手段と、CVHR形状取得手段と、評価手段と、を備える。CVHR検出手段は、心拍又は脈拍の周期又は周波数を時系列で示したデータから、心拍数周期性変動(CVHR)を検出する。CVHR形状取得手段は、CVHR検出手段で検出された前記CVHRの波形の形状を取得する。評価手段は、CVHR形状取得手段で取得された前記CVHRの形状のみから健康リスクを評価する。このCVHR形状測定装置によると、健康リスクの程度を容易に知ることができる。
Also, the present specification discloses another novel CVHR shape measuring apparatus that can solve the above-described problems. The CVHR shape measuring apparatus includes CVHR detection means, CVHR shape acquisition means, and evaluation means. The CVHR detecting means detects heart rate periodic fluctuation (CVHR) from data indicating a heartbeat or a pulse period or frequency in time series. The CVHR shape acquisition means acquires the waveform shape of the CVHR detected by the CVHR detection means. The evaluation means evaluates the health risk only from the shape of the CVHR acquired by the CVHR shape acquisition means. According to this CVHR shape measuring apparatus, the degree of health risk can be easily known.
本明細書が開示する技術の詳細、及び、さらなる改良は、発明を実施するための形態、及び、実施例にて詳しく説明する。
Details of the technology disclosed in the present specification and further improvements will be described in detail in embodiments and examples for carrying out the invention.
以下に説明する実施例の主要な特徴を列記しておく。なお、以下に記載する技術要素は、それぞれ独立した技術要素であって、単独であるいは各種の組合せによって技術的有用性を発揮するものであり、出願時請求項記載の組合せに限定されるものではない。
The main features of the embodiment described below are listed. The technical elements described below are independent technical elements and exhibit technical usefulness alone or in various combinations, and are not limited to the combinations described in the claims at the time of filing. Absent.
本明細書が開示するCVHR形状測定装置では、CVHR形状特性指標取得手段が、上記データの所定の期間中に検出された複数のCVHRのそれぞれの波形を示す上記データを加算平均することによりACV、傾き、持続時間に対する上記振幅の比、及び面積の少なくとも1つを取得してもよい。CVHRの形状(波形)は、呼吸の程度(無呼吸もしくは低呼吸)又は無呼吸もしくは低呼吸の持続期間等により変動するため、個々のCVHRの各形状特性指標にはばらつきがある。このため、複数のCVHRの波形を加算平均し、加算平均により生成された1つのCVHRの波形の各形状特性指標を取得することにより、各形状特性指標の信頼性が高くなる。
In the CVHR shape measuring apparatus disclosed in this specification, the CVHR shape characteristic index acquisition unit performs ACV by averaging the data indicating the waveforms of a plurality of CVHR detected during a predetermined period of the data. At least one of the slope, the ratio of the amplitude to the duration, and the area may be acquired. Since the shape (waveform) of CVHR varies depending on the degree of breathing (apnea or hypopnea) or the duration of apnea or hypopnea, etc., there are variations in each shape characteristic index of each CVHR. For this reason, by adding and averaging a plurality of CVHR waveforms and obtaining each shape characteristic index of one CVHR waveform generated by the addition average, the reliability of each shape characteristic index is increased.
本明細書が開示するCVHR形状測定装置は、FCV取得手段と、ACV補正手段と、をさらに備えていてもよい。FCV取得手段は、所定の期間中にCVHR検出手段で検出されたCVHRの単位時間当たりの頻度(FCV)を取得してもよい。ACV補正手段は、ACVをFCVの値に基づいて補正して、補正済振幅(ACVscore)を取得してもよい。本発明者の研究によると、ACVはFCVと相関する。このため、ACVをFCVの値に基づいて補正することにより、補正後のACVである補正済振幅(ACVscore)は、FCVの値から独立した、汎用的な指標として機能する。従って、健康リスクをさらに正確に予測できる。なお、FCV取得手段は、FCVだけではなく、FCVに関連した特性も測定し得る。
また、本明細書が開示するCVHR形状測定装置は、CVHRが1度でも生じれば当該CVHRの振幅(ACV)を測定できる。即ち、上記データにCVHRが1つでも出現していればよい。上記データの期間が上記単位時間を超える場合は、FCVは0より大きければよい(例:データの期間が2時間で、単位時間が1時間の場合、当該データに1つのCVHRが出現すると、FCVは0.5となる)。 The CVHR shape measuring apparatus disclosed in the present specification may further include an FCV acquisition unit and an ACV correction unit. The FCV acquisition unit may acquire the frequency (FCV) per unit time of the CVHR detected by the CVHR detection unit during a predetermined period. The ACV correction unit may correct the ACV based on the FCV value to obtain a corrected amplitude (ACVscore). According to the inventor's work, ACV correlates with FCV. Therefore, by correcting the ACV based on the FCV value, the corrected amplitude (ACVscore), which is the corrected ACV, functions as a general-purpose index that is independent of the FCV value. Therefore, the health risk can be predicted more accurately. The FCV acquisition unit can measure not only FCV but also characteristics related to FCV.
Further, the CVHR shape measuring device disclosed in the present specification can measure the amplitude (ACV) of the CVHR if CVHR occurs even once. That is, it is sufficient that even one CVHR appears in the data. If the period of the data exceeds the unit time, the FCV should be greater than 0 (eg, if the data period is 2 hours and the unit time is 1 hour, if one CVHR appears in the data, the FCV Becomes 0.5).
本明細書が開示するCVHR形状測定装置では、ACV補正手段が、所定の期間中のデータから取得されたACVと、そのACVを取得した上記の所定の期間中のデータから取得されたFCVとを関連付けて複数組蓄積されたデータベースから導き出された次の2つの関数:FCVの関数であるACVの平均値関数、及びFCVの関数であるACVの標準偏差関数を用いて、ACVを補正するものであってもよい。CVHR形状特性指標取得手段で取得されたACVを、そのACVを取得した所定の期間中のデータから取得されたFCVに対応する、上記の平均値関数から得られる平均値及び上記の標準偏差関数から得られる標準偏差を用いて補正してもよい。なお、本明細書における「ACVの平均値」とは、同一のFCVを有する複数の被験者のACVの平均値を意味する。この構成によると、補正済振幅(ACVscore)を、ACVの一種の偏差値として算出することができる。データベースから導き出された関数を補正に用いることで、ACVscoreの汎用性を向上することができる。なお、上記2つの関数は、それぞれFCVの対数値、ACVの対数値の平均値、及びACVの対数値の標準偏差であってもよい。
In the CVHR shape measuring apparatus disclosed in the present specification, the ACV correction unit uses the ACV acquired from the data during the predetermined period and the FCV acquired from the data during the predetermined period from which the ACV was acquired. The following two functions derived from a database accumulated in association with each other are used to correct ACV using an ACV average value function that is a function of FCV and a standard deviation function of ACV that is a function of FCV. There may be. From the average value obtained from the above average value function and the above standard deviation function, the ACV obtained by the CVHR shape characteristic index obtaining means corresponds to the FCV obtained from the data during the predetermined period from which the ACV was obtained. You may correct | amend using the obtained standard deviation. In the present specification, the “average value of ACV” means the average value of ACV of a plurality of subjects having the same FCV. According to this configuration, the corrected amplitude (ACVscore) can be calculated as a kind of deviation value of ACV. By using the function derived from the database for correction, the versatility of the ACVscore can be improved. The two functions may be a logarithmic value of FCV, an average value of logarithmic values of ACV, and a standard deviation of logarithmic values of ACV.
本明細書が開示するCVHR形状測定装置では、データが、R-R間隔、脈拍間隔、心拍動間隔のいずれかを時系列で示したデータであってもよい。これらのデータはいずれも現在普及している装置(例えば、ホルター心電計、ウェアラブルな脈波計、心拍動計等)で容易に取得可能なデータである。このため、データを取得するために入院したりする必要がなく、手軽にデータを取得できる。上記のCVHR形状測定装置を用いることで、ACVの値を、日常生活において無侵襲かつ安全に繰り返し測定することができる。このため、CVHR形状測定装置を自身で健康を管理する手段として利用することができる。
In the CVHR shape measuring apparatus disclosed in this specification, the data may be data indicating any one of the RR interval, the pulse interval, and the heartbeat interval in time series. All of these data are data that can be easily acquired by a currently popular apparatus (for example, a Holter electrocardiograph, a wearable pulse wave meter, a heart rate rhythm meter, etc.). For this reason, it is not necessary to be hospitalized in order to acquire data, and data can be acquired easily. By using the above CVHR shape measuring apparatus, the ACV value can be repeatedly measured safely and non-invasively in daily life. For this reason, the CVHR shape measuring device can be used as a means for managing health by itself.
図面を参照して実施例を説明する。図1は、本実施例のCVHR形状測定装置2の構成を示すブロック図である。CVHR形状測定装置2は、R-R間隔時系列データ入力部16とディップ検出部18とディップ深さ算出部20と心拍変動指標算出部22と個別閾値決定処理部24とディップ幅算出部26とディップ間隔算出部28とディップ群特定部30とACV対数算出部32とFCV対数算出部34とACVscore算出部36とその他の演算部38と記憶部40と操作部42と表示部44とを備えている。なお、CVHR形状測定装置2に搭載されているコンピュータがプログラムに従って処理を実行することによって、上記の各部16~38等が実現される。
Embodiments will be described with reference to the drawings. FIG. 1 is a block diagram showing the configuration of the CVHR shape measuring apparatus 2 of the present embodiment. The CVHR shape measuring apparatus 2 includes an RR interval time series data input unit 16, a dip detection unit 18, a dip depth calculation unit 20, a heart rate variability index calculation unit 22, an individual threshold value determination processing unit 24, and a dip width calculation unit 26. A dip interval calculation unit 28, a dip group specifying unit 30, an ACV logarithm calculation unit 32, an FCV logarithm calculation unit 34, an ACVscore calculation unit 36, other calculation units 38, a storage unit 40, an operation unit 42, and a display unit 44 are provided. Yes. The above-described units 16 to 38 and the like are realized when a computer mounted on the CVHR shape measuring apparatus 2 executes processing according to a program.
R-R間隔時系列データ入力部16は、通信回線14に接続されている。通信回線14は、R-R間隔測定装置(本実施例ではホルター心電計)に接続されている。R-R間隔時系列データ入力部16は、R-R間隔測定装置によって測定されて出力された人間のR-R間隔時系列データを入力する。図2は、R-R間隔時系列データの一例を示す。図2では、R-R間隔時系列データが24時間に亘って測定されている。ディップ検出部18は、R-R間隔時系列データから複数の局所的ディップを検出する。本実施例では、ディップ検出部18は、24時間のR-R間隔時系列データのうち、就床時のR-R時系列データから複数の局所的ディップを検出する。なお、就床時とは寝床に入っている時間帯を意味するものであり、覚醒状態であってもよいことに注意されたい。また、就床時は、被験者の申告により特定してもよいし、例えば23時~翌6時までの7時間を一般的な就床時として定義してもよい。上記の説明から明らかなように、データ入力部16が入力するデータ範囲は24時間のデータに限られず、例えば23時から翌6時までの7時間のデータであってもよい。ディップ検出部18は、ディップ幅及びディップ深さ等のデータから、所定のディップ形状を満たすディップ群を検出する。ディップの検出方法については、後で詳しく説明する。ディップ深さ算出部20は、ディップ検出部18によって検出されたディップ群のそれぞれの深さを算出する。ディップ深さを算出する方法については、後で詳しく説明する。なお、R-R間隔測定装置として、ホルター心電計の代わりに睡眠ポリグラフを用いてもよい。また、R-R間隔時系列データの代わりに、脈波計により測定された脈拍間隔時系列データを用いてもよいし、心拍動計により測定された心拍動間隔時系列データを用いてもよい。脈波計には、例えばウェアラブルな脈波計を用いてもよい。
The RR interval time series data input unit 16 is connected to the communication line 14. The communication line 14 is connected to an RR interval measuring device (in this embodiment, a Holter electrocardiograph). The RR interval time series data input unit 16 inputs human RR interval time series data measured and output by the RR interval measuring device. FIG. 2 shows an example of RR interval time series data. In FIG. 2, RR interval time-series data is measured over 24 hours. The dip detector 18 detects a plurality of local dip from the RR interval time series data. In the present embodiment, the dip detection unit 18 detects a plurality of local dips from the RR time-series data at the time of bed out of the 24-hour RR interval time-series data. Note that bedtime means a time zone when the user is in the bed and may be awake. The bedtime may be specified by the subject's report. For example, 7 hours from 23:00 to 6am may be defined as a general bedtime. As is clear from the above description, the data range input by the data input unit 16 is not limited to data for 24 hours, and may be, for example, data for 7 hours from 23:00 to next 6 o'clock. The dip detector 18 detects a dip group satisfying a predetermined dip shape from data such as a dip width and a dip depth. The dip detection method will be described in detail later. The dip depth calculation unit 20 calculates the depth of each dip group detected by the dip detection unit 18. A method for calculating the dip depth will be described in detail later. A polysomnograph may be used as the RR interval measuring device instead of the Holter electrocardiograph. Instead of RR interval time series data, pulse interval time series data measured by a pulse wave meter may be used, or heart beat interval time series data measured by a heart rate meter may be used. . For example, a wearable pulse wave meter may be used as the pulse wave meter.
心拍変動指標算出部22は、R-R間隔時系列データから高周波数成分(0.15Hz~0.45Hz)の振幅を算出する。心拍変動指標算出部22は、以下に示す演算方法のいずれかによって周波数成分を抽出することができる。例えば心拍変動指標算出部22は、複素復調分析によって高周波数成分の振幅を算出してもよい。また、心拍変動指標算出部22は、高速フーリエ変換又は自己回帰分析によって高周波数成分の振幅を算出してもよい。心拍変動指標算出部22は、ウェイブレッド変換又は短時間フーリエ変換によって周波数成分の振幅を算出してもよい。心拍変動指標算出部22は、高周波数成分の振幅の推定値として連続するR-R間隔の差分値の自乗平均(root mean square of successive difference)を算出してもよい。
The heart rate variability index calculation unit 22 calculates the amplitude of the high frequency component (0.15 Hz to 0.45 Hz) from the RR interval time series data. The heart rate variability index calculation unit 22 can extract a frequency component by any of the following calculation methods. For example, the heart rate variability index calculation unit 22 may calculate the amplitude of the high frequency component by complex demodulation analysis. The heart rate variability index calculation unit 22 may calculate the amplitude of the high frequency component by fast Fourier transform or autoregressive analysis. The heart rate variability index calculation unit 22 may calculate the amplitude of the frequency component by wave bread transform or short-time Fourier transform. The heart rate variability index calculation unit 22 may calculate the root mean square of the difference value of the continuous RR interval as an estimated value of the amplitude of the high frequency component (root mean square of success difference).
個別閾値決定処理部24は、心拍変動指標算出部22によって抽出された高周波数成分の振幅から、CVHRの候補となるディップの深さに関するデータ固有の閾値を、データ固有閾値として決定する。この実施例では、高周波数成分の振幅の2.5倍の値を、データ固有閾値として採用している。ディップ幅算出部26は、複数の局所的ディップのそれぞれの幅(即ち各ディップが出現している時間の長さ)を算出する。ディップ間隔算出部28は、連続する各2つのディップの間隔を算出する。ディップ間隔は、ディップ幅の中心値から、隣接するディップのディップ幅の中心値までの時間である。
The individual threshold value determination processing unit 24 determines a data-specific threshold value regarding the depth of a dip that is a candidate for CVHR as a data-specific threshold value from the amplitude of the high-frequency component extracted by the heartbeat variability index calculating unit 22. In this embodiment, a value 2.5 times the amplitude of the high frequency component is adopted as the data specific threshold. The dip width calculation unit 26 calculates the width of each of the plurality of local dips (that is, the length of time in which each dip appears). The dip interval calculation unit 28 calculates the interval between each two consecutive dip. The dip interval is the time from the center value of the dip width to the center value of the dip width of the adjacent dip.
ディップ群特定部30は、以下の各処理を実行する。
(1)複数の局所的ディップの中から、データ固有閾値よりも大きいディップ深さを有しているディップ群を、有意ディップ群として特定する。
(2)上記の(1)で特定された有意ディップ群の中から、所定の類似の形状を有しているディップ群を類似ディップ群として特定する。
(3)上記の(2)で特定された類似ディップ群の中から、所定の周期性を持って連続しているディップ群を周期性ディップ群として特定する。
(3)で特定された周期性ディップ群のそれぞれのディップがCVHRである。 The dipgroup identification unit 30 executes the following processes.
(1) A dip group having a dip depth larger than the data specific threshold is specified as a significant dip group from a plurality of local dip.
(2) A dip group having a predetermined similar shape is specified as a similar dip group from the significant dip groups specified in (1) above.
(3) From among the similar dip groups identified in (2) above, a dip group that is continuous with a predetermined periodicity is identified as a periodic dip group.
Each dip of the periodic dip group specified in (3) is CVHR.
(1)複数の局所的ディップの中から、データ固有閾値よりも大きいディップ深さを有しているディップ群を、有意ディップ群として特定する。
(2)上記の(1)で特定された有意ディップ群の中から、所定の類似の形状を有しているディップ群を類似ディップ群として特定する。
(3)上記の(2)で特定された類似ディップ群の中から、所定の周期性を持って連続しているディップ群を周期性ディップ群として特定する。
(3)で特定された周期性ディップ群のそれぞれのディップがCVHRである。 The dip
(1) A dip group having a dip depth larger than the data specific threshold is specified as a significant dip group from a plurality of local dip.
(2) A dip group having a predetermined similar shape is specified as a similar dip group from the significant dip groups specified in (1) above.
(3) From among the similar dip groups identified in (2) above, a dip group that is continuous with a predetermined periodicity is identified as a periodic dip group.
Each dip of the periodic dip group specified in (3) is CVHR.
上記の(1)ではデータ毎に算出されるデータ固有閾値をディップの深さの有意性の判定基準としているため、上記の(1)で特定されるディップ群を、有意ディップ群と呼ぶ。上記の(2)で特定されるディップ群を、類似ディップ群と呼ぶ。上記の(3)で特定されるディップ群を、周期性ディップ群と呼ぶ。なお、ディップ検出部18、ディップ深さ算出部20、心拍変動指標算出部22、個別閾値決定処理部24、ディップ幅算出部26、ディップ間隔算出部28、及びディップ群特定部30が、「CVHR検出手段」の一例に相当する。
In the above (1), since the data specific threshold calculated for each data is used as a criterion for determining the significance of the depth of the dip, the dip group specified in the above (1) is called a significant dip group. The dip group specified in (2) above is called a similar dip group. The dip group specified in (3) above is called a periodic dip group. The dip detection unit 18, the dip depth calculation unit 20, the heart rate variability index calculation unit 22, the individual threshold value determination processing unit 24, the dip width calculation unit 26, the dip interval calculation unit 28, and the dip group specifying unit 30 are “CVHR”. It corresponds to an example of “detection means”.
ACV対数算出部32は、ディップ群特定部30によって特定された周期性ディップ群のそれぞれのディップ(CVHRの波形)を加算平均し、その振幅を心拍数周期性変動の振幅(ACV)として算出し、その対数を算出する。なお、ACV対数算出部32が「CVHR形状特性指標取得手段」の一例に相当する。
The ACV logarithm calculation unit 32 adds and averages each dip (CVHR waveform) of the periodic dip group identified by the dip group identification unit 30, and calculates the amplitude as the amplitude (ACV) of the heart rate periodic variation. The logarithm is calculated. The ACV logarithm calculation unit 32 corresponds to an example of “CVHR shape characteristic index acquisition unit”.
FCV対数算出部34は、処理対象となるR-R間隔時系列データに出現するCVHRの1時間当たりの頻度(即ち、FCV)を算出し、その対数を算出する。なお、FCV対数算出部34が、「FCV取得手段」の一例に相当する。
The FCV logarithm calculation unit 34 calculates the frequency per hour (that is, FCV) of CVHR appearing in the RR interval time series data to be processed, and calculates the logarithm thereof. The FCV logarithm calculation unit 34 corresponds to an example of “FCV acquisition unit”.
ACVscore算出部36は、ACV対数算出部32により算出されたACVの対数値を、FCV対数算出部34で算出されたFCVの対数値に基づいて補正し、補正済振幅(ACVscore)として算出する。なお、ACVscore算出部36が、「ACV補正手段」の一例に相当する。
ここで、図3(a)~(c)を参照してFCVとACVの相関関係について説明する。図3(a)のグラフAは、ACVの自然対数(以下、単にACVの対数とも称する)の分布を、FCVの自然対数(以下、単にFCVの対数とも称する)の値毎に示したグラフである。グラフAは、21万例の被験者のホルター心電図のデータが蓄積された大規模なデータベースに基づき作成されている。グラフAの“n of subject”は、FCVの対数値毎の被験者数を示す。グラフAの高さは、ACVの各対数値を有する被験者の、母集団(21万例)における割合を表す。図3(b)のグラフBは、グラフAのACVの対数の平均値(Mean)を、FCVの対数値毎に示したグラフである。グラフBによると、ACVの対数の平均値は、FCVの対数の増加に伴い線形に増加しており、その振る舞いは、関数f(x)=0.14x+4.2(x:FCVの対数、f(x):ACVの対数の平均値)に近似できることが分かる。また、図3(c)のグラフCは、グラフAのACVの対数の分布の標準偏差(Standard Deviation, SD)を、FCVの対数値毎に示したグラフである。グラフCによると、ACVの対数の標準偏差の振る舞いは、g(x)=0.064x2-0.36x+0.90(x:FCVの対数、g(x):ACVの対数の標準偏差)に近似できることが分かる。
記憶部40(後述)は、上記2つの関数f(x)、g(x)を記憶している。ACVscore算出部36は、関数f(x)、g(x)を利用してACVscoreを算出する(後述)。
その他の演算部38は、上記以外の様々な演算処理を行う。演算部38が行う演算処理については、後で詳しく説明する。 TheACVscore calculation unit 36 corrects the logarithmic value of the ACV calculated by the ACV logarithm calculation unit 32 based on the logarithmic value of the FCV calculated by the FCV logarithm calculation unit 34, and calculates the corrected amplitude (ACVscore). The ACVscore calculation unit 36 corresponds to an example of “ACV correction unit”.
Here, the correlation between FCV and ACV will be described with reference to FIGS. Graph A in FIG. 3A is a graph showing the distribution of the natural logarithm of ACV (hereinafter also simply referred to as the logarithm of ACV) for each value of the natural logarithm of FCV (hereinafter also simply referred to as the logarithm of FCV). is there. Graph A is created based on a large database in which Holter electrocardiogram data of 210,000 subjects are accumulated. “N of subject” in graph A indicates the number of subjects for each logarithmic value of FCV. The height of graph A represents the proportion of subjects with each logarithm of ACV in the population (210,000 cases). Graph B in FIG. 3B is a graph showing the average value (Mean) of the logarithm of ACV in graph A for each logarithmic value of FCV. According to graph B, the average value of the logarithm of ACV increases linearly with the increase of the logarithm of FCV, and its behavior is expressed as function f (x) = 0.14x + 4.2 (x: logarithm of FCV, f It can be seen that (x): logarithm of ACV) can be approximated. 3C is a graph showing the standard deviation (Standard Deviation, SD) of the logarithmic distribution of ACV in graph A for each logarithmic value of FCV. According to graph C, the behavior of the logarithmic standard deviation of ACV is g (x) = 0.064x 2 −0.36x + 0.90 (x: logarithm of FCV, g (x): standard deviation of logarithm of ACV) It can be seen that it can be approximated.
The storage unit 40 (described later) stores the two functions f (x) and g (x). TheACVscore calculating unit 36 calculates ACVscore using functions f (x) and g (x) (described later).
Theother calculation part 38 performs various calculation processes other than the above. The arithmetic processing performed by the arithmetic unit 38 will be described in detail later.
ここで、図3(a)~(c)を参照してFCVとACVの相関関係について説明する。図3(a)のグラフAは、ACVの自然対数(以下、単にACVの対数とも称する)の分布を、FCVの自然対数(以下、単にFCVの対数とも称する)の値毎に示したグラフである。グラフAは、21万例の被験者のホルター心電図のデータが蓄積された大規模なデータベースに基づき作成されている。グラフAの“n of subject”は、FCVの対数値毎の被験者数を示す。グラフAの高さは、ACVの各対数値を有する被験者の、母集団(21万例)における割合を表す。図3(b)のグラフBは、グラフAのACVの対数の平均値(Mean)を、FCVの対数値毎に示したグラフである。グラフBによると、ACVの対数の平均値は、FCVの対数の増加に伴い線形に増加しており、その振る舞いは、関数f(x)=0.14x+4.2(x:FCVの対数、f(x):ACVの対数の平均値)に近似できることが分かる。また、図3(c)のグラフCは、グラフAのACVの対数の分布の標準偏差(Standard Deviation, SD)を、FCVの対数値毎に示したグラフである。グラフCによると、ACVの対数の標準偏差の振る舞いは、g(x)=0.064x2-0.36x+0.90(x:FCVの対数、g(x):ACVの対数の標準偏差)に近似できることが分かる。
記憶部40(後述)は、上記2つの関数f(x)、g(x)を記憶している。ACVscore算出部36は、関数f(x)、g(x)を利用してACVscoreを算出する(後述)。
その他の演算部38は、上記以外の様々な演算処理を行う。演算部38が行う演算処理については、後で詳しく説明する。 The
Here, the correlation between FCV and ACV will be described with reference to FIGS. Graph A in FIG. 3A is a graph showing the distribution of the natural logarithm of ACV (hereinafter also simply referred to as the logarithm of ACV) for each value of the natural logarithm of FCV (hereinafter also simply referred to as the logarithm of FCV). is there. Graph A is created based on a large database in which Holter electrocardiogram data of 210,000 subjects are accumulated. “N of subject” in graph A indicates the number of subjects for each logarithmic value of FCV. The height of graph A represents the proportion of subjects with each logarithm of ACV in the population (210,000 cases). Graph B in FIG. 3B is a graph showing the average value (Mean) of the logarithm of ACV in graph A for each logarithmic value of FCV. According to graph B, the average value of the logarithm of ACV increases linearly with the increase of the logarithm of FCV, and its behavior is expressed as function f (x) = 0.14x + 4.2 (x: logarithm of FCV, f It can be seen that (x): logarithm of ACV) can be approximated. 3C is a graph showing the standard deviation (Standard Deviation, SD) of the logarithmic distribution of ACV in graph A for each logarithmic value of FCV. According to graph C, the behavior of the logarithmic standard deviation of ACV is g (x) = 0.064x 2 −0.36x + 0.90 (x: logarithm of FCV, g (x): standard deviation of logarithm of ACV) It can be seen that it can be approximated.
The storage unit 40 (described later) stores the two functions f (x) and g (x). The
The
記憶部40は、ROM、EEPROM、RAM等によって構成されている。記憶部40は、様々な情報を記憶することができる。本実施例では、記憶部40は、上述した2つの関数f(x)、g(x)を記憶している。また、記憶部40は、R-R間隔時系列データ入力部16に入力されたR-R間隔時系列データを記憶している。また、記憶部40は、各ディップの出現時刻、幅及び深さを記憶している。また、記憶部40は、ディップ群特定部30によって特定されたディップ群(即ち、CVHRの波形)に関する様々な情報を記憶している。具体的には、記憶部40は、CVHRの振幅(ACV)、CVHRの1時間当たりの頻度(FCV)、及び補正済振幅(ACVscore)を記憶している。操作部42は、複数のキーを有する。ユーザは操作部42を操作することによって、様々な情報をCVHR形状測定装置2の各部に入力することができる。表示部44は、様々な情報を画面に表示することができる。
The storage unit 40 includes a ROM, an EEPROM, a RAM, and the like. The storage unit 40 can store various information. In the present embodiment, the storage unit 40 stores the two functions f (x) and g (x) described above. The storage unit 40 stores RR interval time series data input to the RR interval time series data input unit 16. In addition, the storage unit 40 stores the appearance time, width, and depth of each dip. In addition, the storage unit 40 stores various information regarding the dip group (that is, the waveform of CVHR) specified by the dip group specifying unit 30. Specifically, the storage unit 40 stores the amplitude (ACV) of CVHR, the frequency per hour (FCV) of CVHR, and the corrected amplitude (ACVscore). The operation unit 42 has a plurality of keys. The user can input various information to each part of the CVHR shape measuring apparatus 2 by operating the operation unit 42. The display unit 44 can display various information on the screen.
CVHR形状測定装置2に搭載されたコンピュータプログラムが実行するACVscore算出処理の内容について説明する。図4~9は、ACVscore算出処理のフローチャートを示す。R-R間隔時系列データ入力部16は、通信回線14を介してR-R間隔時系列データを入力する(S10)。
The contents of the ACVscore calculation process executed by the computer program installed in the CVHR shape measuring apparatus 2 will be described. 4 to 9 show flowcharts of the ACVscore calculation process. The RR interval time series data input unit 16 inputs RR interval time series data via the communication line 14 (S10).
S10で入力されたR-R間隔時系列データには、期外収縮や心ブロック等の非生理的不整脈、及びアーチファクトに起因するデータの変動が含まれている。そこで、演算部38は、非生理的不整脈及びアーチファクトに起因するデータの変動を除去する演算処理を行う(S12)。これによって、生理的心拍変動及び無呼吸及び低呼吸による心拍変動以外の原因によるデータの変動を除去することができる。
RR interval time series data input in S10 includes non-physiologic arrhythmias such as extrasystole and cardiac block, and data fluctuations due to artifacts. Therefore, the calculation unit 38 performs calculation processing for removing data fluctuations caused by non-physiologic arrhythmia and artifacts (S12). As a result, fluctuations in data caused by causes other than physiological heartbeat fluctuations and heartbeat fluctuations due to apnea and hypopnea can be eliminated.
S14では、演算部38は、R-R間隔時系列データの補間を行う。例えばステップ補間を行う場合、個々のR-R間隔の間は、関数値がそのR-R間隔の値に等しい一定値をとるような補間関数を用いる。続いて、演算部38は、2Hzの周波数で補間関数の値を再サンプリングする。これによって、等間隔でサンプリングされたR-R間隔時系列データX(t)を作成する。続いて、ディップ検出部18は、時系列データX(t)の上で、次の(式1)を-5から5秒の範囲の全てのTに対して満たす時点tをディップ候補の存在時刻として検出する(S16)。
(式1){X(t)+T2/49≧X(t+T),T=-5,5}
(式1)は、時系列データX(t)を時間tに対するグラフとして描いたときに下方に頂点を有する放物線(H=T2/49,ここでTは放物線の中心からの時間[s],Hは放物線の頂点からの高さ[ms])が内接し得る変動部位をディップ候補の存在時刻として検出する。 In S14, thecalculation unit 38 interpolates RR interval time series data. For example, when step interpolation is performed, an interpolation function is used between each RR interval such that the function value takes a constant value equal to the value of the RR interval. Subsequently, the calculation unit 38 resamples the value of the interpolation function at a frequency of 2 Hz. Thus, RR interval time series data X (t) sampled at equal intervals is created. Subsequently, the dip detection unit 18 sets the time t at which the following (Equation 1) is satisfied for all T in the range of −5 to 5 seconds on the time series data X (t), (S16).
(Equation 1) {X (t) +T 2/49 ≧ X (t + T), T = -5,5}
(Equation 1) is the time series parabola having a vertex downwardly when data X (t) is drawn as a graph against time t (H = T 2/49 , where T is from the center of the parabola time [s] , H detects a fluctuation portion where the height [ms] from the top of the parabola can be inscribed as the dip candidate existence time.
(式1){X(t)+T2/49≧X(t+T),T=-5,5}
(式1)は、時系列データX(t)を時間tに対するグラフとして描いたときに下方に頂点を有する放物線(H=T2/49,ここでTは放物線の中心からの時間[s],Hは放物線の頂点からの高さ[ms])が内接し得る変動部位をディップ候補の存在時刻として検出する。 In S14, the
(Equation 1) {X (t) +
(Equation 1) is the time series parabola having a vertex downwardly when data X (t) is drawn as a graph against time t (H = T 2/49 , where T is from the center of the parabola time [s] , H detects a fluctuation portion where the height [ms] from the top of the parabola can be inscribed as the dip candidate existence time.
ディップ検出部18は、ディップ候補に内接する放物線の頂点が、前後10秒間に存在するどのディップ候補に内接する放物線の頂点の値よりも小さい場合に、当該ディップ候補をディップとして特定する(S18)。ディップ検出部18によって特定されたディップに放物線が内接する位置が、当該ディップの最小値である。以下では、ディップの最小値を、ディップの底とも称する。また、ディップの底が存在する時刻を、ディップの底時刻とも称する。
The dip detection unit 18 specifies the dip candidate as a dip when the vertex of the parabola inscribed in the dip candidate is smaller than the value of the parabola vertex inscribed in any of the dip candidates existing for 10 seconds before and after (S18). . The position where the parabola is inscribed in the dip specified by the dip detector 18 is the minimum value of the dip. Hereinafter, the minimum value of the dip is also referred to as the bottom of the dip. The time when the bottom of the dip exists is also referred to as the dip bottom time.
ディップ深さ算出部20は、S18で検出された複数の局所的ディップにおいて、それぞれのディップ深さDiを算出する。iは検出されたディップの序数である。図7は、ディップ深さDiの算出処理のフローチャートを示す。ディップ深さ算出部20は、S18で検出されたそれぞれのディップについて、図7の処理(S50~S56)を実行する。
The dip depth calculation unit 20 calculates each dip depth Di in the plurality of local dip detected in S18. i is the ordinal number of the detected dip. FIG. 7 shows a flowchart of the calculation process of the dip depth Di. The dip depth calculation unit 20 executes the processing (S50 to S56) of FIG. 7 for each dip detected in S18.
ディップ深さ算出部20は、ディップの中心時刻の前後25秒間の時系列データについて窓幅5秒の移動平均を算出する。得られた移動平均値の位相のずれを補正した時系列をXMV5(t)とする(S50)。ディップの時間軸方向の中央点(中心時刻diにおいてX(di)を算出する(S54)。X(di)は、ディップの底付近の値である。ディップ深さ算出部20は、以下の(式2)によってディップ深さDiを算出する(S56)。
(式2)Di={max[XMV5(t),t=di-25,di]+max[XMV5(t),t=di,di+25]}/2-X(di)
即ち、ディップ深さ算出部20は、ディップの中央点diの前の25秒間における移動平均XMV5(t)の最大値と、中央点diの後の25秒間における移動平均XMV5(t)の最大値を算出し、両者の平均値をベースラインの値として算出している。ディップ深さ算出部20は、ベースラインと底付近の値の差を算出することにより、ディップ深さDiを算出する。 The dipdepth calculation unit 20 calculates a moving average with a window width of 5 seconds for time-series data for 25 seconds before and after the center time of the dip. A time series obtained by correcting the phase shift of the obtained moving average value is defined as XMV5 (t) (S50). The center point of the dip in the time axis direction (X (di) is calculated at the central time di (S54). X (di) is a value near the bottom of the dip. The dip depth calculation unit 20 calculates the following ( The dip depth Di is calculated by the equation 2) (S56).
(Expression 2) Di = {max [XMV5 (t), t = di−25, di] + max [XMV5 (t), t = di, di + 25]} / 2−X (di)
That is, the dipdepth calculation unit 20 determines the maximum value of the moving average XMV5 (t) for 25 seconds before the center point di of the dip and the maximum value of the moving average XMV5 (t) for 25 seconds after the center point di. And the average value of the two is calculated as the baseline value. The dip depth calculation unit 20 calculates the dip depth Di by calculating a difference between values near the baseline and the bottom.
(式2)Di={max[XMV5(t),t=di-25,di]+max[XMV5(t),t=di,di+25]}/2-X(di)
即ち、ディップ深さ算出部20は、ディップの中央点diの前の25秒間における移動平均XMV5(t)の最大値と、中央点diの後の25秒間における移動平均XMV5(t)の最大値を算出し、両者の平均値をベースラインの値として算出している。ディップ深さ算出部20は、ベースラインと底付近の値の差を算出することにより、ディップ深さDiを算出する。 The dip
(Expression 2) Di = {max [XMV5 (t), t = di−25, di] + max [XMV5 (t), t = di, di + 25]} / 2−X (di)
That is, the dip
図4のS22では、心拍変動指標算出部22は、R-R間隔時系列データから高速フーリエ変換によって高周波数成分(0.15~0.45Hz)の振幅HFAMPを算出する。心拍変動指標算出部22は、データに固有のディップの深さに関する閾値DDTHを、HFAMPの2.5倍の値とする(S24)。高周波数成分の振幅HFAMPはそれぞれのデータについて算出される。したがって、DDTHはデータに適応したデータ固有の閾値となる。
4, the heart rate variability index calculation unit 22 calculates the amplitude HFAMP of the high frequency component (0.15 to 0.45 Hz) from the RR interval time series data by fast Fourier transform. The heart rate variability index calculation unit 22 sets the threshold value DDTH relating to the dip depth inherent in the data to a value that is 2.5 times HFAMP (S24). The amplitude HFAMP of the high frequency component is calculated for each data. Therefore, DDTH is a data-specific threshold adapted to the data.
ディップ群特定部30は、ディップ深さDiがデータ固有閾値DDTHよりも大きいか否かによってディップiが有意なディップか否かを判断する(S25)。ここでYESの場合は、ディップ群特定部30はディップiを有意なディップとして残す(S26)。S26で残されたディップ群が、有意ディップ群である。続いてディップ群特定部30はディップiがR-R間隔時系列データの最後のディップであるか否かを判断する(S28)。ここでYESの場合は、図5のS30に進む。一方において、S28でNOの場合、ディップ群特定部30は、次のディップを特定し(S29)、S25に戻る。これにより、次のディップについて、ディップ深さDiとデータ固有閾値DDTHが比較される。
The dip group identification unit 30 determines whether the dip i is a significant dip based on whether the dip depth Di is greater than the data specific threshold DDTH (S25). In the case of YES here, the dip group specifying unit 30 leaves the dip i as a significant dip (S26). The dip group left in S26 is a significant dip group. Subsequently, the dip group specifying unit 30 determines whether or not the dip i is the last dip of the RR interval time series data (S28). In the case of YES here, the process proceeds to S30 in FIG. On the other hand, in the case of NO in S28, the dip group specifying unit 30 specifies the next dip (S29) and returns to S25. Thereby, the dip depth Di and the data specific threshold value DDTH are compared for the next dip.
一方において、S25でNOの場合は、ディップ群特定部30はディップiを除去する(S27)。続いてディップ群特定部30はディップiがR-R間隔時系列データの最後のディップであるか否かを判断する(S28)。ここでYESの場合は、図5のS30に進む。一方において、S28でNOの場合、ディップ群特定部30は、次のディップを特定し(S29)、S25に戻る。
On the other hand, if NO in S25, the dip group identification unit 30 removes dip i (S27). Subsequently, the dip group specifying unit 30 determines whether or not the dip i is the last dip of the RR interval time series data (S28). In the case of YES here, the process proceeds to S30 in FIG. On the other hand, in the case of NO in S28, the dip group specifying unit 30 specifies the next dip (S29) and returns to S25.
図5のS30では、演算部38は、ディップの底からDiの2/3の高さにおけるディップ幅Wiを算出する。続いて、ディップ群特定部30は、各ディップについて以下の(式3)、(式4)、(式5)を全て満たすか否かを判断する(S31)。
(式3)abs(log(Di/Di+1)<log(2.5)
(式4)abs(log(Wi/Wi+1)<log(2.5)
(式5)abs(log(Wi・Di+1/Wi+1・Di)<log(2.5)
ここでは、ディップ群特定部30はディップの幅及び深さから、連続するディップi,ディップi+1の形状が類似しているか否かを判断する。S31でYESの場合は、ディップ群特定部30はディップi,ディップi+1を残す(S32)。S32で残ったディップ群が、類似ディップ群である。続いてディップ群特定部30はディップiがR-R間隔時系列データの最後のディップであるか否かを判断する(S34)。ここでYESの場合は、S36に進む。一方において、S34でNOの場合、ディップ群特定部30は、次のディップを特定し(S35)、S31に戻る。S31では、ディップ群特定部30は、次のディップについて、類似性の有無を判断する。 In S30 of FIG. 5, thecalculation unit 38 calculates a dip width Wi at a height 2/3 of Di from the bottom of the dip. Subsequently, the dip group specifying unit 30 determines whether or not all of the following (Equation 3), (Equation 4), and (Equation 5) are satisfied for each dip (S31).
(Formula 3) abs (log (Di / Di + 1) <log (2.5)
(Formula 4) abs (log (Wi / Wi + 1) <log (2.5)
(Formula 5) abs (log (Wi · Di + 1 /Wi + 1 · Di) <log (2.5)
Here, the dipgroup specifying unit 30 determines whether the shapes of successive dip i and dip i + 1 are similar from the width and depth of the dip. If YES in S31, the dip group identification unit 30 leaves dip i and dip i + 1 (S32). The dip group remaining in S32 is a similar dip group. Subsequently, the dip group specifying unit 30 determines whether or not the dip i is the last dip of the RR interval time series data (S34). If YES here, the process proceeds to S36. On the other hand, in the case of NO in S34, the dip group specifying unit 30 specifies the next dip (S35), and returns to S31. In S31, the dip group specifying unit 30 determines whether there is similarity for the next dip.
(式3)abs(log(Di/Di+1)<log(2.5)
(式4)abs(log(Wi/Wi+1)<log(2.5)
(式5)abs(log(Wi・Di+1/Wi+1・Di)<log(2.5)
ここでは、ディップ群特定部30はディップの幅及び深さから、連続するディップi,ディップi+1の形状が類似しているか否かを判断する。S31でYESの場合は、ディップ群特定部30はディップi,ディップi+1を残す(S32)。S32で残ったディップ群が、類似ディップ群である。続いてディップ群特定部30はディップiがR-R間隔時系列データの最後のディップであるか否かを判断する(S34)。ここでYESの場合は、S36に進む。一方において、S34でNOの場合、ディップ群特定部30は、次のディップを特定し(S35)、S31に戻る。S31では、ディップ群特定部30は、次のディップについて、類似性の有無を判断する。 In S30 of FIG. 5, the
(Formula 3) abs (log (Di / Di + 1) <log (2.5)
(Formula 4) abs (log (Wi / Wi + 1) <log (2.5)
(Formula 5) abs (log (Wi · Di + 1 /
Here, the dip
一方において、S31でNOの場合は、ディップ群特定部30はディップiを除去する(S33)。続いてディップ群特定部30はディップiがR-R間隔時系列データの最後のディップであるか否かを判断する(S34)。ここでYESの場合は、S36に進む。一方において、S34でNOの場合、ディップ群特定部30は、次のディップを特定し(S35)、S31に戻る。
On the other hand, if NO in S31, the dip group identification unit 30 removes dip i (S33). Subsequently, the dip group specifying unit 30 determines whether or not the dip i is the last dip of the RR interval time series data (S34). If YES here, the process proceeds to S36. On the other hand, in the case of NO in S34, the dip group specifying unit 30 specifies the next dip (S35), and returns to S31.
図10は、R-R間隔時系列データの模式図である。図10を用いて、ディップ群特定部30がS31の処理を終えた後に、どのディップを残すのかを判断する判断方法について詳しく説明する。ディップi~ディップi+3は時系列に連続して出現している。Wiはディップiのディップ幅である。Diはディップiのディップ深さである。まず、ディップ群特定部30は、ディップiとディップi+1の組合せAの類似性を判断する。続いて、ディップi+1とディップi+2の組合せBの類似性を判断する。続いて、ディップi+2とディップi+3の組合せCの類似性を判断する。
FIG. 10 is a schematic diagram of RR interval time series data. A determination method for determining which dip is to be left after the dip group specifying unit 30 has finished the processing of S31 will be described in detail with reference to FIG. Dips i to i + 3 appear continuously in time series. Wi is the dip width of dip i. Di is the dip depth of dip i. First, the dip group specifying unit 30 determines the similarity of the combination A of dip i and dip i + 1. Subsequently, the similarity of the combination B of dip i + 1 and dip i + 2 is determined. Subsequently, the similarity of the combination C of dip i + 2 and dip i + 3 is determined.
組合せAが類似性を満たす場合は、ディップ群特定部30はディップiとディップi+1の両方を残す。続いて組合せBも類似性を満たす場合には、ディップ群特定部30はディップi+1とディップi+2を残す。このとき、ディップi+1は組合せA,Bの両方の処理において残されることになる。一方において、組合せBが類似性を満たさない場合には、ディップi+2のみが除去される。組合せAで一度残ったディップi+1は、組合せBの結果に関わらず、除去されることはない。
When the combination A satisfies the similarity, the dip group specifying unit 30 leaves both dip i and dip i + 1. Subsequently, when the combination B also satisfies the similarity, the dip group specifying unit 30 leaves the dip i + 1 and the dip i + 2. At this time, the dip i + 1 is left in both the processes of the combinations A and B. On the other hand, when the combination B does not satisfy the similarity, only the dip i + 2 is removed. The dip i + 1 that remains once in the combination A is not removed regardless of the result of the combination B.
組合せBが類似性を満たさない場合に、組合せCが類似性を満たす場合には、ディップ群特定部30はディップi+2とディップi+3を残す。即ち、ディップi+2は組合せBでは除去されたが、組合せCにおいて残ることができる。
When the combination B does not satisfy the similarity and the combination C satisfies the similarity, the dip group specifying unit 30 leaves the dip i + 2 and the dip i + 3. That is, dip i + 2 is removed in combination B but can remain in combination C.
S36では、演算部38は、S34で残ったディップ群のうち、4つの連続するディップの中の隣接する2つのディップの時刻差Ii、Ii+1、Ii+2をそれぞれ算出する。時刻差Iiは、ディップiの中心時刻diと連続するディップi+1の中心時刻di+1との時刻差である。ディップ群特定部30は、以下の(式6)、(式7)、(式8)を全て満たす4つの連続するディップ群を残す(S38)。
(式6)25<Ii,Ii+1,Ii+2<120
(式7)(3-2Ii/S)(3-2Ii+1/S)(3-2Ii+2/S)>0.6
(式8)S=(Ii+Ii+1+Ii+2)/3
ここでは、ディップ群特定部30は、時刻差の大きさと、連続する時刻差の大きさのばらつきから、時刻差Ii、Ii+1、Ii+2を形成する4つのディップ群に周期性があるか否かを判断する。S38で残ったディップ群が、周期性ディップ群である。CVHR形状測定装置2は、S38で残った周期性ディップ群をCVHRとして検出する。 In S36, thecalculation unit 38 calculates time differences Ii, Ii + 1, and Ii + 2 between two adjacent dips in the four consecutive dips in the dip group remaining in S34. The time difference Ii is a time difference between the center time di of the dip i and the center time di + 1 of the continuous dip i + 1. The dip group specifying unit 30 leaves four consecutive dip groups that satisfy all of the following (Expression 6), (Expression 7), and (Expression 8) (S38).
(Formula 6) 25 <Ii, Ii + 1, Ii + 2 <120
(Formula 7) (3-2Ii / S) (3-2Ii + 1 / S) (3-2Ii + 2 / S)> 0.6
(Formula 8) S = (Ii + Ii + 1 + Ii + 2) / 3
Here, the dipgroup specifying unit 30 determines whether or not the four dip groups forming the time differences Ii, Ii + 1, and Ii + 2 have periodicity based on the magnitude of the time difference and the variation in the magnitude of successive time differences. to decide. The dip group remaining in S38 is a periodic dip group. The CVHR shape measuring apparatus 2 detects the periodic dip group remaining in S38 as CVHR.
(式6)25<Ii,Ii+1,Ii+2<120
(式7)(3-2Ii/S)(3-2Ii+1/S)(3-2Ii+2/S)>0.6
(式8)S=(Ii+Ii+1+Ii+2)/3
ここでは、ディップ群特定部30は、時刻差の大きさと、連続する時刻差の大きさのばらつきから、時刻差Ii、Ii+1、Ii+2を形成する4つのディップ群に周期性があるか否かを判断する。S38で残ったディップ群が、周期性ディップ群である。CVHR形状測定装置2は、S38で残った周期性ディップ群をCVHRとして検出する。 In S36, the
(Formula 6) 25 <Ii, Ii + 1, Ii + 2 <120
(Formula 7) (3-2Ii / S) (3-
(Formula 8) S = (Ii + Ii + 1 + Ii + 2) / 3
Here, the dip
図11は、R-R間隔時系列データの模式図である。図11を用いて、ディップ群特定部30がS38の処理において、どのディップ群を残すのかを判断する判断方法について詳しく説明する。ディップi~ディップi+7は、時系列に連続して出現している。まず、ディップ群特定部30は、Ii~Ii+2で構成される組合せAの周期性を判断する。続いて、ディップ群特定部30は、Ii+1~Ii+3で構成される組合せBの周期性を判断する。ディップ群特定部30は、同様にディップを1つずつ時系列順にずらして判断し、Ii+4~Ii+6で構成される組合せEの周期性を判断する。
FIG. 11 is a schematic diagram of RR interval time series data. A determination method for determining which dip group to leave in the processing of S38 by the dip group specifying unit 30 will be described in detail with reference to FIG. The dips i to i + 7 appear continuously in time series. First, the dip group specifying unit 30 determines the periodicity of the combination A composed of Ii to Ii + 2. Subsequently, the dip group specifying unit 30 determines the periodicity of the combination B composed of Ii + 1 to Ii + 3. Similarly, the dip group specifying unit 30 determines by shifting the dip one by one in time series order, and determines the periodicity of the combination E composed of Ii + 4 to Ii + 6.
組合せAが周期性を満たす場合には、ディップ群特定部30はディップi~ディップi+3を残す。続いて組合せBが周期性を満たす場合には、ディップ群特定部30はディップi+1~ディップi+4を残す。このとき、ディップi+1~ディップi+3は組合せA,Bの両方の処理において残されることになる。一方において、組合せBが周期性を満たさない場合には、組合せBを構成するディップi+1~ディップi+4のうちディップi+4のみが除去される。組合せAで一度残ったディップi+1~ディップi+3は、組合せBの結果に関わらず、除去されることはない。
When the combination A satisfies the periodicity, the dip group specifying unit 30 leaves dip i to dip i + 3. Subsequently, when the combination B satisfies the periodicity, the dip group specifying unit 30 leaves dip i + 1 to dip i + 4. At this time, dip i + 1 to dip i + 3 are left in the processing of both combinations A and B. On the other hand, when the combination B does not satisfy the periodicity, only the dip i + 4 is removed from the dip i + 1 to the dip i + 4 constituting the combination B. Dips i + 1 to i + 3 once left in combination A are not removed regardless of the result of combination B.
組合せBが周期性を満たさない場合に、組合せEが周期性を満たす場合には、ディップ群特定部30はディップi+4~ディップi+7を全て残す。即ち、ディップi+4は組合せBでは除去されたが、組合せEにおいて残ることができる。また、組合せBと組合せEの間には図示しない組合せが存在しているが、これらの判断結果に関わらず、組合せEが周期性を満たす場合には、ディップi+4~ディップi+7が残される。
When the combination B does not satisfy the periodicity and the combination E satisfies the periodicity, the dip group specifying unit 30 leaves all dip i + 4 to dip i + 7. That is, dip i + 4 is removed in combination B but can remain in combination E. Further, although there is a combination (not shown) between the combination B and the combination E, dip i + 4 to dip i + 7 are left when the combination E satisfies the periodicity regardless of the determination result.
図6のS40では、ACV対数算出部32が、S38で検出された全てのCVHRを加算平均し、加算平均後のCVHRの振幅(ACV)の対数を算出する。図8は、ACVの対数算出処理のフローチャートを示す。ACV対数算出部32は、図8の処理(S60~S64)を実行する。
6, the ACV logarithm calculation unit 32 adds and averages all the CVHRs detected in S38, and calculates the logarithm of the CVHR amplitude (ACV) after the addition average. FIG. 8 shows a flowchart of ACV logarithmic calculation processing. The ACV logarithm calculation unit 32 executes the processes (S60 to S64) of FIG.
図12(a)は、S38で検出されたn個のCVHRを示す。ACV対数算出部32は、S38で検出されたn個のCVHRのそれぞれの底時刻t1、t2、t3・・・、tnの前後60秒間におけるセグメントs1、s2、s3・・・、snを加算平均する。具体的には、各セグメントs1~snを、各CVHRの底時刻t1~tnをアンカーポイントとして揃え、全セグメントs1~snを時刻毎に平均する。これにより、図12(b)に実線で示すような加算平均時系列が作成される(S60)。図12(b)では、n個のセグメントs1~snのアンカーポイント(即ち、加算平均時系列の底時刻)がTime=0[s]の位置にセットされている。
次に、ACV対数算出部32は、底時刻の前の60秒間における加算平均時系列の最大値M1と、底時刻の後の60秒間における加算平均時系列の最大値M2を結ぶ直線Lを作成する(S62)(図12(b)の破線参照)。続いて、ACV対数算出部32は、底時刻における加算平均時系列の値と直線Lの差(距離)を算出することによりACVを算出し、その対数を算出する(S64)。 FIG. 12A shows n CVHRs detected in S38. The ACVlogarithm calculation unit 32 adds and averages the segments s1, s2, s3,..., Sn for 60 seconds before and after the bottom times t1, t2, t3..., Tn of the n CVHRs detected in S38. To do. Specifically, the segments s1 to sn are aligned using the bottom times t1 to tn of the CVHR as anchor points, and all the segments s1 to sn are averaged for each time. Thereby, an addition average time series as shown by a solid line in FIG. 12B is created (S60). In FIG. 12B, the anchor points of the n segments s1 to sn (that is, the bottom time of the addition average time series) are set at the position of Time = 0 [s].
Next, the ACVlogarithm calculation unit 32 creates a straight line L connecting the maximum value M1 of the addition average time series for 60 seconds before the base time and the maximum value M2 of the addition average time series for 60 seconds after the base time. (S62) (see the broken line in FIG. 12B). Subsequently, the ACV logarithm calculation unit 32 calculates the ACV by calculating the difference (distance) between the value of the addition average time series at the base time and the straight line L, and calculates the logarithm (S64).
次に、ACV対数算出部32は、底時刻の前の60秒間における加算平均時系列の最大値M1と、底時刻の後の60秒間における加算平均時系列の最大値M2を結ぶ直線Lを作成する(S62)(図12(b)の破線参照)。続いて、ACV対数算出部32は、底時刻における加算平均時系列の値と直線Lの差(距離)を算出することによりACVを算出し、その対数を算出する(S64)。 FIG. 12A shows n CVHRs detected in S38. The ACV
Next, the ACV
図6のS42では、FCV対数算出部34が、S38で検出されたCVHRの1時間当たりの頻度(FCV)を算出し、その対数を算出する。FCV対数算出部34は、R-R間隔時系列データにおける最初のCVHRの底時刻から最後のCVHRの底時刻までの間においてFCVを算出することが望ましい。FCVは、最初のCVHRの底時刻から最後のCVHRの底時刻までの時間に出現するCVHRの個数の1時間当たりの平均値として算出してもよいし、あるいは、一定の時間間隔内のCVHRの1時間当たりの頻度として算出してもよい。
6, the FCV logarithm calculation unit 34 calculates the frequency per hour (FCV) of the CVHR detected in S38 and calculates the logarithm. The FCV logarithm calculation unit 34 preferably calculates the FCV from the bottom time of the first CVHR to the bottom time of the last CVHR in the RR interval time series data. FCV may be calculated as the average value per hour of the number of CVHRs that appear in the time from the bottom time of the first CVHR to the bottom time of the last CVHR, or the CVHR within a certain time interval. It may be calculated as a frequency per hour.
S44では、ACVscore算出部36が、補正済振幅(ACVscore)を算出する。図9は、ACVscore算出処理のフローチャートを示す。ACVscore算出部36は、図9の処理(S70~S72)を実行する。
In S44, the ACVscore calculator 36 calculates a corrected amplitude (ACVscore). FIG. 9 shows a flowchart of the ACVscore calculation process. The ACVscore calculation unit 36 executes the processes (S70 to S72) of FIG.
ACVscore算出部36は、記憶部40に記憶されている2つの関数:f(x)=0.14x+4.2及びg(x)=0.064x2-0.36x+0.90のxに、S42で算出されたFCVの対数値をそれぞれ代入し、ACVの対数の平均値、及びACVの対数の標準偏差を算出する(S70)。次に、ACVscore算出部36は、以下の(式9)にS40で算出されたACVの対数値(ln(ACV))と、S70で算出されたACVの対数の平均値(Mean(ln(ACV)))及びACVの対数の標準偏差(SD(ln(ACV)))を代入して、補正済振幅(ACVscore)を算出する(S72)。
(式9)ACVscore=[ln(ACV)-Mean(ln(ACV))]/SD(ln(ACV))×1.0+5.0 TheACVscore calculation unit 36 converts the two functions stored in the storage unit 40 into x of f (x) = 0.14x + 4.2 and g (x) = 0.064x 2 −0.36x + 0.90 in S42. The calculated logarithmic value of FCV is substituted, and the average value of the logarithm of ACV and the standard deviation of the logarithm of ACV are calculated (S70). Next, the ACVscore calculating unit 36 calculates the logarithmic value of the ACV calculated in S40 (ln (ACV)) in the following (Equation 9) and the average value of the logarithm of ACV calculated in S70 (Mean (ln (ACV ))) And the standard deviation of the logarithm of ACV (SD (ln (ACV))) are substituted to calculate the corrected amplitude (ACVscore) (S72).
(Formula 9) ACVscore = [ln (ACV) −Mean (ln (ACV))] / SD (ln (ACV)) × 1.0 + 5.0
(式9)ACVscore=[ln(ACV)-Mean(ln(ACV))]/SD(ln(ACV))×1.0+5.0 The
(Formula 9) ACVscore = [ln (ACV) −Mean (ln (ACV))] / SD (ln (ACV)) × 1.0 + 5.0
S46(図6参照)では、表示部44は、S44で算出されたACVscoreを画面に表示する。なお、表示部44は、ACVscoreの履歴、FCV(の対数値)、S64で算出されるACVの対数値、及び/又はS60で作成されるCVHRの加算平均時系列のグラフ等を表示してもよい。また、表示部44は、CVHRの出現時刻を、R-R間隔時系列データと合わせて表示してもよいし、経皮的動脈血酸素飽和度(SpO2)や他の解析結果と併せて表示してもよい。また、表示部44は、CVHRの出現頻度が最大となる短い時刻帯(例えば30分間)及びその間のCVHRの出現頻度等を表示してもよい。また、CVHR形状測定装置2では、表示部44の代わりに、音声出力部がACVscoreをアナウンスする構成であってもよい。
In S46 (see FIG. 6), the display unit 44 displays the ACVscore calculated in S44 on the screen. The display unit 44 may display an ACVscore history, FCV (logarithmic value thereof), ACV logarithmic value calculated in S64, and / or a graph of the CVHR addition average time series created in S60, and the like. Good. Further, the display unit 44 may display the appearance time of the CVHR together with the RR interval time series data, or together with the percutaneous arterial oxygen saturation (SpO 2 ) and other analysis results. May be. In addition, the display unit 44 may display a short time zone (for example, 30 minutes) in which the appearance frequency of CVHR is maximum, the appearance frequency of CVHR in the meantime, and the like. Further, in the CVHR shape measuring apparatus 2, the audio output unit may announce ACVscore instead of the display unit 44.
図13(a)、(b)は、それぞれS60で作成されるCVHRの加算平均時系列のグラフD、Eを示す。図13(a)のグラフDは予後が良い被験者の例であり、図13(b)のグラフEは、1年後に死亡した被験者の例である。グラフDとグラフEを比較すると、グラフDは大きく振動する一方で、グラフEはほとんど振動していない。このため、グラフDのACVのほうが、グラフEのACVよりも格段に大きい。ACVは補正前の指標であるため、両者の比較は完全に公平とは言えないものの、両者のACVの差は歴然としており、予後が良い被験者のほうが、所定期間経過後に死亡した被験者よりも、ACV(即ち、無呼吸・低呼吸負荷における心拍応答の強さ)が大きいことがわかる。
FIGS. 13A and 13B show graphs D and E of CVHR addition average time series created in S60, respectively. Graph D in FIG. 13A is an example of a subject with a good prognosis, and graph E in FIG. 13B is an example of a subject who died one year later. Comparing the graph D and the graph E, the graph D vibrates greatly, while the graph E hardly vibrates. For this reason, the ACV of graph D is much larger than the ACV of graph E. Since ACV is an index before correction, the comparison between the two is not completely fair, but the difference between the two ACVs is obvious, and subjects with a better prognosis than subjects who died after a certain period of time It can be seen that ACV (that is, the strength of the heartbeat response in apnea / hypopnea load) is large.
図14(a)~(d)は、それぞれ同一の病状又は病態を有する集団のACVscoreと死亡率(Mortality)の関係を示すKaplan-Meier曲線である。図14(a)は急性心筋梗塞に罹患した集団(n=715人、追跡期間中央値=748日)の死亡率を示し、図14(b)は急性心筋梗塞に罹患した別の集団(n=217、追跡期間中央値=1338日)の死亡率を示し、図14(c)は末期腎不全血液透析患者の集団(n=297、追跡期間中央値=2549日)の死亡率を示し、図14(d)は慢性心不全に罹患した集団(n=77、追跡期間中央値=1172日)の死亡率を示す。図14(a)~(d)のいずれも、少なくとも180日経過後は、ACVscoreが大きいほど同一期間内における死亡率が低くなっている。また、ACVscoreが小さいほど、死亡率の増加割合が急になっており、期間が経過するにつれてACVscore別の死亡率の差が顕著になっている。このことから、ACVscoreと死亡率には強い関連性があることが分かる。ACVscoreは、病気の種類に関わらず、人間の所定期間内における死亡率を予測する強力な指標となることが分かる。また、図14(a)~(d)のいずれの場合も、ACVscore≦3.0と4.0≦ACVscoreの間には、死亡率の増加の推移に顕著な差がある。このため、例えばACVscoreが3.0以下の心不全の患者に対しては、心臓移植を優先して行うことを決定することができる。また、ACVscoreが3.0以下の心筋梗塞後の患者や重症の不整脈に罹患している患者に対しては、埋込型除細動器を適用することを決定することができる。このように、様々な疾患において、ACVscoreの値を治療方針の決定に役立てることができる。なお、本実施例ではACVscoreと死亡率の関連性を調べたが、本発明者の研究の結果、ACVscoreは、死亡率以外の様々な健康リスクとも強い関連性を示すことが確認されている。
FIGS. 14 (a) to (d) are Kaplan-Meier curves showing the relationship between ACVscore and mortality (Morality) of populations having the same disease state or condition. FIG. 14 (a) shows the mortality of a population suffering from acute myocardial infarction (n = 715, median follow-up = 748 days), and FIG. 14 (b) shows another population suffering from acute myocardial infarction (n = 217, median follow-up time = 1338 days), and Figure 14 (c) shows the mortality of a population of end-stage renal failure hemodialysis patients (n = 297, median follow-up time = 2549 days) FIG. 14 (d) shows the mortality of the population suffering from chronic heart failure (n = 77, median follow-up = 1172 days). 14A to 14D, after at least 180 days, the mortality rate in the same period decreases as the ACVscore increases. Further, the smaller the ACVscore, the more the rate of increase in the mortality rate becomes steeper, and the difference in mortality rate by ACVscore becomes more prominent as the period elapses. This shows that there is a strong association between ACVscore and mortality. It can be seen that ACVscore is a powerful indicator for predicting mortality in a given period of time regardless of the type of illness. 14A to 14D, there is a significant difference in the transition of increase in mortality between ACVscore ≦ 3.0 and 4.0 ≦ ACVscore. For this reason, for example, it is possible to determine to give priority to heart transplantation for patients with heart failure whose ACVscore is 3.0 or less. In addition, it is possible to decide to apply an implantable cardioverter defibrillator to a patient after myocardial infarction whose ACV score is 3.0 or less or a patient suffering from severe arrhythmia. Thus, in various diseases, the value of ACVscore can be used to determine the treatment policy. In this example, the relationship between ACVscore and mortality was examined. As a result of the inventor's research, it has been confirmed that ACVscore has a strong relationship with various health risks other than mortality.
本実施例のCVHR形状測定装置2では、ディップ検出部18~ディップ群特定部30からなるCVHR検出手段が、人間の就床時の心拍を時系列で示したデータから、心拍数周期性変動(CVHR)を検出する。ACV対数算出部32は、CVHRの振幅(ACV)を測定し、その対数を算出する。ACVの大きさと所定期間内における死亡率などの健康リスクの程度(健康リスク)は密接に関連している。このため、CVHR形状測定装置2が測定したACVを参照することにより、人間の健康リスクを従来よりも正確に予測できる。
In the CVHR shape measuring apparatus 2 according to the present embodiment, the CVHR detecting means including the dip detecting unit 18 to the dip group specifying unit 30 detects heart rate periodic fluctuation ( CVHR) is detected. The ACV logarithm calculation unit 32 measures the amplitude (ACV) of the CVHR and calculates the logarithm thereof. The magnitude of ACV and the degree of health risk (health risk) such as mortality within a predetermined period are closely related. For this reason, by referring to the ACV measured by the CVHR shape measuring apparatus 2, the human health risk can be predicted more accurately than before.
また、本実施例のCVHR形状測定装置2は、複数のCVHRのそれぞれを加算平均することによりACVを測定する。これにより、複数のCVHRのそれぞれの形状が異なる場合であっても、ACVの信頼性が高くなり、就床時の無呼吸負荷又は低呼吸負荷に対する人間の心拍応答の強さをより正確に反映したACVを求めることができる。
Also, the CVHR shape measuring apparatus 2 of this embodiment measures ACV by averaging each of a plurality of CVHRs. As a result, even when the shapes of the plurality of CVHRs are different, the reliability of the ACV is increased, and the strength of the human heartbeat response to the apnea load or the low respiratory load at bedtime is reflected more accurately. ACV can be obtained.
また、図3(b)で示すように、ACVの対数の平均値は、FCVの対数に比例する。このため、2人の被験者のACVが同一であったとしても、一方の被験者のFCVが小さく、他方の被験者のFCVが大きい場合は、そのACV値が意味する健康リスクが異なる。本実施例のCVHR形状測定装置2では、ACVscore算出部36が、FCV対数算出部34で算出したFCVの対数値に基づいて、ACV対数算出部32で算出したACVの対数値を補正し、補正済振幅(ACVscore)を算出する。ACVscoreは、FCVの値から独立した汎用的な指標となる。このため、ACVscoreを用いることで、被験者の健康リスクを、FCVの値によらずに正確に予測することができる。また、FCVが大きく異なる被験者同士の健康リスクを正確に比較することができる。
In addition, as shown in FIG. 3B, the average value of the logarithm of ACV is proportional to the logarithm of FCV. For this reason, even if the ACVs of two subjects are the same, if the FCV of one subject is small and the FCV of the other subject is large, the health risk that the ACV value means is different. In the CVHR shape measuring apparatus 2 of the present embodiment, the ACVscore calculating unit 36 corrects the logarithmic value of the ACV calculated by the ACV logarithmic calculating unit 32 based on the logarithmic value of the FCV calculated by the FCV logarithmic calculating unit 34, and A finished amplitude (ACVscore) is calculated. ACVscore is a general-purpose index that is independent of the FCV value. For this reason, by using ACVscore, the health risk of the subject can be accurately predicted regardless of the FCV value. In addition, it is possible to accurately compare the health risks of subjects with significantly different FCVs.
また、本実施例のCVHR形状測定装置2では、ACVscore算出部36が、被験者毎のACV及びFCVが蓄積されたデータベースから導き出された2つの関数:f(x)=0.14x+4.2(x:FCVの対数、f(x):ACVの平均値)とg(x)=0.064x2-0.36x+0.90(x:FCVの対数、g(x):ACVの対数の標準偏差)を利用してACVの対数値を補正する。データベースから導き出された関数を補正に用いることで、ACVscoreの汎用性を向上することができる。特に、本実施例のデータベースは、急性心筋梗塞や末期腎不全といった様々な病気に罹患した被験者の21万例のACVとFCVを蓄積しているため、このようなデータベースを用いることで、信頼性の高い近似関数を構築することができる。
Moreover, in the CVHR shape measuring apparatus 2 of the present embodiment, the ACVscore calculating unit 36 has two functions derived from the database in which ACV and FCV for each subject are accumulated: f (x) = 0.14x + 4.2 (x : Logarithm of FCV, f (x): average value of ACV) and g (x) = 0.064x 2 −0.36x + 0.90 (x: logarithm of FCV, g (x): standard deviation of logarithm of ACV) Is used to correct the logarithmic value of ACV. By using the function derived from the database for correction, the versatility of the ACVscore can be improved. In particular, since the database of this example accumulates 210,000 ACVs and FCVs of subjects suffering from various diseases such as acute myocardial infarction and end-stage renal failure, reliability is improved by using such a database. A high approximation function can be constructed.
また、本実施例のCVHR形状測定装置2では、R-R間隔時系列データとして、ホルター心電計で測定したデータを使用する。このため、従来のようにデータ取得のために入院したりする必要がなくなり、手軽にデータを入手できる。ACVscoreを、日常生活において無侵襲かつ安全に繰り返し取得することができる。このため、継続してACVscoreを測定し、その値の推移を観察することにより、CVHR形状測定装置を、治療の効果や、生活習慣(飲酒、喫煙等)又は生活環境(PM2.5等)の改善効果を検証する目的で使用することができる。ACVscoreを、健康状態を図る指標として、医療分野で利用したり、自身の健康管理のために利用したりすることができる。また、人間の活動とその活動が心拍に及ぼす影響との相関を把握できるようになるため、研究目的にも利用できる(生活水準、ストレス等)。また、これらのデータは様々な装置で取得可能であるため、データを集積し易く、膨大なデータが蓄積されたデータベースを構築することが可能となる。データベース内のデータが増えることで、例えば病気の種類毎の傾向を分析する等、より詳細な分析が可能となる。結果として、ACVscoreの信頼性や応用性を向上させ易くなる。
Further, in the CVHR shape measuring apparatus 2 of the present embodiment, data measured with a Holter electrocardiograph is used as RR interval time series data. For this reason, it is not necessary to be hospitalized for data acquisition as in the prior art, and data can be easily obtained. ACVscore can be obtained repeatedly in a non-invasive and safe manner in daily life. For this reason, by continuously measuring ACVscore and observing the transition of its value, CVHR shape measuring device can be used for treatment effects, lifestyle habits (drinking, smoking, etc.) or living environment (PM2.5, etc.). It can be used for the purpose of verifying the improvement effect. ACVscore can be used in the medical field as an indicator for health status, or can be used for own health management. In addition, since it becomes possible to grasp the correlation between human activities and the effects of those activities on heart rate, it can also be used for research purposes (standard of living, stress, etc.). Moreover, since these data can be acquired by various apparatuses, it is easy to accumulate data, and it is possible to construct a database in which a large amount of data is accumulated. Increasing the data in the database enables more detailed analysis, for example, analyzing trends for each type of disease. As a result, it becomes easy to improve the reliability and applicability of ACVscore.
また、発明者が鋭意研究した結果、ACVscoreの健康リスクの予測力は、ホルター心電計等で24時間R-R間隔を測定した場合の健康リスクの予測力と同等かそれ以上に高いものであることがわかった。このため、測定データにCVHRが1回でも出現していれば、24時間のデータ測定が不要となった。特に、本実施例のCVHR形状測定装置2は、就床時のR-R間隔時系列データを使用するため、従来のようにホルター心電計を24時間装着する必要がない。このため、活動時にホルター心電計を装着する煩わしさがなくなり、従来よりも手軽に且つ快適にデータ測定が可能になると共に、従来と同等又はそれ以上の精度で健康リスクを予測できる。また、発明者が上記のデータベースを分析した結果、CVHRは男性の96.9%、女性の96.0%と非常に高い確率で発生することが分かった。ACVscoreはCVHRが1回でも発生する場合に算出可能である。このため、ACVscoreは、ほぼ全ての被験者が測定可能な指標となり、指標としての利便性が高い。
In addition, as a result of inventor's earnest research, ACVscore's predictive power of health risk is equal to or higher than predictive power of health risk when measuring 24-hour RR interval with Holter electrocardiograph etc. I found out. For this reason, if CVHR appears even once in the measurement data, data measurement for 24 hours becomes unnecessary. In particular, since the CVHR shape measuring apparatus 2 of this embodiment uses the RR interval time series data at the time of bedtime, it is not necessary to wear a Holter electrocardiograph for 24 hours as in the prior art. This eliminates the trouble of wearing a Holter electrocardiograph during activities, makes it possible to measure data more easily and comfortably than before, and predicts health risks with accuracy equal to or higher than before. Further, as a result of analysis of the above database by the inventor, it was found that CVHR occurs with a very high probability of 96.9% for men and 96.0% for women. ACVscore can be calculated when CVHR occurs even once. For this reason, ACVscore is an index that can be measured by almost all subjects, and is highly convenient as an index.
(変形例) 実施例1ではACVscoreを用いて健康リスクを予測したが、健康リスクを予測する指標はこれに限られない。例えば、CVHRの波形の傾き、CVHRの波形の持続時間に対する振幅の比、又はCVHRの波形の面積を指標として用いてもよい。図15はR-R間隔時系列データから抜粋した平滑後のCVHRの波形を示す。CVHRの波形は、点A、B、Cを有する。点Bは極小点である。点Aは点Bに最も近い極大点であり、点Bよりも前に出現する。点Cは点Bに最も近い極大点であり、点Bよりも後に出現する。ACVは直線ACと点Bとの距離であり、賦活化時間AT(Activation Time)は点Aから点Bまでの経過時間であり、回復時間RT(Recovery Time)は点Bから点Cまでの経過時間であり、持続時間DCV(Duration of Cyclic Variation)は点Aから点Cまでの経過時間である。CVHRの波形の傾きには、賦活化スロープAS(Activation Slope)と、回復スロープRS(Recovery Slope)の2種類ある。賦活化スロープ及び回復スロープは、それぞれAS=ACV/AT、RS=ACV/RTで定義される。また、CVHRの波形の持続時間に対する振幅の比は、ACV/DCVと定義され、CVHRの波形の面積は、CVHRの波形と直線ACによって囲まれた範囲の大きさとして定義される。
(Modification) Although the health risk was predicted using ACVscore in Example 1, the index for predicting the health risk is not limited to this. For example, the slope of the CVHR waveform, the ratio of the amplitude to the duration of the CVHR waveform, or the area of the CVHR waveform may be used as an index. FIG. 15 shows a smoothed CVHR waveform extracted from RR interval time-series data. The waveform of CVHR has points A, B, and C. Point B is a local minimum point. Point A is the local maximum point closest to point B, and appears before point B. Point C is the local maximum point closest to point B, and appears after point B. ACV is the distance between straight line AC and point B, activation time AT (Activation Time) is the elapsed time from point A to point B, and recovery time RT (Recovery Time) is the time from point B to point C It is time, and the duration DCV (Duration of Cyclic Variation) is the elapsed time from point A to point C. There are two types of slope of the waveform of CVHR: activation slope AS (Activation Slope) and recovery slope RS (Recovery Slope). The activation slope and the recovery slope are defined as AS = ACV / AT and RS = ACV / RT, respectively. The ratio of the amplitude of the CVHR waveform to the duration is defined as ACV / DCV, and the area of the CVHR waveform is defined as the size of the range surrounded by the CVHR waveform and the straight line AC.
次の表1、表2は、CVHRの波形の各形状特性指標(指標)と病気別の死亡リスクを表す。データは、コックス・ハザード回帰分析によるハザード比(HR)、その95%信頼限界(CI)、χ2値、及び有意確率(P)を示す。HRは、各指標が1低下したときに死亡率が何倍になるかを示す。χ2値は死亡リスクの予測力の高さを示し、値が大きいほど予測力が高いことを意味する。


表1、2によると、FCVの有意確率Pはいずれの病気においても5%以上であるため、死亡リスクとの間には有意な関連がないことが分かる。他方、FCV以外の指標(即ち、ACVの自然対数、ACVscore、賦活化スロープAS、回復スロープRS、持続時間に対する振幅の比ACV/DCV、及び面積(Area))の有意確率Pはいずれの病気においても5%未満であるため、死亡リスクとの間には有意な関連があり、死亡リスクを予測する指標として有用であることが分かる。特に、各指標のχ2値を病気別に比較すると、いずれの病気においてもACVscoreのχ2値が最大となっている。このため、ACVscoreが最も精度良く死亡リスクを予測できる指標であることが分かる。
The following Tables 1 and 2 show each shape characteristic index (index) of the waveform of CVHR and the mortality risk by disease. Data hazard ratio by Cox hazard regression analysis (HR), indicating that 95% confidence limits (CI), chi 2 value, and the significance probability (P). HR indicates how many times the mortality rate is increased when each index decreases by one. The χ 2 value indicates the high predictive power of mortality risk, and a larger value means higher predictive power.
According to Tables 1 and 2, since the significance probability P of FCV is 5% or more in any disease, it can be seen that there is no significant association with the risk of death. On the other hand, the significance probability P of indices other than FCV (ie, natural logarithm of ACV, ACVscore, activation slope AS, recovery slope RS, ratio of amplitude to duration ACV / DCV, and area (Area)) Is less than 5%, it is found that there is a significant relationship with the risk of death, which is useful as an index for predicting the risk of death. In particular, when the χ 2 value of each index is compared for each disease, the χ 2 value of ACVscore is the maximum for any disease. Therefore, it can be seen that ACVscore is the index that can predict the death risk with the highest accuracy.
以上、本明細書が開示する技術の実施例について詳細に説明したが、これらは例示に過ぎず、本明細書が開示するCVHR形状測定装置は、上記の実施例を様々に変形、変更したものが含まれる。例えば、実施例1ではホルター心電計を用いてデータを測定したが、データ測定に用いる装置はこれに限られない。例えば、ベッドサイドモニタ、睡眠呼吸障害の検査装置(CPAP装置等)、寝室と寝具とを組み合わせたセンサ、腕時計型センサ、眼鏡型センサ、衣類電極、皮膚に貼付するテープ型センサ、又は埋込型センサ等を用いてデータを測定してもよい。また、心拍数又は脈拍数は、種々の方法によって測定され得る。例えば、心拍数又は脈拍数は、心音、血管音、皮膚温、身体の振動、身体の重心の位置の振動、脈波(圧、容積、血流速度、組織血液(ヘモグロビン吸光)量、生体インピーダンス)などに基づいて測定されてもよい。
As mentioned above, although the Example of the technique which this specification discloses was described in detail, these are only illustrations, The CVHR shape measuring apparatus which this specification discloses is what variously modified and changed said Example. Is included. For example, in Example 1, data was measured using a Holter electrocardiograph, but the apparatus used for data measurement is not limited to this. For example, a bedside monitor, a sleep breathing disorder inspection device (CPAP device, etc.), a sensor combining a bedroom and bedding, a wristwatch sensor, a spectacle sensor, a clothing electrode, a tape sensor attached to the skin, or an implantable sensor Data may be measured using a sensor or the like. In addition, the heart rate or the pulse rate can be measured by various methods. For example, heart rate or pulse rate is heart sound, blood vessel sound, skin temperature, body vibration, body center of gravity vibration, pulse wave (pressure, volume, blood flow velocity, tissue blood (hemoglobin absorption) amount, bioimpedance ) Or the like.
また、実施例1では就床時のR-R間隔時系列データが用いられたが、用いられるデータは就床時のものに限られない。CVHRが検出できれば、覚醒時のデータが用いられてもよい。例えば、高齢者や心不全の患者では、覚醒時であっても無呼吸又は低呼吸になる場合があり、覚醒時にCVHRが検出されることがある。また、実施例1では人間のデータが用いられたが、人間に限られず、動物(厳密には、肺呼吸する動物)のデータを用いてもよい。即ち、本明細書が開示するCVHR形状測定装置は、人間を含む、肺呼吸する動物全般を対象としてもよい。
In the first embodiment, the RR interval time series data at the time of bed is used, but the data used is not limited to that at the time of bed. If CVHR can be detected, data at awakening may be used. For example, in elderly people or patients with heart failure, apnea or hypopnea may occur even when awake, and CVHR may be detected during awakening. In the first embodiment, human data is used. However, the present invention is not limited to human data, and data of animals (strictly, animals that breathe through the lungs) may be used. That is, the CVHR shape measuring device disclosed in the present specification may be intended for all animals that breathe through the lung, including humans.
また、実施例1ではCVHR形状測定装置2を通信回線14を介してR-R間隔測定装置に接続したが、この構成に限られない。例えば、ACV(ACVscore)を測定するアルゴリズムを、ホルター心電図解析装置に組み込んでもよいし、ウェアラブルな脈波計に組み込んでもよい。
In the first embodiment, the CVHR shape measuring device 2 is connected to the RR interval measuring device via the communication line 14, but the present invention is not limited to this configuration. For example, an algorithm for measuring ACV (ACVscore) may be incorporated into a Holter electrocardiogram analyzer or a wearable pulse wave meter.
また、CVHRの検出手段は実施例1の手法に限られない。例えば、本願発明者らが開発した公知のアルゴリズムを利用してもよい。また、上記のCVHRの検出手法では、少なくとも4つのCVHRが群となって検出される。しかしながら、1つのCVHRを検出できるアルゴリズムを用いてもよい。また、CVHR形状測定装置2は、表示部44を備えていなくてもよい。例えば、CVHR形状測定装置2を別の装置に接続し、当該別の装置からACVの測定結果を出力してもよい。
Also, the CVHR detection means is not limited to the method of the first embodiment. For example, a known algorithm developed by the present inventors may be used. In the CVHR detection method, at least four CVHRs are detected as a group. However, an algorithm that can detect one CVHR may be used. Further, the CVHR shape measuring device 2 may not include the display unit 44. For example, the CVHR shape measuring apparatus 2 may be connected to another apparatus, and the ACV measurement result may be output from the other apparatus.
また、ACVの算出手段は実施例1の手法に限られない。例えば、ACV対数算出部32は、ディップ深さ算出部20で算出したディップ深さDiのうち、S38で検出された全てのCVHRのそれぞれのディップ深さDiの平均をとることによりACVを算出してもよい。あるいは、ACV対数算出部32は、各CVHRに対してS62と同様の処理を実行してもよい。即ち、ACV対数算出部32は、CVHRの底時刻の前の60秒間における最大値と、当該CVHRの底時刻の後の60秒間における最大値を結ぶ直線を作成してもよい。そして、当該直線と、底時刻における当該CVHRの値の差を算出することにより、当該CVHRの振幅を求めてもよい。この処理をS38で検出された全てのCVHRに実施し、それぞれの振幅の平均を取ることによりACVを算出してもよい。
Further, the ACV calculation means is not limited to the method of the first embodiment. For example, the ACV logarithm calculation unit 32 calculates the ACV by taking the average of the dip depths Di of all the CVHRs detected in S38 among the dip depths Di calculated by the dip depth calculation unit 20. May be. Alternatively, the ACV logarithm calculation unit 32 may execute the same processing as S62 for each CVHR. That is, the ACV logarithm calculation unit 32 may create a straight line connecting the maximum value for 60 seconds before the bottom time of the CVHR and the maximum value for 60 seconds after the bottom time of the CVHR. Then, the amplitude of the CVHR may be obtained by calculating the difference between the straight line and the value of the CVHR at the bottom time. This process may be performed for all CVHRs detected in S38, and the ACV may be calculated by taking the average of the respective amplitudes.
また、実施例1ではACVをFCVに基づいて補正したが、ACV以外の指標(例えば、AS、RS、ACV/DCV、又は面積)をFCVに基づいて補正してもよい。また、これらの指標を、FCV以外の要素(例えば、CVHRの幅)に基づいて補正してもよい。また、ディップの回復時間RTを健康リスクを予測する指標として用いてもよい。
In the first embodiment, ACV is corrected based on FCV. However, an index (for example, AS, RS, ACV / DCV, or area) other than ACV may be corrected based on FCV. These indices may be corrected based on elements other than FCV (for example, the width of CVHR). The dip recovery time RT may be used as an index for predicting the health risk.
以上、本発明の具体例を詳細に説明したが、これらは例示にすぎず、請求の範囲を限定するものではない。請求の範囲に記載の技術には、以上に例示した具体例を様々に変形、変更したものが含まれる。また、本明細書又は図面に説明した技術要素は、単独であるいは各種の組合せによって技術的有用性を発揮するものであり、出願時請求項記載の組合せに限定されるものではない。また、本明細書又は図面に例示した技術は複数目的を同時に達成するものであり、そのうちの一つの目的を達成すること自体で技術的有用性を持つものである。
Although specific examples of the present invention have been described in detail above, these are merely examples and do not limit the scope of the claims. The technology described in the claims includes various modifications and changes of the specific examples illustrated above. Further, the technical elements described in the present specification or drawings exhibit technical usefulness alone or in various combinations, and are not limited to the combinations described in the claims at the time of filing. Moreover, the technique illustrated in this specification or the drawings achieves a plurality of objects at the same time, and has technical usefulness by achieving one of the objects.
Claims (8)
- 心拍又は脈拍の周期又は周波数を時系列で示したデータから、心拍数周期性変動(cyclic variation of heart rate, CVHR)を検出するCVHR検出手段と、
前記CVHR検出手段で検出された前記CVHRの波形に対して、次の形状特性指標:振幅(amplitude of cyclic variation,ACV)、傾き、持続時間に対する前記振幅の比、及び面積の少なくとも1つを取得するCVHR形状特性指標取得手段と、を備える、CVHR形状測定装置。 CVHR detection means for detecting a heart rate periodicity variation (CVHR) from data indicating a heartbeat or a pulse period or frequency in time series;
For the CVHR waveform detected by the CVHR detector, obtain at least one of the following shape characteristic indices: amplitude of cyclic variation (ACV), slope, ratio of the amplitude to duration, and area. A CVHR shape measurement apparatus comprising: a CVHR shape characteristic index acquisition means. - 前記CVHR形状特性指標取得手段は、前記データの所定の期間中に検出された複数の前記CVHRのそれぞれの波形を示す前記データを加算平均することにより前記ACV、前記傾き、前記持続時間に対する前記振幅の比、及び前記面積の少なくとも1つを取得する、請求項1に記載のCVHR形状測定装置。 The CVHR shape characteristic index acquisition means averages the data indicating respective waveforms of the plurality of CVHR detected during a predetermined period of the data, thereby calculating the amplitude with respect to the ACV, the slope, and the duration. The CVHR shape measuring apparatus according to claim 1, wherein at least one of the ratio and the area is acquired.
- 前記所定の期間中にCVHR検出手段で検出された前記CVHRの単位時間当たりの頻度(frequency of cyclic variation, FCV)を取得するFCV取得手段と、
前記ACVを前記FCVの値に基づいて補正して、補正済振幅(ACVscore)を取得するACV補正手段と、をさらに備える、請求項2に記載のCVHR形状測定装置。 FCV acquisition means for acquiring a frequency per unit time (FCV) of the CVHR detected by the CVHR detection means during the predetermined period;
The CVHR shape measuring apparatus according to claim 2, further comprising: an ACV correcting unit that corrects the ACV based on the value of the FCV to obtain a corrected amplitude (ACVscore). - 前記ACV補正手段は、
前記所定の期間中のデータから取得されたACVと、そのACVを取得した前記所定の期間中のデータから取得されたFCVとを関連付けて複数組蓄積されたデータベースから導き出された次の2つの関数:前記FCVの関数である前記ACVの平均値関数、及び前記FCVの関数である前記ACVの標準偏差関数を用いて、前記ACVを補正するものであって、
前記CVHR形状特性指標取得手段で取得されたACVを、そのACVを取得した前記所定の期間中のデータから取得されたFCVに対応する、前記平均値関数から得られる平均値及び前記標準偏差関数から得られる標準偏差を用いて補正する、
請求項3に記載のCVHR形状測定装置。 The ACV correction means includes
The following two functions derived from a database stored in a plurality of sets by associating the ACV acquired from the data during the predetermined period and the FCV acquired from the data during the predetermined period from which the ACV was acquired The ACV is corrected using an average value function of the ACV that is a function of the FCV and a standard deviation function of the ACV that is a function of the FCV,
From the average value obtained from the average value function and the standard deviation function, the ACV obtained by the CVHR shape characteristic index obtaining means corresponds to the FCV obtained from the data during the predetermined period from which the ACV was obtained. Correct using the standard deviation obtained,
The CVHR shape measuring apparatus according to claim 3. - 前記データは、R-R間隔、脈拍間隔、心拍動間隔のいずれかを時系列で示したデータである、請求項1~4のいずれか一項に記載のCVHR形状測定装置。 The CVHR shape measuring apparatus according to any one of claims 1 to 4, wherein the data is data indicating any one of an RR interval, a pulse interval, and a heartbeat interval in time series.
- 心拍又は脈拍の周期又は周波数を時系列で示したデータから特定される、周期的に出現する心拍数周期性変動(cyclic variation of heart rate, CVHR)を入力するCVHR入力手段と、
前記CVHR入力手段で入力された前記CVHRの波形に対して、次の形状特性指標:振幅(amplitude of cyclic variation,ACV)、傾き、持続時間に対する前記振幅の比、及び面積の少なくとも1つを取得するCVHR形状特性指標取得手段と、を備える、CVHR形状測定装置。 CVHR input means for inputting a periodically appearing heart rate periodicity (CVHR) specified from data representing a heartbeat or a pulse period or frequency in time series;
Acquire at least one of the following shape characteristic indices: amplitude of cyclic variation (ACV), slope, ratio of amplitude to duration, and area for the CVHR waveform input by the CVHR input means. A CVHR shape measurement apparatus comprising: a CVHR shape characteristic index acquisition means. - 心拍又は脈拍の周期又は周波数を時系列で示したデータからCVHRを検出するCVHR検出処理と、
前記CVHR検出処理で検出された前記CVHRの波形に対して、次の形状特性指標:振幅(ACV)、傾き、持続時間に対する前記振幅の比、及び面積の少なくとも1つを取得するCVHR形状特性指標取得処理と、をコンピュータに実行させる、コンピュータプログラム。 CVHR detection processing for detecting CVHR from time-series data indicating the heartbeat or pulse period or frequency;
A CVHR shape characteristic index for obtaining at least one of the following shape characteristic indices: amplitude (ACV), slope, ratio of amplitude to duration, and area with respect to the CVHR waveform detected in the CVHR detection process. A computer program for causing a computer to execute an acquisition process. - 心拍又は脈拍の周期又は周波数を時系列で示したデータから、心拍数周期性変動(cyclic variation of heart rate, CVHR)を検出するCVHR検出手段と、
前記CVHR検出手段で検出された前記CVHRの波形の形状を取得するCVHR形状取得手段と、
前記CVHR形状取得手段で取得された前記CVHRの形状のみから健康リスクを評価する評価手段と、を備える、CVHR形状測定装置。 CVHR detection means for detecting a heart rate periodicity variation (CVHR) from data indicating a heartbeat or a pulse period or frequency in time series;
CVHR shape acquisition means for acquiring the shape of the waveform of the CVHR detected by the CVHR detection means;
CVHR shape measuring apparatus comprising: evaluation means for evaluating health risk only from the shape of the CVHR acquired by the CVHR shape acquisition means.
Priority Applications (2)
| Application Number | Priority Date | Filing Date | Title |
|---|---|---|---|
| DE112016001171.7T DE112016001171T5 (en) | 2015-03-12 | 2016-01-05 | CVHR-shape measurement apparatus |
| US15/557,778 US20180070836A1 (en) | 2015-03-12 | 2016-01-05 | Cvhr shape measurement devices |
Applications Claiming Priority (2)
| Application Number | Priority Date | Filing Date | Title |
|---|---|---|---|
| JP2015049863A JP6372824B2 (en) | 2015-03-12 | 2015-03-12 | CVHR shape measuring device |
| JP2015-049863 | 2015-03-12 |
Publications (1)
| Publication Number | Publication Date |
|---|---|
| WO2016143365A1 true WO2016143365A1 (en) | 2016-09-15 |
Family
ID=56880042
Family Applications (1)
| Application Number | Title | Priority Date | Filing Date |
|---|---|---|---|
| PCT/JP2016/050154 WO2016143365A1 (en) | 2015-03-12 | 2016-01-05 | Cvhr shape measurement device |
Country Status (4)
| Country | Link |
|---|---|
| US (1) | US20180070836A1 (en) |
| JP (1) | JP6372824B2 (en) |
| DE (1) | DE112016001171T5 (en) |
| WO (1) | WO2016143365A1 (en) |
Cited By (2)
| Publication number | Priority date | Publication date | Assignee | Title |
|---|---|---|---|---|
| WO2020203935A1 (en) * | 2019-04-03 | 2020-10-08 | 帝人株式会社 | Sleep state detection device, sleep state detection method, and sleep state detection program |
| JP2020168212A (en) * | 2019-04-03 | 2020-10-15 | 帝人株式会社 | Sleep state detection device, sleep state detection method, and sleep state detection program |
Families Citing this family (1)
| Publication number | Priority date | Publication date | Assignee | Title |
|---|---|---|---|---|
| US20220399122A1 (en) * | 2019-11-01 | 2022-12-15 | Nec Corporation | Risk prediction apparatus, risk prediction method, and computer program |
Citations (3)
| Publication number | Priority date | Publication date | Assignee | Title |
|---|---|---|---|---|
| JP2003230541A (en) * | 2002-02-08 | 2003-08-19 | Nippon Colin Co Ltd | Superior limb-inferior limb blood pressure index- measuring system |
| JP2010051387A (en) * | 2008-08-26 | 2010-03-11 | Nagoya City Univ | Device for detecting cvhr accompanying apnea attack or infrequent respiration attack of sleep-disordered respiration |
| US20100204586A1 (en) * | 2009-02-12 | 2010-08-12 | Cardionet, Inc. | Detecting Sleep Disorders Using Heart Activity |
-
2015
- 2015-03-12 JP JP2015049863A patent/JP6372824B2/en active Active
-
2016
- 2016-01-05 US US15/557,778 patent/US20180070836A1/en not_active Abandoned
- 2016-01-05 WO PCT/JP2016/050154 patent/WO2016143365A1/en active Application Filing
- 2016-01-05 DE DE112016001171.7T patent/DE112016001171T5/en not_active Withdrawn
Patent Citations (3)
| Publication number | Priority date | Publication date | Assignee | Title |
|---|---|---|---|---|
| JP2003230541A (en) * | 2002-02-08 | 2003-08-19 | Nippon Colin Co Ltd | Superior limb-inferior limb blood pressure index- measuring system |
| JP2010051387A (en) * | 2008-08-26 | 2010-03-11 | Nagoya City Univ | Device for detecting cvhr accompanying apnea attack or infrequent respiration attack of sleep-disordered respiration |
| US20100204586A1 (en) * | 2009-02-12 | 2010-08-12 | Cardionet, Inc. | Detecting Sleep Disorders Using Heart Activity |
Cited By (3)
| Publication number | Priority date | Publication date | Assignee | Title |
|---|---|---|---|---|
| WO2020203935A1 (en) * | 2019-04-03 | 2020-10-08 | 帝人株式会社 | Sleep state detection device, sleep state detection method, and sleep state detection program |
| JP2020168212A (en) * | 2019-04-03 | 2020-10-15 | 帝人株式会社 | Sleep state detection device, sleep state detection method, and sleep state detection program |
| JP7159099B2 (en) | 2019-04-03 | 2022-10-24 | 帝人株式会社 | Sleep state detection device, sleep state detection method, and sleep state detection program |
Also Published As
| Publication number | Publication date |
|---|---|
| JP6372824B2 (en) | 2018-08-15 |
| DE112016001171T5 (en) | 2017-11-30 |
| US20180070836A1 (en) | 2018-03-15 |
| JP2016168188A (en) | 2016-09-23 |
Similar Documents
| Publication | Publication Date | Title |
|---|---|---|
| JP6508417B2 (en) | Monitoring of sleep phenomena | |
| KR101656611B1 (en) | Method for obtaining oxygen desaturation index using unconstrained measurement of bio-signals | |
| US10492720B2 (en) | System and method for determining sleep stage | |
| EP1711104B1 (en) | Method and apparatus for ecg-derived sleep disordered breathing monitoring, detection and classification | |
| CN107072594B (en) | Method and apparatus for assessing respiratory distress | |
| US9943237B2 (en) | Analysis of direct and indirect heartbeat data variations | |
| JP5303802B2 (en) | Apnea / hypopnea index derived from ECG | |
| Dehkordi et al. | Pulse rate variability compared with heart rate variability in children with and without sleep disordered breathing | |
| Khreis et al. | Breathing rate estimation using kalman smoother with electrocardiogram and photoplethysmogram | |
| CN109414204A (en) | Method and apparatus for determining the respiration information for object | |
| JP6310401B2 (en) | Method, system and computer program for processing a signal representing a physiological rhythm | |
| JP5929020B2 (en) | Consciousness state estimation device and program | |
| JP2018161432A (en) | Evaluation of Sleep State | |
| WO2017220526A1 (en) | A method and apparatus for determining respiratory information for a subject | |
| US20200359909A1 (en) | Monitoring device including vital signals to identify an infection and/or candidates for autonomic neuromodulation therapy | |
| Papini et al. | Respiratory activity extracted from wrist-worn reflective photoplethysmography in a sleep-disordered population | |
| JP6372824B2 (en) | CVHR shape measuring device | |
| WO2016057806A1 (en) | Weaning readiness indicator, sleeping status recording device, and air providing system applying nonlinear time-frequency analysis | |
| JP2006271474A (en) | Apparatus for estimating sleeping state | |
| Reddy et al. | Automated hilbert envelope based respiration rate measurement from PPG signal for wearable vital signs monitoring devices | |
| JP6212943B2 (en) | Physiological adaptive system with multiple sensors | |
| JP2016047305A (en) | Consciousness state estimation device and program | |
| WO2017180617A1 (en) | Psychological acute stress measurement using a wireless sensor | |
| JP2015109888A (en) | Tiredness evaluation method | |
| Tork et al. | How health related to quality of sleep and breathing: how to associate sleep disorder breathing and extracted respiratory signal |
Legal Events
| Date | Code | Title | Description |
|---|---|---|---|
| 121 | Ep: the epo has been informed by wipo that ep was designated in this application |
Ref document number: 16761337 Country of ref document: EP Kind code of ref document: A1 |
|
| DPE2 | Request for preliminary examination filed before expiration of 19th month from priority date (pct application filed from 20040101) | ||
| WWE | Wipo information: entry into national phase |
Ref document number: 112016001171 Country of ref document: DE Ref document number: 15557778 Country of ref document: US |
|
| 122 | Ep: pct application non-entry in european phase |
Ref document number: 16761337 Country of ref document: EP Kind code of ref document: A1 |