WO2016139871A1 - 脈拍計測装置及びその制御方法 - Google Patents
脈拍計測装置及びその制御方法 Download PDFInfo
- Publication number
- WO2016139871A1 WO2016139871A1 PCT/JP2015/086390 JP2015086390W WO2016139871A1 WO 2016139871 A1 WO2016139871 A1 WO 2016139871A1 JP 2015086390 W JP2015086390 W JP 2015086390W WO 2016139871 A1 WO2016139871 A1 WO 2016139871A1
- Authority
- WO
- WIPO (PCT)
- Prior art keywords
- image data
- pulse
- pulse measuring
- measuring device
- feature amount
- Prior art date
- Legal status (The legal status is an assumption and is not a legal conclusion. Google has not performed a legal analysis and makes no representation as to the accuracy of the status listed.)
- Ceased
Links
Images


Classifications
-
- A—HUMAN NECESSITIES
- A61—MEDICAL OR VETERINARY SCIENCE; HYGIENE
- A61B—DIAGNOSIS; SURGERY; IDENTIFICATION
- A61B5/00—Measuring for diagnostic purposes; Identification of persons
- A61B5/02—Detecting, measuring or recording for evaluating the cardiovascular system, e.g. pulse, heart rate, blood pressure or blood flow
- A61B5/024—Measuring pulse rate or heart rate
- A61B5/0245—Measuring pulse rate or heart rate by using sensing means generating electric signals, i.e. ECG signals
-
- A—HUMAN NECESSITIES
- A61—MEDICAL OR VETERINARY SCIENCE; HYGIENE
- A61B—DIAGNOSIS; SURGERY; IDENTIFICATION
- A61B5/00—Measuring for diagnostic purposes; Identification of persons
- A61B5/72—Signal processing specially adapted for physiological signals or for diagnostic purposes
- A61B5/7235—Details of waveform analysis
- A61B5/7253—Details of waveform analysis characterised by using transforms
- A61B5/726—Details of waveform analysis characterised by using transforms using Wavelet transforms
-
- A—HUMAN NECESSITIES
- A61—MEDICAL OR VETERINARY SCIENCE; HYGIENE
- A61B—DIAGNOSIS; SURGERY; IDENTIFICATION
- A61B5/00—Measuring for diagnostic purposes; Identification of persons
- A61B5/0059—Measuring for diagnostic purposes; Identification of persons using light, e.g. diagnosis by transillumination, diascopy, fluorescence
- A61B5/0077—Devices for viewing the surface of the body, e.g. camera, magnifying lens
-
- A—HUMAN NECESSITIES
- A61—MEDICAL OR VETERINARY SCIENCE; HYGIENE
- A61B—DIAGNOSIS; SURGERY; IDENTIFICATION
- A61B5/00—Measuring for diagnostic purposes; Identification of persons
- A61B5/02—Detecting, measuring or recording for evaluating the cardiovascular system, e.g. pulse, heart rate, blood pressure or blood flow
- A61B5/024—Measuring pulse rate or heart rate
- A61B5/02416—Measuring pulse rate or heart rate using photoplethysmograph signals, e.g. generated by infrared radiation
-
- A—HUMAN NECESSITIES
- A61—MEDICAL OR VETERINARY SCIENCE; HYGIENE
- A61B—DIAGNOSIS; SURGERY; IDENTIFICATION
- A61B5/00—Measuring for diagnostic purposes; Identification of persons
- A61B5/68—Arrangements of detecting, measuring or recording means, e.g. sensors, in relation to patient
- A61B5/6887—Arrangements of detecting, measuring or recording means, e.g. sensors, in relation to patient mounted on external non-worn devices, e.g. non-medical devices
- A61B5/6898—Portable consumer electronic devices, e.g. music players, telephones, tablet computers
-
- A—HUMAN NECESSITIES
- A61—MEDICAL OR VETERINARY SCIENCE; HYGIENE
- A61B—DIAGNOSIS; SURGERY; IDENTIFICATION
- A61B5/00—Measuring for diagnostic purposes; Identification of persons
- A61B5/72—Signal processing specially adapted for physiological signals or for diagnostic purposes
- A61B5/7235—Details of waveform analysis
- A61B5/7253—Details of waveform analysis characterised by using transforms
- A61B5/7257—Details of waveform analysis characterised by using transforms using Fourier transforms
Definitions
- the present invention relates to a pulse measuring device and a control method thereof.
- a method of measuring a pulse without a measuring instrument coming into contact with a living body there is a method of acquiring a pulse by image processing using an image obtained by photographing the living body. For example, there is a method of extracting a living body region in an image and detecting a pulse from a time-series change of pixel values of the living body region.
- Patent Document 1 an image of a living body region is divided into a plurality of blocks, a representative value of pixel values of pixels included in the block is calculated for each block, and a difference between representative values of corresponding blocks between frames is calculated.
- Non-Patent Document 1 each frame of a moving image is subjected to wavelet transform to obtain a high-frequency image, a spatial phase component is extracted by Fourier-transforming the high-frequency image in units of pixels, and time-series data of spatial phase is obtained.
- a method for generating an image in which a fine movement amount between frames is emphasized by generating the frame is disclosed.
- Patent Document 1 for example, a block having a small spatial change in pixel value such as a cheek or forehead is extracted, and a signal of time-series data of pixel values for a certain period, for example, 30 seconds or 1 minute, is converted into a frequency component.
- Fourier transform or the like is used for the conversion to the frequency component.
- a pulse can be detected by detecting a peak in the pulse frequency band based on the conversion result.
- the Fourier transform has a large amount of calculation, and in particular, the Fourier transform for a signal of two-dimensional data as in image analysis has a problem that it takes time to calculate.
- the technique disclosed in Non-Patent Document 1 requires a two-dimensional Fourier transform for each frame, and has a problem that the calculation amount is large and the processing time is long.
- an object of the present invention is to improve the processing speed in a pulse measuring device that measures a pulse based on image analysis.
- an image acquisition unit that acquires a plurality of time-series captured image data obtained by imaging a living body
- An image processing unit that generates a plurality of converted image data corresponding to the plurality of photographed image data by performing multiple resolution analysis for decomposing the plurality of photographed image data into a high resolution component and a low resolution component a plurality of times.
- a feature amount indicating luminance of a predetermined region in each of the plurality of converted image data is calculated, a time series data of the feature amount is analyzed to calculate a variation period of the feature amount, and based on the variation period of the feature amount
- a pulse measuring unit for calculating the pulse of the living body It is the pulse measuring device which has.
- an acquisition step of acquiring a plurality of time-series captured image data obtained by imaging a living body A conversion step for performing a plurality of times of multi-resolution analysis to decompose each of the plurality of photographed image data into a high resolution component and a low resolution component to generate a plurality of converted image data corresponding to the plurality of photographed image data; , A feature amount indicating luminance of a predetermined region in each of the plurality of converted image data is calculated, a time series data of the feature amount is analyzed to calculate a variation period of the feature amount, and based on the variation period of the feature amount Calculating the pulse of the living body; It is the control method of the pulse measuring device having.
- FIG. 1 is a conceptual diagram showing a schematic configuration of a pulse measuring device 6 according to Embodiment 1 of the present invention.
- the pulse measuring device 6 according to the first embodiment uses the image of the subject's living body photographed without bringing the measuring instrument into contact with the subject under ordinary environmental light such as sunlight or room light. That is, a pulse measurement process is performed to measure the change in blood volume accompanying the heartbeat.
- the pulse measuring device 6 includes an imaging unit 1, an image storage unit 2, an image processing unit 3, a pulse measuring unit 4, and a signal output unit 5, as shown in FIG.
- the pulse measuring device 6 can be implemented by installing in the computer a program or software that causes the computer to execute the functions or processes of these blocks. Such a program, a recording medium on which the program is recorded, and a computer on which the program is installed are included in the present invention.
- the pulse measuring device 6 can also implement the function of each block shown in FIG. 1 as dedicated hardware. Alternatively, it can be implemented as a function expansion board that adds the function of each block to the computer.
- the above program can be provided as package software or online software.
- the above program is applied to a mobile communication terminal such as a smartphone, a mobile phone, and a PHS (Personal Handyphone System) or a mobile terminal device including a computer, a digital camera, a tablet terminal, and a slate terminal that are not capable of connecting to a mobile communication network.
- a mobile communication terminal such as a smartphone, a mobile phone, and a PHS (Personal Handyphone System) or a mobile terminal device including a computer, a digital camera, a tablet terminal, and a slate terminal that are not capable of connecting to a mobile communication network.
- These terminals can be made to function as the pulse measuring device 6 by installing.
- the pulse measuring device 6 can have various functional units that are generally included in a computer in addition to the functional units shown in FIG. For example, input / output devices such as keyboards, mice, and displays, attitude detection devices such as acceleration sensors and angular velocity sensors, antennas, wireless communication units connected to mobile communication networks, and communication devices such as GPS (Global Positioning System) receivers May further be
- the imaging unit 1 is a general camera equipped with an imaging element such as a CCD (Charge Coupled Device) or a CMOS (Complementary Metal Oxide Semiconductor).
- the imaging unit 1 can be equipped with three or more types of light receiving elements such as R (red), G (green), and B (blue).
- the imaging unit 1 outputs image data (captured image data) obtained by imaging to the image storage unit 2.
- the configuration in which the imaging unit 1 is provided in the pulse measuring device 6 is illustrated here, but a configuration in which an external imaging device is connected via a wired or wireless communication line may be used.
- the pulse measurement device 6 includes a storage device that stores captured image data and can acquire the captured image data from the storage device, or when the captured image data can be acquired from a network or a portable storage medium, the pulse measurement is performed.
- the apparatus 6 may be configured without the imaging unit 1.
- the imaging unit 1 may be an infrared camera. In this case, blood flow in the living body can be photographed, and photographing that is less susceptible to ambient light disturbance is possible.
- the image storage unit (image acquisition unit) 2 is a frame memory that acquires and holds captured image data from the imaging unit 1.
- the image storage unit 2 is a random access memory (RAM) or a hard disk drive (HDD).
- RAM random access memory
- HDD hard disk drive
- the image storage unit 2 is configured to hold a maximum of 1800 frames of captured image data having a frame size of 512 pixels horizontally ⁇ 512 pixels vertically.
- the image processing unit 3 acquires captured image data from the image storage unit 2, performs multi-resolution analysis on the captured image data, generates a high-resolution component image and a low-resolution component image, and outputs them to the pulse measurement unit 4. To do.
- the image processing unit 3 repeatedly executes multiple resolution analysis multiple times.
- the image processing unit 3 performs the wavelet transform using the Haar basis twice on the captured image data acquired from the image storage unit 2.
- the method of selecting a base and the number of wavelet transforms are examples. The number of repetitions of the wavelet transform is not limited to two as long as it is a plurality of times.
- FIG. 3B is image data (first converted image data) generated by the image processing unit 3 performing the first wavelet transform on the captured image data of FIG. 3A.
- the image processing unit 3 decomposes the captured image data into LL, HL, LH, and HH components by the first wavelet transform.
- the region (X1, Y1) represents the LL component
- the region (X2, Y1) represents the HL component
- the region (X1, Y2) represents the LH component
- the region (X2, Y2) represents the HH component.
- the first converted image data is composed of four regions of 256 pixels wide ⁇ 256 pixels high.
- FIG. 3C shows image data (second converted image data) generated by the image processing unit 3 performing the second wavelet transform on the first converted image data in FIG. 3B.
- the image processing unit 3 further decomposes each component of the first transformed image data in FIG. 3B into LL, HL, LH, and HH components.
- second converted image data including 16 regions in total from the region (X11, Y11) to the region (X14, Y14) is calculated.
- the second converted image data is composed of 16 regions each having 128 horizontal pixels ⁇ 128 vertical pixels.
- the image processing unit 3 performs the above multi-resolution analysis on each of the plurality of time-series captured image data acquired from the image storage unit 2 to generate a plurality of time-series converted image data, and the pulse measurement unit Output to 4.
- the image processing unit 3 performs two wavelet transforms on each of the 64 time-series photographed image data to generate 64 time-series second converted image data, and sends it to the pulse measuring unit 4. Output.
- wavelet transform is further performed on each of the four regions of the first transformed image data to generate data of 16 regions of the second transformed image data.
- the pulse is calculated using the pixel value of the region (X14, Y12) in the second converted image data. Therefore, the second wavelet transform may be performed only for the region (X2, Y1) in the first converted image data.
- the pulse measuring unit 4 acquires a plurality of time-series converted image data from the image processing unit 3, calculates a feature amount indicating the luminance of a specific region in each of the plurality of converted image data, and time-series data of the feature amount To generate information on the pulse of the subject. Specifically, the pulse measurement unit 4 analyzes time-series data of feature amounts and generates information on the pulse of the subject based on the periodicity in the luminance change.
- the specific area is an area of horizontal 20 pixels ⁇ vertical 20 pixels (in the middle part of the area (X14, Y12) in the second converted image data) as indicated by the hatched portion in FIG. Luminance detection area).
- the pulse measuring unit 4 calculates the average value of the luminance of the pixels in the luminance detection region for each of the 64 time-series second converted image data, and analyzes the change over time.
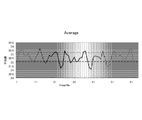
- FIG. 4 is a graph in which the average value of the luminance of the pixels in the luminance detection area of each of the 64 pieces of second converted image data is plotted along the time series. As shown in the drawing, the average value of luminance changes periodically, and this represents the cycle of the pulse.
- the pulse measuring unit 4 obtains the fluctuation cycle of the average value of the luminance. For example, in the example of FIG. 4, the pulse measurement unit 4 detects a peak when the average luminance value is 33.2 or more and an under peak when the average luminance value is 32.1 or less. A fluctuation period is calculated based on the combination.
- the pulse measuring unit 4 calculates the pulse rate from the fluctuation cycle of the average luminance value.
- the pulse rate is the number of pulsations per unit time. In the example of FIG.
- the pulse measuring unit 4 calculates the pulse rate of the subject as 45 times / minute.
- the pulse measuring unit 4 may generate not only the pulse rate but also the amplitude (intensity of pulsation), the pulse graph (graph as shown in FIG. 4), the presence or absence of arrhythmia, and the like as pulse information.
- the threshold value of the luminance average value for obtaining the peak and the under peak may be a fixed value determined in advance, or may be set adaptively for time-series luminance data.
- the median value ⁇ ⁇ of time-series luminance data may be used as the threshold value.
- the fluctuation period may be obtained using Fourier analysis. In this case, since the Fourier analysis is performed on the one-dimensional data, the influence of the increase in the calculation amount is small, and the fluctuation cycle can be obtained with higher accuracy.
- the luminance detection area is set in the area (X14, Y12) in the second converted image data. However, it may be set in the area (X14, Y14) in the second converted image data. , May be set in the region (X12, Y14). Of these regions, the luminance detection region may be set in a region where the change in luminance appears more clearly.
- the data in these areas is data that emphasizes the luminance change in the original photographed image data, and is data that emphasizes the change in the reflected light of the subject's body surface due to pulsation, that is, the change in the spatial distribution of the luminance gradient. .
- the image of each region obtained by the two wavelet transforms shows a feature corresponding to the change rate (second derivative) of the luminance spatial distribution. Therefore, a feature corresponding to the subject's pulsation appears in the time-series fluctuation of the luminance average value of the luminance detection region in the second converted image data. By analyzing this time variation, the pulse of the subject can be calculated.
- the pulse measuring device 6 can measure the pulse using general image data obtained by capturing with a general camera, and therefore does not require a special camera.
- a pulse measurement based on an image can be performed only by installing a program for performing the processing of the first embodiment on a device having a general imaging device such as a smartphone or a digital camera, without using a dedicated device for pulse measurement. It becomes possible.
- a device having a general imaging device such as a smartphone or a digital camera
- the calculation cost is low and the processing speed is high, it is possible to operate the apparatus practically even with a device having few calculation resources. Further, it can be mounted at a low cost and in a small size.
- the average value of the luminance of the luminance detection area is plotted in time series.
- the luminance detection area is binarized into black pixels and white pixels using a certain threshold, and the number of white pixels is counted in time series.
- a method of plotting can also be used.
- the number of wavelet transforms may be three or more as described above.
- the number of wavelet transforms is considered to vary depending on, for example, the number of pixels of the photographed image data and the scale of the space photographed by the photographed image data. The optimum number of times may be obtained by experiment or the like and stored in the pulse measuring device, or may be arbitrarily set by the user. Further, depending on the number of wavelet transforms, which component image data is used for the subsequent wavelet transform may be changed. For example, in the case of the above two times, the second wavelet transform is performed on the HL / LH / HH component of the first converted image data, and the HL / LH / HH component of the obtained second converted image data is used for pulse calculation. Using.
- the signal output unit 5 outputs the pulse information calculated by the pulse measurement unit 4 to the outside.
- the pulse information may be output as text data, for example, or may be output as numerical data or image data for displaying numerical values on a display device (not shown) such as an LCD (Liquid Crystal Display). Further, the signal output unit 5 may acquire time-series image data from the image storage unit 2, reconstruct it into moving image data, and output it.
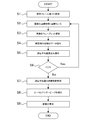
- FIG. 2 is a flowchart showing the flow of processing by the pulse measuring device according to the first embodiment described above.
- the number of analysis frames (N) is set in step S1.
- the number of analysis frames is the number of frames acquired from the imaging unit 1 as time-series image data, and is 64 in the above example.
- the number of analysis frames may be a predetermined fixed value, or may be set by causing a user to input a setting value using an input device (keyboard, touch panel, etc.) not shown.
- step S2 the imaging unit 1 performs imaging, and the image storage unit 2 acquires captured image data.
- the captured image data is managed by being assigned a captured image number X.
- the captured image number X is incremented by 1 every time imaging is performed.
- the image storage unit 2 outputs the captured image data to the image processing unit 3.
- step S3 the image processing unit 3 performs wavelet transform twice on the captured image data, and outputs the second converted image data to the pulse measuring unit 4.
- step S4 the pulse measuring unit 4 extracts the luminance detection area data in the specific area (X14, Y12) of the second converted image data, and calculates the average value of the luminance in the luminance detection area in step S5. save.
- step S6 it is determined whether or not the captured image number X is equal to or less than the number N of analysis frames, and the processes in steps S2 to S5 are repeated until X> N. If X> N, the process proceeds to step S7.
- step S7 the pulse measuring unit 4 analyzes temporal variation of the average value of luminance based on the average value of a plurality of time-series luminances of N analysis frames. Specifically, the pulse measuring unit 4 detects the peak and under peak of the average brightness value in step S8, calculates the fluctuation cycle, and calculates the pulse rate in step S9 based on the fluctuation cycle.
- the process is performed until the calculation of the average value of the luminance.
- Data may be stored in the image storage unit 2.
- the image processing unit 3 and the pulse measurement unit 4 acquire the captured image data to be processed frame by frame from the image storage unit 2 in a state where the imaging itself has been completed, and calculate the average value of the wavelet transform and the luminance.
- the flow is to perform the calculation.
- the imaging unit 1 is not provided, for example, when imaging data obtained by imaging in advance externally is acquired from a network or a portable recording medium and the pulse is measured based on the image, the imaging in step S2 is performed.
- the flow is the same as when the wavelet transform and the average value of luminance are calculated.
- the captured image data output from the imaging unit 1 is used as it is for pulse measurement.
- the captured image data is used. May be cut out and a process after step S3 may be performed.
- pre-processing such as resolution conversion, brightness adjustment, and noise removal may be performed on the captured image data.
- Example 1 the method of measuring a pulse by image processing with a light processing load using photographed image data obtained by photographing a subject's skin has been described. This is to detect the time variation of the light reflection mode of the skin accompanying the change in blood flow by emphasizing the wavelet transform.
- the present invention is a technology that emphasizes minute time fluctuations by wavelet transform and detects the time fluctuations by image processing, it is also possible to detect a swing of a part of the body due to pulsation from an image. It is.
- the pulse can be calculated by emphasizing minute shaking of the head and detecting the temporal variation.
- the wavelet transform is performed a plurality of times on the captured image data obtained by imaging the part other than the skin such as the hair and the arm. It is also possible to calculate a pulse by detecting a minute time variation of a part. Note that the optimal number of wavelet transforms may vary depending on which part of the body is imaged and the pulse is measured using the captured image data.
- Imaging unit 2 Image storage unit (image acquisition unit) 3: Image processing unit 4: Pulse measurement unit 5: Signal output unit 6: Pulse measurement device
Landscapes
- Health & Medical Sciences (AREA)
- Life Sciences & Earth Sciences (AREA)
- Engineering & Computer Science (AREA)
- Surgery (AREA)
- Animal Behavior & Ethology (AREA)
- Cardiology (AREA)
- Signal Processing (AREA)
- Physics & Mathematics (AREA)
- Veterinary Medicine (AREA)
- Biophysics (AREA)
- Pathology (AREA)
- Biomedical Technology (AREA)
- Heart & Thoracic Surgery (AREA)
- Medical Informatics (AREA)
- Molecular Biology (AREA)
- Public Health (AREA)
- Physiology (AREA)
- General Health & Medical Sciences (AREA)
- Artificial Intelligence (AREA)
- Computer Vision & Pattern Recognition (AREA)
- Psychiatry (AREA)
- Measuring Pulse, Heart Rate, Blood Pressure Or Blood Flow (AREA)
Abstract
生体を撮影して得られた時系列の複数の撮影画像データを取得する画像取得部と、前記複数の撮影画像データの各々に対し、高解像度成分と低解像度成分に分解する多重解像度解析を複数回行って、前記複数の撮影画像データに対応する複数の変換画像データを生成する画像処理部と、前記複数の変換画像データの各々における所定の領域の輝度を示す特徴量を算出し、前記特徴量の時系列データを解析して特徴量の変動周期を算出し、前記特徴量の変動周期に基づき前記生体の脈拍を算出する脈拍計測部と、を有する脈拍計測装置。
Description
本発明は、脈拍計測装置及びその制御方法に関する。
生体の脈拍を計測する方法として、生体に計測器具を接触させて計測する方法がある。例えば心電図を用いて計測する方法(心電図法)や、指や耳たぶなどの末梢血管に赤外線を照射し、その反射光が血流及び吸光特性によって周期的に変動する光学的な変化から心拍とほぼ等価な脈拍を計測する方法(光電脈波法)がある。
生体に計測器具が接触しない状態で脈拍を計測する方法として、生体を撮影して得られた画像を用いて画像処理により脈拍を取得する方法がある。例えば、画像中の生体領域を抽出して、生体領域の画素値の時系列変化から脈拍を検出する方法がある。特許文献1には、生体領域の画像を複数のブロックに分割し、ブロック毎に当該ブロックに含まれる画素が持つ画素値の代表値を算出し、フレーム間で互いに対応するブロックの代表値の差が閾値以下であるブロックを抽出し、抽出されたブロックに含まれる画素の画素値から生体の脈拍を検出する方法が開示されている。また非特許文献1には、動画像の各フレームをウェーブレット変換して高域画像を取得し、高域画像を画素単位にフーリエ変換することによって空間位相成分を取り出し、空間位相の時系列データを生成することでフレーム間の微動量を強調した画像を生成する方法が開示されている。
N.Wadhwa, M.Rubinstein, F.Durand, and W.T.Freeman. Phase-based video motion processing. ACM Trans. Graph., 32(4):80:1-80:10, 2013.
特許文献1の技術では、例えば頬や額など画素値の空間的変化が小さなブロックを抽出し、一定期間、例えば30秒間や1分間の画素値の時系列データの信号を周波数成分へ変換する。周波数成分への変換にはフーリエ変換等が用いられる。変換結果に基づき脈拍の周波数帯におけるピークを検出することにより、脈拍を検出することができる。しかしながら、フーリエ変換は計算量が多く、特に画像解析のように2次元データの信号に対するフーリエ変換は計算に時間がかかるという課題があった。また、非特許文献1の技術についても同様、フレーム毎に2次元のフーリエ変換が必要であり、計算量が多く処理時間がかかるという課題がある。
そこで本発明は、画像解析に基づき脈拍を計測する脈拍計測装置において、処理速度を向上させることを目的とする。
本発明の第1の態様は、生体を撮影して得られた時系列の複数の撮影画像データを取得する画像取得部と、
前記複数の撮影画像データの各々に対し、高解像度成分と低解像度成分に分解する多重解像度解析を複数回行って、前記複数の撮影画像データに対応する複数の変換画像データを生成する画像処理部と、
前記複数の変換画像データの各々における所定の領域の輝度を示す特徴量を算出し、前記特徴量の時系列データを解析して特徴量の変動周期を算出し、前記特徴量の変動周期に基づき前記生体の脈拍を算出する脈拍計測部と、
を有する脈拍計測装置である。
前記複数の撮影画像データの各々に対し、高解像度成分と低解像度成分に分解する多重解像度解析を複数回行って、前記複数の撮影画像データに対応する複数の変換画像データを生成する画像処理部と、
前記複数の変換画像データの各々における所定の領域の輝度を示す特徴量を算出し、前記特徴量の時系列データを解析して特徴量の変動周期を算出し、前記特徴量の変動周期に基づき前記生体の脈拍を算出する脈拍計測部と、
を有する脈拍計測装置である。
本発明の第2の態様は、生体を撮影して得られた時系列の複数の撮影画像データを取得する取得工程と、
前記複数の撮影画像データの各々に対し、高解像度成分と低解像度成分に分解する多重解像度解析を複数回行って、前記複数の撮影画像データに対応する複数の変換画像データを生成する変換工程と、
前記複数の変換画像データの各々における所定の領域の輝度を示す特徴量を算出し、前記特徴量の時系列データを解析して特徴量の変動周期を算出し、前記特徴量の変動周期に基づき前記生体の脈拍を算出する工程と、
を有する脈拍計測装置の制御方法である。
前記複数の撮影画像データの各々に対し、高解像度成分と低解像度成分に分解する多重解像度解析を複数回行って、前記複数の撮影画像データに対応する複数の変換画像データを生成する変換工程と、
前記複数の変換画像データの各々における所定の領域の輝度を示す特徴量を算出し、前記特徴量の時系列データを解析して特徴量の変動周期を算出し、前記特徴量の変動周期に基づき前記生体の脈拍を算出する工程と、
を有する脈拍計測装置の制御方法である。
本発明によれば、画像解析に基づき脈拍を計測する脈拍計測装置において、処理速度を向上させることが可能になる。
図面を参照して本発明に係る脈拍計測装置及びその制御方法について説明する。なお、この実施例は開示の技術を限定するものではない。そして、実施例は、処理内容を矛盾させない範囲で適宜組み合わせることが可能である。
(実施例1)
図1は、本発明の実施例1に係る脈拍計測装置6の概略構成を示す概念図である。実施例1に係る脈拍計測装置6は、太陽光や室内光などの一般の環境光の下で被験者に計測器具を接触させずに、被験者の生体が撮影された画像を用いて被験者の脈拍、すなわち心臓の拍動に伴う血液の体積の変動を測定する脈拍計測処理を行う。
図1は、本発明の実施例1に係る脈拍計測装置6の概略構成を示す概念図である。実施例1に係る脈拍計測装置6は、太陽光や室内光などの一般の環境光の下で被験者に計測器具を接触させずに、被験者の生体が撮影された画像を用いて被験者の脈拍、すなわち心臓の拍動に伴う血液の体積の変動を測定する脈拍計測処理を行う。
実施例1では、脈拍計測装置6は、図1に示すように、撮像部1、画像蓄積部2、画像処理部3、脈拍計測部4、信号出力部5を有する。
脈拍計測装置6は、これら各ブロックの機能又は処理をコンピュータに実行させるプログラム又はソフトウェアをコンピュータにインストールさせることによって実装できる。そのようなプログラム、当該プログラムが記録された記録媒体、当該プログラムがインストールされたコンピュータは本発明に含まれる。脈拍計測装置6は、図1に示す各ブロックの機能を専用のハードウェアとして実装することもできる。或いは、コンピュータに各ブロックの機能を追加する機能拡張ボードとして実装することもできる。上記のプログラムはパッケージソフトウェアやオンラインソフトウェアとして提供されることができる。スマートフォン、携帯電話機、PHS(Personal Handyphone System)などの移動体通信端末や、移動体通信網に接続する能力を持たないコンピュータ、デジタルカメラ、タブレット端末、スレート端末を含む携帯端末装置に、上記のプログラムをインストールさせることにより、これらの端末を脈拍計測装置6として機能させることができる。脈拍計測装置6は、図1に示した機能部以外にも一般にコンピュータが有する各種の機能部を有することができる。例えば、キーボード、マウス、ディスプレイなどの入出力デバイス、加速度センサや角速度センサなどの姿勢検出デバイス、アンテナ、移動体通信網に接続する無線通信部、GPS(Global Positioning System)受信機などの通信用デバイスをさらに有していてもよい。
撮像部1は、CCD(Charge Coupled Device)やCMOS(Complementary Metal Oxide Semiconductor)などの撮像素子を搭載する一般的なカメラである。例えば、撮像部1には、R(red)、G(green)、B(blue)など3種以上の受光素子を搭載することができる。撮像部1は、撮像により得られた画像データ(撮影画像データ)を画像蓄積部2へ出力する。なお、ここでは撮像部1が脈拍計測装置6に備わる構成を例示したが、有線又は無線の通信線を介して外部の撮像装置が接続される構成でも良い。また、脈拍計測装置6が、撮影画像データを記憶する記憶装置を備え、記憶装置から撮影画像データを取得できる場合や、ネットワークや可搬記憶媒体から撮影画像データを取得できる場合には、脈拍計測装置6が撮像部1を有しない構成でも良い。また、撮像部1は赤外線カメラであっても良い。この場合、生体内の血流を撮影することができ、また環境光の外乱を受けにくい撮影が可能である。
実施例1では、撮像部1は、横512ピクセル×縦512ピクセルの矩形の画像を撮像するモノクロCCDカメラであるとする。撮像部1は、8ビット(画素値0~255)の撮影画像データをフレームレート6枚/秒で出力できるものとする。1回の撮像で出力する撮影画像データのフレーム数は64枚とする。すなわち、撮像部1は、約10.7秒間、被写体を撮像して得られた撮影画像データを画像蓄積部2へ出力する。なお、画像サイズ、ビット数、フレームレート等の仕様は一例である。実施例1では、人の脈拍を計測する場合を例に説明するので、人の脈拍(60~80回/分)を十分に捉えられる程度のフレームレートを設定した。
画像蓄積部(画像取得部)2は、撮像部1から撮影画像データを取得し、保持するフレームメモリである。画像蓄積部2はRAM(random access memory)やHDD(hard disk drive)などである。
実施例1では、画像蓄積部2は、フレームサイズ横512ピクセル×縦512ピクセルの撮影画像データを最大1800フレーム保持できるよう構成されているものとする。
実施例1では、画像蓄積部2は、フレームサイズ横512ピクセル×縦512ピクセルの撮影画像データを最大1800フレーム保持できるよう構成されているものとする。
画像処理部3は、画像蓄積部2から撮影画像データを取得し、撮影画像データに対し多重解像度解析を行って高解像度成分の画像と低解像度成分の画像を生成し、脈拍計測部4へ出力する。画像処理部3は複数回の多重解像度解析を繰り返し実行する。
実施例1では、画像処理部3は、画像蓄積部2から取得した撮影画像データに対しHaar基底によるウェーブレット変換を2回行うものとする。基底の選び方やウェーブレット変換の回数は一例である。ウェーブレット変換の繰り返しの回数は複数回であれば2回に限られない。
実施例1では、画像処理部3は、画像蓄積部2から取得した撮影画像データに対しHaar基底によるウェーブレット変換を2回行うものとする。基底の選び方やウェーブレット変換の回数は一例である。ウェーブレット変換の繰り返しの回数は複数回であれば2回に限られない。
画像処理部3による撮影画像データに対するウェーブレット変換について図3を用いて説明する。
図3(A)は画像蓄積部2から入力される撮影画像データの一例である。この撮影画像データは、撮像部1のモノクロCCDカメラにより被験者の皮膚を撮像して得られた64枚の撮影画像データのうちの1枚であり、上述したように横512ピクセル×縦512ピクセルの画像データである。
図3(A)は画像蓄積部2から入力される撮影画像データの一例である。この撮影画像データは、撮像部1のモノクロCCDカメラにより被験者の皮膚を撮像して得られた64枚の撮影画像データのうちの1枚であり、上述したように横512ピクセル×縦512ピクセルの画像データである。
図3(B)は、図3(A)の撮影画像データに対し画像処理部3が1回目のウェーブレット変換を行って生成した画像データ(第1変換画像データ)である。画像処理部3は、1回目のウェーブレット変換で撮影画像データをLL,HL,LH,HH成分に分解する。図3(B)において、領域(X1,Y1)がLL成分、領域(X2,Y1)がHL成分、領域(X1,Y2)がLH成分、領域(X2,Y2)がHH成分を表す。第1変換画像データは、横256ピクセル×縦256ピクセルの領域4個からなる。
図3(C)は、図3(B)の第1変換画像データに対し画像処理部3が2回目のウェーブレット変換を行って生成した画像データ(第2変換画像データ)である。2回目のウェーブレット変換では、画像処理部3は、図3(B)の第1変換画像データの各成分をさらにLL,HL,LH,HH成分に分解する。その結果、図3(C)に示すように、領域(X11,Y11)~領域(X14,Y14)の全部で16個の領域からなる第2変換画像データが算出される。第2変換画像データは、横128ピクセル×縦128ピクセルの領域16個からなる。画像処理部3は、画像蓄積部2から取得した時系列の複数の撮影画像データの各々に対し以上のような多重解像度解析を行って時系列の複数の変換画像データを生成し、脈拍計測部4へ出力する。ここでは、画像処理部3は、64枚の時系列の撮影画像データの各々に対し2回のウェーブレット変換を行って64枚の時系列の第2変換画像データを生成し、脈拍計測部4へ出力する。
なお、ここでは、第1変換画像データの4個の領域の各々についてさらにウェーブレット変換を行って第2変換画像データの16個の領域のデータを生成する例を説明したが、後述するように、実施例1では、第2変換画像データのうち領域(X14,Y12)の画素値を用いて脈拍を算出する。そのため、第1変換画像データのうち領域(X2,Y1)のみ2回目のウェーブレット変換を行うようにしても良い。
脈拍計測部4は、画像処理部3から時系列の複数の変換画像データを取得し、複数の変換画像データの各々における特定領域の輝度を示す特徴量を算出し、この特徴量の時系列データに基づいて被験者の脈拍の情報を生成する。具体的には、脈拍計測部4は、特徴量の時系列データを解析し、輝度変化における周期性に基づき被験者の脈拍の情報を生成する。
実施例1では、特定領域は、図3(D)の斜線部に示すように、第2変換画像データにおける領域(X14,Y12)内の中央部にある横20ピクセル×縦20ピクセルの領域(輝度検出領域)とする。脈拍計測部4は、時系列の64枚の第2変換画像データの各々について、輝度検出領域の画素の輝度の平均値を算出し、その時間変化を解析する。
実施例1では、特定領域は、図3(D)の斜線部に示すように、第2変換画像データにおける領域(X14,Y12)内の中央部にある横20ピクセル×縦20ピクセルの領域(輝度検出領域)とする。脈拍計測部4は、時系列の64枚の第2変換画像データの各々について、輝度検出領域の画素の輝度の平均値を算出し、その時間変化を解析する。
図4は、64枚の第2変換画像データの各々の輝度検出領域の画素の輝度の平均値を時系列に沿ってプロットしたグラフである。図示するように、輝度の平均値は周期的に変化しており、これが脈拍の周期を表している。脈拍計測部4は、この輝度の平均値の変動周期を求める。例えば、図4の例では、脈拍計測部4は、輝度の平均値が33.2以上におけるピークと、輝度の平均値が32.1以下におけるアンダーピークと、を検出し、ピークとアンダーピークの組み合わせに基づき変動周期を算出する。そして、脈拍計測部4は、輝度の平均値の変動周期から脈拍数を算出する。脈拍数とは単位時間当たりの脈動の回数である。図4の例では、ピークが8個、アンダーピークが8個あるので、画像取得期間の10.7秒間に8回脈拍があったことになる。従って、脈拍計測部4は、被験者の脈拍数は45回/分と算出する。脈拍計測部4は、脈拍の情報として、脈拍数以外にも、振幅(脈動の強さ)、脈拍のグラフ(図4に示すようなグラフ)、不整脈の有無などを生成してもよい。
なお、ピークとアンダーピークを求めるための輝度平均値の閾値は、予め定められた固定値でも良いし、時系列の輝度のデータに対し適応的に設定しても良い。例えば、時系列の輝度のデータの中央値±Δνを閾値としても良い。また、例えばフーリエ解析を用いて変動周期を求めても良い。この場合、1次元データに対するフーリエ解析であるため、計算量の増大の影響は少なく、より精度良く変動周期を求めることができる。
また、上記の説明では、輝度検出領域は第2変換画像データにおける領域(X14,Y12)内に設定するとしたが、第2変換画像データにおける領域(X14,Y14)内に設定しても良いし、領域(X12,Y14)内に設定しても良い。これらの領域のうち、より輝度の変化が明瞭に現れている領域に輝度検出領域を設定するようにしても良い。これらの領域のデータは、元の撮影画像データにおける輝度変化を強調したデータであり、脈動に伴う被験者の体表の反射光の変化、すなわち輝度勾配の空間分布の変化が強調されたデータである。2回のウェーブレット変換により得られた各領域の画像は、輝度の空間分布の変化率(2階微分)に相当する特徴を示す。よって、第2変換画像データにおける輝度検出領域の輝度平均値の時系列変動には、被験者の脈動に対応する特徴が現れる。この時間変動を解析することにより、被験者の脈拍を算出することができる。
この画像データを用いた脈拍計測方法では、フーリエ変換に比べて計算量が少ないウェーブレット変換を用いた画像処理を行っているので、フーリエ変換を用いた脈拍計測方法と比較して大幅に処理速度を向上させることができる。また、上述のように、第2変換画像データの部分領域である領域(X14,Y12)内の輝度に基づき脈拍算出を行う。上記の例ではさらにその部分領域内の部分領域である輝度検出領域内の画素の輝度に基づき脈拍算出を行う。従って、計算コストが低く、軽い処理で画像に基づく脈拍計測を実現できる。また、実施例1の脈拍計測装置6では、一般的なカメラで撮影して得られた一般的な画像データを用いて脈拍計測が可能であるため、特殊なカメラを必要としない。従って、例えばスマートフォンやデジタルカメラ等、一般的な撮像素子を有するデバイスに実施例1の処理を行うプログラムをインストールするだけで、脈拍計測のための専用装置を用いなくても画像に基づく脈拍計測が可能となる。また、計算コストが低く、処理スピードが速いため、計算資源の乏しい装置でも実用的に動作させることが可能である。また、低コストかつ小型に実装することが可能である。
上記の説明では輝度検出領域の輝度の平均値を時系列にプロットしたが、輝度検出領域をある閾値を用いて黒画素と白画素に2値化し、白画素の数をカウントして時系列にプロットする方法も用いることができる。
なお、ウェーブレット変換の回数は、上記のように3回以上であってもよい。ウェーブレット変換の回数は、例えば、撮影画像データの画素数や、撮影画像データにより撮影される空間のスケールに応じて、変換画像データに輝度変化が最も現れやすいウェーブレット変換の回数は変わると考えられる。最適な回数は実験等により求めて脈拍計測装置に記憶させておくようにしても良いし、ユーザが任意に設定できるようにしても良い。また、ウェーブレット変換の回数によって、どの成分の画像データを後段のウェーブレット変換に用いるか変更しても良い。例えば、上述した2回の場合、第1変換画像データのHL/LH/HH成分に対し2回目のウェーブレット変換を行い、得られた第2変換画像データのHL/LH/HH成分を脈拍算出に用いた。3回行う場合、第1変換画像データのLL成分に対し2回目のウェーブレット変換を行い、得られた第2変換画像データのHL/LH/HH成分に対し3回目のウェーブレット変換を行い、得られた第3変換画像データのHL/LH/HH成分を脈拍算出に用いるということが考えられる。4回行う場合、第1変換画像データのLL成分に対し2回目のウェーブレット変換を行い、得られた第2変換画像データのLL成分に対し3回目のウェーブレット変換を行い、得られた第3変換画像データのHL/LH/HH成分に対し4回目のウェーブレット変換を行い、得られた第4変換画像データのHL/LH/HH成分を脈拍算出に用いるということが考えられる。
信号出力部5は、脈拍計測部4が算出した脈拍の情報を外部へ出力する。脈拍の情報は、例えばテキストデータとして出力しても良いし、LCD(Liquid Crystal Display)等の不図示の表示デバイスに数値データ又は数値を表示する画像データとして出力しても良い。また、信号出力部5は、画像蓄積部2から時系列の画像データを取得し、動画像データに再構成して出力しても良い。
図2は、以上説明した実施例1の脈拍計測装置による処理の流れを示すフローチャートである。
処理がスタートすると、ステップS1において、解析フレーム数(N)が設定される。解析フレーム数は、時系列の画像データとして撮像部1から取得するフレーム数であり、上記の例では64である。解析フレーム数は予め定められた固定値でも良いし、不図示の入力装置(キーボードやタッチパネル等)を用いてユーザに設定値を入力させることにより設定されるようにしても良い。
処理がスタートすると、ステップS1において、解析フレーム数(N)が設定される。解析フレーム数は、時系列の画像データとして撮像部1から取得するフレーム数であり、上記の例では64である。解析フレーム数は予め定められた固定値でも良いし、不図示の入力装置(キーボードやタッチパネル等)を用いてユーザに設定値を入力させることにより設定されるようにしても良い。
ステップS2において、撮像部1は撮像を行い、画像蓄積部2は撮影画像データを取得する。撮像画像データには撮像画像ナンバーXを付与して管理する。撮像画像ナンバーXは撮像を行う毎に1ずつインクリメントされる。画像蓄積部2は撮影画像データを画像処理部3へ出力する。
ステップS3において、画像処理部3は撮影画像データに対し2回ウェーブレット変換を行い、第2変換画像データを脈拍計測部4へ出力する。
ステップS4において、脈拍計測部4は第2変換画像データの特定領域(X14,Y12)内の輝度検出領域のデータを抽出し、ステップS5において輝度検出領域の輝度の平均値を算出して結果を保存する。
ステップS6において、撮像画像ナンバーXが解析フレーム数N以下であるか判定され、X>NとなるまでステップS2~ステップS5の処理が繰り返される。X>Nとなると、処理はステップS7に進む。
ステップS7において、脈拍計測部4は解析フレーム数Nの時系列の複数の輝度の平均値に基づき、輝度の平均値の時間変動を解析する。具体的には、脈拍計測部4は、ステップS8において輝度の平均値のピークとアンダーピークを検出して変動周期を算出し、その変動周期に基づきステップS9において脈拍数を算出する。
なお、図2のフローチャートでは、1フレームの撮像が行われるたびに輝度の平均値の算出までの処理を行うような流れとしているが、まず、解析フレーム数分の撮像を行って全フレームの画像データを画像蓄積部2に蓄積しても良い。その場合、画像処理部3及び脈拍計測部4は、撮影自体は完了している状態で、画像蓄積部2から1フレームずつ処理対象の撮像画像データを取得してウェーブレット変換及び輝度の平均値の算出を行う流れとなる。撮像部1を有せず、例えば外部で予め撮像により得られた撮影データをネットワークや可搬記録媒体等から取得して、その画像をもとに脈拍計測を行う場合にも、ステップS2の撮像の処理が完了してからウェーブレット変換及び輝度の平均値の算出を行う場合と同様の流れとなる。また実施例1では、撮像部1から出力される撮像画像データをそのまま脈拍計測に利用しているが、例えば、皮膚などの被写体が画像の一部だけに写っている場合には、撮像画像データの一部(被写体が写っている部分)を切り出して、ステップS3以降の処理を行ってもよい。さらに、撮像画像データに対し、解像度変換、輝度調整、ノイズ除去などの前処理を施してもよい。
上記の実施例1では、被験者の皮膚を撮影して得られた撮影画像データを用いて、処理負荷の軽い画像処理により脈拍を計測する方法を説明した。これは、血流の変化に伴う皮膚の光の反射の態様の時間変動をウェーブレット変換により強調して、検出するものである。しかし、本発明は、微小な時間変動をウェーブレット変換により強調して、画像処理により当該時間変動を検出する技術であるため、脈動に伴う身体の一部の揺動を画像から検出することも可能である。例えば、心臓が動脈へ血液を送り出す力で被験者の頭部は微小に揺れるため、被験者の頭部の一部又は全体を撮像して得られた撮影画像データに対し、ウェーブレット変換を複数回行うことにより、頭部の微小な揺れを強調し、その時間変動を検出することで脈拍を算出することもできる。また、動脈の血流により微小に揺れる身体の部位であれば、頭髪や腕など、皮膚以外の部位を撮像して得られた撮影画像データに対し、ウェーブレット変換を複数回行うことにより、それらの部位の微小な時間変動を検出し、脈拍を算出することもできる。なお、ウェーブレット変換の回数は、このように身体のどの部位を撮影した撮影画像データを用いて脈拍を計測するかによって最適な回数が変わることも考えられる。
1:撮像部
2:画像蓄積部(画像取得部)
3:画像処理部
4:脈拍計測部
5:信号出力部
6:脈拍計測装置
2:画像蓄積部(画像取得部)
3:画像処理部
4:脈拍計測部
5:信号出力部
6:脈拍計測装置
Claims (9)
- 生体を撮影して得られた時系列の複数の撮影画像データを取得する画像取得部と、
前記複数の撮影画像データの各々に対し、高解像度成分と低解像度成分に分解する多重解像度解析を複数回行って、前記複数の撮影画像データに対応する複数の変換画像データを生成する画像処理部と、
前記複数の変換画像データの各々における所定の領域の輝度を示す特徴量を算出し、前記特徴量の時系列データを解析して特徴量の変動周期を算出し、前記特徴量の変動周期に基づき前記生体の脈拍を算出する脈拍計測部と、
を有する脈拍計測装置。 - 前記画像処理部は、多重解像度解析により分解された高解像度成分及び低解像度成分の各々の領域に対し再び多重解像度解析を行うことにより、複数回の多重解像度解析を行う請求項1に記載の脈拍計測装置。
- 前記脈拍計測部は、多重解像度解析により生成された高解像度成分に対しさらに多重解像度解析を行って生成された高解像度成分の領域を前記所定の領域とする請求項2に記載の脈拍計測装置。
- 前記脈拍計測部は、多重解像度解析により生成された高解像度成分に対しさらに多重解像度解析を行って生成された高解像度成分の領域内の一部の領域を前記所定の領域とする請求項2に記載の脈拍計測装置。
- 前記脈拍計測部は、前記所定の領域内に含まれる画素の輝度値の平均値を前記特徴量として算出する請求項1~4のいずれか1項に記載の脈拍計測装置。
- 前記脈拍計測部は、第1の閾値以上の特徴量のうちからピークを検出するとともに、第2の閾値以下の特徴量のうちからアンダーピークを検出し、検出したピーク及びアンダーピークに基づき、特徴量の変動周期を算出する請求項1~5のいずれか1項に記載の脈拍計測装置。
- 前記脈拍計測部は、前記時系列データに対しフーリエ解析を行うことにより特徴量の変動周期を算出する請求項1~5のいずれか1項に記載の脈拍計測装置。
- 生体を撮影して得られた時系列の複数の撮影画像データを取得する取得工程と、
前記複数の撮影画像データの各々に対し、高解像度成分と低解像度成分に分解する多重解像度解析を複数回行って、前記複数の撮影画像データに対応する複数の変換画像データを生成する変換工程と、
前記複数の変換画像データの各々における所定の領域の輝度を示す特徴量を算出し、前記特徴量の時系列データを解析して特徴量の変動周期を算出し、前記特徴量の変動周期に基づき前記生体の脈拍を算出する工程と、
を有する脈拍計測装置の制御方法。 - 請求項8に記載の脈拍計測装置の制御方法の各工程をコンピュータに実行させるためのプログラム。
Priority Applications (2)
| Application Number | Priority Date | Filing Date | Title |
|---|---|---|---|
| DE112015006254.8T DE112015006254T5 (de) | 2015-03-05 | 2015-12-25 | Pulsmessvorrichtung und Steuerverfahren dafür |
| US15/683,852 US11129539B2 (en) | 2015-03-05 | 2017-08-23 | Pulse measuring device and control method thereof |
Applications Claiming Priority (2)
| Application Number | Priority Date | Filing Date | Title |
|---|---|---|---|
| JP2015043897A JP6384365B2 (ja) | 2015-03-05 | 2015-03-05 | 脈拍計測装置及びその制御方法 |
| JP2015-043897 | 2015-03-05 |
Related Child Applications (1)
| Application Number | Title | Priority Date | Filing Date |
|---|---|---|---|
| US15/683,852 Continuation US11129539B2 (en) | 2015-03-05 | 2017-08-23 | Pulse measuring device and control method thereof |
Publications (1)
| Publication Number | Publication Date |
|---|---|
| WO2016139871A1 true WO2016139871A1 (ja) | 2016-09-09 |
Family
ID=56843667
Family Applications (1)
| Application Number | Title | Priority Date | Filing Date |
|---|---|---|---|
| PCT/JP2015/086390 Ceased WO2016139871A1 (ja) | 2015-03-05 | 2015-12-25 | 脈拍計測装置及びその制御方法 |
Country Status (4)
| Country | Link |
|---|---|
| US (1) | US11129539B2 (ja) |
| JP (1) | JP6384365B2 (ja) |
| DE (1) | DE112015006254T5 (ja) |
| WO (1) | WO2016139871A1 (ja) |
Families Citing this family (4)
| Publication number | Priority date | Publication date | Assignee | Title |
|---|---|---|---|---|
| US20170262987A1 (en) * | 2016-03-09 | 2017-09-14 | Xerox Corporation | Method and apparatus for non-contact estimation of pulse transmit time |
| JP7314893B2 (ja) * | 2020-09-23 | 2023-07-26 | カシオ計算機株式会社 | 電子装置、電子装置の制御プログラム及び電子装置の制御方法 |
| WO2022138661A1 (ja) * | 2020-12-25 | 2022-06-30 | アステラス製薬株式会社 | 不整脈状態検出支援装置及びプログラム |
| JP7707630B2 (ja) | 2021-04-27 | 2025-07-15 | オムロン株式会社 | 脈波検出装置および脈波検出方法、脈波検出プログラム |
Citations (2)
| Publication number | Priority date | Publication date | Assignee | Title |
|---|---|---|---|---|
| US20080045847A1 (en) * | 2006-06-30 | 2008-02-21 | University Of Louisville Research Foundation, Inc. | Non-contact and passive measurement of arterial pulse through thermal IR imaging, and analysis of thermal IR imagery |
| JP2010264095A (ja) * | 2009-05-15 | 2010-11-25 | Nissan Motor Co Ltd | 心拍数測定装置および心拍数測定方法 |
Family Cites Families (8)
| Publication number | Priority date | Publication date | Assignee | Title |
|---|---|---|---|---|
| WO2003065891A2 (en) * | 2002-02-07 | 2003-08-14 | Ecole Polytechnique Federale De Lausanne (Epfl) | Body movement monitoring device |
| AU2002952144A0 (en) * | 2002-10-17 | 2002-10-31 | Perfusion Diagnostics Pty Ltd | Method and apparatus for measuring tissue perfusion |
| US9095266B1 (en) * | 2010-08-02 | 2015-08-04 | Chi Yung Fu | Method for treating a patient |
| GB201114406D0 (en) * | 2011-08-22 | 2011-10-05 | Isis Innovation | Remote monitoring of vital signs |
| TW201315438A (zh) * | 2011-10-14 | 2013-04-16 | Ind Tech Res Inst | 非接觸式之心脈量測方法及其系統 |
| EP2884889A2 (en) * | 2012-08-14 | 2015-06-24 | Aliphcom | Real-time physiological characteristic detection based on reflected components of light |
| EP2884884A1 (en) * | 2012-08-16 | 2015-06-24 | École Polytechnique Fédérale de Lausanne (EPFL) | Method and apparatus for low complexity spectral analysis of bio-signals |
| JP6098304B2 (ja) | 2013-03-29 | 2017-03-22 | 富士通株式会社 | 脈波検出装置、脈波検出方法及び脈波検出プログラム |
-
2015
- 2015-03-05 JP JP2015043897A patent/JP6384365B2/ja active Active
- 2015-12-25 WO PCT/JP2015/086390 patent/WO2016139871A1/ja not_active Ceased
- 2015-12-25 DE DE112015006254.8T patent/DE112015006254T5/de active Pending
-
2017
- 2017-08-23 US US15/683,852 patent/US11129539B2/en active Active
Patent Citations (2)
| Publication number | Priority date | Publication date | Assignee | Title |
|---|---|---|---|---|
| US20080045847A1 (en) * | 2006-06-30 | 2008-02-21 | University Of Louisville Research Foundation, Inc. | Non-contact and passive measurement of arterial pulse through thermal IR imaging, and analysis of thermal IR imagery |
| JP2010264095A (ja) * | 2009-05-15 | 2010-11-25 | Nissan Motor Co Ltd | 心拍数測定装置および心拍数測定方法 |
Non-Patent Citations (2)
| Title |
|---|
| CHEKMENEV ET AL.: "Multiresolution Approach for Non-Contact Measurements of Arterial Pulse using Thermal Imaging", PROCEEDINGS OF THE 2006 CONFERENCE ON COMPUTER VISION AND PATTERN RECOGNITION WORKSHOP (CVPRW'06, June 2006 (2006-06-01), pages 129 - 137 * |
| SHOICHIRO TOMII: "Heartbeat Detection by Using Doppler Radar with Wavelet Transform Based on Scale Factor Learning", IEICE TECHNICAL REPORT, vol. 113, no. 456, 16 April 2014 (2014-04-16) * |
Also Published As
| Publication number | Publication date |
|---|---|
| JP2016159108A (ja) | 2016-09-05 |
| DE112015006254T5 (de) | 2017-11-30 |
| US20170347898A1 (en) | 2017-12-07 |
| US11129539B2 (en) | 2021-09-28 |
| JP6384365B2 (ja) | 2018-09-05 |
Similar Documents
| Publication | Publication Date | Title |
|---|---|---|
| CN113408508B (zh) | 基于Transformer的非接触式心率测量方法 | |
| US20170112382A1 (en) | Pulse-wave detection method, pulse-wave detection device, and computer-readable recording medium | |
| US20190058868A1 (en) | Three-Dimensional Image Sensors | |
| JP6167614B2 (ja) | 血流指標算出プログラム、血流指標算出装置および血流指標算出方法 | |
| JP6090390B2 (ja) | ビデオデータ処理方法及びシステム | |
| US8736719B2 (en) | Image processing apparatus and control method for the same | |
| US9622698B2 (en) | System and method for detecting cancerous tissue from a thermal image | |
| JP6098304B2 (ja) | 脈波検出装置、脈波検出方法及び脈波検出プログラム | |
| US9070218B2 (en) | Reconstructing an image of a scene captured using a compressed sensing device | |
| JP6384365B2 (ja) | 脈拍計測装置及びその制御方法 | |
| JP6115263B2 (ja) | 脈波検出装置、脈波検出方法及び脈波検出プログラム | |
| JP6393984B2 (ja) | 脈拍計測装置、脈拍計測方法及び脈拍計測プログラム | |
| JP6142664B2 (ja) | 脈波検出装置、脈波検出プログラム、脈波検出方法及びコンテンツ評価システム | |
| US11526996B2 (en) | Analysis and visualization of subtle motions in videos | |
| CN111820870A (zh) | 生物影像处理方法以及生理信息检测装置 | |
| JP6167615B2 (ja) | 血流指標算出プログラム、端末装置および血流指標算出方法 | |
| US20180373393A1 (en) | Methods and Apparatuses for Detecting Touch Motion with Ultrasonic Sensors | |
| CN115790810A (zh) | 基于事件相机的振动测量方法、装置、设备及存储介质 | |
| JP6135255B2 (ja) | 心拍測定プログラム、心拍測定方法及び心拍測定装置 | |
| JP7197210B2 (ja) | 画像補正システム、画像補正方法、及びプログラム | |
| CN110659583A (zh) | 信号处理方法、装置及相关产品 | |
| JP2014073159A (ja) | 脈波検出装置、脈波検出プログラム及び脈波検出方法 | |
| CN110674697A (zh) | 滤波方法、装置及相关产品 | |
| JP6488722B2 (ja) | 脈波検出装置、脈波検出方法及び脈波検出プログラム | |
| CN105796051A (zh) | 三维生理检测系统及其操作方法 |
Legal Events
| Date | Code | Title | Description |
|---|---|---|---|
| 121 | Ep: the epo has been informed by wipo that ep was designated in this application |
Ref document number: 15884037 Country of ref document: EP Kind code of ref document: A1 |
|
| WWE | Wipo information: entry into national phase |
Ref document number: 112015006254 Country of ref document: DE |
|
| 122 | Ep: pct application non-entry in european phase |
Ref document number: 15884037 Country of ref document: EP Kind code of ref document: A1 |