WO2016067869A1 - 血圧測定装置 - Google Patents
血圧測定装置 Download PDFInfo
- Publication number
- WO2016067869A1 WO2016067869A1 PCT/JP2015/078541 JP2015078541W WO2016067869A1 WO 2016067869 A1 WO2016067869 A1 WO 2016067869A1 JP 2015078541 W JP2015078541 W JP 2015078541W WO 2016067869 A1 WO2016067869 A1 WO 2016067869A1
- Authority
- WO
- WIPO (PCT)
- Prior art keywords
- pressure
- pulse wave
- blood pressure
- pressing
- pressing force
- Prior art date
Links
Images


Classifications
-
- A—HUMAN NECESSITIES
- A61—MEDICAL OR VETERINARY SCIENCE; HYGIENE
- A61B—DIAGNOSIS; SURGERY; IDENTIFICATION
- A61B5/00—Measuring for diagnostic purposes; Identification of persons
- A61B5/68—Arrangements of detecting, measuring or recording means, e.g. sensors, in relation to patient
- A61B5/6801—Arrangements of detecting, measuring or recording means, e.g. sensors, in relation to patient specially adapted to be attached to or worn on the body surface
- A61B5/6843—Monitoring or controlling sensor contact pressure
-
- A—HUMAN NECESSITIES
- A61—MEDICAL OR VETERINARY SCIENCE; HYGIENE
- A61B—DIAGNOSIS; SURGERY; IDENTIFICATION
- A61B5/00—Measuring for diagnostic purposes; Identification of persons
- A61B5/02—Detecting, measuring or recording pulse, heart rate, blood pressure or blood flow; Combined pulse/heart-rate/blood pressure determination; Evaluating a cardiovascular condition not otherwise provided for, e.g. using combinations of techniques provided for in this group with electrocardiography or electroauscultation; Heart catheters for measuring blood pressure
- A61B5/021—Measuring pressure in heart or blood vessels
- A61B5/022—Measuring pressure in heart or blood vessels by applying pressure to close blood vessels, e.g. against the skin; Ophthalmodynamometers
-
- A—HUMAN NECESSITIES
- A61—MEDICAL OR VETERINARY SCIENCE; HYGIENE
- A61B—DIAGNOSIS; SURGERY; IDENTIFICATION
- A61B5/00—Measuring for diagnostic purposes; Identification of persons
- A61B5/68—Arrangements of detecting, measuring or recording means, e.g. sensors, in relation to patient
- A61B5/6801—Arrangements of detecting, measuring or recording means, e.g. sensors, in relation to patient specially adapted to be attached to or worn on the body surface
- A61B5/6813—Specially adapted to be attached to a specific body part
- A61B5/6824—Arm or wrist
-
- A—HUMAN NECESSITIES
- A61—MEDICAL OR VETERINARY SCIENCE; HYGIENE
- A61B—DIAGNOSIS; SURGERY; IDENTIFICATION
- A61B5/00—Measuring for diagnostic purposes; Identification of persons
- A61B5/68—Arrangements of detecting, measuring or recording means, e.g. sensors, in relation to patient
- A61B5/6801—Arrangements of detecting, measuring or recording means, e.g. sensors, in relation to patient specially adapted to be attached to or worn on the body surface
- A61B5/683—Means for maintaining contact with the body
- A61B5/6831—Straps, bands or harnesses
-
- A—HUMAN NECESSITIES
- A61—MEDICAL OR VETERINARY SCIENCE; HYGIENE
- A61B—DIAGNOSIS; SURGERY; IDENTIFICATION
- A61B5/00—Measuring for diagnostic purposes; Identification of persons
- A61B5/72—Signal processing specially adapted for physiological signals or for diagnostic purposes
- A61B5/7271—Specific aspects of physiological measurement analysis
- A61B5/7278—Artificial waveform generation or derivation, e.g. synthesising signals from measured signals
-
- A—HUMAN NECESSITIES
- A61—MEDICAL OR VETERINARY SCIENCE; HYGIENE
- A61B—DIAGNOSIS; SURGERY; IDENTIFICATION
- A61B5/00—Measuring for diagnostic purposes; Identification of persons
- A61B5/74—Details of notification to user or communication with user or patient ; user input means
- A61B5/742—Details of notification to user or communication with user or patient ; user input means using visual displays
-
- A—HUMAN NECESSITIES
- A61—MEDICAL OR VETERINARY SCIENCE; HYGIENE
- A61B—DIAGNOSIS; SURGERY; IDENTIFICATION
- A61B2562/00—Details of sensors; Constructional details of sensor housings or probes; Accessories for sensors
- A61B2562/04—Arrangements of multiple sensors of the same type
Definitions
- the present invention relates to a blood pressure measurement device.
- a biological information measuring device capable of measuring biological information such as pulse and blood pressure using information detected by the pressure sensor in a state where the pressure sensor is in direct contact with a biological part through which an artery such as the radial artery of the wrist passes.
- the blood pressure measurement device described in Patent Literature 1 calculates a blood pressure value using a cuff at a part different from a living body part with which the pressure sensor is brought into contact, and generates calibration data from the calculated blood pressure value.
- the blood pressure value is calculated for each beat by calibrating the pressure pulse wave detected by the pressure sensor using the calibration data.
- Patent Documents 2, 3, and 4 describe a blood pressure measurement device that measures blood pressure for each beat using only information detected by a pressure sensor that is brought into contact with a wrist without using a cuff.
- Patent Document 5 describes a pulse wave detection device that detects a pulse wave by pressing against a artery a pressing surface on which a plurality of pressure sensor arrays arranged in the direction in which the artery extends. This pulse wave detection device determines whether or not the pressing surface and the artery are parallel by comparing the pressure pulse waves obtained from the plurality of pressure sensor arrays in a state where the pressing surface is pressed against the artery with a predetermined pressure. . When the pressing surface and the artery are not parallel, posture control is performed so that the pressing surface and the artery are parallel by inclining the pressing surface in the direction in which the artery extends.
- Japanese Unexamined Patent Publication No. 2004-113368 Japanese Unexamined Patent Publication No. 02-261421 Japanese Unexamined Patent Publication No. 07-124130 Japanese Laid-Open Patent Publication No. 01-242301 Japanese Unexamined Patent Publication No. 01-288228
- the apparatus can be downsized.
- the devices described in Patent Documents 2 and 3 calculate blood pressure by calibrating or correcting the pressure pulse wave detected by the pressure sensor in a state where the pressure sensor is pressed with the optimum pressing force.
- the device described in Patent Document 4 can calculate the blood pressure value based on the change in the pressure pulse wave amplitude detected in the step of continuously changing the pressing force of the pressure sensor. For this reason, it is possible to measure blood pressure in a short time without making the user bothersome.
- the device described in Patent Document 5 performs posture control of the pressing surface by comparing the pressure pulse wave output from each pressure sensor array in a state where the pressing surface is pressed against the artery with a predetermined pressure. Posture control is not performed in consideration of the relative positional relationship between the pressing surface and the artery in the process of changing the pressing force to the head.
- the present invention has been made in view of the above circumstances, and an object of the present invention is to provide a blood pressure measurement device that can measure blood pressure with high accuracy in a short period of time without causing trouble to the user.
- the blood pressure measurement device includes a pressing surface on which at least one element row including a plurality of pressure detection elements arranged in one direction is formed, and the one direction intersects with a direction in which an artery under the skin of a living body extends.
- Said pressing In which the control of the control unit and a blood pressure calculation unit calculating a blood pressure value in the artery based on the pressure pulse wave pressure is detected step decreases, in the said element array.
- a blood pressure measurement device capable of measuring blood pressure in a short time without causing trouble for the user.
- FIG. 2 is an enlarged view of a pressure pulse wave detection unit 100 shown in FIG. 1. It is the figure which looked at the pressure pulse wave detection part 100 in the mounting state shown in FIG. 1 from the fingertip side of the user. It is the figure which looked at the pressure pulse wave detection part 100 in the mounting state shown in FIG. 1 from the contact part side with a wrist. It is a figure which shows the block configuration of parts other than the pressure pulse wave detection part 100 of a blood pressure measurement apparatus. It is a flowchart for demonstrating operation
- FIG. 6 is a diagram illustrating an example of an amplitude value of a pressure pulse wave detected by each pressure sensor of the sensor unit 6 when the pressure applied to the wrist by the sensor unit 6 is changed. It is a figure which shows the state which applies the pressure pulse wave detection part 100 to a wrist, and presses the sensor part 6 toward a wrist with the air bag 2.
- FIG. It is the figure which showed an example of the change of the pressing force to a wrist, and the change of the pressure pulse wave detected by the optimal pressure sensor. It is a figure which shows an example of pulse wave envelope data.
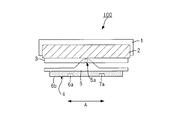
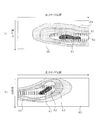
- FIG. 1 is an external view showing a configuration of a pressure pulse wave detection unit 100 of a blood pressure measurement device for explaining an embodiment of the present invention.
- the blood pressure measurement device of the present embodiment is attached to a living body part (the wrist of a user in the example of FIG. 1) in which an artery (radial artery T in the example of FIG. 1) is present by a belt (not shown). Is possible.
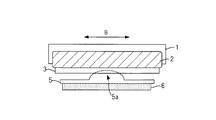
- FIG. 2 is an enlarged view of the pressure pulse wave detector 100 shown in FIG.
- FIG. 3 is a view of the pressure pulse wave detection unit 100 in the wearing state shown in FIG. 1 as viewed from the fingertip side of the user.
- FIG. 4 is a view of the pressure pulse wave detection unit 100 in the wearing state shown in FIG. 1 as viewed from the contact part side with the wrist. 1 to 4 schematically show the pressure pulse wave detection unit 100, and the dimensions and arrangement of the respective parts are not limited.
- the pressure pulse wave detection unit 100 includes a housing 1 containing an air bag 2, a flat plate portion 3 that is a flat member fixed to the air bag 2, and a two-axis rotation mechanism 5 a for the flat plate portion 3.
- the rotating unit 5 is rotatably supported around each of the two shafts, and the sensor unit 6 is provided on a plane opposite to the flat plate unit 3 side of the rotating unit 5.
- the air bag 2 serves as a pressing unit that presses the pressing surface 6 b of the sensor unit 6 against the artery under the skin of the living body part (wrist) with the blood pressure measurement device mounted on the wrist.
- the pressing part may be anything as long as it can press the pressing surface 6b of the sensor part 6 against the artery, and is not limited to one using an air bag.
- the air bag 2 has a direction in which the flat plate portion 3 fixed to the air bag 2 is perpendicular to the surface of the flat plate portion 3 (a plane on the rotating portion 5 side) by controlling the amount of air inside by a pump (not shown). Move to.
- the pressing surface 6b of the sensor unit 6 included in the pressure pulse wave detection unit 100 contacts the skin of the user's wrist.
- the internal pressure of the air bag 2 increases, and the sensor unit 6 is pressed toward the radial artery T below the wrist.
- the pressing force applied to the radial artery T by the sensor unit 6 is equivalent to the internal pressure of the air bag 2.
- the pressing surface 6 b has a direction B (one direction) intersecting (orthogonal in the example of FIG. 1) with the extending direction A of the radial artery T present at the mounting site in the mounting state shown in FIG. 1.
- a plurality of pressure sensors 6a are formed as pressure detecting elements.
- a plurality of pressure sensors 7a arranged in the direction B are formed on the pressing surface 6b.
- Each pressure sensor 6a and the pressure sensor 6a and the pressure sensor 7a having the same position in the direction B constitute a pair, and the pressing surface 6b has a plurality of pairs arranged in the direction B.
- the pressure sensors (the plurality of pressure sensors 6a and the plurality of pressure sensors 7a) included in the pressure pulse wave detection unit 100 constitute a pressure detection unit.
- the pressing surface 6b is a surface of a semiconductor substrate made of single crystal silicon or the like, and the pressure sensors 6a and 7a are constituted by pressure sensitive diodes or the like formed on the surface of the semiconductor substrate.
- the pressure sensor 6a (7a) is a pressure vibration generated from the radial artery T and transmitted to the skin by being pressed against the radial artery T so that the arrangement direction intersects (substantially orthogonal) the radial artery T.
- a wave that is, a pressure pulse wave is detected.
- the intervals in the arrangement direction of the pressure sensors 6a (7a) are sufficiently small so that a necessary and sufficient number is arranged on the radial artery T.
- the arrangement length of each pressure sensor 6a (7a) is necessary and sufficiently larger than the radial dimension of the radial artery T.
- the biaxial rotation mechanism 5 a is a mechanism for rotating the rotation unit 5 around each of the two rotation axes X and Y orthogonal to the pressing direction of the flat plate portion 3 by the air bag 2. is there.
- the biaxial rotation mechanism 5a has two rotation axes X and Y set on the surface of the flat plate portion 3 and orthogonal to each other, and the rotation axes X and Y are respectively driven to rotate by a rotation drive unit 10 described later.
- the rotation axis Y is a first axis extending in the arrangement direction of the plurality of pressure sensors 6a (7a) formed on the pressing surface 6b.
- the rotation axis Y is set between the element array including the plurality of pressure sensors 6a and the element array including the plurality of pressure sensors 7a (in the example of FIG. 4) in the plan view of FIG.
- the rotation axis X is a second axis extending in a direction orthogonal to the arrangement direction of the plurality of pressure sensors 6a (7a) formed on the pressing surface 6b.
- the rotation axis X is set on a straight line that equally divides the element array composed of the plurality of pressure sensors 6 a and the element array composed of the plurality of pressure sensors 7 a.
- the rotation surface 5 rotates about the rotation axis X, so that the pressing surface 6b rotates around the rotation axis X.
- the rotation surface 5 rotates around the rotation axis Y, so that the pressing surface 6 b rotates around the rotation axis Y.
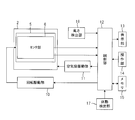
- FIG. 5 is a diagram showing a block configuration of a portion other than the pressure pulse wave detection unit 100 of the blood pressure measurement device.
- the blood pressure measurement device includes a pressure pulse wave detection unit 100, a rotation drive unit 10, an air bag drive unit 11, a control unit 12 that performs overall control of the entire device, a display unit 13, an operation unit 14, and a memory 15. .
- the rotation drive unit 10 is an actuator connected to each of the rotation axes X and Y of the biaxial rotation mechanism 5a of the pressure pulse wave detection unit 100.
- the rotation drive unit 10 rotates the rotation axes X and Y according to instructions from the control unit 12 to rotate the pressing surface 6b around the rotation axis X, or the pressing surface 6b around the rotation axis Y. Or rotate it.
- the air bag drive unit 11 controls the amount of air injected into the air bag 2 (internal pressure of the air bag 2) under the instruction of the control unit 12.
- the display unit 13 is for displaying various information such as a measured blood pressure value, and is configured by, for example, a liquid crystal.
- the operation unit 14 is an interface for inputting an instruction signal to the control unit 12, and includes a button for instructing the start of various operations including blood pressure measurement.
- the memory 15 stores various information such as a ROM (Read Only Memory) for storing a program and data for causing the control unit 12 to perform a predetermined operation, a RAM (Random Access Memory) as a work memory, and measured blood pressure data. Includes flash memory to store.
- ROM Read Only Memory
- RAM Random Access Memory
- the control unit 12 executes a program stored in the ROM of the memory 15 to thereby execute a press control unit, a first blood pressure calculation unit, a rotation control unit, a second blood pressure calculation unit, a calibration data generation unit, and a determination unit. And function as a processing unit.
- the pressing control unit controls the pressing force applied to the wrist by the pressing surface 6b by controlling the air bag driving unit 11 and adjusting the amount of air in the air bag 2.
- the first blood pressure calculating unit presses the pressure surface 6b in the radial artery T based on the pressure pulse wave detected by the pressure sensors 6a and 7a formed on the pressing surface 6b in a state where the pressing surface 6b is pressed against the radial artery T.
- One blood pressure value is calculated.
- the first blood pressure calculating unit detects the pressure pulse detected by the pressure sensors 6a and 7a in the process in which the pressing force to the radial artery T is changed (increased or decreased) by the air bag driving unit 11. Based on the wave, a first blood pressure value in radial artery T is calculated.
- the calibration data generation unit generates calibration data using the first blood pressure value calculated by the first blood pressure calculation unit.
- the rotation control unit is configured to press the pressure surface 6b of the rotation driving unit 10 based on the pressure pulse wave detected by the pressure sensors 6a and 7a in the process in which the pressing force to the radial artery T is increased by the air bag driving unit 11. The necessity of rotation is determined. When the rotation control unit determines that the rotation is necessary, the rotation control unit 10 rotates the pressing surface 6b.
- the second blood pressure calculation unit detects each beat by the pressure sensors 6a and 7a in a state where the pressing surface 6b is pressed against the radial artery T with an optimal pressing force for deforming a part of the radial artery T flatly.
- the second blood pressure value in the radial artery T is calculated by calibrating the pressure pulse wave to be calibrated with the calibration data.
- the determination unit determines whether or not the detection condition of the pressure pulse wave to be calibrated based on the calibration data matches the detection condition of the pressure pulse wave used to generate the calibration data.
- the processing unit performs processing according to the determination result by the determination unit.
- the blood pressure measurement device measures a blood pressure value (SBP (Systemic Blood Pressure), so-called systolic blood pressure, DBP (Diastrotic Blood pressure)), so-called diastolic blood pressure, and displays it on the display unit 13 every beat. Has a measurement mode.
- SBP Systemic Blood Pressure
- DBP Diastrotic Blood pressure
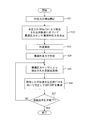
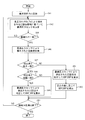
- FIG. 6 is a flowchart for explaining the operation up to the generation of calibration data in the continuous blood pressure measurement mode of the blood pressure measurement device of the present embodiment.
- the rotation unit 5 of the pressure pulse wave detection unit 100 has a rotation amount set to, for example, zero, and the pressing surface 6b is parallel to the flat plate part 3.
- the state in which the rotation amount is zero is set as the initial state, but this is not restrictive.
- the initial state is a state in which the rotation driving unit 10 rotates the pressing surface 6b so that the pressing surface 6b contacts the skin evenly according to the shape of the wrist. It is good also as a state.
- control unit 12 controls the air bag driving unit 11 to start injecting air into the air bag 2 and increases the pressing force on the radial artery T by the pressing surface 6b (step S1). ).
- the control unit 12 determines each pressure sensor 6a up to an arbitrary timing (for example, a periodic timing) after a sufficient time has elapsed to start the occlusion of the radial artery T.
- a plurality of pressure pulse wave information I1 is acquired in order from the latest detection time among the pressure pulse waves (the pressure pulse wave information I1) detected and stored in the memory 15.
- the control unit 12 detects the pressure pulse wave (the pressure pulse wave information I2) detected by each pressure sensor 7a and stored in the memory 15 at the above arbitrary timing in the order of detection time.
- a plurality of pressure pulse wave information I2 is acquired (step S1A).
- the control unit 12 calculates, for example, the average value Ave1 of the amplitude of the pressure pulse wave of each pressure sensor 6a detected at time t1 among the plurality of pressure pulse wave information I1 acquired in step S1A, and after time t1.
- the average value Ave2 of the amplitude of the pressure pulse wave of each pressure sensor 6a detected at time t2 is calculated.
- the control part 12 calculates the average value Ave3 of the amplitude of the pressure pulse wave of each pressure sensor 7a detected at time t1 among the plurality of pressure pulse wave information I2 acquired at step S1A, and detects it at time t2.
- the average value Ave4 of the amplitude of the pressure pulse wave of each pressure sensor 7a is calculated.
- the control part 12 calculates ratio ((Ave1 / Ave3) and (Ave2 / Ave4)) of the average value calculated with respect to the same time.
- the control unit 12 determines whether or not the rotation unit 5 should be rotated by the rotation drive unit 10 based on the change in the ratio calculated for a plurality of timings. That is, the control unit 12 determines whether or not to rotate the rotating unit 5 based on the pressure pulse waves detected by the pressure sensors 6a and 7a at a plurality of timings in the increasing process of the pressing force (step S1B).
- the element array composed of the pressure sensor 7a is directed in the direction of closing the radial artery T, but the element array composed of the pressure sensor 6a is the radial artery. It can be determined that T is not in the closing direction. For this reason, the control part 12 determines with rotation of the rotation part 5 being required.
- the element array composed of the pressure sensor 6a is directed in the direction of closing the radial artery T, but the element array composed of the pressure sensor 7a is the radial artery. It can be determined that T is not in the closing direction. For this reason, the control part 12 determines with rotation of the rotation part 5 being required.
- the control part 12 determines with the rotation of the rotation part 5 being unnecessary.
- control unit 12 determines the necessity of rotation based on the variation in the ratio calculated for a plurality of timings. Instead of this ratio, a difference between the average value Ave1 (Ave2) and the average value Ave3 (Ave4) (a value considering the sign) may be used.
- FIG. 7A is a diagram illustrating an example of a state in which the radial artery T is occluded by the element array including the pressure sensor 7a, but the radial artery T is not occluded by the element array including the pressure sensor 6a. .
- the distance between the element array composed of the pressure sensor 6a and the radial artery T is larger than the distance between the element array composed of the pressure sensor 7a and the radial artery T.
- step S1B determines that the rotation of the rotation unit 5 around the rotation axis Y is necessary
- the control unit 12 determines the rotation axis Y of the rotation unit 5 according to the value of (6A / 7A) at the latest time.
- the surrounding rotation is controlled (step S1C).
- control unit 12 is a data table indicating the relationship between the value of (6A / 7A) and the rotation amount of the rotation unit 5 (obtained experimentally before product shipment and stored in the memory 15). , The rotation amount corresponding to the value of (6A / 7A) is read, and the read rotation amount is set.
- control unit 12 determines which one of the average value 6A and the average value 7A is larger. If the average value 6A is large, the control unit 12 rotates to reduce the distance between the element array including the pressure sensor 6a and the radial artery T.
- the rotation direction of the rotation unit 5 around the axis Y is set counterclockwise in FIG.
- control unit 12 rotates the rotation direction of the rotation unit 5 around the rotation axis Y in the clockwise direction in FIG. 7 in order to reduce the distance between the element array including the pressure sensor 7a and the radial artery T.
- the control unit 12 rotates the rotating unit 5 according to the rotation direction and the rotation amount set as described above. Thereby, as shown in FIG. 7B, the pressing surface 6b and the radial artery T can be made parallel, and the radial artery T can be closed by each of the two element rows.
- step S ⁇ b> 2 the control unit 12 determines whether or not the pressing force has reached a pressure sufficient to close the radial artery T (necessary pressing force).
- step S2: YES the control unit 12 controls the air bag driving unit 11 to stop the injection of air into the air bag 2 (step S3).
- step S3 the control unit 12 returns the process to step S1A.
- step S3 the control unit 12 determines between the amplitude of the pressure pulse wave detected by each pressure sensor 6a at the same time between step S1 and step S3, and the position on the pressing surface 6b of each pressure sensor 6a.
- the control part 12 calculates
- the control unit 12 generates a tonogram generated for the element array composed of the pressure sensors 6a from the identification information of the element array, the detection time of the pressure pulse wave, and the pressing force in the pressing direction by the air bag 2 at the detection time ( The pressure is stored in the memory 15 in association with the internal pressure of the air bag 2.
- control unit 12 generates a tonogram generated for the element array including the pressure sensor 7a in the direction of pressing by the air bag 2 at the detection information of the element array, the detection time of the pressure pulse wave, and the detection time. It is stored in the memory 15 in association with the pressing force.
- control part 12 calculates the moving amount
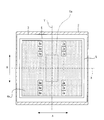
- FIG. 8A and 8B are examples of the amplitude value of the pressure pulse wave detected by each pressure sensor 6a of the sensor unit 6 when the pressure applied to the wrist by the sensor unit 6 is changed.
- FIG. 8A and 8B the horizontal axis indicates the position of each pressure sensor 6a in the direction B, and the vertical axis indicates the pressing force.
- the amplitude of the pressure pulse wave detected by the pressure sensor 6a at each position is color-coded according to its magnitude.
- Symbol A1 is a portion where the amplitude is greater than or equal to the threshold value TH1.
- Symbol A2 is a portion where the amplitude is greater than or equal to threshold TH2 and less than threshold TH1.
- Symbol A3 is a portion where the amplitude is greater than or equal to threshold TH3 and less than threshold TH2.
- Symbol A4 is a portion where the amplitude is greater than or equal to threshold TH4 and less than threshold TH3.
- Symbol A5 is a portion where the amplitude is less than the threshold value TH4. Note that threshold TH1> threshold TH2> threshold TH3> threshold TH4.
- FIG. 8 (a) shows an example in which the position of the pressure sensor 6a that detects a pressure pulse wave having an amplitude greater than or equal to the threshold TH1 does not substantially change in the process of increasing the pressing force.
- FIG. 8B shows an example in which the position of the pressure sensor 6a that detects a pressure pulse wave having an amplitude greater than or equal to the threshold TH1 is shifted to the left in the process of increasing the pressing force. Yes.
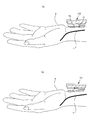
- FIG. 9 is a diagram illustrating a state in which the pressure pulse wave detection unit 100 is applied to the wrist and the sensor unit 6 is pressed toward the wrist by the air bag 2.
- the symbol TB indicates a rib
- the symbol K indicates a tendon.
- the radial artery T may move in the direction B as shown in FIG. 9 (b).
- the distribution of amplitude values of the pressure pulse wave during pressing becomes as shown in FIG. 8B. That is, the position of the pressure sensor 6a that detected the amplitude value at the pressing force at which the amplitude value equal to or greater than the threshold TH1 was detected for the first time and the amplitude value at the pressure that was last detected as the amplitude value equal to or greater than the threshold TH1 were detected. A large deviation occurs from the position of the pressure sensor 6a.
- the change in the position of the radial artery T in the direction B can be detected by looking at the change in the tonogram in the process of changing the pressing force. If the radial artery T is occluded by increasing the pressing force in the state shown in FIG. 9B, there is a possibility that an accurate tonogram cannot be obtained due to the influence of the living tissue such as the tendon K.
- the control unit 12 detects the position of the pressure sensor 6a that has detected the amplitude value in the pressing force in which the amplitude value equal to or greater than the threshold value TH1 is first detected from the data in FIG. 8 showing the relationship between the pressing force and the tonogram, and the threshold value TH1.
- the difference (that is, the amount of movement in the direction B of the radial artery T) with the position of the pressure sensor 6a that detected the amplitude value in the pressing force in which the above amplitude value was finally detected is calculated in step S6. It is determined whether or not the difference is greater than or equal to a threshold value THa (step S7).
- step S7 If the difference between the two positions is equal to or greater than the threshold THa (step S7: YES), the control unit 12 obtains the vector indicated by the arrow in FIG. 8B in step S8. If the difference between the two positions is less than the threshold THa (step S7: NO), the process of step S9 is performed.
- the direction and magnitude of the vector shown in FIG. 8 and information indicating in what direction and how much the rotating unit 5 should be rotated around the rotation axis X are obtained in advance and correlated. And remember.
- control unit 12 acquires information about the rotation direction and the rotation amount corresponding to the obtained vector size and direction from the memory 15 and transmits the acquired information to the rotation drive unit 10. And the rotation drive part 10 rotates the rotation part 5 as shown in FIG.9 (c) according to the received information (step S8).
- the control unit 12 determines the rotation unit based on the pressure pulse waves detected by the pressure sensors 6a and 7a at a plurality of timings in the process of increasing the pressing force by the air bag 2. Whether or not 5 needs to be rotated is determined in steps S1B and S7. And when it is necessary to rotate the rotation part 5 (step S1B: YES, step S7: YES), the control part 12 is based on the pressure pulse wave detected by each pressure sensor 6a, 7a. The moving part 5 is rotated.
- step S9 following step S8, the control unit 12 controls the air bag drive unit 11 to discharge the air in the air bag 2 and starts to reduce the pressing force on the radial artery T.
- the control unit 12 starts decreasing the pressing force in step S9, reduces the pressing force to the minimum value, and then determines an optimum pressure sensor from among all the pressure sensors 6a and 7a. For example, the control unit 12 determines the pressure sensor that has detected the pressure pulse wave having the maximum amplitude in the process of decreasing the pressing force as the optimum pressure sensor.
- the pressure pulse wave detected by the pressure sensor located directly above the portion where the radial artery T is flat is not affected by the tension of the wall of the radial artery T and has the largest amplitude.
- This pressure pulse wave has the highest correlation with the blood pressure value in the radial artery T. For this reason, the pressure sensor that detects the pressure pulse wave having the maximum amplitude is determined as the optimum pressure sensor.
- the plurality of pressure sensors are treated as optimum pressure sensors, and the pressure pulses detected by each of the plurality of pressure sensors are detected.
- an average of the waves may be handled as a pressure pulse wave detected by the optimum pressure sensor.
- control part 12 produces
- the pulse wave envelope data is detected by the optimal pressure sensor when the sensor 6 presses the radial artery T against the radial artery T (the internal pressure of the air bag 2) and the optimal pressure sensor is pressed against the radial artery T by the pressing force. It is the data which matched the amplitude of the pressure pulse wave to be performed.
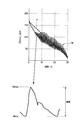
- FIG. 10 is a diagram showing an example of a change in the pressing force on the radial artery T and a change in the pressure pulse wave detected by the optimum pressure sensor.
- the straight line indicated by the symbol P indicates the pressing force
- the waveform indicated by the symbol M indicates the pressure pulse wave.
- an enlarged view of one pressure pulse wave is shown.
- the pressure at the rising point is referred to as the minimum value Mmin
- the pressure at the falling point is referred to as the maximum value Mmax.
- the amplitude of the pressure pulse wave is a value obtained by subtracting the minimum value Mmin from the maximum value Mmax.
- the maximum value Mmax and the minimum value Mmin are each information that specifies the shape of the pressure pulse wave.
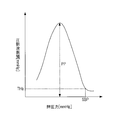
- step S10 the control unit 12 generates pulse wave envelope data as shown in FIG. 11 from the relationship between the pressing force and the pressure pulse wave shown in FIG.
- control unit 12 calculates SBP and DBP from the generated pulse wave envelope data (step S11).
- the control unit 12 starts to decrease the pressing force when the pressure pulse wave amplitude starts to increase rapidly after the pressing force starts to decrease, that is, the pressing force starts to decrease. Thereafter, the pressing force at the time when the pressure pulse wave amplitude detected by the optimum pressure sensor first exceeds the threshold value THb that can be determined to be no longer in the arterial occlusion state is determined as SBP.
- the control unit 12 calculates a difference between two adjacent amplitude values in the pulse wave envelope data, and determines the pressing force when the difference exceeds a threshold value as SBP.
- control unit 12 determines the maximum value Mmax and the minimum value of any one of the pressure pulse waves (for example, the pressure pulse wave having the maximum amplitude) detected by the optimum pressure sensor determined in the pressure reduction process of step S9. Using the value Mmin and the SBP and DBP calculated in step S11, calibration data used at the time of continuous blood pressure measurement described later is generated and stored in the memory 15 (step S12).
- the control unit 12 adds the SBP and DBP obtained in step S11 to the equations (1) and (2), and the maximum value Mmax and the minimum value of the pressure pulse wave having the maximum amplitude in the pulse wave envelope of FIG. Substituting Mmin, slope a and intercept b are calculated. The calculated coefficients a and b and equations (1) and (2) are stored in the memory 15 as calibration data.
- FIG. 12 is a flowchart for explaining the continuous blood pressure measurement operation in the continuous blood pressure measurement mode of the blood pressure measurement device of the present embodiment.
- control unit 12 controls the air bag drive unit 11 to increase the internal pressure of the air bag 2, and the pressing force to the radial artery T by the pressing surface 6 b Is increased (step S21).
- control unit 12 determines the pressure sensor that detects the pressure pulse wave having the maximum amplitude in the process of increasing the pressing force among the pressure sensors 6a and 7a as the optimum pressure sensor. Moreover, the control part 12 determines the internal pressure of the air bag 2 at the time of detecting the pressure pulse wave of this maximum amplitude as an optimal pressing force (step S22).
- control unit 12 releases the internal pressure of the air bag 2 and returns it to the initial state (step S23), and then increases the internal pressure of the air bag 2 to the optimum pressing force determined in step S22. The pressure is maintained (step S24).
- control unit 12 acquires the pressure pulse wave detected by the optimal pressure sensor determined in step S22 in a state where the pressing surface 6b is pressed against the radial artery T with the optimal pressing force (step S25).
- control unit 12 calibrates the acquired one pressure pulse wave using the calibration data generated in Step S12 of FIG. 6, and calculates SBP and DBP (Step S26).
- control unit 12 calculates the SBP by substituting the maximum value Mmax of the pressure pulse wave acquired in step S25 and the coefficients a and b calculated in step S12 into the above-described equation (1).
- the DBP is calculated by substituting the pressure minimum value Mmin of the pressure pulse wave acquired in S25 and the coefficients a and b calculated in step S12 into the above-described equation (2).
- the control unit 12 displays the calculated SBP and DBP on the display unit 13, for example, and notifies the user.
- the control unit 12 ends the process if there is an instruction to end continuous blood pressure measurement (step S27: YES), and returns the process to step S25 if there is no instruction to end (step S27: NO).
- the control unit 12 generates calibration data using the first blood pressure value calculated based on the pressure pulse wave detected by the sensor unit 6 in the process of decreasing the pressing force. That is, the control unit 12 mainly uses the pressure pulse wave obtained in the process of changing the pressing force regardless of the pressure pulse wave detected in a state where the sensor unit 6 is pressed and held with the optimal pressing force. Can be calculated. Therefore, the blood pressure can be calculated without going through the three steps of increasing the internal pressure of the air bag 2, releasing the internal pressure of the air bag 2, and increasing the internal pressure of the air bag 2 to the optimum pressure.
- the blood pressure measurement device of the present embodiment can also be provided with a mode for measuring blood pressure at an arbitrary timing and presenting it to the user.
- this mode is set, the control unit 12 performs the processing from step S1 to step S11 in FIG. 6 so that the blood pressure can be measured and presented in a short time without bothering the user. It becomes possible.
- data generation for calibrating the pressure pulse wave detected by the pressure sensor can be performed only by a device that is small enough to be worn on the wrist. For this reason, even when the blood pressure measurement device is shared by a plurality of users, it is easy to generate calibration data for each user. Therefore, even when a device is shared by a plurality of users, each user can easily start using the device.
- step S1B when the determination in step S1B is never YES and the determination in step S7 is NO, that is, after the increase process of the pressing force and the end of the increase process, the rotating unit When the rotation 5 is not performed, the control unit 12 may perform the following operation.
- the control unit 12 Based on the pressure pulse wave detected by each of the pressure sensors 6a and 7a in the process of increasing the pressing force in steps S1 to S3, the control unit 12 selects an optimum pressure sensor (for example, a pressure with a maximum amplitude) from the pressure sensors 6a and 7a. The pressure sensor that detects the pulse wave is determined. Then, the control unit 12 generates pulse wave envelope data from the pressure pulse wave detected by the optimum pressure sensor in the process of increasing the pressing force. The control unit 12 calculates SBP and DBP from the generated pulse wave envelope data.
- an optimum pressure sensor for example, a pressure with a maximum amplitude
- the control unit 12 optimizes the pressing force when the pressure pulse wave amplitude starts to decrease sharply after the pressing force starts increasing, that is, after the pressing force starts increasing.
- the pressing force at the time when the pressure pulse wave amplitude detected by the pressure sensor becomes equal to or less than the threshold value THb is determined as SBP.
- the DBP calculation method is the same as in step S11.
- control unit 12 may generate calibration data used during continuous blood pressure measurement by the same method as in step S12. That is, among the pressure pulse waves detected by the optimum pressure sensor determined in the increasing process of the pressing force, for example, the maximum value Mmax and the minimum value Mmin of the pressure pulse wave having the maximum amplitude, the calculated SBP and DBP, Using the relational expressions (1) and (2), calibration data is generated and stored in the memory 15.
- control unit 12 determines the pressure sensor that has detected the pressure pulse wave having the maximum amplitude in the process of increasing the pressing force in steps S1 to S3 in FIG. 6 as the optimum pressure sensor. For this reason, after generating the calibration data, the control unit 12 does not perform the processing of steps S21 to S23, and optimizes the internal pressure of the air bag 2 at the time when the pressure pulse wave having the maximum amplitude is detected. In step S24, the internal pressure of the air bladder 2 is controlled to the optimum pressing force, and thereafter, the processing after step S25 in FIG. 12 is performed.
- step S1B The determination of step S1B is never YES, and the determination of step S7 is NO when the radial artery T is pressed in an ideal manner. For this reason, in this case, the time required for blood pressure calculation can be shortened by calculating SBP and DBP using the pressure pulse wave acquired in the process of increasing the pressing force.
- the blood pressure for calibration is calculated from the pressure pulse wave obtained in the process of increasing the pressing force, it is not necessary to determine the optimum pressure sensor and the optimum pressing force again when performing continuous blood pressure measurement. For this reason, the time until the completion of blood pressure measurement at the first beat can be shortened. In addition, power consumption can be reduced.
- step S1B when the apparatus is provided with a mode for measuring blood pressure at an arbitrary timing, when the control unit 12 determines that there is no significant change in the position of the radial artery T and the rotation of the rotation unit 5 is unnecessary ( If the determination in step S1B is never NO and step S7 is NO, the pressure sensor increases the pressing force applied to the living body part and the pressing force releasing process includes only two steps. The blood pressure measurement can be terminated. For this reason, it is possible to measure and present the blood pressure in a short time without bothering the user.
- the optimum pressure sensor and the optimum pressing force are newly determined in step S22.
- the control unit 12 determines the optimal pressure sensor and the optimal pressing force based on the pressure pulse wave detected by each of the pressure sensors 6a and 7a in the decreasing process of the pressing force started in step S9 in FIG.
- the content determined here may be set as a pressure pulse wave detection condition at the time of continuous blood pressure measurement.
- step S21 to step S23 in FIG. 12 are omitted, and the control unit 12 sets the optimum pressing force determined in the pressing force decreasing process after step S9 in step S24.
- the control unit 12 In the state where the sensor unit 6 is pressed against the radial artery T by the optimum pressing force, the control unit 12 generates the pressure pulse wave detected from the optimum pressure sensor determined in the pressing force decreasing process after step S9. Obtained in step S25.
- step S12 after the process of step S12 is completed, the process proceeds to step S21 while maintaining the rotation state of the rotating unit 5.
- step S21 As a modified example, after step S12, the rotating unit 5 is returned to the initial state, and thereafter, instead of step S21, the processes of steps S1 to S8 in FIG. 6 are performed, and then the process of step S22 is performed. May be.
- the pulse wave envelope data is obtained by detecting the pressure applied to the radial artery T by the sensor unit 6 and the pressure detected by the optimum pressure sensor in a state where the sensor unit 6 is pressed against the radial artery T by the pressing force.
- the data is associated with the amplitude of the pulse wave, the present invention is not limited to this.
- data correlating the amplitude of the pressure pulse wave detected by the optimum pressure sensor and the pressure maximum value of the pressure pulse wave may be used as the pulse wave envelope data.
- the data which matched the amplitude of the pressure pulse wave detected by the optimal pressure sensor and the pressure minimum value of the pressure pulse wave may be used as the pulse wave envelope data.
- data in which the amplitude of the pressure pulse wave detected by the optimum pressure sensor is associated with the average value of the maximum pressure value and the minimum pressure value of the pressure pulse wave may be used as the pulse wave envelope data.
- the average value of the pressure maximum value and the pressure minimum value of the pressure pulse wave is one piece of information for specifying the shape of the pressure pulse wave.
- the pulse wave envelope data specifies the amplitude value of the pressure pulse wave detected by the optimum pressure sensor in the process of changing the pressing force to the radial artery T by the pressing surface 6b and the shape of the pressure pulse wave.
- Data that associates information (for example, Mmax, Mmin, or an average thereof) excluding the amplitude value among the information to be performed may be used.
- the information on the pressure pulse wave used to generate the calibration data in step S12 of FIG. 6 are not limited to information on the pressure pulse wave having the maximum amplitude.
- a portion where the amplitude in the pulse wave envelope is more or less flat is detected, and the information on the pressure pulse wave corresponding to this portion is used to generate calibration data. Also good.
- the rotation unit 5 is configured to be rotatable about each of the rotation axis X and the rotation axis Y.
- the rotation unit 5 has one of the rotation axis X and the rotation axis Y.
- the structure which can be rotated centering may be sufficient.
- the control unit 12 omits steps S1A to S1C in the flowchart of FIG. 6, and performs step S2 after step S1. Just do it. Even with such a configuration and operation, it is possible to calculate blood pressure with high accuracy because of the processing in steps S6 to S8.
- the rotation part 5 is a structure which can rotate centering only on the rotating shaft X, it is good also as a structure which abbreviate
- Two element rows are preferable because the probability that the artery can be occluded is increased, but even with only one element row, blood pressure can be controlled by performing rotation control around the rotation axis X following the movement of the radial artery T. It is possible to improve the calculation accuracy.
- step S1A to step S1C can increase the amount of information necessary for determining the optimum pressure sensor in the subsequent pressing force reduction process, for example. Can be determined more accurately.
- the pressure pulse wave detection unit 100 is configured to form an element array including a plurality of pressure sensors 6a and an element array including a plurality of pressure sensors 7a on one pressing surface.
- line on the surface may be sufficient.
- the rotation axis Y is set between the element array composed of the plurality of pressure sensors 6 a and the element array composed of the plurality of pressure sensors 7 a, but is not limited thereto.
- the rotation axis Y may be set to the outside of the element array composed of the plurality of pressure sensors 6a and the element array composed of the plurality of pressure sensors 7a.
- FIG. 4 there may be a rotation axis Y on the left side of the element array composed of the plurality of pressure sensors 6a.
- the rotation axis Y may be on the right side of the element array including the plurality of pressure sensors 7 a.
- the rotation axis X is at a position that divides each of the two element rows in half, but this is not restrictive.
- the rotation axis X may be at an arbitrary position on each element row.
- the pressing surface 6b can rotate around the rotation axes X and Y.
- the pressure pulse wave detection unit 100A in FIG. It may be a fixed configuration.
- FIG. 14 is a flowchart for explaining an example of the operation until the generation of calibration data of the blood pressure measurement device in which the pressure pulse wave detection unit 100 is changed to the pressure pulse wave detection unit 100A.
- control unit 12 controls the air bag driving unit 11 to start injecting air into the air bag 2 to increase the pressing force on the radial artery T by the pressing surface 6b (step S1). S31).
- control unit 12 acquires the pressure pulse wave of the nth beat (n is a natural number equal to or greater than 1; the initial value is 1) detected by the pressure sensors 6a and 7a (step S32).
- the control unit 12 determines an optimum pressure sensor from among all the pressure sensors 6a and 7a based on the acquired pressure pulse wave of the nth beat (Step S33). For example, the pressure sensor that detects the pressure pulse wave having the maximum amplitude among the pressure pulse waves acquired in step S32 is determined as the optimum pressure sensor.
- the plurality of pressure sensors may be handled as the optimum pressure sensor.
- an average of the pressure pulse waves detected by each of the plurality of pressure sensors may be handled as a pressure pulse wave detected by the optimum pressure sensor.
- this pressure sensor even if there is one pressure sensor that detects the pressure pulse wave having the maximum amplitude among the pressure pulse waves acquired in step S32, this pressure sensor and the pressure in the vicinity (for example, both adjacent) of this pressure sensor. You may handle as an optimal pressure sensor including a sensor. Also in this case, for example, an average of pressure pulse waves detected by each of the plurality of pressure sensors may be handled as a pressure pulse wave detected by the optimum pressure sensor.
- control unit 12 determines the value of n, the identification ID of the determined optimum pressure sensor, the pressure pulse wave of the nth beat detected by the optimum pressure sensor, and the time when this pressure pulse wave is detected. Are stored in the memory 15 in association with each other (step S34).
- the identification ID of the pressure sensor is information for identifying the element row to which the pressure sensor belongs and the position of the pressure sensor in the element row.
- control unit 12 determines whether or not the pressing force has reached the necessary pressing force necessary for the occlusion of the radial artery T. If the pressing force has not reached the necessary pressing force (step S35: NO), n is calculated. (N + 1) is updated (step S36), and the process returns to step S32.
- step S35 If the pressing force has reached the necessary pressing force (step S35: YES), the controller 12 detects the pressure pulse wave detected by the optimum pressure sensor corresponding to each of the n beats based on the information stored in the memory 15. Is generated and pulse wave envelope data indicating the relationship between the pressure pulse wave and the internal pressure of the air bladder 2 at the time of detection of the pressure pulse wave is generated (step S37).
- control unit 12 calculates SBP and DBP from the generated pulse wave envelope data by the same method as step S11 (step S38).
- control unit 12 calculates the SBP and DBP calculated, the maximum value Mmax and the minimum value Mmin of the pressure pulse wave having the maximum amplitude in the pulse wave envelope data generated in step S37, and equations (1) and ( 2), the coefficients a and b are calculated, and the equations (1) and (2) and the coefficients a and b are generated as calibration data and stored in the memory 15 (step S39).
- control unit 12 After releasing the internal pressure of the air bladder 2 after step S39, the control unit 12 performs the processing after step S21 in FIG. 12 to calculate the second blood pressure value for each beat.
- the control unit 12 selects the optimum pressure sensor that has detected the pressure pulse wave having the maximum amplitude among the identification IDs of the optimum pressure sensors for n beats stored in the memory 15 as the optimum for continuous blood pressure measurement.
- the pressure is determined as a pressure sensor, and the pressing force at the time of detecting the pressure pulse wave detected by the optimum pressure sensor for continuous blood pressure measurement is determined as the optimum pressure for continuous blood pressure measurement.
- control unit 12 sets the pressure pulse wave detected by the optimum pressure sensor for continuous blood pressure measurement in a state where the internal pressure of the air bag 2 is set to be the optimum pressing force for continuous blood pressure measurement, in step S39. Calibration is performed using the calibration data generated in step 1, and blood pressure is measured every beat.
- the blood pressure value for generating calibration data is calculated based on the pressure pulse wave detected by the pressure sensor in the process of increasing the pressing force.
- the pulse wave envelope is based on the pressure pulse wave detected by the pressure sensor in the process of decreasing the pressing force. It is also possible to generate data and calculate a blood pressure value for generating calibration data from the pulse wave envelope data.
- the blood pressure is calculated based on the pressure pulse wave detected by the pressure sensor in the process of increasing or decreasing the pressing force.
- the blood pressure can be calculated in a short time while reducing the burden on the user.
- the pressure sensor having the maximum pulse wave amplitude is determined as the optimum pressure sensor among all the pressure sensors 6 a and 7 a at different timings in the increase or decrease process of the pressing force.
- the optimum pressure sensor changes following this movement. Therefore, it is possible to calculate blood pressure with high accuracy following the movement of the radial artery T.
- Such an effect can be realized in the pressure pulse wave detection unit 100A without using the rotation unit 5 and the biaxial rotation mechanism 5a. For this reason, a blood pressure measuring device can be made smaller.
- the pressure pulse wave detection unit 100A may have a configuration in which one of the two element arrays is deleted. Moreover, it is good also as a structure which formed two element rows in the separate press surface.
- FIG. 15 is a diagram showing a modification of the block configuration of the blood pressure measurement device shown in FIG.
- the blood pressure measurement device shown in FIG. 15 has the same configuration as that of FIG. 5 except that a height detection unit 16 and a body motion detection unit 17 are added.
- the height detection unit 16 detects the height of the living body part on which the blood pressure measurement device is mounted with respect to the reference position.
- the height detection unit 16 is configured by, for example, an acceleration sensor or an atmospheric pressure sensor, and the reference position is, for example, a position at an altitude of 0 m.
- the body movement detection unit 17 detects the movement of the living body part to which the blood pressure measurement device is attached.
- the body motion detection unit 17 detects the movement of the living body in detail by combining, for example, a triaxial acceleration sensor, a triaxial angular velocity sensor, and a triaxial geomagnetic sensor.
- the body motion detection unit 17 may use an appropriate sensor according to the motion detection accuracy.
- control unit 12 stores the following three pieces of information in the memory 15 after calculating SBP and DBP in step S11.
- the three pieces of information include the height detected by the height detector 16 during the period in which the pressure pulse wave used for generating the pulse wave envelope data generated in step S10 is detected (the pressure used for generating the calibration data).
- the body motion detecting unit 17 detects the information on the height of the device mounting part at the time of detecting the pulse wave and the pressure pulse wave used for generating the pulse wave envelope data generated in step S10. Information on the movement (the movement of the device mounting part at the time of detecting the pressure pulse wave used for generating the calibration data) and the optimum pressure pulse wave used for generating the pulse wave envelope data generated in step S10 This is the identification ID of the pressure sensor (the pressure sensor that is the output source of the pressure pulse wave used to generate the calibration data).
- FIG. 16 is a flowchart for explaining the operation (operation after generation of calibration data) at the time of continuous blood pressure measurement of the blood pressure measurement device shown in FIG.
- the control unit 12 controls the air bag drive unit 11 so that the optimal pressing force determined after step S9 in FIG. 6 is obtained, and increases the internal pressure of the air bag 2 to the optimal pressing force and holds it (step S41).
- control unit 12 determines the pressure sensor that detects the pressure pulse wave having the maximum amplitude among the pressure sensors 6a and 7a as the optimum pressure sensor (step S42).
- control unit 12 compares the identification ID of the optimum pressure sensor stored in step S11 of FIG. 6 with the identification ID of the optimum pressure sensor determined in step S42, and if both match (step S44: YES) ), The process of step S46 is performed. If the two do not match (step S44: NO), the process returns to step S42.
- step S46 when the pressure pulse wave is detected by the optimum pressure sensor, the control unit 12 acquires it.
- the control part 12 compares the height memorize
- the control unit 12 performs the process of step S48 when the two match (step S47: YES), and performs the process of step S50 when the two do not match (step S47: NO).
- step S48 the control unit 12 compares the movement information stored in step S11 of FIG. 6 with the movement information detected by the body motion detection unit 17 at the time of detection of the pressure pulse wave acquired in step S46. .
- the control unit 12 performs the process of step S49 when the two match (step S48: YES), and performs the process of step S50 when the two do not match (step S48: NO).
- the two heights coincide with each other means that the two heights are substantially the same, and the difference in height is equal to or less than a threshold value THc.
- the two movements coincide with each other means that the two movement amounts are substantially the same and the difference between the movement amounts is equal to or less than a threshold value THd.
- the threshold THc and the threshold THd may be appropriately set according to the measurement accuracy required for the blood pressure value calculated in step S49.
- step S49 the control unit 12 calibrates one pressure pulse wave acquired in step S46 using the calibration data generated in step S12 of FIG. 6, and calculates SBP and DBP.
- step S50 the control unit 12 ends the process if there is an instruction to end continuous blood pressure measurement, and returns the process to step S42 if there is no end instruction.
- the blood pressure measurement device in FIG. 15 is a calibration target only when the detection condition of the pressure pulse wave to be calibrated matches the detection condition of the pressure pulse wave used for generating calibration data.
- the pressure pulse wave is calibrated to calculate SBP and DBP.
- the pressure pulse wave detection condition used for the calibration data generation includes the above three pieces of information.
- the pressure pulse wave detection condition to be calibrated includes the identification ID of the optimum pressure sensor that detects the pressure pulse wave to be calibrated, and the device mounting site at the time when the pressure pulse wave to be calibrated is detected. It includes the height and the movement of the device mounting part when the pressure pulse wave to be calibrated is detected.
- the pressure pulse wave to be calibrated is calibrated to calculate blood pressure.
- the calibration accuracy can be increased, and the blood pressure measurement accuracy can be improved.
- three conditions pressure sensor identification ID, height, movement
- the detection conditions only need to include at least one of the three conditions.
- the height information of the device mounting part at the time of detecting the pressure pulse wave used for the calibration data generation which is one of the above conditions is the height at the time of detecting each pressure pulse wave used for the calibration data generation.
- the representative value (for example, average value) of the height detected by the detection unit 16 is used.
- the information on the movement of the device mounting part at the time of detecting the pressure pulse wave used for the calibration data generation is detected by the body motion detection unit 17 at the time of detecting each pressure pulse wave used for the calibration data generation. It is set as a representative value (for example, average value) of movement.
- the pressure pulse wave detection unit 100 of the blood pressure measurement device shown in FIG. 15 may be changed to the pressure pulse wave detection unit 100A of FIG.
- the operation up to the generation of calibration data in this case is almost the same as that shown in FIG.
- the controller 12 calculates SBP and DBP in step S38, the height detected by the height detector 16 at the time of detection of each pressure pulse wave in the pulse wave envelope data generated in step S37.
- step S37 Information on the motion detected by the body motion detector 17 at the time of detection of each pressure pulse wave in the pulse wave envelope data generated in step S37 (average motion), and step S37
- the identification ID of the optimum pressure sensor that has detected the pressure pulse wave having the maximum amplitude among the pressure pulse waves in the pulse wave envelope data generated in step S3, and the pressing force when the pressure pulse wave with the maximum amplitude is detected May be stored in the memory 15 as a pressure pulse wave detection condition used for generating calibration data.
- step S41 of FIG. 16 the control part 12 should just hold
- FIG. 17 is a flowchart showing a modified example of the operation of the blood pressure measurement device shown in FIG. 15 during continuous blood pressure measurement. In FIG. 17, the same processes as those in FIG. 17
- step S47 the controller 12 calibrates the pressure pulse wave detected by the optimum pressure sensor determined in step S42 with the calibration data, and calculates SBP and DBP (step S51).
- control unit 12 determines the difference between the height stored in step S11 of FIG. 6 or step S38 of FIG. 14 and the height detected by the height detection unit 16 at the time of detection of the pressure pulse wave acquired in step S46. Accordingly, the SBP and DBP calculated in step S51 are corrected (step S52), and then the process of step S50 is performed.
- the pressure pulse wave detected by the optimum pressure sensor is calibrated to calculate blood pressure. For this reason, if the height of the device mounting part differs between when the calibration data is generated and when the pressure pulse wave acquired in step S46 is detected, an error is included in the blood pressure after calibration due to the difference in height. there is a possibility.
- step S52 the control unit 12 determines the height of the device mounting portion when the calibration data is generated and the height of the device mounting portion when the pressure pulse wave is detected by the optimum pressure sensor during continuous blood pressure measurement.
- the blood pressure is corrected by adding or subtracting the value obtained by multiplying the difference ⁇ H by the hydraulic head pressure to SBP and DBP calculated in step S51.
- the blood pressure value obtained by calibrating this pressure pulse wave is used as the wrist at the time of calibration data generation.
- one element row may be provided in the pressure pulse wave detection unit 100.
- column was each formed in two press surfaces may be sufficient.
- the blood pressure measurement is not performed when the determination in step S44 is NO.
- the process returns to step S1 in FIG. 6, that is, calibration data generation.
- a configuration may be adopted in which the processing in steps S1 to S12 is performed again. Since the blood pressure measurement device of the present embodiment can easily generate calibration data, it is possible to perform continuous blood pressure measurement with high accuracy by performing calibration data generation again.
- step S47 when the determination of step S47 is NO or when the determination of step S47 is repeated a predetermined number of times, the process returns to step S1 of FIG. Also good.
- step S48 when the determination in step S48 is NO, or when the determination in step S48 is repeated for a predetermined number of times, the process returns to step S1 in FIG. Also good.
- the control unit 12 of this embodiment can also be provided as a program for causing a computer to execute the steps shown in FIGS. 6, 12, 14, 16, and 17.
- a program is recorded on a non-transitory recording medium in which the program can be read by a computer.
- Such “computer-readable recording medium” includes, for example, an optical medium such as a CD-ROM (Compact Disc-ROM), a magnetic recording medium such as a memory card, and the like. Such a program can also be provided by downloading via a network.
- an optical medium such as a CD-ROM (Compact Disc-ROM)
- a magnetic recording medium such as a memory card, and the like.
- Such a program can also be provided by downloading via a network.
- the disclosed blood pressure measurement device includes a pressing surface on which at least one element row composed of a plurality of pressure detection elements arranged in one direction is formed, and the one direction intersects with a direction in which an artery under the skin of a living body extends.
- a pressing part that presses the pressing surface against the artery, a pressing control part that controls the pressing force by the pressing part, and two axes that are orthogonal to the pressing direction of the pressing part and extend in the one direction
- a rotation driving unit that rotationally drives the pressing surface around at least one of an axis and a second axis that is orthogonal to the one direction;
- a rotation control unit that controls the rotation of the pressing surface by the rotation driving unit based on the pressure pulse wave detected by the row, and a process in which the pressing force increases or a process in which the pressing force increases.
- Push The control of the control unit in which and a blood pressure calculation unit calculating a blood pressure value in the artery based on the pressure pulse wave pressure is detected step decreases, in the said
- the blood pressure calculation unit generates a pressure pulse wave detected by the element array in a process in which the pressing force is reduced by the control of the pressing control unit after the process in which the pressing force is increased. Based on this, the blood pressure value in the artery is calculated.
- the rotation control unit uses data indicating a relationship between a pressure pulse wave detected by the element array at the plurality of timings and the pressing force when the pressure pulse wave is detected.
- the amount of movement of the artery in the one direction in the process of increasing the pressing force is calculated, and the direction of rotation and the amount of rotation around the second axis of the pressing surface are controlled according to the amount of movement. .
- the blood pressure calculation unit detects the pressure pulse wave detected by the element array in the process of increasing the pressing force. Based on the above, the blood pressure value in the artery is calculated.
- a blood pressure measurement device capable of measuring blood pressure in a short time without causing trouble for the user.
Abstract
血圧測定装置は、一方向に並ぶ複数の圧力センサ6a,7aからなる素子列が形成された押圧面6bと、一方向が橈骨動脈Tの伸びる方向と交差する状態で押圧面6bを橈骨動脈Tを含む生体部位に押圧するための空気袋2と、空気袋2による押圧力を制御する空気袋駆動部11と、空気袋2による押圧方向に直交する軸Xと軸Yの少なくとも一方を中心に押圧面6bを回転駆動する回転駆動部10と、押圧力が増加する過程で圧力センサ6a,7aにより検出された圧脈波に基づいて押圧面6bの回転制御を行い、回転制御後に、押圧力が減少する過程で圧力センサ6a,7aにより検出される圧脈波に基づいて橈骨動脈T内の血圧値を算出する制御部12と、を備える。
Description
本発明は、血圧測定装置に関する。
手首の橈骨動脈等の動脈が通る生体部位に圧力センサを直接接触させた状態で、この圧力センサにより検出される情報を用いて脈拍や血圧等の生体情報を測定することのできる生体情報測定装置が知られている(例えば特許文献1~5参照)。
特許文献1に記載の血圧測定装置は、圧力センサを接触させる生体部位とは別の部位において、カフを用いて血圧値を算出し、算出した血圧値から校正データを生成する。そして、圧力センサにより検出される圧脈波をこの校正データを用いて校正することで、1拍毎に血圧値を算出している。
特許文献2,3,4には、カフを用いることなく、手首に接触させる圧力センサにより検出される情報のみで1拍毎に血圧を測定する血圧測定装置が記載されている。
特許文献5には、動脈の伸びる方向に並ぶ複数の圧力センサ列が形成された押圧面を動脈に押圧して脈波を検出する脈波検出装置が記載されている。この脈波検出装置は、所定圧力で押圧面を動脈に押圧した状態で、この複数の圧力センサ列から得られる圧脈波の比較により、押圧面と動脈とが平行になっているかを判定する。そして、押圧面と動脈が平行になっていない場合には、押圧面を動脈の伸びる方向に傾斜させることで、押圧面と動脈とを平行にする姿勢制御を行っている。
特許文献2,3,4のように、生体に接触させる圧力センサにより検出される情報のみで血圧を測定できることで、装置の小型化が可能になる。特許文献2,3に記載の装置は、圧力センサを最適押圧力で押圧した状態で、圧力センサにより検出される圧脈波を校正又は補正することで血圧を算出するものである。
この最適押圧力を決めるためには、圧力センサの押圧力を連続的に変化させる工程が必要であるため、この工程が終了し、圧力センサの押圧力が最適押圧力に制御された状態で初めて血圧算出が可能になる。
このため、装置は、圧力センサの生体部位への圧迫、圧迫の解除、圧力センサの押圧力が最適押圧力になるように圧力センサを圧迫、といった工程を行う必要があり、これらの工程の繰り返しが利用者にとっては煩わしい。
一方、特許文献4に記載の装置は、圧力センサの押圧力を連続的に変化させる工程で検出される圧脈波振幅の変化に基づいて血圧値を算出することができる。このため、利用者に煩わしい思いをさせることなく、短時間で血圧を測定することが可能である。
しかしながら、圧力センサの押圧力を連続的に変化させていく過程では、押圧されている動脈の位置が変動することが考えられる。このような変動があると、特許文献4に記載の方法では、血圧を精度よく測定できない可能性がある。なお、特許文献4に記載の装置は、1拍毎に血圧を測定する装置であるが、これに限らず、圧力センサを局所的に押圧しながら血圧を測定する場合であれば、同様の課題が生じる。
特許文献5に記載の装置は、押圧面を所定圧力で動脈に押圧した状態で各圧力センサ列から出力される圧脈波の比較により押圧面の姿勢制御を行うものであり、押圧面の動脈への押圧力が変化していく過程での押圧面と動脈との相対位置関係を考慮して姿勢制御を行っているものではない。
本発明は、上記事情に鑑みてなされたものであり、利用者に煩わしい思いをさせることなく、短時間で高精度に血圧を測定することのできる血圧測定装置を提供することを目的とする。
本発明の血圧測定装置は、一方向に並ぶ複数の圧力検出素子からなる少なくとも1つの素子列が形成された押圧面と、前記一方向が生体の皮膚下の動脈の伸びる方向と交差する状態で前記動脈に前記押圧面を押圧する押圧部と、前記押圧部による押圧力を制御する押圧制御部と、前記押圧部の押圧方向に直交する2つの軸であって前記一方向に伸びる第一の軸と前記一方向と直交する第二の軸の少なくとも一方の周りに前記押圧面を回転駆動する回転駆動部と、前記押圧制御部の制御によって前記押圧力が増加する過程の複数タイミングにおいて前記素子列により検出された圧脈波に基づいて、前記回転駆動部による前記押圧面の回転を制御する回転制御部と、前記押圧力が増加する過程、又は、前記押圧力が増加する過程の後の前記押圧制御部の制御によって前記押圧力が減少する過程、で前記素子列により検出される圧脈波に基づいて前記動脈内の血圧値を算出する血圧算出部と、を備えるものである。
本発明によれば、利用者に煩わしい思いをさせることなく、短時間で血圧を測定することのできる血圧測定装置を提供することができる。
以下、本発明の実施形態について図面を参照して説明する。
図1は、本発明の一実施形態を説明するための血圧測定装置の圧脈波検出部100の構成を示す外観図である。本実施形態の血圧測定装置は、図示しないベルトにより、血圧測定対象となる動脈(図1の例では橈骨動脈T)が内部に存在する生体部位(図1の例では利用者の手首)に装着可能である。
図2は、図1に示す圧脈波検出部100の拡大図である。図3は、図1に示す装着状態での圧脈波検出部100を利用者の指先側から見た図である。図4は、図1に示す装着状態での圧脈波検出部100を手首との接触部位側から見た図である。図1~図4は、圧脈波検出部100を模式的に示したものであり、各部の寸法や配置等を限定するものではない。
圧脈波検出部100は、空気袋2を内蔵する筐体1と、空気袋2に固定された平面状の部材である平板部3と、平板部3に対して2軸回転機構5aにより2つの軸の各々を中心に回転可能に支持された回動部5と、回動部5の平板部3側とは反対側の平面に設けられたセンサ部6とを備える。
空気袋2は、図1に示すように、血圧測定装置が手首に装着された状態で、センサ部6の押圧面6bを生体部位(手首)の皮膚下の動脈に対して押圧する押圧部として機能する。押圧部は、センサ部6の押圧面6bを動脈に対して押圧できる機構であれば何でもよく、空気袋を用いたものには限定されない。
空気袋2は、図示しないポンプにより、内部の空気量が制御されることで、空気袋2に固定された平板部3を平板部3の表面(回動部5側の平面)に垂直な方向に移動させる。
図1に示す装着状態では、圧脈波検出部100に含まれるセンサ部6の押圧面6bが利用者の手首の皮膚に接触する。この状態で空気袋2に注入される空気量が増えることで、空気袋2の内圧が増加し、センサ部6は手首下の橈骨動脈Tに向けて押圧される。以下、センサ部6による橈骨動脈Tへの押圧力は、空気袋2の内圧と等価であるとして説明する。
図4に示すように、押圧面6bには、図1に示す装着状態において、装着部位に存在する橈骨動脈Tの伸びる方向Aと交差(図1の例では直交)する方向B(一方向)に並ぶ複数個の圧力検出素子としての圧力センサ6aが形成されている。また、押圧面6bには、方向Bに並ぶ複数個の圧力センサ7aが形成されている。各圧力センサ6aと、この圧力センサ6aと方向Bでの位置が同じ圧力センサ7aとがペアを構成し、押圧面6bには、このペアが方向Bに複数配列された構成となっている。圧脈波検出部100に含まれる圧力センサ(複数個の圧力センサ6aと複数個の圧力センサ7a)は圧力検出部を構成する。
押圧面6bは、単結晶シリコン等から成る半導体基板の表面であり、圧力センサ6a,7aは、この半導体基板表面に形成された感圧ダイオード等で構成される。
圧力センサ6a(7a)は、その配列方向が橈骨動脈Tと交差(略直交)するように橈骨動脈Tに対して押圧されることにより、橈骨動脈Tから発生して皮膚に伝達される圧力振動波、すなわち圧脈波を検出する。
各圧力センサ6a(7a)の配列方向の間隔は、橈骨動脈T上に必要かつ充分な数が配置されるように充分小さくされている。各圧力センサ6a(7a)の配列長さは、橈骨動脈Tの径寸法より必要かつ充分に大きくされている。
図4に示すように、2軸回転機構5aは、空気袋2による平板部3の押圧方向に直交する2つの回転軸X,Yの各々を中心に回動部5を回転させるための機構である。
2軸回転機構5aは、平板部3の表面上に設定された互いに直交する2つの回転軸X,Yを有し、回転軸X,Yは、それぞれ、後述する回転駆動部10によって回転駆動される。
回転軸Yは、押圧面6bに形成された複数の圧力センサ6a(7a)の配列方向に伸びる第一の軸である。回転軸Yは、図4の平面視において、複数の圧力センサ6aからなる素子列と、複数の圧力センサ7aからなる素子列との間(図4の例では中間)に設定されている。
回転軸Xは、押圧面6bに形成された複数の圧力センサ6a(7a)の配列方向と直交する方向に伸びる第二の軸である。回転軸Xは、図4の例では、複数の圧力センサ6aからなる素子列と複数の圧力センサ7aからなる素子列をそれぞれ均等に2分割する直線上に設定されている。
回動部5が回転軸Xを中心に回転することで、押圧面6bは、回転軸Xの軸周りに回転する。また、回動部5が回転軸Yを中心に回転することで、押圧面6bは、回転軸Yの軸周りに回転する。
図5は、血圧測定装置の圧脈波検出部100以外の部分のブロック構成を示す図である。
血圧測定装置は、圧脈波検出部100と、回転駆動部10と、空気袋駆動部11と、装置全体を統括制御する制御部12と、表示部13と、操作部14と、メモリ15と、を備える。
回転駆動部10は、圧脈波検出部100の2軸回転機構5aの各回転軸X,Yに接続されたアクチュエータである。回転駆動部10は、制御部12の指示にしたがい各回転軸X,Yを回転駆動して、押圧面6bを回転軸Xの軸周りに回転させたり、押圧面6bを回転軸Yの軸周りに回転させたりする。
空気袋駆動部11は、制御部12の指示のもと、空気袋2に注入する空気量(空気袋2の内圧)を制御する。
表示部13は、測定された血圧値等の各種情報を表示するためのものであり、例えば液晶等により構成される。
操作部14は、制御部12に対する指示信号を入力するためのインターフェースであり、血圧測定を含む各種動作の開始を指示するためのボタン等により構成される。
メモリ15は、制御部12に所定の動作をさせるためのプログラムやデータを記憶するROM(Read Only Memory)、ワークメモリとしてのRAM(Random Access Memory)、及び、測定した血圧データ等の各種情報を記憶するフラッシュメモリ等を含む。
制御部12は、メモリ15のROMに記憶されたプログラムを実行することにより、押圧制御部、第一の血圧算出部、回転制御部、第二の血圧算出部、校正用データ生成部、判定部、及び処理部として機能する。
押圧制御部は、空気袋駆動部11を制御して空気袋2内の空気量を調整することで、押圧面6bによる手首への押圧力を制御する。
第一の血圧算出部は、押圧面6bを橈骨動脈Tに押圧した状態で、押圧面6bに形成された圧力センサ6a,7aにより検出される圧脈波に基づいて、橈骨動脈T内の第一の血圧値を算出する。
具体的には、第一の血圧算出部は、空気袋駆動部11によって橈骨動脈Tへの押圧力が変化(増加又は減少)させられていく過程で圧力センサ6a,7aにより検出される圧脈波に基づいて、橈骨動脈T内の第一の血圧値を算出する。
校正データ生成部は、第一の血圧算出部により算出された第一の血圧値を用いて校正用データを生成する。
回転制御部は、空気袋駆動部11によって橈骨動脈Tへの押圧力が増加させられていく過程で圧力センサ6a,7aにより検出された圧脈波に基づいて、回転駆動部10による押圧面6bの回転の要否を判定する。そして、回転制御部は、回転が必要と判定したときに、回転駆動部10に押圧面6bを回転させる。
第二の血圧算出部は、橈骨動脈Tの一部を平坦に変形させるための最適押圧力で押圧面6bが橈骨動脈Tに押圧された状態で、圧力センサ6a,7aにより1拍毎に検出される圧脈波を校正用データによって校正することで、橈骨動脈T内の第二の血圧値を算出する。
判定部は、校正用データによる校正対象となる圧脈波の検出条件と、校正用データの生成に用いた圧脈波の検出条件とが一致するか否かを判定する。
処理部は、判定部による判定結果に応じた処理を行う。
以下、本実施形態の血圧測定装置の動作について説明する。本実施形態の血圧測定装置は、1拍毎に血圧値(SBP(Systolic Blood pressure)、いわゆる最高血圧と、DBP(Diastolic Blood pressure)、いわゆる最低血圧を測定して表示部13に表示する連続血圧測定モードを有する。
図6は、本実施形態の血圧測定装置の連続血圧測定モードにおける校正用データ生成までの動作を説明するためのフローチャートである。
なお、圧脈波検出部100の回動部5は、血圧測定指示がなされる前の初期状態では、回転量が例えばゼロに設定され、押圧面6bが平板部3と平行になっているものとする。
ここでは、回転量をゼロとした状態を初期状態とするが、これに限らない。例えば、血圧測定装置が手首に装着された状態で、その手首の形状に応じて、押圧面6bが皮膚に均等に接触するように、回転駆動部10が押圧面6bを回転させた状態を初期状態としてもよい。
血圧測定指示があると、制御部12は、空気袋駆動部11を制御して空気袋2への空気の注入を開始し、押圧面6bによる橈骨動脈Tへの押圧力を増加させる(ステップS1)。
押圧力の増加過程において、制御部12は、橈骨動脈Tの閉塞が開始されるのに十分な時間が経過した後の任意のタイミング(例えば周期的なタイミング)で、それまでに各圧力センサ6aにより検出されてメモリ15に記憶された圧脈波(圧脈波情報I1とする)のうち、検出時刻が新しい順に複数の圧脈波情報I1を取得する。また、制御部12は、上記任意のタイミングで、それまでに各圧力センサ7aにより検出されてメモリ15に記憶された圧脈波(圧脈波情報I2とする)のうち、検出時刻が新しい順に複数の圧脈波情報I2を取得する(ステップS1A)。
制御部12は、ステップS1Aで取得した複数の圧脈波情報I1のうち、時刻t1に検出された各圧力センサ6aの圧脈波の例えば振幅の平均値Ave1を算出し、時刻t1よりも後の時刻t2に検出された各圧力センサ6aの圧脈波の振幅の平均値Ave2を算出する。また、制御部12は、ステップS1Aで取得した複数の圧脈波情報I2のうち、時刻t1に検出された各圧力センサ7aの圧脈波の振幅の平均値Ave3を算出し、時刻t2に検出された各圧力センサ7aの圧脈波の振幅の平均値Ave4を算出する。そして、制御部12は、同じ時刻に対して算出した平均値の比((Ave1/Ave3)と(Ave2/Ave4))を算出する。
制御部12は、複数のタイミングについて算出した比の変化に基づいて、回転駆動部10による回動部5の回転を行うべきか否かを判定する。つまり、制御部12は、押圧力の増加過程における複数タイミングで圧力センサ6a,7aにより検出された圧脈波に基づいて、回動部5を回転させるか否かを判定する(ステップS1B)。
例えば、複数のタイミングについて算出した比が単調増加している場合には、圧力センサ7aからなる素子列は橈骨動脈Tを閉塞する方向に向かっているが、圧力センサ6aからなる素子列は橈骨動脈Tを閉塞する方向に向かっていないと判定できる。このため、制御部12は、回動部5の回転は必要と判定する。
また、複数のタイミングについて算出した比が単調減少している場合には、圧力センサ6aからなる素子列は橈骨動脈Tを閉塞する方向に向かっているが、圧力センサ7aからなる素子列は橈骨動脈Tを閉塞する方向に向かっていないと判定できる。このため、制御部12は、回動部5の回転は必要と判定する。
また、複数のタイミングについて算出した比がほとんど変化していない場合には、2つの素子列が同じように橈骨動脈Tの圧脈波を検出していると判定できる。このため、制御部12は、回動部5の回転は不要と判定する。
また、複数のタイミングについて算出した比が増減を繰り返している場合には、2つの素子列が橈骨動脈Tを十分に押圧できているか、一方の素子列だけが橈骨動脈Tを十分に押圧できていないのかの判定ができない。このため、制御部12は、回動部5の回転は不要と判定する。
このように、制御部12は、複数のタイミングについて算出した比の変動に基づいて回転の要否を判定する。なお、この比の代わりに、平均値Ave1(Ave2)と平均値Ave3(Ave4)の差分(符号を考慮した値)を用いてもよい。
図7(a)は、圧力センサ7aからなる素子列によって橈骨動脈Tが閉塞されているが、圧力センサ6aからなる素子列によっては橈骨動脈Tが閉塞されていない状態の例を示す図である。図7(a)の状態では、圧力センサ6aからなる素子列と橈骨動脈Tの距離が、圧力センサ7aからなる素子列と橈骨動脈Tの距離よりも大きくなっている。
各圧力センサ6aにより検出された圧脈波の振幅平均値を6Aとし、各圧力センサ7aにより検出された圧脈波の振幅平均値を7Aとすると、図7の状態では、6Aと7Aの比である(6A/7A)は1よりも十分に大きくなる。この状態では、圧力センサ6aからなる素子列を橈骨動脈Tに近づければ、(6A/7A)は1に近づく。
そこで、制御部12は、ステップS1Bにおいて回動部5の回転軸Y周りの回転が必要と判定したときは、最新時刻における(6A/7A)の値に応じて回動部5の回転軸Y周りの回転制御を行う(ステップS1C)。
具体的には、制御部12は、(6A/7A)の値と回動部5の回転量との関係を示すデータテーブル(製品出荷前に実験的に求めてメモリ15に記憶しておく)を参照し、(6A/7A)の値に対応する回転量を読みだして、読みだした回転量を設定する。
また、制御部12は、平均値6Aと平均値7Aのどちらが大きいかを判定し、平均値6Aが大きい場合には、圧力センサ6aからなる素子列と橈骨動脈Tとの距離を縮めるべく、回転軸Y周りの回動部5の回転方向を図7において反時計回りに設定する。
制御部12は、平均値7Aが大きい場合には、圧力センサ7aからなる素子列と橈骨動脈Tとの距離を縮めるべく、回転軸Y周りの回動部5の回転方向を図7において時計回りに設定する。
制御部12は、このようにして設定した回転方向及び回転量によって回動部5を回転させる。これにより、図7(b)のように、押圧面6bと橈骨動脈Tとを平行にすることができ、2つの素子列の各々によって橈骨動脈Tを閉塞した状態を得ることができる。
制御部12は、ステップS1Cの後と、ステップS1Bにおいて回動部5の回転が不要と判定したときは、ステップS2に処理を移行する。ステップS2において、制御部12は、橈骨動脈Tが閉塞されるのに十分な圧力(必要押圧力)に押圧力が到達したか否かを判定する。制御部12は、押圧力が必要押圧力に到達した場合(ステップS2:YES)に、空気袋駆動部11を制御して空気袋2への空気の注入を停止させる(ステップS3)。制御部12は、押圧力が必要押圧力に達していない場合はステップS1Aに処理を戻す。
ステップS3の後、制御部12は、ステップS1~ステップS3の間において各圧力センサ6aにより同時刻に検出された圧脈波の振幅と、その各圧力センサ6aの押圧面6b上における位置との関係を示す振幅分布曲線、いわゆるトノグラムを求める。また、制御部12は、各圧力センサ7aにより同時刻に検出された圧脈波の振幅と、その各圧力センサ7aの押圧面6b上における位置との関係を示すトノグラムを求める。
制御部12は、圧力センサ6aからなる素子列に対して生成したトノグラムを、この素子列の識別情報、圧脈波の検出時刻、及びこの検出時刻における空気袋2による押圧方向への押圧力(空気袋2の内圧)と対応付けてメモリ15に記憶する。
同様に、制御部12は、圧力センサ7aからなる素子列に対して生成したトノグラムを、この素子列の識別情報、圧脈波の検出時刻、及びこの検出時刻における空気袋2による押圧方向への押圧力と対応付けてメモリ15に記憶する。
そして、制御部12は、メモリ15に記憶したトノグラムのデータを用いて、押圧面6bの手首への押圧中における橈骨動脈Tの方向Bへの移動量を算出する(ステップS6)。
図8(a),(b)は、センサ部6による手首への押圧力を変化させていったときに、センサ部6の各圧力センサ6aにより検出される圧脈波の振幅値の一例を示した図である。図8(a),(b)において、横軸は各圧力センサ6aの方向Bでの位置を示し、縦軸は押圧力を示す。
図8(a),(b)では、各位置にある圧力センサ6aにより検出された圧脈波の振幅を、その大きさによって色分けしている。
符号A1は、振幅が閾値TH1以上となっている部分である。符号A2は、振幅が閾値TH2以上閾値TH1未満となっている部分である。符号A3は、振幅が閾値TH3以上閾値TH2未満となっている部分である。符号A4は、振幅が閾値TH4以上閾値TH3未満となっている部分である。符号A5は、振幅が閾値TH4未満となっている部分である。なお、閾値TH1>閾値TH2>閾値TH3>閾値TH4である。
図8(a)は、押圧力が増加していく過程で、閾値TH1以上の振幅の圧脈波を検出している圧力センサ6aの位置がほぼ変化しない例を示している。これに対し、図8(b)は、押圧力が増加していく過程で、閾値TH1以上の振幅の圧脈波を検出している圧力センサ6aの位置が左にずれていく例を示している。
図9は、圧脈波検出部100を手首に当てて、空気袋2によりセンサ部6を手首に向けて押圧していく状態を示す図である。図9において、符号TBは橈骨を示し、符号Kは腱を示す。
図9(a)に示すようにセンサ部6を手首に押圧していくと、図9(b)に示すように、橈骨動脈Tが方向Bに移動してしまうことがある。
図9(b)のように、押圧中に橈骨動脈Tが方向Bに移動してしまうと、押圧中の圧脈波の振幅値の分布は図8(b)のようになる。つまり、閾値TH1以上の振幅値が初めて検出された押圧力における当該振幅値を検出した圧力センサ6aの位置と、閾値TH1以上の振幅値が最後に検出された押圧力における当該振幅値を検出した圧力センサ6aの位置とには大きなずれが生じることになる。
図8(a)の例では、閾値TH1以上の振幅値が初めて検出された押圧力における当該振幅値を検出した圧力センサ6aの位置と、閾値TH1以上の振幅値が最後に検出された押圧力における当該振幅値を検出した圧力センサ6aの位置とには大きなずれは生じていない。つまり、押圧力を増加させていく過程において、橈骨動脈Tが方向Bにほぼ移動することなく閉塞されていっていることが分かる。
このように、押圧力が変化する過程におけるトノグラムの変化をみることで、橈骨動脈Tについて、方向Bでの位置変化を検出することができる。図9(b)に示す状態のまま、押圧力を増加させて橈骨動脈Tを閉塞すると、腱K等の生体組織の影響を受けて、正確なトノグラムを取得できない可能性が生じる。
そこで、制御部12は、押圧力とトノグラムの関係を示す図8のデータから、閾値TH1以上の振幅値が初めて検出された押圧力における当該振幅値を検出した圧力センサ6aの位置と、閾値TH1以上の振幅値が最後に検出された押圧力における当該振幅値を検出した圧力センサ6aの位置との差(つまり橈骨動脈Tの方向Bへの移動量)をステップS6にて算出し、算出した差が閾値THa以上か否かを判定する(ステップS7)。
2つの位置の差が閾値THa以上であれば(ステップS7:YES)、制御部12は、ステップS8において図8(b)の矢印で示したベクトルを求める。2つの位置の差が閾値THa未満であれば(ステップS7:NO)、ステップS9の処理が行われる。
メモリ15には、図8に示したベクトルの向き及び大きさと、回動部5を回転軸X周りにどの方向にどの程度回転させるべきかを示す情報とを、予め実験的に求めて対応付けて記憶しておく。
そして、制御部12は、求めたベクトルの大きさ及び向きに対応する回転方向及び回転量の情報をメモリ15から取得し、取得した情報を回転駆動部10に送信する。そして、回転駆動部10は、受信した情報にしたがって、図9(c)に示したように回動部5を回転させる(ステップS8)。
以上のように、血圧測定指示があると、制御部12は、空気袋2による押圧力の増加過程における複数タイミングで各圧力センサ6a,7aにより検出された圧脈波に基づいて、回動部5を回転させる必要があるか否かをステップS1B及びステップS7にて判定する。そして、制御部12は、回動部5を回転させる必要がある場合(ステップS1B:YES,ステップS7:YES)には、各圧力センサ6a,7aにより検出された圧脈波に基づいて、回動部5を回転させる。
ステップS8に続くステップS9では、制御部12が、空気袋駆動部11を制御して、空気袋2内の空気を排出させ、橈骨動脈Tへの押圧力の減少を開始する。
制御部12は、ステップS9で押圧力の減少を開始し、押圧力を最小値まで減少させた後、全ての圧力センサ6a,7aの中から最適圧力センサを決定する。制御部12は、例えば、押圧力の減少過程において最大振幅の圧脈波を検出した圧力センサを最適圧力センサとして決定する。
橈骨動脈Tが平坦になった部分の真上に位置する圧力センサによって検出される圧脈波は、橈骨動脈Tの壁の張力の影響がなく、最も振幅が大きくなる。また、この圧脈波は橈骨動脈T内の血圧値との相関が最も高い。このような理由により、最大振幅の圧脈波を検出した圧力センサを最適圧力センサとして決定する。
なお、最大振幅の圧脈波を検出した圧力センサが複数ある場合もあり、その場合には、この複数の圧力センサを最適圧力センサとして扱い、この複数の圧力センサの各々で検出された圧脈波の例えば平均を、この最適圧力センサにより検出される圧脈波として扱えばよい。
そして、制御部12は、押圧力の減少過程でその最適圧力センサにより検出された圧脈波から脈波包絡線データを生成する(ステップS10)。
脈波包絡線データとは、センサ部6による橈骨動脈Tへの押圧力(空気袋2の内圧)と、その押圧力で最適圧力センサが橈骨動脈Tに押圧された状態で最適圧力センサにより検出される圧脈波の振幅とを対応付けたデータである。
図10は、橈骨動脈Tへの押圧力の変化と、最適圧力センサにより検出される圧脈波の変化の一例を示した図である。図10において、符号Pで示す直線が押圧力を示し、符号Mで示す波形が圧脈波を示している。図10の下段には、1つの圧脈波の拡大図を図示している。
図10に示したように、圧脈波において、立ち上がり点での圧力を最小値Mminといい、立ち下がり点での圧力を最大値Mmaxという。圧脈波の振幅は、最大値Mmaxから最小値Mminを引いた値を言う。最大値Mmaxと最小値Mminは、それぞれ、圧脈波の形状を特定する情報の1つである。
図10に示したように、押圧力が減少を開始して橈骨動脈Tの閉塞状態が解除されると、最適圧力センサにより検出される圧脈波は振幅が急激に大きくなり、その後、押圧力の減少に伴って図に示したように変化していく。制御部12は、ステップS10において、図10に示す押圧力と圧脈波の関係から、図11に示すような脈波包絡線データを生成する。
制御部12は、図11に示す脈波包絡線データを生成すると、生成した脈波包絡線データからSBPとDBPを算出する(ステップS11)。
例えば、制御部12は、図11に示す脈波包絡線において、押圧力が減少を開始してから圧脈波振幅が急激に上昇を開始したときの押圧力、すなわち、押圧力が減少を開始してから最適圧力センサにより検出される圧脈波振幅が動脈閉塞状態ではなくなったと判断できる閾値THbを初めて超えた時点での押圧力をSBPとして決定する。または、制御部12は、脈波包絡線データにおいて隣接する2つの振幅値の差分を算出し、この差分が閾値を超えた時点での押圧力をSBPとして決定する。
更に、制御部12は、図11に示す脈波包絡線において、圧脈波振幅の最大値を脈圧(PP)とし、求めたSBP及びPPと、SBP-DBP=PPの関係式により、DBPを算出する。
ステップS11の後、制御部12は、ステップS9の減圧過程で決定した最適圧力センサにより検出された各圧脈波のいずれか(例えば、最大振幅となった圧脈波)の最大値Mmax及び最小値Mminと、ステップS11で算出したSBP及びDBPと、を用いて、後述する連続血圧測定時に用いる校正用データを生成してメモリ15に記憶する(ステップS12)。
aを一次関数の傾き、bを一次関数の切片とすると、
SBP=a×Mmax+b ・・・(1)
DBP=a×Mmin+b ・・・(2)
の関係が成り立つ。
SBP=a×Mmax+b ・・・(1)
DBP=a×Mmin+b ・・・(2)
の関係が成り立つ。
制御部12は、式(1)と式(2)に、ステップS11で求めたSBP及びDBPと、図11の脈波包絡線における振幅が最大となった圧脈波の最大値Mmax及び最小値Mminとを代入して、傾きaと切片bを算出する。そして、算出した係数a,bと、式(1),(2)とを校正用データとしてメモリ15に記憶する。
図12は、本実施形態の血圧測定装置の連続血圧測定モードにおける連続血圧測定動作を説明するためのフローチャートである。
図6に示したフローで校正用データを生成した後、制御部12は、空気袋駆動部11を制御し、空気袋2の内圧を上昇させて、押圧面6bによる橈骨動脈Tへの押圧力を増加させる(ステップS21)。
次に、制御部12は、各圧力センサ6a,7aのうち、押圧力の増加過程において最大振幅の圧脈波を検出した圧力センサを最適圧力センサとして決定する。また、制御部12は、この最大振幅の圧脈波が検出された時点での空気袋2の内圧を最適押圧力として決定する(ステップS22)。
次に、制御部12は、空気袋2の内圧を解放して初期状態に戻し(ステップS23)、その後、空気袋2の内圧をステップS22で決定した最適押圧力まで上昇させて、この最適押圧力を保持する(ステップS24)。
次に、制御部12は、最適押圧力で押圧面6bが橈骨動脈Tに押圧された状態で、ステップS22で決定した最適圧力センサにより検出される圧脈波を取得する(ステップS25)。
そして、制御部12は、取得した1つの圧脈波を、図6のステップS12で生成した校正用データを用いて校正して、SBPとDBPを算出する(ステップS26)。
具体的には、制御部12は、ステップS25で取得した圧脈波の最大値Mmaxと、ステップS12で算出した係数a,bを上述した式(1)に代入してSBPを算出し、ステップS25で取得した圧脈波の圧力最小値Mminと、ステップS12で算出した係数a,bを上述した式(2)に代入してDBPを算出する。制御部12は、算出されたSBPとDBPを例えば表示部13に表示させて利用者に通知する。
制御部12は、連続血圧測定の終了指示があれば(ステップS27:YES)処理を終了し、終了指示がなければ(ステップS27:NO)、ステップS25に処理を戻す。
以上のように、制御部12は、押圧力の減少過程においてセンサ部6により検出される圧脈波に基づいて算出した第一の血圧値を用いて校正用データを生成する。つまり、制御部12は、最適押圧力でセンサ部6を押圧保持している状態で検出される圧脈波とは無関係に、押圧力を変化させる過程で得た圧脈波を主体にして血圧を算出することができる。このため、空気袋2の内圧増加、空気袋2の内圧解放、及び空気袋2の内圧を最適圧力まで増加、といった3つの工程を経ることなく血圧算出が可能である。
本実施形態の血圧測定装置は、任意のタイミングで血圧を測定して利用者に提示するモードを設けることもできる。このモードに設定されたときには、制御部12が図6のステップS1~ステップS11までの処理を行うことで、利用者に煩わしい思いをさせることなく、短時間で血圧を測定して提示することが可能となる。
また、本実施形態の血圧測定装置によれば、圧力センサにより検出される圧脈波を校正するためのデータ生成を、手首に装着可能なほどに小型化された装置だけで行うことができる。このため、複数の利用者で血圧測定装置を共用する場合でも、利用者毎の校正用データの生成が容易となる。したがって、複数の利用者で装置を共用する場合でも各利用者が簡単に装置の利用を開始することができる。
なお、図6のフローチャートにおいてステップS1Bの判定が一度もYESにならず、かつ、ステップS7の判定がNOになったとき、すなわち、押圧力の増加過程及びこの増加過程の終了後に、回動部5の回転が行われなかった場合には、制御部12が以下の動作を行う構成としてもよい。
制御部12は、ステップS1~ステップS3の押圧力の増加過程で各圧力センサ6a,7aにより検出された圧脈波に基づき、圧力センサ6a,7aの中から最適圧力センサ(例えば最大振幅の圧脈波を検出した圧力センサ)を決定する。そして、制御部12は、押圧力の増加過程でその最適圧力センサにより検出された圧脈波から脈波包絡線データを生成する。制御部12は、この生成した脈波包絡線データからSBPとDBPを算出する。
例えば、制御部12は、脈波包絡線において、押圧力が増加を開始してから圧脈波振幅が急激に減少を開始したときの押圧力、すなわち、押圧力が増加を開始してから最適圧力センサにより検出される圧脈波振幅が閾値THb以下になった時点での押圧力をSBPとして決定する。DBPの算出方法はステップS11と同様である。
DBP算出後、制御部12は、ステップS12と同様の方法で、連続血圧測定時に用いる校正用データを生成すればよい。すなわち、押圧力の増加過程で決定した最適圧力センサにより検出された圧脈波のうち、例えば振幅が最大となった圧脈波の最大値Mmax及び最小値Mminと、算出したSBP及びDBPと、関係式(1),(2)とを用いて、校正用データを生成し、メモリ15に記憶する。
この場合、制御部12は、図6のステップS1~ステップS3における押圧力の増加過程で、最大振幅の圧脈波を検出した圧力センサを最適圧力センサとして決定している。このため、制御部12は、校正用データを生成した後は、ステップS21~ステップS23の処理は行わずに、この最大振幅の圧脈波が検出された時点での空気袋2の内圧を最適押圧力として決定し、ステップS24において空気袋2の内圧を最適押圧力に制御し、その後は、図12のステップS25以降の処理を行う。
このように、橈骨動脈Tの押圧力を増加させていく過程で検出された圧脈波から脈波包絡線データを生成し、この脈波包絡線データからSBPとDBPを算出することも可能である。
ステップS1Bの判定が一度もYESにならず、かつ、ステップS7の判定がNOになるのは、橈骨動脈Tの押圧が理想に近い形で行われている場合に相当する。このため、この場合には、押圧力の増加過程で取得済みの圧脈波を用いてSBPとDBPを算出することで、血圧算出に要する時間を短縮することができる。
また、押圧力の増加過程で得た圧脈波から校正用の血圧を算出した場合には、連続血圧測定を行う場合に改めて最適圧力センサと最適押圧力を決める必要がない。このため、1拍目の血圧測定完了までの時間を短縮することができる。また、消費電力を削減することもできる。
また、上述したように、任意のタイミングで血圧測定を行うモードを装置に設ける場合、橈骨動脈Tの位置に大きな変化がなく、回動部5の回転が不要と制御部12が判定した場合(ステップS1Bの判定が一度もNOにならず、かつ、ステップS7:NOの場合)には、圧力センサの生体部位への押圧力の増加工程と、押圧力の解放工程との2つの工程だけで血圧測定を終了させることができる。このため、利用者に煩わしい思いをさせることなく、短時間で血圧を測定して提示することが可能になる。
図12のフローチャートでは、ステップS22において改めて最適圧力センサと最適押圧力の決定を行っている。しかし、図6のステップS9で開始される押圧力の減少過程で各圧力センサ6a,7aにより検出される圧脈波に基づいて、制御部12が最適圧力センサと最適押圧力を決定しておき、ここで決定した内容を連続血圧測定時の圧脈波検出条件として設定してもよい。
つまり、図12のステップS21~ステップS23を省略し、制御部12は、ステップS24において、ステップS9以降の押圧力の減少過程で決定しておいた最適押圧力を設定する。制御部12は、この最適押圧力でセンサ部6が橈骨動脈Tに押圧された状態で、ステップS9以降の押圧力の減少過程で決定しておいた最適圧力センサから検出される圧脈波をステップS25において取得する。
このようにすることでも、1拍目の血圧測定完了までの時間を短縮することができる。また、消費電力を削減することができる。
図6及び図12で説明した動作では、ステップS12の処理が終了した後に、回動部5の回転状態を維持したまま、ステップS21に移行するものとしている。この変形例として、ステップS12の後に回動部5を初期状態に戻し、その後、ステップS21の代わりに、図6のステップS1~ステップS8の処理を行い、その後、ステップS22の処理を行うようにしてもよい。
以上の説明では、脈波包絡線データを、センサ部6による橈骨動脈Tへの押圧力と、その押圧力でセンサ部6が橈骨動脈Tに押圧された状態で最適圧力センサにより検出される圧脈波の振幅とを対応付けたデータとしたが、これに限らない。
例えば、最適圧力センサにより検出される圧脈波の振幅と、その圧脈波の圧力最大値(図10のMmax)とを対応付けたデータを脈波包絡線データとしてもよい。または、最適圧力センサにより検出される圧脈波の振幅と、その圧脈波の圧力最小値(図10のMmin)とを対応付けたデータを脈波包絡線データとしてもよい。或いは、最適圧力センサにより検出される圧脈波の振幅と、その圧脈波の圧力最大値及び圧力最小値の平均値とを対応付けたデータを脈波包絡線データとしてもよい。圧脈波の圧力最大値及び圧力最小値の平均値は、この圧脈波の形状を特定する情報の1つである。
つまり、脈波包絡線データは、押圧面6bによる橈骨動脈Tへの押圧力を変化させていく過程で最適圧力センサにより検出される圧脈波の振幅値と、当該圧脈波の形状を特定する情報のうち振幅値を除く情報(例えば、Mmax、Mmin、又はこれらの平均)とを対応付けたデータであってもよい。
なお、脈波包絡線データの横軸の情報が上述したいずれの場合であっても、図6のステップS12において校正用データ生成に用いる圧脈波の情報(式(1),(2)に代入するMmaxとMmin)は、振幅が最大となっている圧脈波の情報には限定されない。
例えば、脈波包絡線における振幅がある程度の大きさ以上の部分のうち略平坦になっている部分を検出し、この部分に対応する圧脈波の情報を、校正用データ生成のために用いてもよい。
また、本実施形態では、回動部5が回転軸Xと回転軸Yの各々を中心に回転可能な構成としたが、回動部5は、回転軸Xと回転軸Yのいずれか一方を中心に回転可能な構成であってもよい。
回動部5が回転軸Xのみを中心に回転可能な構成である場合、制御部12は、図6のフローチャートにおいてステップS1A~ステップS1Cの処理は省略し、ステップS1の後にステップS2の処理を行えばよい。このような構成及び動作としても、ステップS6~ステップS8の処理があることで、精度の高い血圧算出が可能となる。
なお、回動部5が回転軸Xのみを中心に回転可能な構成の場合は、圧力センサ6aからなる素子列と圧力センサ7aからなる素子列のいずれかを省略した構成としてもよい。2つの素子列があると、動脈を閉塞できる確率が上がるため好ましいが、1つの素子列だけであっても、橈骨動脈Tの動きに追従した回転軸X周りでの回転制御を行うことで血圧算出精度を向上させることが可能である。
回動部5が回転軸Yのみを中心に回転可能な構成である場合、制御部12は、図6のフローチャートにおいてステップS6~S8の処理は省略し、ステップS3の後にステップS9の処理を行えばよい。このような構成及び動作としても、ステップS1A~ステップS1Cの処理があることで、例えば、その後の押圧力の減少過程において最適圧力センサの決定に必要な情報量を増やすことができ、最適圧力センサをより精度よく決定することができる。
圧脈波検出部100は、1つの押圧面に、複数の圧力センサ6aからなる素子列と、複数の圧力センサ7aからなる素子列を形成する構成としたが、押圧面を分割し、各分割面に素子列を形成した構成であってもよい。
押圧面を分割する構成によれば、圧脈波検出部100の設計自由度が上がるため、押圧面の皮膚への接触状態を良好にするための構造設計等が容易となり、装着性向上等が期待できる。一方で、図2の構成では、押圧力を均等に動脈に伝えやすくなり、血圧測定精度向上が期待できる。
図4の例では、回転軸Yが、複数の圧力センサ6aからなる素子列と、複数の圧力センサ7aからなる素子列との間に設定されているものとしたが、これに限らない。例えば、回転軸Yが、複数の圧力センサ6aからなる素子列と、複数の圧力センサ7aからなる素子列よりも外側に設定されていてもよい。
具体的には、図4において、複数の圧力センサ6aからなる素子列よりも左側に回転軸Yがあってもよい。または、図4において、複数の圧力センサ7aからなる素子列よりも右側に回転軸Yがあってもよい。
同様に、図4の例では、回転軸Xが、2つの素子列の各々を半分に分割する位置にあるが、これに限らない。例えば、回転軸Xは、各素子列上の任意の位置にあればよい。また、各素子列と交差しない位置(センサ部6の上側又は下側)に設定されていてもよい。
圧脈波検出部100は、押圧面6bが回転軸X,Y周りに回転可能となっているが、図13の圧脈波検出部100Aに示すように、センサ部6が平板部3に直接固定された構成としてもよい。
図14は、圧脈波検出部100を圧脈波検出部100Aに変更した血圧測定装置の校正用データ生成までの動作の一例を説明するためのフローチャートである。
血圧測定指示があると、制御部12は、空気袋駆動部11を制御して空気袋2への空気の注入を開始させて、押圧面6bによる橈骨動脈Tへの押圧力を増加させる(ステップS31)。
次に、制御部12は、各圧力センサ6a,7aにより検出されたn拍目(nは1以上の自然数。初期値は1)の圧脈波を取得する(ステップS32)。
次に、制御部12は、取得したn拍目の圧脈波に基づいて全ての圧力センサ6a,7aの中から最適圧力センサを決定する(ステップS33)。例えば、ステップS32で取得した圧脈波のうちの最大振幅となる圧脈波を検出した圧力センサを最適圧力センサとして決定する。
ここでも、最大振幅の圧脈波を検出した圧力センサが複数ある場合があり、その場合には、この複数の圧力センサを最適圧力センサとして扱えばよい。そして、この複数の圧力センサの各々で検出された圧脈波の例えば平均を、この最適圧力センサにより検出される圧脈波として扱えばよい。
また、ステップS32で取得した圧脈波のうちの最大振幅となる圧脈波を検出した圧力センサが1つであっても、この圧力センサと、この圧力センサの近傍(例えば両隣)にある圧力センサを含めて最適圧力センサとして扱ってもよい。この場合も、複数の圧力センサの各々で検出された圧脈波の例えば平均を、この最適圧力センサにより検出される圧脈波として扱えばよい。
次に、制御部12は、nの値と、決定した最適圧力センサの識別IDと、この最適圧力センサにより検出されたn拍目の圧脈波と、この圧脈波が検出された時点での押圧力(空気袋2の内圧)と、を対応付けてメモリ15に記憶する(ステップS34)。圧力センサの識別IDは、その圧力センサの属する素子列と、その素子列におけるどの位置にある圧力センサであるかとを特定する情報である。
次に、制御部12は、橈骨動脈Tの閉塞に必要な必要押圧力に押圧力が達したかを判定し、押圧力が必要押圧力に達していなければ(ステップS35:NO)、nを(n+1)に更新して(ステップS36)、ステップS32に処理を戻す。
制御部12は、押圧力が必要押圧力に達していれば(ステップS35:YES)、メモリ15に記憶した情報に基づいて、n拍の各々に対応する最適圧力センサにより検出された圧脈波の振幅と、この圧脈波の検出時における空気袋2の内圧との関係を示す脈波包絡線データを生成する(ステップS37)。
次に、制御部12は、生成した脈波包絡線データからステップS11と同様の方法でSBP,DBPを算出する(ステップS38)。
次に、制御部12は、算出したSBP,DBPと、ステップS37で生成した脈波包絡線データにおいて最大振幅となっている圧脈波の最大値Mmaxと最小値Mminと式(1),(2)とから、係数a,bを算出し、式(1),(2)と係数a,bを校正用データとして生成してメモリ15に記憶する(ステップS39)。
制御部12は、ステップS39の後、空気袋2の内圧を解放したのち、図12のステップS21以降の処理を行って、1拍毎に第二の血圧値を算出する。
または、制御部12は、ステップS39の後、メモリ15に記憶したn拍分の最適圧力センサの識別IDのうち、最大振幅の圧脈波を検出した最適圧力センサを、連続血圧測定用の最適圧力センサとして決定し、この連続血圧測定用の最適圧力センサにより検出された圧脈波の検出時の押圧力を連続血圧測定用の最適押圧力として決定する。
そして、制御部12は、空気袋2の内圧を上記連続血圧測定用の最適押圧力となるよう設定した状態で、上記連続血圧測定用の最適圧力センサにより検出される圧脈波を、ステップS39で生成した校正用データを用いて校正して、1拍毎に血圧を測定する。
なお、図14の動作例では、押圧力を増加させる過程で圧力センサにより検出される圧脈波に基づいて校正用データ生成のための血圧値を算出するものとした。しかし、前述しているように、橈骨動脈Tが十分に閉塞されるまで押圧力を増加させた後、押圧力を減少させる過程で圧力センサにより検出される圧脈波に基づいて脈波包絡線データを生成し、この脈波包絡線データから校正用データ生成のための血圧値を算出することも可能である。
このように、圧脈波検出部100を圧脈波検出部100Aに変更した血圧測定装置によれば、押圧力を増加又は減少させる過程で圧力センサにより検出される圧脈波に基づいて血圧を算出することができ、利用者の負担を減らしつつ、短時間での血圧測定を行うことができる。
また、図14の動作によれば、押圧力の増加又は減少過程において、異なるタイミング毎に、全ての圧力センサ6a,7aの中から脈波振幅が最大となる圧力センサが最適圧力センサとして決定される。このため、押圧力の増加又は減少過程において橈骨動脈Tが方向Bに移動しても、この移動に追従して最適圧力センサが変化する。したがって、橈骨動脈Tの動きに追従した精度の高い血圧算出を行うことができる。このような効果を、圧脈波検出部100Aでは、回動部5及び2軸回転機構5aを用いることなく実現できる。このため、血圧測定装置をより小型にすることができる。
圧脈波検出部100Aは、圧脈波検出部100と同様に、2つの素子列の一方を削除した構成としてもよい。また、2つの素子列を別々の押圧面に形成した構成としてもよい。
図15は、図5に示した血圧測定装置のブロック構成の変形例を示す図である。図15に示す血圧測定装置は、高さ検出部16と体動検出部17を追加した点を除いては、図5と同じ構成である。
高さ検出部16は、血圧測定装置が装着される生体部位の基準位置に対する高さを検出する。高さ検出部16は例えば加速度センサや気圧センサにより構成され、基準位置は例えば高度0mの位置となっている。
体動検出部17は、血圧測定装置が装着される生体部位の動きを検出する。体動検出部17は、例えば、3軸加速度センサ、3軸角速度センサ、及び3軸地磁気センサを組み合わせて生体部位の動きを詳細に検出する。体動検出部17は、動きの検出精度に応じて適当なセンサを用いればよい。
図15に示す血圧測定装置の校正用データ生成までの動作は、図6に示したのとほぼ同じである。図6と異なるのは、制御部12が、ステップS11においてSBP,DBPを算出した後、以下の3つの情報をメモリ15に記憶する点である。
3つの情報は、ステップS10で生成された脈波包絡線データの生成に用いた圧脈波が検出された期間において高さ検出部16により検出された高さ(校正用データ生成に用いた圧脈波の検出時における装置装着部位の高さ)の情報と、ステップS10で生成された脈波包絡線データの生成に用いた圧脈波が検出された期間において体動検出部17により検出された動き(校正用データ生成に用いた圧脈波の検出時における装置装着部位の動き)の情報と、ステップS10で生成された脈波包絡線データの生成に用いた圧脈波を検出した最適圧力センサ(校正用データ生成に用いた圧脈波の出力元の圧力センサ)の識別IDである。
図16は、図15に示す血圧測定装置の連続血圧測定時の動作(校正用データ生成後の動作)を説明するためのフローチャートである。
制御部12は、図6のステップS9以降に決定した最適押圧力となるように空気袋駆動部11を制御し、空気袋2の内圧を最適押圧力まで増加させて保持する(ステップS41)。
次に、制御部12は、各圧力センサ6a,7aのうち、最大振幅の圧脈波を検出している圧力センサを最適圧力センサとして決定する(ステップS42)。
次に、制御部12は、図6のステップS11において記憶した最適圧力センサの識別IDと、ステップS42で決定した最適圧力センサの識別IDとを比較し、両者が一致すれば(ステップS44:YES)、ステップS46の処理を行い、両者が一致しなければ(ステップS44:NO)、ステップS42に処理を戻す。
ステップS46において、最適圧力センサにより圧脈波が検出されると、制御部12はこれを取得する。次に、制御部12は、図6のステップS11において記憶した高さと、ステップS46で取得した圧脈波の検出時点で高さ検出部16により検出された高さとを比較する。制御部12は、両者が一致する場合(ステップS47:YES)には、ステップS48の処理を行い、両者が一致しない場合(ステップS47:NO)には、ステップS50の処理を行う。
ステップS48において、制御部12は、図6のステップS11において記憶した動きの情報と、ステップS46で取得した圧脈波の検出時点で体動検出部17により検出された動きの情報とを比較する。制御部12は、両者が一致する場合(ステップS48:YES)には、ステップS49の処理を行い、両者が一致しない場合(ステップS48:NO)には、ステップS50の処理を行う。
なお、2つの高さが一致するとは、2つの高さが実質的に同じであることを意味し、この高さの差が閾値THc以下である場合をいう。また、2つの動きが一致するとは、2つの動き量が実質的に同じことを意味し、この動き量の差が閾値THd以下である場合をいう。閾値THcと閾値THdは、ステップS49において算出する血圧値に求められる測定精度に応じて適宜設定すればよい。
ステップS49において、制御部12は、ステップS46で取得した1つの圧脈波を、図6のステップS12で生成した校正用データを用いて校正して、SBPとDBPを算出する。
続くステップS50において、制御部12は、連続血圧測定の終了指示があれば処理を終了し、終了指示がなければ、ステップS42に処理を戻す。
以上のように、図15の血圧測定装置は、校正対象となる圧脈波の検出条件と、校正用データ生成に用いた圧脈波の検出条件とが一致する場合にのみ、校正対象となる圧脈波を校正してSBP,DBPの算出を行う。
ここで、校正用データ生成に用いた圧脈波の検出条件とは、上記の3つの情報を含む。また、校正対象となる圧脈波の検出条件とは、校正対象となる圧脈波を検出する最適圧力センサの識別IDと、校正対象となる圧脈波を検出した時点での装置装着部位の高さと、校正対象となる圧脈波を検出した時点での装置装着部位の動きと、を含む。
このように、校正用データ生成に用いた圧脈波の検出条件と、連続血圧測定時の圧脈波の検出条件が一致するときのみ、校正対象となる圧脈波の校正を行って血圧算出を行うことで、校正精度を高めることができ、血圧測定精度を向上させることができる。
なお、ここでは、比較する検出条件として3つの条件(圧力センサ識別ID、高さ、動き)を挙げたが、検出条件としては、この3つの条件のうちの少なくとも1つを含んでいればよい。
また、上記条件の1つである校正用データ生成に用いた圧脈波の検出時における装置装着部位の高さの情報は、校正用データ生成に用いた各圧脈波の検出時において高さ検出部16により検出された高さの代表値(例えば平均値)とする。
同様に、校正用データ生成に用いた圧脈波の検出時における装置装着部位の動きの情報は、校正用データ生成に用いた各圧脈波の検出時において体動検出部17により検出された動きの代表値(例えば平均値)とする。
また、図15に示す血圧測定装置の圧脈波検出部100を図13の圧脈波検出部100Aに変更してもよい。この場合の校正用データ生成までの動作は、図14に示したものとほぼ同じである。この場合は、制御部12が、ステップS38においてSBP,DBPを算出した後、ステップS37で生成した脈波包絡線データにおける各圧脈波の検出時点において高さ検出部16により検出された高さの情報(高さの平均)と、ステップS37で生成した脈波包絡線データにおける各圧脈波の検出時点において体動検出部17により検出された動きの情報(動きの平均)と、ステップS37で生成した脈波包絡線データにおける各圧脈波のうち最大振幅となっている圧脈波を検出した最適圧力センサの識別IDと、この最大振幅の圧脈波が検出されたときの押圧力とを、校正用データ生成に用いた圧脈波の検出条件としてメモリ15に記憶しておけばよい。
そして、図16のステップS41において、制御部12は、空気袋2の内圧を、ステップS38において記憶した押圧力に保持すればよい。
図17は、図15に示した血圧測定装置の連続血圧測定時の動作の変形例を示すフローチャートである。図17において図16と同じ処理には同一符号を付して説明を省略する。
ステップS47の判定がNOのとき、制御部12は、ステップS42で決定した最適圧力センサにより検出された圧脈波を校正用データによって校正して、SBP,DBPを算出する(ステップS51)。
次に、制御部12は、図6のステップS11又は図14のステップS38において記憶した高さと、ステップS46で取得した圧脈波の検出時点で高さ検出部16により検出される高さとの差に応じて、ステップS51で算出したSBP,DBPを補正し(ステップS52)、その後、ステップS50の処理を行う。
連続血圧測定時には、最適圧力センサにより検出される圧脈波が校正されて血圧が算出される。このため、校正用データを生成したときとステップS46で取得した圧脈波の検出時とで、装置装着部位の高さが異なる場合は、高さの差によって校正後の血圧に誤差が含まれる可能性がある。
図15に示す血圧測定装置では、校正用データを生成するときの手首の高さを心臓の高さに合わせた状態で行うものとする。2つの動脈間に高さの差ΔH(cm)があると、単位長さあたりの水頭圧(=0.8mmHg/cm)にΔHを乗じて得られる圧力差が2つの動脈間に現れる。
このため、ステップS52において、制御部12は、校正用データを生成したときの装置装着部位の高さと、連続血圧測定時に最適圧力センサにより圧脈波が検出されたときの装置装着部位の高さとの差ΔHに水頭圧を乗じた値を、ステップS51で算出されたSBP,DBPに加算又は減算することで、血圧補正を行う。
以上のように、連続血圧測定時に、校正データ生成時と異なる高さで圧脈波が検出された場合には、この圧脈波を校正して得た血圧値を、校正データ生成時の手首高さと当該圧脈波検出時の手首高さの差に応じて補正することで、精度の高い血圧測定が可能となる。
なお、図15~図17で説明した変形例においても、圧脈波検出部100に設ける素子列を1つとしてもよい。また、2つの押圧面にそれぞれ素子列が形成された構成であってもよい。
図16,17のフローチャートでは、ステップS44の判定がNOのときには血圧測定を行わないものとした。この変形例として、ステップS44の判定がNOのとき、又は、ステップS44の判定がNOになることが所定回数繰り返された場合には、図6のステップS1に処理を戻す、つまり、校正データ生成(ステップS1~ステップS12の処理)をやり直す構成としてもよい。本実施形態の血圧測定装置は、校正用データの生成を簡単に行うことができるため、校正用データ生成をやり直すことで、精度の高い連続血圧測定が可能になる。
また、同様に、図16のフローチャートにおいて、ステップS47の判定がNOのとき又は、ステップS47の判定がNOになることが所定回数繰り返された場合には、図6のステップS1に処理を戻してもよい。また、図16,17のフローチャートにおいて、ステップS48の判定がNOのとき、又は、ステップS48の判定がNOになることが所定回数繰り返された場合には、図6のステップS1に処理を戻してもよい。
本実施形態の制御部12が行う図6,図12,図14,図16,図17に示した各ステップをコンピュータに実行させるためのプログラムとして提供することもできる。このようなプログラムは、当該プログラムをコンピュータが読取可能な一時的でない(non-transitory)記録媒体に記録される。
このような「コンピュータ読取可能な記録媒体」は、たとえば、CD-ROM(Compact Disc-ROM)等の光学媒体や、メモリカード等の磁気記録媒体等を含む。また、このようなプログラムを、ネットワークを介したダウンロードによって提供することもできる。
今回開示された実施形態はすべての点で例示であって制限的なものではないと考えられるべきである。本発明の範囲は上記した説明ではなくて特許請求の範囲によって示され、特許請求の範囲と均等の意味及び範囲内でのすべての変更が含まれることが意図される。
以上説明してきたように、本明細書には以下の事項が開示されている。
開示された血圧測定装置は、一方向に並ぶ複数の圧力検出素子からなる少なくとも1つの素子列が形成された押圧面と、前記一方向が生体の皮膚下の動脈の伸びる方向と交差する状態で前記動脈に前記押圧面を押圧する押圧部と、前記押圧部による押圧力を制御する押圧制御部と、前記押圧部の押圧方向に直交する2つの軸であって前記一方向に伸びる第一の軸と前記一方向と直交する第二の軸の少なくとも一方の周りに前記押圧面を回転駆動する回転駆動部と、前記押圧制御部の制御によって前記押圧力が増加する過程の複数タイミングにおいて前記素子列により検出された圧脈波に基づいて、前記回転駆動部による前記押圧面の回転を制御する回転制御部と、前記押圧力が増加する過程、又は、前記押圧力が増加する過程の後の前記押圧制御部の制御によって前記押圧力が減少する過程、で前記素子列により検出される圧脈波に基づいて前記動脈内の血圧値を算出する血圧算出部と、を備えるものである。
開示された血圧測定装置は、前記血圧算出部は、前記押圧力が増加する過程の後の前記押圧制御部の制御によって前記押圧力が減少する過程で前記素子列により検出される圧脈波に基づいて前記動脈内の血圧値を算出するものである。
開示された血圧測定装置は、前記回転制御部は、前記複数タイミングにおいて前記素子列により検出された圧脈波と、当該圧脈波の検出時における前記押圧力との関係を示すデータを用いて、前記押圧力が増加する過程における前記動脈の前記一方向への移動量を算出し、前記移動量にしたがって前記押圧面の前記第二の軸周りの回転方向及び回転量を制御するものである。
開示された血圧測定装置は、前記回転制御部によって前記押圧面の回転が行われなかった場合に、前記血圧算出部は、前記押圧力が増加する過程で前記素子列により検出された圧脈波に基づいて前記動脈内の血圧値を算出するものである。
本発明によれば、利用者に煩わしい思いをさせることなく、短時間で血圧を測定することのできる血圧測定装置を提供することができる。
以上、本発明を特定の実施形態によって説明したが、本発明はこの実施形態に限定されるものではなく、開示された発明の技術思想を逸脱しない範囲で種々の変更が可能である。
本出願は、2014年10月31日出願の日本特許出願(特願2014-223251)に基づくものであり、その内容はここに取り込まれる。
本出願は、2014年10月31日出願の日本特許出願(特願2014-223251)に基づくものであり、その内容はここに取り込まれる。
100 圧脈波検出部
2 空気袋(押圧部)
3 平板部
5 回動部
5a 2軸回転機構
6 センサ部
6a,7a 圧力センサ(圧力検出素子)
6b 押圧面
10 回転駆動部
11 空気袋駆動部
12 制御部
16 高さ検出部
17 体動検出部
2 空気袋(押圧部)
3 平板部
5 回動部
5a 2軸回転機構
6 センサ部
6a,7a 圧力センサ(圧力検出素子)
6b 押圧面
10 回転駆動部
11 空気袋駆動部
12 制御部
16 高さ検出部
17 体動検出部
Claims (4)
- 一方向に並ぶ複数の圧力検出素子からなる少なくとも1つの素子列が形成された押圧面と、
前記一方向が生体の皮膚下の動脈の伸びる方向と交差する状態で前記動脈に前記押圧面を押圧する押圧部と、
前記押圧部による押圧力を制御する押圧制御部と、
前記押圧部の押圧方向に直交する2つの軸であって前記一方向に伸びる第一の軸と前記一方向と直交する第二の軸の少なくとも一方の周りに前記押圧面を回転駆動する回転駆動部と、
前記押圧制御部の制御によって前記押圧力が増加する過程の複数タイミングにおいて前記素子列により検出された圧脈波に基づいて、前記回転駆動部による前記押圧面の回転を制御する回転制御部と、
前記押圧力が増加する過程、又は、前記押圧力が増加する過程の後の前記押圧制御部の制御によって前記押圧力が減少する過程、で前記素子列により検出される圧脈波に基づいて前記動脈内の血圧値を算出する血圧算出部と、を備える血圧測定装置。 - 請求項1記載の血圧測定装置であって、
前記血圧算出部は、前記押圧力が増加する過程の後の前記押圧制御部の制御によって前記押圧力が減少する過程で前記素子列により検出される圧脈波に基づいて前記動脈内の血圧値を算出する血圧測定装置。 - 請求項1又は2記載の血圧測定装置であって、
前記回転制御部は、前記複数タイミングにおいて前記素子列により検出された圧脈波と、当該圧脈波の検出時における前記押圧力との関係を示すデータを用いて、前記押圧力が増加する過程における前記動脈の前記一方向への移動量を算出し、前記移動量にしたがって前記押圧面の前記第二の軸周りの回転方向及び回転量を制御する血圧測定装置。 - 請求項1~3のいずれか1項記載の血圧測定装置であって、
前記押圧力が増加する過程及び前記過程の終了後に、前記回転制御部によって前記押圧面の回転が行われなかった場合に、前記血圧算出部は、前記押圧力が増加する過程で前記素子列により検出された圧脈波に基づいて前記動脈内の血圧値を算出する血圧測定装置。
Priority Applications (3)
| Application Number | Priority Date | Filing Date | Title |
|---|---|---|---|
| CN201580058633.0A CN107148240B (zh) | 2014-10-31 | 2015-10-07 | 血压测量装置 |
| EP15855291.9A EP3213679B1 (en) | 2014-10-31 | 2015-10-07 | Blood pressure measurement device |
| US15/499,494 US10772515B2 (en) | 2014-10-31 | 2017-04-27 | Blood pressure measurement device |
Applications Claiming Priority (2)
| Application Number | Priority Date | Filing Date | Title |
|---|---|---|---|
| JP2014223251A JP6385244B2 (ja) | 2014-10-31 | 2014-10-31 | 血圧測定装置 |
| JP2014-223251 | 2014-10-31 |
Related Child Applications (1)
| Application Number | Title | Priority Date | Filing Date |
|---|---|---|---|
| US15/499,494 Continuation US10772515B2 (en) | 2014-10-31 | 2017-04-27 | Blood pressure measurement device |
Publications (1)
| Publication Number | Publication Date |
|---|---|
| WO2016067869A1 true WO2016067869A1 (ja) | 2016-05-06 |
Family
ID=55857212
Family Applications (1)
| Application Number | Title | Priority Date | Filing Date |
|---|---|---|---|
| PCT/JP2015/078541 WO2016067869A1 (ja) | 2014-10-31 | 2015-10-07 | 血圧測定装置 |
Country Status (5)
| Country | Link |
|---|---|
| US (1) | US10772515B2 (ja) |
| EP (1) | EP3213679B1 (ja) |
| JP (1) | JP6385244B2 (ja) |
| CN (1) | CN107148240B (ja) |
| WO (1) | WO2016067869A1 (ja) |
Cited By (1)
| Publication number | Priority date | Publication date | Assignee | Title |
|---|---|---|---|---|
| US11116411B2 (en) * | 2016-04-15 | 2021-09-14 | Omron Healthcare Co., Ltd. | Pulse wave detection device, biological information measurement device, and control method for pulse wave detection device |
Families Citing this family (6)
| Publication number | Priority date | Publication date | Assignee | Title |
|---|---|---|---|---|
| JP6631376B2 (ja) * | 2016-04-15 | 2020-01-15 | オムロンヘルスケア株式会社 | 脈波検出装置、生体情報測定装置、脈波検出装置の制御方法、及び、脈波検出装置の制御プログラム |
| EP3595521A1 (de) * | 2017-03-13 | 2020-01-22 | Redtel, Heiko | Verfahren und vorrichtung zur zeitaufgelöste messung von kenngrössen der herzfunktion |
| EP3482682A1 (en) | 2017-11-08 | 2019-05-15 | Koninklijke Philips N.V. | Blood pressure measurement device |
| CN109009044B (zh) * | 2018-08-15 | 2024-01-02 | 合肥博谐电子科技有限公司 | 一种新型脉搏波获取装置 |
| CN112773346A (zh) * | 2021-03-05 | 2021-05-11 | 深圳市亿联智能有限公司 | 一种具有测量血压的智能网关 |
| CN117442175B (zh) * | 2023-12-25 | 2024-03-15 | 博联众科(武汉)科技有限公司 | 一种连续无创血压测量方法及装置 |
Citations (5)
| Publication number | Priority date | Publication date | Assignee | Title |
|---|---|---|---|---|
| JPH03176027A (ja) * | 1989-12-04 | 1991-07-31 | Koorin Denshi Kk | 脈波検出装置 |
| US5240007A (en) * | 1991-05-14 | 1993-08-31 | Ivac Corporation | Apparatus and method for moving a tissue stress sensor for applanating an artery |
| US5762610A (en) * | 1996-07-03 | 1998-06-09 | Colin Corporation | Pressure pulse wave detecting apparatus |
| JP2004222847A (ja) * | 2003-01-21 | 2004-08-12 | Omron Healthcare Co Ltd | 脈波検出装置および方法 |
| JP2005046464A (ja) * | 2003-07-30 | 2005-02-24 | Setsuo Takatani | 動脈血管検出装置、圧脈波検出装置、および動脈硬化評価装置 |
Family Cites Families (9)
| Publication number | Priority date | Publication date | Assignee | Title |
|---|---|---|---|---|
| JP2664926B2 (ja) | 1988-03-23 | 1997-10-22 | コーリン電子株式会社 | 血圧測定装置 |
| JP2613622B2 (ja) | 1988-05-16 | 1997-05-28 | コーリン電子株式会社 | 脈波検出装置 |
| JP2798698B2 (ja) | 1989-04-03 | 1998-09-17 | コーリン電子株式会社 | 血圧モニタ装置 |
| JP3241510B2 (ja) | 1993-11-08 | 2001-12-25 | 日本コーリン株式会社 | 連続血圧測定装置 |
| JP2003508145A (ja) * | 1999-09-03 | 2003-03-04 | テンシス メディカル インコーポレイテッド | 生理学的パラメータ用スマート・センサおよび方法 |
| JP3688256B2 (ja) | 2002-09-25 | 2005-08-24 | コーリンメディカルテクノロジー株式会社 | 非観血連続血圧監視装置 |
| KR100755079B1 (ko) * | 2006-06-30 | 2007-09-06 | 삼성전자주식회사 | 생체 신호 측정 장치 |
| TWM331366U (en) * | 2007-11-12 | 2008-05-01 | Health & Amp Life Co Ltd | Sphygmomanometer capable of adjusting angle of monitor |
| KR101577342B1 (ko) * | 2009-05-07 | 2015-12-15 | 삼성전자주식회사 | 혈압 측정 장치 및 방법 |
-
2014
- 2014-10-31 JP JP2014223251A patent/JP6385244B2/ja active Active
-
2015
- 2015-10-07 WO PCT/JP2015/078541 patent/WO2016067869A1/ja active Application Filing
- 2015-10-07 CN CN201580058633.0A patent/CN107148240B/zh active Active
- 2015-10-07 EP EP15855291.9A patent/EP3213679B1/en active Active
-
2017
- 2017-04-27 US US15/499,494 patent/US10772515B2/en active Active
Patent Citations (5)
| Publication number | Priority date | Publication date | Assignee | Title |
|---|---|---|---|---|
| JPH03176027A (ja) * | 1989-12-04 | 1991-07-31 | Koorin Denshi Kk | 脈波検出装置 |
| US5240007A (en) * | 1991-05-14 | 1993-08-31 | Ivac Corporation | Apparatus and method for moving a tissue stress sensor for applanating an artery |
| US5762610A (en) * | 1996-07-03 | 1998-06-09 | Colin Corporation | Pressure pulse wave detecting apparatus |
| JP2004222847A (ja) * | 2003-01-21 | 2004-08-12 | Omron Healthcare Co Ltd | 脈波検出装置および方法 |
| JP2005046464A (ja) * | 2003-07-30 | 2005-02-24 | Setsuo Takatani | 動脈血管検出装置、圧脈波検出装置、および動脈硬化評価装置 |
Cited By (1)
| Publication number | Priority date | Publication date | Assignee | Title |
|---|---|---|---|---|
| US11116411B2 (en) * | 2016-04-15 | 2021-09-14 | Omron Healthcare Co., Ltd. | Pulse wave detection device, biological information measurement device, and control method for pulse wave detection device |
Also Published As
| Publication number | Publication date |
|---|---|
| EP3213679B1 (en) | 2022-02-02 |
| CN107148240A (zh) | 2017-09-08 |
| JP2016087005A (ja) | 2016-05-23 |
| US20170224229A1 (en) | 2017-08-10 |
| US10772515B2 (en) | 2020-09-15 |
| EP3213679A4 (en) | 2018-06-06 |
| JP6385244B2 (ja) | 2018-09-05 |
| CN107148240B (zh) | 2020-01-24 |
| EP3213679A1 (en) | 2017-09-06 |
Similar Documents
| Publication | Publication Date | Title |
|---|---|---|
| JP6366462B2 (ja) | 血圧測定装置 | |
| JP6385244B2 (ja) | 血圧測定装置 | |
| WO2016067867A1 (ja) | 血圧測定装置 | |
| WO2016067868A1 (ja) | 血圧測定装置 | |
| JP6228557B2 (ja) | 生体情報測定装置 | |
| JP6662164B2 (ja) | 圧脈波検出装置及び生体情報測定装置 | |
| US11000199B2 (en) | Pressure pulse wave measurement apparatus and bodily information measurement apparatus | |
| JP6672975B2 (ja) | 脈波検出装置及び生体情報測定装置 | |
| WO2017179558A1 (ja) | 脈波検出装置、生体情報測定装置、脈波検出装置の制御方法、及び、脈波検出装置の制御プログラム | |
| JP2017006672A (ja) | 生体情報取得装置 | |
| WO2016136865A1 (ja) | 血圧測定装置及び血圧表示制御方法 | |
| JP2017121405A (ja) | 圧脈波測定装置及び生体情報測定装置 | |
| JP6631376B2 (ja) | 脈波検出装置、生体情報測定装置、脈波検出装置の制御方法、及び、脈波検出装置の制御プログラム | |
| WO2017179560A1 (ja) | 脈波検出装置、生体情報測定装置、脈波検出装置の制御方法、及び、脈波検出装置の制御プログラム | |
| JP6627631B2 (ja) | 脈波検出装置、生体情報測定装置、脈波検出装置の制御方法、及び、脈波検出装置の制御プログラム |
Legal Events
| Date | Code | Title | Description |
|---|---|---|---|
| 121 | Ep: the epo has been informed by wipo that ep was designated in this application |
Ref document number: 15855291 Country of ref document: EP Kind code of ref document: A1 |
|
| REEP | Request for entry into the european phase |
Ref document number: 2015855291 Country of ref document: EP |
|
| NENP | Non-entry into the national phase |
Ref country code: DE |