WO2016031326A1 - 交通シミュレーション装置、交通シミュレーションシステム - Google Patents
交通シミュレーション装置、交通シミュレーションシステム Download PDFInfo
- Publication number
- WO2016031326A1 WO2016031326A1 PCT/JP2015/065049 JP2015065049W WO2016031326A1 WO 2016031326 A1 WO2016031326 A1 WO 2016031326A1 JP 2015065049 W JP2015065049 W JP 2015065049W WO 2016031326 A1 WO2016031326 A1 WO 2016031326A1
- Authority
- WO
- WIPO (PCT)
- Prior art keywords
- traffic
- simulation
- unit
- route
- individual
- Prior art date
- Legal status (The legal status is an assumption and is not a legal conclusion. Google has not performed a legal analysis and makes no representation as to the accuracy of the status listed.)
- Ceased
Links
Images


Classifications
-
- G—PHYSICS
- G06—COMPUTING OR CALCULATING; COUNTING
- G06Q—INFORMATION AND COMMUNICATION TECHNOLOGY [ICT] SPECIALLY ADAPTED FOR ADMINISTRATIVE, COMMERCIAL, FINANCIAL, MANAGERIAL OR SUPERVISORY PURPOSES; SYSTEMS OR METHODS SPECIALLY ADAPTED FOR ADMINISTRATIVE, COMMERCIAL, FINANCIAL, MANAGERIAL OR SUPERVISORY PURPOSES, NOT OTHERWISE PROVIDED FOR
- G06Q50/00—Information and communication technology [ICT] specially adapted for implementation of business processes of specific business sectors, e.g. utilities or tourism
- G06Q50/40—Business processes related to the transportation industry
-
- G—PHYSICS
- G08—SIGNALLING
- G08G—TRAFFIC CONTROL SYSTEMS
- G08G1/00—Traffic control systems for road vehicles
Definitions
- the present invention relates to a technique for simulating individual traffic behavior.
- Non-Patent Document 1 describes a prediction method called a four-stage estimation method.
- the four-stage estimation method requires various parameter settings at each step. These parameters are set based on the manual traffic survey and the survey results as described above.
- Traffic simulation generally requires a large amount of calculation, so it is not always easy to carry out the simulation in a short cycle.
- a procedure is taken to formulate a new traffic plan, evaluate its effects, and optimize the plan based on the evaluation. To evaluate each traffic plan in this process, If a traffic simulation is used, the amount of calculation becomes enormous. Therefore, in the past, it was difficult to repeatedly carry out traffic simulation by changing the simulation conditions.
- This invention is made in view of the said subject, and it aims at suppressing the calculation load at the time of changing a simulation condition and repeatedly implementing a traffic simulation.
- the traffic simulation apparatus extracts individuals who are affected by changing the network structure of the traffic route, and re-executes the traffic simulation for the extracted individuals.
- the traffic simulation device of the present invention it is possible to repeatedly execute the traffic simulation while changing the simulation conditions while suppressing the calculation load.
- FIG. 1 is a functional block diagram of a traffic simulation device 100 according to Embodiment 1.
- FIG. It is a figure which shows the structure of the personal history data 133, and a data example. It is a figure which shows the structure and data example of the traffic network data. It is a figure which shows the structure of the simulation result data 131, and a data example. It is a figure explaining the relationship of the zone in FIG. 2A and 2C, a node, and a link.
- 4 is a conceptual diagram illustrating the operation of the traffic simulation device 100.
- FIG. 4 is a conceptual diagram illustrating the operation of the traffic simulation device 100.
- FIG. It is a flowchart explaining the process which the simulation part 121 implements a traffic simulation.
- FIG. 10 is a flowchart illustrating a process for performing a traffic simulation in the third embodiment. It is a functional block diagram of the traffic simulation apparatus 100 which concerns on Embodiment 4.
- FIG. 10 is a flowchart for explaining a process in which the traffic simulation apparatus 100 optimizes a simulation result in the fourth embodiment.
- FIG. 10 is a functional block diagram of a traffic simulation device 100 according to a fifth embodiment. It is a figure which shows the screen image at the time of a user setting a new road using GUI of the traffic simulation apparatus 100. FIG. It is a figure which shows the screen image which shows the result of having evaluated the new traffic route by the convenience evaluation part 1210 and the traffic planning part 1220. It is a figure which shows the screen image which displays the expense, convenience, and evaluation parameter
- FIG. 1 It is a functional block diagram of the traffic simulation apparatus 100 according to the ninth embodiment. It is a figure which shows the screen image which a user (for example, traffic plan creator) sets a charge area using GUI of the traffic simulation apparatus 100. FIG. It is a figure which shows the screen image which shows the result of having evaluated the new traffic route by the billing effect prediction part 1810.
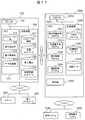
- FIG. 1 is a functional block diagram of a traffic simulation apparatus 100 according to Embodiment 1 of the present invention.
- the traffic simulation device 100 is a device that simulates traffic behavior such as a plurality of individual traffic routes on a traffic route, and includes a processor 110, a memory 120, and a storage device 130.
- the processor 110 is an arithmetic device that executes each program stored in the memory 120.
- the memory 120 includes a simulation unit 121, a difference extraction unit 122, and a difference update unit 123. Details of these functional units will be described later.
- the simulation unit 121, the difference extraction unit 122, and the difference update unit 123 can be configured by the processor 110 executing a program describing these operations, or hardware such as a circuit device that implements these functions. It can also be configured. The following description is based on the assumption that the program is configured as shown in FIG. These programs are actually executed by the processor 110, but for the sake of convenience of description, each function unit will be described as an operation subject. The same applies to other functional units stored in the memory 120, which will be described in an embodiment described later.
- the storage device 130 is a data storage device such as a hard disk device, for example, and stores simulation result data 131, traffic network data 132, personal history data 133, and new traffic network data 134. Details of these data will be described later.
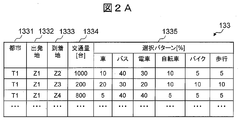
- FIG. 2A is a diagram showing a configuration of the personal history data 133 and a data example.
- the personal history data 133 is data in which the history of a person using transportation means is aggregated for a plurality of individuals, and includes a city 1331, a departure place 1332, an arrival place 1333, a traffic volume 1334, and a selection pattern 1335.
- the city 1331 holds the ID of the city where the personal history was collected.
- the departure place 1332 and the arrival place 1333 hold the ID of each point (zone) in the city.
- the traffic volume 1334 holds the traffic volume generated between the departure place 1332 and the arrival place 1333.
- the number of vehicles passing between the departure point 1332 and the arrival point 1333 can be used as the traffic volume 1334, but other traffic volume indicators may be used.
- the selection pattern 1335 holds the ratio at which each transportation facility is selected between the points.
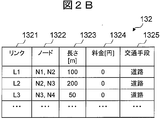
- FIG. 2B is a diagram illustrating a configuration of the traffic network data 132 and data examples.
- the traffic network data 132 is data describing a network structure of a traffic route connecting points, and includes a link 1321, a node 1322, a length 1323, a charge 1324, and a transportation means 1325.
- the link 1321 holds a traffic route ID such as a road or a traffic section.
- the node 1322 holds the ID of the point that hits both ends of the link.
- the length 1323 holds the length of the link.
- the fee 1324 holds an amount necessary for passing through the link.
- the transportation means 1325 holds transportation means that can pass through the link.
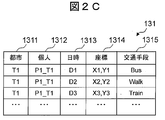
- FIG. 2C is a diagram illustrating a configuration of the simulation result data 131 and a data example.
- the simulation result data 131 is data for storing the result of the traffic simulation performed by the simulation unit 121, and expresses the geographical position and the transportation means of each individual at each time as the traffic behavior of the individual.
- the simulation result data 131 includes a city 1311, an individual 1312, a date and time 1313, coordinates 1314, and transportation means 1315.
- City 1311 is the ID of the city where the simulation was performed.
- An individual 1312 is an identifier of an individual who performs traffic behavior in the city.
- the date and time 1313 indicates the date and time.
- the coordinate 1314 is a coordinate representing the geographical position where the individual 1312 is located at the date 1313.
- the transportation means 1315 indicates transportation means used by the individual 1312 at the date and time 1313.
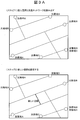
- FIG. 2D is a diagram for explaining the relationship between zones, nodes, and links in FIGS. 2A and 2C.
- the individual When an individual goes from the node N1 to the node N4, the individual may go through a plurality of nodes. Each node is connected by a link. Each node is included in a zone which is a wider regional unit.
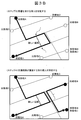
- FIGS. 3A to 3B are conceptual diagrams for explaining the operation of the traffic simulation apparatus 100.
- the steps in FIGS. 3A to 3B will be described below.
- the simulation unit 121 performs a traffic simulation using the traffic network data 132 and the personal history data 133.
- the traffic simulation here means that traffic behaviors such as the departure point 1332 and the arrival point 1333 described in the personal history data 133 actually occurred under the network structure of the traffic route described in the traffic network data 132. It is assumed that the traffic volume in each traffic link is simulated.
- the simulation unit 121 stores the simulation result in the simulation result data 131. Since the personal history data 133 does not hold information for identifying the individual, the traffic behavior for each individual may be statistically estimated based on the selection pattern 1335, for example, or using probe person data as described later. It may be estimated.
- FIG. 3A Step 1 Reading personal history and traffic network
- the planner should carry out the following re-simulation to examine whether or not to create a new traffic link (roads, railways, etc.) based on the simulation results.
- the traffic simulation apparatus 100 is instructed.
- the simulation unit 121 reads out the traffic network data 132 and the personal history data 133 corresponding to the simulation result performed previously.
- the traffic network shown in FIG. 3A and the respective departure points 1332 (departure points A to D) and arrival points 1333 (arrival points A to D) are read out.
- FIG. 3A Step 2 Setting a new road
- the planner uses, for example, a GUI (Graphical User Interface) provided by the traffic simulation apparatus 100 to create a new traffic link (eg, road) on the traffic network shown in FIG. 3A.
- a GUI Graphic User Interface
- the traffic network data 132 is changed.
- the new traffic network data 134 is data describing the traffic network after the change.
- the traffic simulation apparatus 100 identifies the affected individual by changing the traffic network data 132 to the new traffic network 134.
- Affected means that traffic behavior changes (eg, traffic route changes).
- traffic behavior changes eg, traffic route changes.
- the route is considered to change through the new road rather than through the previous traffic route, and thus the traffic route of the individual is considered to change.
- the traffic simulation apparatus 100 identifies such an individual.
- the individual affected by the new traffic link can be identified by, for example, whether or not the previous traffic route and the new traffic link at least partially intersect or overlap each other. This is because if the traffic routes intersect or overlap, a new choice of the traffic route or means of transportation occurs at that point.
- Each individual's previous traffic route can be extracted from the simulation result data 131.
- the traffic simulation apparatus 100 selects another individual who uses a traffic route at least partially overlapping the traffic route of the individual identified in Step 3. Further specify. If there is a possibility that the traffic behavior of an individual changes, the traffic volume of the traffic route may also change at the same time. Then, the traffic behavior of other individuals using the traffic route may change accordingly. The traffic simulation apparatus 100 further identifies the individual who is differentially affected in this way.
- the traffic simulation apparatus 100 extracts individuals who are affected by providing a new traffic link by repeating Step 3 to Step 4 described above.
- the traffic simulation apparatus 100 aims to suppress the amount of calculation by differentially executing the traffic simulation only for individuals affected by the change of the traffic network structure.
- FIG. 4 is a flowchart illustrating a process in which the simulation unit 121 performs a traffic simulation. This flowchart corresponds to the pre-processing in FIG. 3A. Hereinafter, each step of FIG. 4 will be described.
- the simulation unit 121 estimates the traffic behavior of each individual using the traffic network data 132 and the personal history 133.
- probe person data described in an embodiment described later can be used.
- the simulation unit 121 estimates a departure place (Origin) and an arrival place (Destination) from the movement history of each individual included in the probe person data. For example, a point staying at the same place for a certain amount of time is considered to be a destination or an arrival point, and movement between these points is extracted as one traffic action.
- a method used in a four-stage estimation method can be used.
- the travel route is also estimated.
- the transportation means selected by each individual can be statistically estimated based on the selection pattern 1335.
- Step S402 The simulation unit 121 simulates the behavior of each individual using the result of step S401. That is, it is assumed that each individual moves from the departure point estimated at step S401 toward the arrival point by using each transportation means, and the traffic volume in each traffic link is simulated.
- the simulation unit 121 stores the result of this step in the simulation result data 131.
- the simulation of this step generally requires a large amount of computation, and it is burdensome for the processor 110 to repeatedly perform this step.
- FIG. 5 is a flowchart for explaining a process of performing a traffic simulation using the new traffic network data 134. This flowchart corresponds to each step in FIGS. 3A to 3B. Hereinafter, each step of FIG. 5 will be described.
- the difference extraction unit 122 identifies the traffic link that has been changed (including addition and deletion) by extracting the difference between the traffic network data 132 and the new traffic network data 134. This step corresponds to Step 1 to Step 2 described in FIG. 3A.
- Steps S502 to S503 The difference extraction unit 122 extracts individuals who are affected by changing the traffic network structure (S502).
- the difference extraction unit 122 identifies the extracted personal traffic route (S503). These steps correspond to step 3 described in FIG. 3B.
- the traffic route of each individual can be obtained from the simulation result 131. The same applies to step S504.
- Step S504 The difference extraction unit 122 extracts another individual that is affected by the change in the traffic behavior of the individual extracted in step S502. This step corresponds to step 4 described in FIG. 3B.
- Step S505 The difference extraction unit 122 determines whether or not a new individual has been extracted in step S504. If a new individual is extracted, the process returns to step S503 to continue the process. If a new individual is not extracted, it is determined that the process has converged, and the process proceeds to step S506.
- Step S505 Supplement
- the difference extraction unit 122 may determine an upper limit value of the number of individuals to be extracted in this step, for example, and proceed to step S506 when the upper limit value is reached.
- an upper limit may be provided for the elapsed time from the start of this flowchart (or this step), and the process may proceed to step S506 when the calculation time reaches the upper limit.
- Step S506 The simulation unit 121 performs a traffic simulation again only for the individuals extracted in steps S502 to S505.
- the difference update unit 123 stores the simulation result newly performed by the simulation unit 121 in the storage device 130. This simulation result may be overwritten on the simulation result data 131, or new simulation result data reflecting the result of this step may be generated. Further, data describing the correspondence between the new traffic network data 134 and the new simulation result may be stored.
- Step S506 Supplement
- the simulation unit 121 re-executes the traffic simulation, but a functional unit that re-executes the traffic simulation may be separately provided.
- the simulation unit 121 is unified for convenience of description.
- the traffic simulation apparatus 100 extracts an individual who is affected by changing the traffic network structure, and re-executes the traffic simulation only for the individual. Thereby, the simulation result reflecting the change of the traffic network structure can be obtained without repeatedly executing the traffic simulation for the traffic behavior of all individuals. That is, the traffic simulation can be repeatedly performed by changing the simulation conditions while suppressing the calculation load accompanying the re-simulation.
- FIG. 6 is a functional block diagram of the traffic simulation apparatus 100 according to the second embodiment.
- the traffic simulation apparatus 100 holds new personal history data 135 instead of or in addition to the new traffic network data 134.
- the new personal history data 135 is data obtained by changing at least one of the departure place 1332, the arrival place 1333, and the selection pattern 1335 with respect to at least one record held by the personal history data 133.
- Other configurations are the same as those of the first embodiment.
- FIG. 7 is a conceptual diagram for explaining the operation of the traffic simulation apparatus 100 according to the second embodiment. Similar to the first embodiment, the traffic simulation apparatus 100 re-executes the traffic simulation only for an individual whose traffic behavior is changed by changing the simulation condition. Hereinafter, each step of FIG. 7 will be described.
- FIG. 7 Step 1 Identify an individual whose traffic behavior has been changed.
- the planner uses, for example, the GUI provided by the traffic simulation apparatus 100 to use one of the personal traffic behaviors (for example, departure place and Change your arrival location.
- the personal history data 133 is changed.
- the new personal history data 135 is data reflecting the personal history after the change.
- FIG. 7 shows an example in which the arrival place A is changed to the arrival place A ′.
- Step 2 Identify another person whose traffic route overlaps
- the traffic simulation apparatus 100 uses another traffic route that at least partially overlaps the traffic route of the individual whose traffic behavior was changed in Step 1. Identify individuals further. The reason for carrying out this step is the same as in step 4 of FIG. 3B.
- the traffic simulation apparatus 100 extracts individuals whose traffic behavior changes by repeating Step 2.
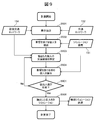
- FIG. 8 is a flowchart for explaining a process for carrying out a traffic simulation using the new personal history data 135. This flowchart corresponds to each step in FIG. Hereinafter, each step of FIG. 8 will be described.
- Steps S801 to S803 The difference extraction unit 122 extracts a difference between the personal history data 133 and the new personal history data 135 (S801), thereby specifying an individual whose traffic behavior has been changed (including addition and deletion) (S802). .
- the difference extraction unit 122 identifies the extracted personal traffic route (S803).
- Step S804 The difference extraction unit 122 extracts another individual that is affected by the change in the traffic behavior of the individual extracted in steps S801 to S802. This step corresponds to step 2 described in FIG.
- FIG. 8 Steps S805 to S806) These steps are the same as steps S505 to S506 described in FIG.
- the traffic simulation apparatus 100 extracts another individual that is affected by a change in traffic behavior of a certain individual, and performs a traffic simulation only for those individuals. Thereby, it is possible to repeatedly perform the traffic simulation while changing the simulation conditions while suppressing the calculation load accompanying the re-simulation as in the first embodiment.
- the method described in the second embodiment can be used in combination with the first embodiment. That is, individuals affected by the change of the traffic network data 132 are extracted by the method described in the first embodiment, and individuals affected by the change of the personal history data 133 are described in the second embodiment. It can be extracted by the method.
- FIG. 9 is a flowchart for explaining processing for carrying out a traffic simulation in the third embodiment.
- FIG. 5 described in the first embodiment
- FIG. 8 described in the second embodiment.
- steps different from those in the first and second embodiments will be described.
- Step S901 The difference extraction unit 122 performs this step instead of step S505 (or step S805).
- the difference extraction unit 122 determines that the extraction has converged when the increment of the number of individuals extracted in step S504 is equal to or less than a predetermined increment threshold, and proceeds to step S506. Thereby, this step can be prevented from being carried out indefinitely.
- Step S901 Modification
- the difference extraction unit 122 selects the individual only when the departure place 1332 and the arrival place 1333 extracted in step S504 are both within a predetermined geographical range (for example, a city where a traffic simulation is currently being performed). Otherwise, the individual may be discarded without extraction. Thereby, for example, temporary traffic flowing in from other cities can be removed, and unnecessary simulation load can be suppressed.
- FIG. 10 is a functional block diagram of the traffic simulation apparatus 100 according to the fourth embodiment.
- the traffic simulation apparatus 100 includes a simulation optimization unit 124 in addition to the configuration described in any of the first to third embodiments. Other configurations are the same as those in the first to third embodiments. The following description is based on the assumption that a simulation optimization unit 124 is provided in addition to the configuration of the first embodiment.
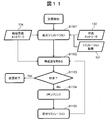
- FIG. 11 is a flowchart for explaining a process in which the traffic simulation apparatus 100 optimizes the simulation result in the fourth embodiment. Hereinafter, each step of FIG. 11 will be described.
- Step S1101 The simulation unit 121 and the difference extraction unit 122 re-execute the traffic simulation only for an individual who is affected by changing the simulation condition by the method described in the first embodiment.
- the simulation optimizing unit 124 obtains the degree of divergence between the simulation result data 131 acquired in step S1101 and the actual traffic traffic.
- the actual traffic traffic can be acquired using, for example, probe person data described in the embodiments described later.
- the degree of divergence can be obtained using an appropriate index that is commonly used in the traffic simulation field.
- Step S1103 The simulation optimizing unit 124 determines whether or not the deviation degree obtained in step S1102 has converged. For example, when the deviation degree increases below a predetermined threshold, it can be determined that the deviation degree has converged. If it has converged, this flowchart is terminated, and if it has not converged, the process proceeds to step S1104.
- the simulation optimizing unit 124 arbitrarily changes the parameters of the traffic simulation performed in step S1101, and generates new simulation conditions. For example, it is conceivable to change at least one of the departure place 1332 and the arrival place 1333 for some records of the personal history data 133. Alternatively, the transportation means used by each individual or the selection probability (selection pattern 1335) may be changed. Furthermore, the traffic network structure described by the traffic network data 132 may be changed. You may combine these arbitrarily.
- Step S1105 The simulation optimizing unit 124 re-executes the traffic simulation similar to step S1101 using the new simulation condition generated in step S1104. After this step, the process returns to step S1102.
- the simulation optimizing unit 124 can bring the re-executed traffic simulation result closer to the actual traffic traffic by repeatedly performing steps S1102 to S1105. Thereby, even if it is a case where re-simulation is implemented only about a part of individuals, simulation accuracy can be maintained.
- the traffic simulation performed in steps S1102 to S1105 is performed only for individuals who are affected by changing the simulation conditions in the same manner as in the first to third embodiments. Therefore, the arithmetic processing for optimizing the traffic simulation result can be suppressed as compared with the case where the simulation is performed for all individuals.
- FIG. 12 is a functional block diagram of the traffic simulation apparatus 100 according to the fifth embodiment.
- the traffic simulation apparatus 100 includes a convenience evaluation unit 1210 and a traffic planning unit 1220 in addition to the configurations described in the first to fourth embodiments.
- the traffic planning unit 1220 is a functional unit that creates a plan for adding new traffic facilities such as roads, intersections, and railway networks to the traffic network data 132. As a specific method, any known technique for creating a traffic plan can be used. In addition, the traffic planning unit 1220 can edit the personal history data 133. The traffic planning unit 1220 edits these data to create new traffic simulation conditions.
- the convenience evaluation unit 1210 calculates the traffic volume on each link and the convenience of transportation using the new traffic simulation conditions provisionally created by the traffic planning unit 1220.
- a convenience evaluation method a commonly used four-stage estimation method may be used, or other methods for estimating traffic volume may be used.
- the traffic planning unit 1220 calculates the cost required to change from the traffic network before editing to the traffic network after editing. For example, the cost can be calculated systematically based on past construction record data, etc., or each contractor can be automatically requested for an estimate and calculated based on the result.
- the convenience evaluation unit 1210 or the traffic planning unit 1220 may further calculate an index for evaluating the traffic plan from the calculation results of the cost and convenience. An example of the evaluation index will be described later.
- the convenience evaluation unit 1210 and the traffic planning unit 1220 store these processing results in the storage device 130.
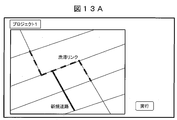
- FIG. 13A is a diagram showing a screen image when the user sets a new road using the GUI of the traffic simulation apparatus 100.
- FIG. 13A When the user creates a new traffic plan (project), the traffic simulation device 100 displays a map of the surrounding area and the traffic link congestion obtained by the traffic simulation on the screen. The dotted line on the screen is the link where the traffic jam occurs. The user temporarily sets a new road in consideration of such a current situation (thick line). When the editing is finished, the user presses the execution button at the lower right.
- the traffic simulation apparatus 100 implements the functions of the convenience evaluation unit 1210 and the traffic planning unit 1220.
- FIG. 13B is a diagram showing a screen image showing a result of evaluating a new traffic route by the convenience evaluation unit 1210 and the traffic planning unit 1220.
- the congestion link has disappeared.
- the cost required to construct the transportation plan and the convenience of transportation after construction are displayed.
- the evaluation index calculated by the convenience evaluation unit 1210 based on these costs and convenience is displayed. The user can evaluate the usefulness of the new traffic plan based on these indices.
- traffic plan evaluation indexes examples include NPV (Net Present Value), CBR (Cost Benefit Ratio), IRR (Internal Rate of Return: Internal Rate of Return), and the like.
- NPV Net Present Value
- CBR Cost Benefit Ratio
- IRR Internal Rate of Return: Internal Rate of Return
- NPV Net Present Value
- CBR Cost Benefit Ratio
- IRR Internal Rate of Return: Internal Rate of Return
- FIG. 14 is a diagram showing a screen image for displaying a list of costs, convenience, and evaluation indexes of a plurality of new traffic plans.
- the convenience evaluation unit 1210 and the traffic planning unit 1220 can store the calculation results of these indexes in the storage device 130 and call them on the GUI.
- each traffic plan can be finely adjusted by the traffic simulation apparatus 100 holding the calculation result and the edit result of each traffic plan.
- the traffic simulation apparatus 100 can evaluate the cost convenience of the traffic plan using the simulation result data 131. This makes it possible to evaluate traffic plans at intervals of about one week to one month. In other words, it is possible to carry out evaluation and design of urban traffic plans that have been carried out every 5 to 10 years more frequently.
- FIG. 15 is a configuration diagram of a traffic simulation system according to the sixth embodiment.
- This traffic simulation system includes a traffic simulation device 100 and a server 1000.
- the traffic simulation apparatus 100 includes a data collection unit 1510 in addition to the configurations described in the first to fourth embodiments, and is connected to the probe 200 and the personal data source 300.
- the probe 200 is a measuring terminal that measures the state of traffic congestion, such as a GPS mounted on a taxi or bus, a VICS (registered trademark) installed on a road, a camera that captures the state of the transportation, etc. It is comprised using.
- the personal data source 300 is a personal traffic such as a GPS or acceleration sensor mounted on a portable terminal carried by an individual, a use history of an IC card that can be used in transportation, a person trip questionnaire result at the time of national census, etc. It is an information source for collecting action history.
- the data collection unit 1510 collects information on the measurement results obtained by the probe 200 and the traffic behavior of each individual provided by the personal data source 300. For example, each data can be collected from the probe 200 and the personal data source 300 via a communication network, or measurement data stored in a storage medium can be read and acquired. Each data acquired by the data collection unit 1510 may be referred to as probe person data.
- the simulation unit 121, the difference extraction unit 122, and the difference update unit 123 perform a traffic simulation based on the probe person data collected by the data collection unit 1510, thereby obtaining a simulation result 131 that more accurately reflects actual traffic traffic.
- the data collection unit 1510 can correct the traffic network 132 and the personal history 133 based on the probe person data, and other functional units can use this to perform a traffic simulation.
- the server 1000 is a device that instructs the traffic regulation unit 1050 to implement traffic regulation, and includes a processor 1010, a memory 1020, a storage device 1030, and a display unit 1040. These are connected to each other by a bus.
- the display unit 1040 visually displays data using a monitor, a display, or the like.
- the processor 1010 executes each program stored in the memory 1020.
- each program will be described as an operation subject.
- the memory 1020 stores a traffic condition display program 1021, a restriction information editing program 1022, a traffic volume prediction program 1023, and a restriction information distribution program 1024.
- the restriction information distribution program 1024 can also be arranged on the traffic simulation device 100.
- the traffic condition display program 1021 acquires the traffic network data 1032 from the traffic simulation apparatus 100, integrates these with the map data 1033, and displays the screen on the display unit 1040. Thereby, the user can grasp
- the regulation information editing program 1022 temporarily sets a new traffic regulation section on the display unit 1040 and reflects it on the traffic network. For example, when a traffic accident occurs and a traffic jam occurs, a new traffic regulation such as prohibiting traffic on a certain road so as not to occur in a more serious wide-area traffic jam is temporarily set.
- the traffic volume prediction program 1023 requests the traffic simulation apparatus 100 to predict the traffic volume of each traffic path by the traffic simulation when the traffic regulation temporarily set by the regulation information editing program 1022 is implemented. In response to the request, the traffic simulation apparatus 100 performs a traffic simulation reflecting the traffic regulation and returns the result. The user can determine the usefulness of the temporarily set traffic regulation based on the prediction result.
- the restriction information distribution program 1024 distributes the traffic restriction information temporarily set by the restriction information editing program 1022 to the traffic restriction unit 1050.
- the traffic regulation unit 1050 performs traffic regulation based on the received traffic regulation information, and further distributes the traffic regulation information to an information bulletin board or a website.
- a mode of actually implementing the traffic regulation for example, a mode in which a detour sign is displayed on an information display board on the road, or a manual regulation is performed according to information distributed by the regulation information distribution program 1024 can be considered.
- the traffic simulation system can evaluate the usefulness of traffic regulation by simulation based on the simulation result by the traffic simulation device 100. Thereby, the traffic regulation according to the actual condition of each individual's traffic behavior can be implemented.
- a function of referring to information related to the traffic restriction implemented in the past may be provided. Further, a function may be provided in which a past traffic situation that is most similar to the current traffic situation is searched, and information relating to traffic regulation implemented at that time is referred to.
- FIG. 16 is a configuration diagram of a traffic simulation system according to the seventh embodiment of the present invention.
- the traffic simulation system according to the seventh embodiment includes an accident detection program 1025 newly in addition to the configuration described in the sixth embodiment. Other configurations are the same as those of the sixth embodiment.
- the accident detection program 1025 can also be arranged on the traffic simulation apparatus 100.
- the accident detection program 1025 uses the probe person data collected by the data collection unit 1510 to detect the occurrence of a sudden traffic jam, for example, by detecting that the traffic link congestion level has changed abruptly.
- the accident detection program 1025 assumes that the occurrence of the traffic jam is caused by a traffic accident, and assumes that the outflow of traffic volume is reduced at the point.
- the traffic volume prediction program 1023 requests the traffic simulation apparatus 100 to estimate the future traffic volume based on the assumption. In response to the request, the traffic simulation apparatus 100 performs a traffic simulation with the traffic volume reduced, and returns the result.
- the user refers to the traffic volume acquired by the traffic volume prediction program 1023 on the display unit 1040, and sets traffic regulation using the regulation information editing program 1022.
- the subsequent operation is the same as in the sixth embodiment.
- the traffic simulation system by detecting the occurrence of a traffic accident based on the probe person data acquired from the probe 200, it is possible to quickly implement traffic regulation before serious traffic congestion occurs. .
- FIG. 17 is a configuration diagram of a traffic simulation system according to the eighth embodiment.
- This traffic simulation system includes a traffic simulation device 100 and a server 1000.
- the server 1000 includes a signal interval setting program 1221, a traffic volume prediction program 1222, a signal control program 1223, and an information distribution program 1224 in place of or in addition to the programs described in the sixth to seventh embodiments. These programs can also be arranged on the traffic simulation apparatus 100.
- the signal interval setting program 1221 sets a signal switching interval.
- the switching interval may be manually input by the user, or the user may select any one from a plurality of parameters set in advance.
- the traffic volume prediction program 1222 requests the traffic simulation apparatus 100 to predict the future traffic volume, for example, about one hour ahead by traffic simulation.
- the traffic simulation apparatus 100 performs a traffic simulation reflecting the signal interval, and returns the result.
- the user adopts a signal interval that can eliminate the current traffic jam based on the traffic volume acquired by the traffic volume prediction program 1222.
- the signal control program 1223 transmits a control signal for reflecting the signal interval set by the signal interval setting program 1221 to the signal system 1230.
- the information distribution program 1224 distributes information on the current traffic situation to the information bulletin system 1240.
- the information bulletin system 1240 distributes information related to traffic conditions received from the information distribution program 1224 to an information bulletin board on the road, an information bulletin board website on the Internet, and the like. At this time, it may be converted into a format that is easy for the user to understand.
- the signal system 1230 controls the traffic light using the control signal received from the signal control program 1223 and transmits control information to the signal control program 1223.
- the traffic simulation system can evaluate the effect of changing the signal switching interval by simulation based on the simulation result by the traffic simulation device 100. Thereby, signal control based on the actual state of traffic behavior can be implemented.
- the eighth embodiment can be used in combination with the sixth to seventh embodiments.
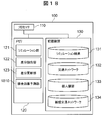
- FIG. 18 is a functional block diagram of the traffic simulation apparatus 100 according to the ninth embodiment.
- the traffic simulation apparatus 100 includes a billing effect prediction unit 1810 in addition to the configurations described in the first to fourth embodiments.
- the charging effect prediction unit 1810 uses the charging section and the charging amount described in the traffic network data 132 and the simulation result data 131 to estimate the traffic volume in the charging section.
- the billing effect prediction unit 1810 estimates the traffic volume using as a parameter which of the fee and time required to arrive at the destination is more important when selecting a transportation facility. Thereby, the traffic demand in the billing area can be correctly estimated.
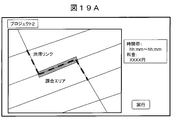
- FIG. 19A is a diagram showing a screen image in which a user (for example, a traffic plan creator) sets a billing area using the GUI of the traffic simulation apparatus 100.
- a user for example, a traffic plan creator
- the traffic simulation apparatus 100 displays a map of the surrounding area and the congestion degree of the actually measured traffic link on the screen.
- the dotted line represents a traffic jam link.
- the user sets a new road billing area in consideration of the current situation (rectangle in the figure).
- the traffic simulation apparatus 100 executes the function of the charging effect prediction unit 1810.
- FIG. 19B is a diagram showing a screen image showing a result of evaluating a new traffic route by the charging effect prediction unit 1810.
- the congestion link has disappeared.
- the convenience required for transportation taking into account the expenses required to construct the traffic plan and the revenue from billing after construction, is displayed.
- evaluation indexes calculated in the same manner as in the fifth embodiment based on these costs and convenience are displayed. The user can evaluate the usefulness of the new billing area based on these indices.
- the traffic simulation system can predict the effect of road billing using the simulation result data 131. Thereby, the road billing plan can be evaluated in accordance with the actual traffic behavior in the city.
- the ninth embodiment can be used in combination with the fifth embodiment to evaluate a traffic plan combining a billing area and a new traffic route.
- the present invention is not limited to the embodiments described above, and includes various modifications.
- the above embodiment has been described in detail for easy understanding of the present invention, and is not necessarily limited to the one having all the configurations described.
- a part of the configuration of one embodiment can be replaced with the configuration of another embodiment.
- the configuration of another embodiment can be added to the configuration of a certain embodiment. Further, with respect to a part of the configuration of each embodiment, another configuration can be added, deleted, or replaced.
- the above components, functions, processing units, processing means, etc. may be realized in hardware by designing some or all of them, for example, with an integrated circuit.
- Each of the above-described configurations, functions, and the like may be realized by software by interpreting and executing a program that realizes each function by the processor.
- Information such as programs, tables, and files for realizing each function can be stored in a recording device such as a memory, a hard disk, an SSD (Solid State Drive), or a recording medium such as an IC card, an SD card, or a DVD.
- DESCRIPTION OF SYMBOLS 100 Traffic simulation apparatus, 110: Processor, 121: Simulation part, 122: Difference extraction part, 123: Difference update part, 124: Simulation optimization part, 131: Simulation result data, 132: Traffic network data, 133: Personal history Data, 134: New traffic network data, 135: New personal history data.
Landscapes
- Physics & Mathematics (AREA)
- General Physics & Mathematics (AREA)
- Business, Economics & Management (AREA)
- Health & Medical Sciences (AREA)
- Economics (AREA)
- General Health & Medical Sciences (AREA)
- Human Resources & Organizations (AREA)
- Marketing (AREA)
- Primary Health Care (AREA)
- Strategic Management (AREA)
- Tourism & Hospitality (AREA)
- General Business, Economics & Management (AREA)
- Engineering & Computer Science (AREA)
- Theoretical Computer Science (AREA)
- Traffic Control Systems (AREA)
- Management, Administration, Business Operations System, And Electronic Commerce (AREA)
Applications Claiming Priority (2)
| Application Number | Priority Date | Filing Date | Title |
|---|---|---|---|
| JP2014-173708 | 2014-08-28 | ||
| JP2014173708A JP2016048508A (ja) | 2014-08-28 | 2014-08-28 | 交通シミュレーション装置、交通シミュレーションシステム |
Publications (1)
| Publication Number | Publication Date |
|---|---|
| WO2016031326A1 true WO2016031326A1 (ja) | 2016-03-03 |
Family
ID=55399231
Family Applications (1)
| Application Number | Title | Priority Date | Filing Date |
|---|---|---|---|
| PCT/JP2015/065049 Ceased WO2016031326A1 (ja) | 2014-08-28 | 2015-05-26 | 交通シミュレーション装置、交通シミュレーションシステム |
Country Status (2)
| Country | Link |
|---|---|
| JP (1) | JP2016048508A (https=) |
| WO (1) | WO2016031326A1 (https=) |
Families Citing this family (3)
| Publication number | Priority date | Publication date | Assignee | Title |
|---|---|---|---|---|
| JP7173694B2 (ja) * | 2018-10-30 | 2022-11-16 | トヨタ自動車株式会社 | データ生成装置、データ生成システム、データ生成方法、データ生成プログラム |
| JP7555844B2 (ja) * | 2021-02-16 | 2024-09-25 | 株式会社竹中工務店 | 街区設計支援装置及び街区評価支援装置 |
| JP2023178822A (ja) * | 2022-06-06 | 2023-12-18 | 富士通株式会社 | 判定方法、判定プログラム及び判定装置 |
Citations (8)
| Publication number | Priority date | Publication date | Assignee | Title |
|---|---|---|---|---|
| JPH05250594A (ja) * | 1992-03-04 | 1993-09-28 | Hitachi Ltd | 道路交通シミュレーションシステム |
| JPH11144182A (ja) * | 1997-11-07 | 1999-05-28 | Toyota Central Res & Dev Lab Inc | 交通流シミュレーションシステム |
| JP2003067882A (ja) * | 2001-08-27 | 2003-03-07 | Toyota Central Res & Dev Lab Inc | 走行経路最適化装置及び交通流シミュレータ |
| JP2008009639A (ja) * | 2006-06-28 | 2008-01-17 | Toshiba Corp | 道路料金設定装置および道路料金設定プログラム |
| JP2011096281A (ja) * | 2011-01-31 | 2011-05-12 | Kyosan Electric Mfg Co Ltd | 交通信号制御機の交通信号シミュレーション装置及びプログラム |
| JP2012043095A (ja) * | 2010-08-17 | 2012-03-01 | Toyota Central R&D Labs Inc | 交通流計算装置及びプログラム |
| JP2012043066A (ja) * | 2010-08-16 | 2012-03-01 | Toyota Infotechnology Center Co Ltd | 交通インフラ改善計画作成装置およびその方法 |
| JP2012256192A (ja) * | 2011-06-08 | 2012-12-27 | Fujitsu Ltd | 交通シミュレーション装置および交通シミュレーションプログラム |
-
2014
- 2014-08-28 JP JP2014173708A patent/JP2016048508A/ja active Pending
-
2015
- 2015-05-26 WO PCT/JP2015/065049 patent/WO2016031326A1/ja not_active Ceased
Patent Citations (8)
| Publication number | Priority date | Publication date | Assignee | Title |
|---|---|---|---|---|
| JPH05250594A (ja) * | 1992-03-04 | 1993-09-28 | Hitachi Ltd | 道路交通シミュレーションシステム |
| JPH11144182A (ja) * | 1997-11-07 | 1999-05-28 | Toyota Central Res & Dev Lab Inc | 交通流シミュレーションシステム |
| JP2003067882A (ja) * | 2001-08-27 | 2003-03-07 | Toyota Central Res & Dev Lab Inc | 走行経路最適化装置及び交通流シミュレータ |
| JP2008009639A (ja) * | 2006-06-28 | 2008-01-17 | Toshiba Corp | 道路料金設定装置および道路料金設定プログラム |
| JP2012043066A (ja) * | 2010-08-16 | 2012-03-01 | Toyota Infotechnology Center Co Ltd | 交通インフラ改善計画作成装置およびその方法 |
| JP2012043095A (ja) * | 2010-08-17 | 2012-03-01 | Toyota Central R&D Labs Inc | 交通流計算装置及びプログラム |
| JP2011096281A (ja) * | 2011-01-31 | 2011-05-12 | Kyosan Electric Mfg Co Ltd | 交通信号制御機の交通信号シミュレーション装置及びプログラム |
| JP2012256192A (ja) * | 2011-06-08 | 2012-12-27 | Fujitsu Ltd | 交通シミュレーション装置および交通シミュレーションプログラム |
Also Published As
| Publication number | Publication date |
|---|---|
| JP2016048508A (ja) | 2016-04-07 |
Similar Documents
| Publication | Publication Date | Title |
|---|---|---|
| Kilanitis et al. | Impact of earthquake-induced bridge damage and time evolving traffic demand on the road network resilience | |
| Lee et al. | Robust accessibility: Measuring accessibility based on travelers' heterogeneous strategies for managing travel time uncertainty | |
| Zhang et al. | Quantifying multi-modal public transit accessibility for large metropolitan areas: a time-dependent reliability modeling approach | |
| CN108446470B (zh) | 基于车辆轨迹数据和人口分布的医疗设施可达性分析方法 | |
| JP6055916B2 (ja) | 交通行動推定システム、交通システム | |
| US8594925B2 (en) | Constructing travel itineraries from tagged geo-temporal photographs | |
| Dhakar et al. | Route choice modeling using GPS-based travel surveys | |
| Hu et al. | Behavioral responses to pre-planned road capacity reduction based on smartphone GPS trajectory data: A functional data analysis approach | |
| CN102356415A (zh) | 使用预测的交通拥塞确定交通路线 | |
| JP6803205B2 (ja) | 対象経路を含む移動位置範囲群に基づき通行量を推定する装置、プログラム及び方法 | |
| Wang et al. | Simulating the effect of urban light rail transit on urban development by coupling cellular automata and conjugate gradients | |
| Li et al. | Pedestrian crossing volume estimation at signalized intersections using Bayesian additive regression trees | |
| WO2016031326A1 (ja) | 交通シミュレーション装置、交通シミュレーションシステム | |
| Ou et al. | Big data processing and analysis on the impact of COVID-19 on public transport delay | |
| Kuhn | Open government data and public transportation | |
| Sabet et al. | A cost-effective methodology to compare travel time and speed: a tale of 11 cities | |
| JP6813527B2 (ja) | 推定装置、推定方法及びプログラム | |
| Owen et al. | Access to destinations: annual accessibility measure for the Twin Cities Metropolitan Region. | |
| Halás et al. | Modeling and prediction of long-distance traffic flows through the example of road transport in the Czech Republic | |
| JP6678476B2 (ja) | 移動経路推定装置、及び移動経路推定方法 | |
| Henclewood et al. | Real-time data driven arterial simulation for performance measures estimation | |
| Shen et al. | Traffic velocity prediction using GPS data: IEEE ICDM contest task 3 report | |
| Aburas | Smart and Resilient Mobility Services Platform for Managing Traffic Disruptive Events | |
| Giuffrè et al. | Methodological frontier in operational analysis for roundabouts: a review | |
| Owen et al. | Access to destinations: Annual accessibility measure for the twin cities metropolitan area |
Legal Events
| Date | Code | Title | Description |
|---|---|---|---|
| 121 | Ep: the epo has been informed by wipo that ep was designated in this application |
Ref document number: 15836282 Country of ref document: EP Kind code of ref document: A1 |
|
| WWE | Wipo information: entry into national phase |
Ref document number: 2017/02284 Country of ref document: TR |
|
| NENP | Non-entry into the national phase |
Ref country code: DE |
|
| 122 | Ep: pct application non-entry in european phase |
Ref document number: 15836282 Country of ref document: EP Kind code of ref document: A1 |