WO2015083357A1 - Estimation device, program, estimation method, and estimation system - Google Patents
Estimation device, program, estimation method, and estimation system Download PDFInfo
- Publication number
- WO2015083357A1 WO2015083357A1 PCT/JP2014/005977 JP2014005977W WO2015083357A1 WO 2015083357 A1 WO2015083357 A1 WO 2015083357A1 JP 2014005977 W JP2014005977 W JP 2014005977W WO 2015083357 A1 WO2015083357 A1 WO 2015083357A1
- Authority
- WO
- WIPO (PCT)
- Prior art keywords
- subject
- estimation
- unit
- information indicating
- emotion
- Prior art date
Links
- 238000000034 method Methods 0.000 title claims description 54
- 230000008451 emotion Effects 0.000 claims abstract description 124
- 238000004364 calculation method Methods 0.000 claims abstract description 83
- 238000000605 extraction Methods 0.000 claims abstract description 66
- 230000008859 change Effects 0.000 claims abstract description 63
- 230000013632 homeostatic process Effects 0.000 claims abstract description 52
- 230000000694 effects Effects 0.000 claims abstract description 45
- 210000000056 organ Anatomy 0.000 claims abstract description 45
- 230000035479 physiological effects, processes and functions Effects 0.000 claims abstract description 36
- 239000000284 extract Substances 0.000 claims abstract description 25
- 230000007170 pathology Effects 0.000 claims abstract description 10
- 238000012360 testing method Methods 0.000 claims description 98
- 230000001575 pathological effect Effects 0.000 claims description 70
- 230000008569 process Effects 0.000 claims description 40
- 201000010099 disease Diseases 0.000 claims description 27
- 208000037265 diseases, disorders, signs and symptoms Diseases 0.000 claims description 27
- 238000005259 measurement Methods 0.000 claims description 18
- 230000005236 sound signal Effects 0.000 claims description 5
- 230000035790 physiological processes and functions Effects 0.000 abstract description 13
- 230000004087 circulation Effects 0.000 description 74
- 238000006073 displacement reaction Methods 0.000 description 29
- 238000004088 simulation Methods 0.000 description 21
- 230000002123 temporal effect Effects 0.000 description 21
- 230000000994 depressogenic effect Effects 0.000 description 15
- 230000006870 function Effects 0.000 description 15
- 238000012545 processing Methods 0.000 description 15
- 108090000623 proteins and genes Proteins 0.000 description 13
- 238000004458 analytical method Methods 0.000 description 10
- 239000005556 hormone Substances 0.000 description 10
- 229940088597 hormone Drugs 0.000 description 10
- 208000022821 personality disease Diseases 0.000 description 10
- 210000004556 brain Anatomy 0.000 description 9
- 230000036772 blood pressure Effects 0.000 description 7
- 230000003284 homeostatic effect Effects 0.000 description 7
- 150000001413 amino acids Chemical class 0.000 description 6
- 210000004369 blood Anatomy 0.000 description 6
- 239000008280 blood Substances 0.000 description 6
- 230000036760 body temperature Effects 0.000 description 6
- 210000004027 cell Anatomy 0.000 description 6
- 208000024714 major depressive disease Diseases 0.000 description 6
- 208000020016 psychiatric disease Diseases 0.000 description 6
- 230000028327 secretion Effects 0.000 description 6
- 210000001260 vocal cord Anatomy 0.000 description 6
- 230000006399 behavior Effects 0.000 description 5
- 230000017531 blood circulation Effects 0.000 description 5
- 210000002249 digestive system Anatomy 0.000 description 5
- 230000002996 emotional effect Effects 0.000 description 5
- 230000036541 health Effects 0.000 description 5
- 102000004169 proteins and genes Human genes 0.000 description 5
- 208000024891 symptom Diseases 0.000 description 5
- 210000004727 amygdala Anatomy 0.000 description 4
- 238000004891 communication Methods 0.000 description 4
- 230000002124 endocrine Effects 0.000 description 4
- 238000002599 functional magnetic resonance imaging Methods 0.000 description 4
- 208000019622 heart disease Diseases 0.000 description 4
- 210000000987 immune system Anatomy 0.000 description 4
- 150000002632 lipids Chemical class 0.000 description 4
- 230000006996 mental state Effects 0.000 description 4
- 208000010125 myocardial infarction Diseases 0.000 description 4
- 108020004707 nucleic acids Proteins 0.000 description 4
- 102000039446 nucleic acids Human genes 0.000 description 4
- 150000007523 nucleic acids Chemical class 0.000 description 4
- 210000001747 pupil Anatomy 0.000 description 4
- 208000020401 Depressive disease Diseases 0.000 description 3
- 230000005540 biological transmission Effects 0.000 description 3
- 230000007177 brain activity Effects 0.000 description 3
- 230000000747 cardiac effect Effects 0.000 description 3
- 230000006421 emotional homeostasis Effects 0.000 description 3
- 235000013305 food Nutrition 0.000 description 3
- 210000000936 intestine Anatomy 0.000 description 3
- 210000002429 large intestine Anatomy 0.000 description 3
- 239000004973 liquid crystal related substance Substances 0.000 description 3
- 238000002595 magnetic resonance imaging Methods 0.000 description 3
- 239000002858 neurotransmitter agent Substances 0.000 description 3
- 230000000241 respiratory effect Effects 0.000 description 3
- 210000000813 small intestine Anatomy 0.000 description 3
- 235000000346 sugar Nutrition 0.000 description 3
- 230000002889 sympathetic effect Effects 0.000 description 3
- 210000000225 synapse Anatomy 0.000 description 3
- 206010002383 Angina Pectoris Diseases 0.000 description 2
- 108010064719 Oxyhemoglobins Proteins 0.000 description 2
- 230000001133 acceleration Effects 0.000 description 2
- UCTWMZQNUQWSLP-UHFFFAOYSA-N adrenaline Chemical compound CNCC(O)C1=CC=C(O)C(O)=C1 UCTWMZQNUQWSLP-UHFFFAOYSA-N 0.000 description 2
- 230000003042 antagnostic effect Effects 0.000 description 2
- 210000003651 basophil Anatomy 0.000 description 2
- 230000008901 benefit Effects 0.000 description 2
- 210000001124 body fluid Anatomy 0.000 description 2
- 239000010839 body fluid Substances 0.000 description 2
- 210000005252 bulbus oculi Anatomy 0.000 description 2
- 150000001720 carbohydrates Chemical class 0.000 description 2
- 235000014633 carbohydrates Nutrition 0.000 description 2
- 206010008118 cerebral infarction Diseases 0.000 description 2
- 208000026106 cerebrovascular disease Diseases 0.000 description 2
- 238000006243 chemical reaction Methods 0.000 description 2
- 208000030251 communication disease Diseases 0.000 description 2
- 239000000470 constituent Substances 0.000 description 2
- 230000008602 contraction Effects 0.000 description 2
- 238000003066 decision tree Methods 0.000 description 2
- 210000003979 eosinophil Anatomy 0.000 description 2
- 230000004424 eye movement Effects 0.000 description 2
- 230000008921 facial expression Effects 0.000 description 2
- 150000004676 glycans Chemical class 0.000 description 2
- 210000000265 leukocyte Anatomy 0.000 description 2
- 210000003715 limbic system Anatomy 0.000 description 2
- 210000004698 lymphocyte Anatomy 0.000 description 2
- 230000004048 modification Effects 0.000 description 2
- 238000012986 modification Methods 0.000 description 2
- 210000001616 monocyte Anatomy 0.000 description 2
- 210000005036 nerve Anatomy 0.000 description 2
- 210000000440 neutrophil Anatomy 0.000 description 2
- 230000008520 organization Effects 0.000 description 2
- 210000005037 parasympathetic nerve Anatomy 0.000 description 2
- 230000008855 peristalsis Effects 0.000 description 2
- 239000005017 polysaccharide Substances 0.000 description 2
- 229920001282 polysaccharide Polymers 0.000 description 2
- 102000004196 processed proteins & peptides Human genes 0.000 description 2
- 108090000765 processed proteins & peptides Proteins 0.000 description 2
- 238000001228 spectrum Methods 0.000 description 2
- 239000000126 substance Substances 0.000 description 2
- 230000035900 sweating Effects 0.000 description 2
- 239000011782 vitamin Substances 0.000 description 2
- 229940088594 vitamin Drugs 0.000 description 2
- 229930003231 vitamin Natural products 0.000 description 2
- 235000013343 vitamin Nutrition 0.000 description 2
- 208000019901 Anxiety disease Diseases 0.000 description 1
- 208000014644 Brain disease Diseases 0.000 description 1
- 208000002193 Pain Diseases 0.000 description 1
- 208000037656 Respiratory Sounds Diseases 0.000 description 1
- 230000036506 anxiety Effects 0.000 description 1
- 238000013473 artificial intelligence Methods 0.000 description 1
- 238000004820 blood count Methods 0.000 description 1
- 210000004204 blood vessel Anatomy 0.000 description 1
- 210000000133 brain stem Anatomy 0.000 description 1
- 210000001638 cerebellum Anatomy 0.000 description 1
- 238000009223 counseling Methods 0.000 description 1
- 210000003792 cranial nerve Anatomy 0.000 description 1
- 230000007423 decrease Effects 0.000 description 1
- 230000001419 dependent effect Effects 0.000 description 1
- 238000003745 diagnosis Methods 0.000 description 1
- 230000004069 differentiation Effects 0.000 description 1
- 230000001079 digestive effect Effects 0.000 description 1
- 238000005401 electroluminescence Methods 0.000 description 1
- 230000007613 environmental effect Effects 0.000 description 1
- 238000011156 evaluation Methods 0.000 description 1
- 230000005281 excited state Effects 0.000 description 1
- 230000029142 excretion Effects 0.000 description 1
- 239000012530 fluid Substances 0.000 description 1
- 210000001320 hippocampus Anatomy 0.000 description 1
- 210000003016 hypothalamus Anatomy 0.000 description 1
- 230000006872 improvement Effects 0.000 description 1
- 230000010365 information processing Effects 0.000 description 1
- 230000010354 integration Effects 0.000 description 1
- 210000002751 lymph Anatomy 0.000 description 1
- 230000003340 mental effect Effects 0.000 description 1
- 230000004630 mental health Effects 0.000 description 1
- 230000002969 morbid Effects 0.000 description 1
- 210000003205 muscle Anatomy 0.000 description 1
- 230000003183 myoelectrical effect Effects 0.000 description 1
- 230000008035 nerve activity Effects 0.000 description 1
- 230000003287 optical effect Effects 0.000 description 1
- 208000019906 panic disease Diseases 0.000 description 1
- 210000005259 peripheral blood Anatomy 0.000 description 1
- 239000011886 peripheral blood Substances 0.000 description 1
- 230000002250 progressing effect Effects 0.000 description 1
- 230000010349 pulsation Effects 0.000 description 1
- 210000003296 saliva Anatomy 0.000 description 1
- 230000035945 sensitivity Effects 0.000 description 1
- 210000002784 stomach Anatomy 0.000 description 1
- 150000008163 sugars Chemical class 0.000 description 1
- 210000004243 sweat Anatomy 0.000 description 1
- 210000002700 urine Anatomy 0.000 description 1
- 230000001755 vocal effect Effects 0.000 description 1
- 210000000707 wrist Anatomy 0.000 description 1
Images


Classifications
-
- A—HUMAN NECESSITIES
- A61—MEDICAL OR VETERINARY SCIENCE; HYGIENE
- A61B—DIAGNOSIS; SURGERY; IDENTIFICATION
- A61B10/00—Other methods or instruments for diagnosis, e.g. instruments for taking a cell sample, for biopsy, for vaccination diagnosis; Sex determination; Ovulation-period determination; Throat striking implements
-
- A—HUMAN NECESSITIES
- A61—MEDICAL OR VETERINARY SCIENCE; HYGIENE
- A61B—DIAGNOSIS; SURGERY; IDENTIFICATION
- A61B5/00—Measuring for diagnostic purposes; Identification of persons
- A61B5/02—Detecting, measuring or recording pulse, heart rate, blood pressure or blood flow; Combined pulse/heart-rate/blood pressure determination; Evaluating a cardiovascular condition not otherwise provided for, e.g. using combinations of techniques provided for in this group with electrocardiography or electroauscultation; Heart catheters for measuring blood pressure
- A61B5/0205—Simultaneously evaluating both cardiovascular conditions and different types of body conditions, e.g. heart and respiratory condition
- A61B5/02055—Simultaneously evaluating both cardiovascular condition and temperature
-
- A—HUMAN NECESSITIES
- A61—MEDICAL OR VETERINARY SCIENCE; HYGIENE
- A61B—DIAGNOSIS; SURGERY; IDENTIFICATION
- A61B5/00—Measuring for diagnostic purposes; Identification of persons
- A61B5/16—Devices for psychotechnics; Testing reaction times ; Devices for evaluating the psychological state
- A61B5/165—Evaluating the state of mind, e.g. depression, anxiety
-
- A—HUMAN NECESSITIES
- A61—MEDICAL OR VETERINARY SCIENCE; HYGIENE
- A61B—DIAGNOSIS; SURGERY; IDENTIFICATION
- A61B5/00—Measuring for diagnostic purposes; Identification of persons
- A61B5/24—Detecting, measuring or recording bioelectric or biomagnetic signals of the body or parts thereof
- A61B5/316—Modalities, i.e. specific diagnostic methods
- A61B5/318—Heart-related electrical modalities, e.g. electrocardiography [ECG]
-
- A—HUMAN NECESSITIES
- A61—MEDICAL OR VETERINARY SCIENCE; HYGIENE
- A61B—DIAGNOSIS; SURGERY; IDENTIFICATION
- A61B5/00—Measuring for diagnostic purposes; Identification of persons
- A61B5/42—Detecting, measuring or recording for evaluating the gastrointestinal, the endocrine or the exocrine systems
- A61B5/4222—Evaluating particular parts, e.g. particular organs
- A61B5/4255—Intestines, colon or appendix
-
- A—HUMAN NECESSITIES
- A61—MEDICAL OR VETERINARY SCIENCE; HYGIENE
- A61B—DIAGNOSIS; SURGERY; IDENTIFICATION
- A61B5/00—Measuring for diagnostic purposes; Identification of persons
- A61B5/48—Other medical applications
- A61B5/4803—Speech analysis specially adapted for diagnostic purposes
-
- A—HUMAN NECESSITIES
- A61—MEDICAL OR VETERINARY SCIENCE; HYGIENE
- A61B—DIAGNOSIS; SURGERY; IDENTIFICATION
- A61B5/00—Measuring for diagnostic purposes; Identification of persons
- A61B5/48—Other medical applications
- A61B5/4857—Indicating the phase of biorhythm
-
- A—HUMAN NECESSITIES
- A61—MEDICAL OR VETERINARY SCIENCE; HYGIENE
- A61B—DIAGNOSIS; SURGERY; IDENTIFICATION
- A61B5/00—Measuring for diagnostic purposes; Identification of persons
- A61B5/72—Signal processing specially adapted for physiological signals or for diagnostic purposes
-
- A—HUMAN NECESSITIES
- A61—MEDICAL OR VETERINARY SCIENCE; HYGIENE
- A61B—DIAGNOSIS; SURGERY; IDENTIFICATION
- A61B5/00—Measuring for diagnostic purposes; Identification of persons
- A61B5/72—Signal processing specially adapted for physiological signals or for diagnostic purposes
- A61B5/7271—Specific aspects of physiological measurement analysis
- A61B5/7278—Artificial waveform generation or derivation, e.g. synthesising signals from measured signals
-
- A—HUMAN NECESSITIES
- A61—MEDICAL OR VETERINARY SCIENCE; HYGIENE
- A61B—DIAGNOSIS; SURGERY; IDENTIFICATION
- A61B5/00—Measuring for diagnostic purposes; Identification of persons
- A61B5/74—Details of notification to user or communication with user or patient ; user input means
- A61B5/7405—Details of notification to user or communication with user or patient ; user input means using sound
- A61B5/741—Details of notification to user or communication with user or patient ; user input means using sound using synthesised speech
-
- A—HUMAN NECESSITIES
- A61—MEDICAL OR VETERINARY SCIENCE; HYGIENE
- A61B—DIAGNOSIS; SURGERY; IDENTIFICATION
- A61B7/00—Instruments for auscultation
- A61B7/02—Stethoscopes
- A61B7/04—Electric stethoscopes
-
- G—PHYSICS
- G10—MUSICAL INSTRUMENTS; ACOUSTICS
- G10L—SPEECH ANALYSIS TECHNIQUES OR SPEECH SYNTHESIS; SPEECH RECOGNITION; SPEECH OR VOICE PROCESSING TECHNIQUES; SPEECH OR AUDIO CODING OR DECODING
- G10L17/00—Speaker identification or verification techniques
- G10L17/26—Recognition of special voice characteristics, e.g. for use in lie detectors; Recognition of animal voices
-
- A—HUMAN NECESSITIES
- A61—MEDICAL OR VETERINARY SCIENCE; HYGIENE
- A61B—DIAGNOSIS; SURGERY; IDENTIFICATION
- A61B2562/00—Details of sensors; Constructional details of sensor housings or probes; Accessories for sensors
- A61B2562/02—Details of sensors specially adapted for in-vivo measurements
- A61B2562/0204—Acoustic sensors
-
- A—HUMAN NECESSITIES
- A61—MEDICAL OR VETERINARY SCIENCE; HYGIENE
- A61B—DIAGNOSIS; SURGERY; IDENTIFICATION
- A61B5/00—Measuring for diagnostic purposes; Identification of persons
- A61B5/0059—Measuring for diagnostic purposes; Identification of persons using light, e.g. diagnosis by transillumination, diascopy, fluorescence
- A61B5/0077—Devices for viewing the surface of the body, e.g. camera, magnifying lens
-
- A—HUMAN NECESSITIES
- A61—MEDICAL OR VETERINARY SCIENCE; HYGIENE
- A61B—DIAGNOSIS; SURGERY; IDENTIFICATION
- A61B5/00—Measuring for diagnostic purposes; Identification of persons
- A61B5/01—Measuring temperature of body parts ; Diagnostic temperature sensing, e.g. for malignant or inflamed tissue
-
- A—HUMAN NECESSITIES
- A61—MEDICAL OR VETERINARY SCIENCE; HYGIENE
- A61B—DIAGNOSIS; SURGERY; IDENTIFICATION
- A61B5/00—Measuring for diagnostic purposes; Identification of persons
- A61B5/02—Detecting, measuring or recording pulse, heart rate, blood pressure or blood flow; Combined pulse/heart-rate/blood pressure determination; Evaluating a cardiovascular condition not otherwise provided for, e.g. using combinations of techniques provided for in this group with electrocardiography or electroauscultation; Heart catheters for measuring blood pressure
- A61B5/021—Measuring pressure in heart or blood vessels
-
- A—HUMAN NECESSITIES
- A61—MEDICAL OR VETERINARY SCIENCE; HYGIENE
- A61B—DIAGNOSIS; SURGERY; IDENTIFICATION
- A61B5/00—Measuring for diagnostic purposes; Identification of persons
- A61B5/02—Detecting, measuring or recording pulse, heart rate, blood pressure or blood flow; Combined pulse/heart-rate/blood pressure determination; Evaluating a cardiovascular condition not otherwise provided for, e.g. using combinations of techniques provided for in this group with electrocardiography or electroauscultation; Heart catheters for measuring blood pressure
- A61B5/024—Detecting, measuring or recording pulse rate or heart rate
- A61B5/02405—Determining heart rate variability
-
- A—HUMAN NECESSITIES
- A61—MEDICAL OR VETERINARY SCIENCE; HYGIENE
- A61B—DIAGNOSIS; SURGERY; IDENTIFICATION
- A61B5/00—Measuring for diagnostic purposes; Identification of persons
- A61B5/05—Detecting, measuring or recording for diagnosis by means of electric currents or magnetic fields; Measuring using microwaves or radio waves
- A61B5/053—Measuring electrical impedance or conductance of a portion of the body
- A61B5/0531—Measuring skin impedance
-
- A—HUMAN NECESSITIES
- A61—MEDICAL OR VETERINARY SCIENCE; HYGIENE
- A61B—DIAGNOSIS; SURGERY; IDENTIFICATION
- A61B5/00—Measuring for diagnostic purposes; Identification of persons
- A61B5/05—Detecting, measuring or recording for diagnosis by means of electric currents or magnetic fields; Measuring using microwaves or radio waves
- A61B5/055—Detecting, measuring or recording for diagnosis by means of electric currents or magnetic fields; Measuring using microwaves or radio waves involving electronic [EMR] or nuclear [NMR] magnetic resonance, e.g. magnetic resonance imaging
-
- A—HUMAN NECESSITIES
- A61—MEDICAL OR VETERINARY SCIENCE; HYGIENE
- A61B—DIAGNOSIS; SURGERY; IDENTIFICATION
- A61B5/00—Measuring for diagnostic purposes; Identification of persons
- A61B5/103—Detecting, measuring or recording devices for testing the shape, pattern, colour, size or movement of the body or parts thereof, for diagnostic purposes
- A61B5/11—Measuring movement of the entire body or parts thereof, e.g. head or hand tremor, mobility of a limb
- A61B5/1103—Detecting eye twinkling
-
- A—HUMAN NECESSITIES
- A61—MEDICAL OR VETERINARY SCIENCE; HYGIENE
- A61B—DIAGNOSIS; SURGERY; IDENTIFICATION
- A61B5/00—Measuring for diagnostic purposes; Identification of persons
- A61B5/48—Other medical applications
- A61B5/486—Bio-feedback
-
- A—HUMAN NECESSITIES
- A61—MEDICAL OR VETERINARY SCIENCE; HYGIENE
- A61B—DIAGNOSIS; SURGERY; IDENTIFICATION
- A61B5/00—Measuring for diagnostic purposes; Identification of persons
- A61B5/72—Signal processing specially adapted for physiological signals or for diagnostic purposes
- A61B5/7235—Details of waveform analysis
- A61B5/7246—Details of waveform analysis using correlation, e.g. template matching or determination of similarity
-
- A—HUMAN NECESSITIES
- A61—MEDICAL OR VETERINARY SCIENCE; HYGIENE
- A61B—DIAGNOSIS; SURGERY; IDENTIFICATION
- A61B5/00—Measuring for diagnostic purposes; Identification of persons
- A61B5/74—Details of notification to user or communication with user or patient ; user input means
- A61B5/742—Details of notification to user or communication with user or patient ; user input means using visual displays
- A61B5/7435—Displaying user selection data, e.g. icons in a graphical user interface
Definitions
- the present invention relates to an estimation apparatus, a program, an estimation method, and an estimation system for estimating a subject's disease state.
- a subject's voice signal or an electrical signal indicating the activity of an organ such as the heart is measured, the subject's emotion or organ activity is obtained from the measured signal, and the subject is based on the time change of the obtained emotion or organ activity.
- Techniques have been proposed for estimating the pathological conditions (see, for example, cited documents 1 and 2).
- an object of the estimation device, program, estimation method, and estimation system disclosed herein is to easily estimate a subject's pathology without having specialized knowledge.
- An estimation apparatus includes an extraction unit that extracts, from information indicating a subject's physiology, first information indicating a state of the subject's physiology and second information indicating at least one of the subject's emotion and organ activity; A calculation unit that calculates a degree of similarity in time change indicated by the extracted first information and the second information, and calculates a deviation amount from a predetermined state in which the subject's constancy is maintained based on the obtained degree of similarity; And an estimation unit that estimates the condition of the subject based on the amount of deviation.
- a program extracts, from information indicating a subject's physiology, first information indicating a subject's physiology state and second information indicating at least one of the subject's emotion and organ activity, and extracting the first information
- the degree of similarity in the time change indicated by the information and the second information is obtained, the deviation amount from the predetermined state in which the subject's constancy is maintained is calculated based on the obtained degree of similarity, and the deviation amount is calculated based on the calculated deviation amount.
- the computer executes a process for estimating the condition of the subject.
- the extraction unit extracts first information indicating the state of the subject's physiology and second information indicating at least one of the subject's emotion and organ activity from the information indicating the subject's physiology, The degree of similarity in the time change indicated by the extracted first information and second information is obtained, and the amount of deviation from the predetermined state in which the subject's constancy is maintained is calculated by the arithmetic unit based on the obtained degree of similarity. Based on the amount of deviation, the morbid state of the subject is estimated by the estimation unit.
- An estimation system includes a measurement device that measures a subject's physiology, an estimation device that estimates information about the subject's physiology measured by the measurement device, and a pathology estimated by the estimation device.
- An output device that outputs a result, and the estimation device includes, from information indicating a subject's physiology, first information indicating a state of the subject's physiology and second information indicating at least one of the subject's emotion and organ activity; The degree of similarity in the time change indicated by the extraction unit that extracts the first information and the second information extracted is obtained, and the deviation amount from the predetermined state in which the subject's constancy is maintained based on the obtained degree of similarity is obtained.
- a calculation unit for calculating and an estimation unit for estimating the pathological condition of the subject based on the calculated deviation amount.
- the estimation device, program, estimation method, and estimation system disclosed herein can easily estimate a subject's disease state without having specialized knowledge.
- FIG. 1 It is a figure which shows an example of a disease state table. It is a figure which shows an example of the estimation process by the estimation apparatus shown in FIG. It is a figure which shows another embodiment of an estimation apparatus. It is a figure which shows an example of an utterance table. It is a figure which shows an example of the estimation process by the estimation apparatus shown in FIG.
- FIG. 1 shows an embodiment of the estimation apparatus.
- the estimation device AM shown in FIG. 1 is a computer device having an arithmetic processing device such as a CPU (Central Processing Unit) and a storage device such as a hard disk device.
- the estimation device AM has an extraction unit EU, a calculation unit CU, and an estimation unit AU.
- the functions of the extraction unit EU, the calculation unit CU, and the estimation unit AU may be realized by a program executed by the CPU, or may be realized by hardware.
- the extraction unit EU obtains the pitch frequency or the fundamental frequency of the voice, the body temperature or the heart rate from the voice data uttered by the subject stored in the storage device of the estimation device AM or the information indicating the subject's physiology including the data such as the body temperature and the heart rate. First information indicating a physiological state of the subject such as a number is extracted. Further, the extraction unit EU extracts second information indicating at least one of emotions including anger and sadness in the subject and activities of organs such as the heart and intestine of the subject from information indicating the physiology of the subject.
- the calculation unit CU obtains the degree of similarity in the time change indicated by the extracted first information and second information, and based on the obtained degree of similarity, the deviation amount from the predetermined state in which the subject's constancy is maintained (hereinafter, (Also referred to as constancy shift amount).
- the estimation unit AU estimates the pathological condition of the subject based on the calculated constancy shift amount. And the estimation apparatus AM outputs the information which shows the disease state estimated by the estimation part AU to displays, such as external organic EL (Organic * Electro-Luminescence) and a liquid crystal.
- displays such as external organic EL (Organic * Electro-Luminescence) and a liquid crystal.
- the constancy shift amount in the subject is calculated using the first information indicating the physiological state of the subject and the second information indicating at least one of the subject's emotion and organ activity. To do.
- the estimation device AM can easily estimate the pathological condition of the subject by referring to one index of the constancy shift amount without having specialized medical knowledge.
- FIG. 2 shows another embodiment of the estimation device.
- the estimation device 100 shown in FIG. 2 is a computer device having an arithmetic processing device such as a CPU and a storage device such as a hard disk device.
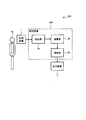
- the estimation device 100 is connected to the measurement device 1 and the output device 2 via an interface unit included in the estimation device 100 in a wired or wireless manner. Thereby, for example, the estimation device 100, the measurement device 1, and the output device 2 operate as the estimation system SYS.
- the measuring device 1 includes, for example, at least a microphone and measures information indicating the physiology of the subject PA. For example, the measuring device 1 measures an audio signal uttered by the subject PA via a microphone, and outputs the measured audio signal to the estimation device 100 as information indicating the physiology of the subject PA.
- the output device 2 includes a display such as an organic EL or a liquid crystal, for example.
- the output device 2 receives the estimation result of the pathological condition of the subject PA by the estimation device 100, and displays the received estimation result on a display such as an organic EL.
- the output device 2 may be provided inside the estimation device 100.
- the estimation apparatus 100 shown in FIG. 2 includes an extraction unit 10, a calculation unit 20, and an estimation unit 30.
- the functions of the extraction unit 10, the calculation unit 20, and the estimation unit 30 may be realized by a program executed by the CPU or may be realized by hardware.
- the extraction unit 10 uses the information indicating the physiology of the subject PA measured by the measuring device 1, the first information indicating the physiology state of the subject PA, the emotion in the subject PA, and the activity of organs such as the heart and intestine of the subject PA. And second information indicating at least one of them.
- the extraction unit 10 outputs the extracted first information and second information to the calculation unit 20. The operation of the extraction unit 10 will be described with reference to FIGS.
- the computing unit 20 calculates the degree of similarity of the time change between the extracted first information and the second information. For example, the computing unit 20 performs a cross-correlation process of the time change between the extracted first information and the second information, and calculates the cross-correlation coefficient as the degree of similarity. The computing unit 20 obtains a constancy shift amount in the subject PA using the plurality of calculated similarities. The operation and constancy of the calculation unit 20 will be described with reference to FIGS.
- the estimation unit 30 estimates the pathological condition of the subject PA based on the obtained constancy shift amount in the subject PA.
- the estimation unit 30 outputs information indicating the estimated pathology of the subject PA to the output device 2. The operation of the estimation unit 30 will be described with reference to FIGS.
- FIG. 3 shows an example of a decision tree indicating the relationship between the fundamental frequency of the utterance of the subject PA and the emotion of the subject PA.
- the judgment tree shown in FIG. 3 is subjective to any one of “normal”, “sadness”, “anger”, “joy”, etc. for each utterance of each of a plurality of subjects PA (for example, 100 or more). Is generated on the basis of the emotion of each subject PA evaluated in the above, the height of the extracted fundamental frequency, and the like. That is, the judgment tree shown in FIG. 3 shows the relationship between the emotions of normality, sadness, anger, and joy, and the height, intensity, and average intensity of the fundamental frequency in speech.
- the fundamental frequency has a height of less than 150 hertz and the fundamental frequency has an intensity of 100 or more.
- the emotion of sadness has a fundamental frequency height of less than 150 hertz and a fundamental frequency intensity of less than 100.
- the height of the fundamental frequency is 150 Hz or more, and the average intensity of the fundamental frequency is 80 or more.
- the emotion of joy is that the fundamental frequency is 150 Hz or higher and the fundamental frequency intensity is less than 80.
- the decision tree shown in FIG. 3 is stored in advance in the storage device of the estimation device 100.
- the emotion of the subject PA is normal, sad, angry, or joyful, but may include emotions such as anxiety and pain.
- the estimation apparatus 100 may include a determination tree indicating the relationship between voice parameters such as pitch frequency and emotion.
- the extraction unit 10 performs frequency analysis such as FFT (Fast Fourier Transform) on the speech signal of the utterance by the subject PA received from the measuring device 1 to obtain the height of the fundamental frequency and the like. Based on the height of the fundamental frequency obtained from each utterance of the subject PA and the determination tree shown in FIG. 3, the extraction unit 10 displays normality, sadness, anger and the like appearing in the subject PA at the moment of each utterance.
- the ratio of each emotion of joy is determined in the range of 0 to 10, for example. Note that the sum of the ratios of emotions of normal, sadness, anger and joy is a constant value, for example, 10. Further, the ratio of normality, sadness, anger, and joy may be a value outside the range of 0 to 10.
- the extraction unit 10 obtains inflection, pitch frequency, etc. from the voice signal of the subject PA. For example, the extraction unit 10 detects the region of the same frequency component from the pattern of intensity change in the speech unit of the audio signal, and acquires the time interval at which the detected region of the same frequency component appears as an inflection. Moreover, the extraction part 10 acquires a frequency spectrum from the frequency analysis of an audio
- the extraction unit 10 obtains the degree of excitement of the subject PA (hereinafter also referred to as the degree of excitement) in the range of 0 to 10 based on a comparison between the obtained inflection and pitch frequency and a predetermined interval and a predetermined frequency.
- the degree of excitement increases as the appearance interval of the same frequency component indicated by the intonation is shorter than the predetermined interval, or the pitch frequency is higher than the predetermined frequency.
- the physiological excitement of the subject PA and the cranial nerve activity in the subject PA such as the sympathetic nerve and the parasympathetic nerve are closely related to each other.
- the relationship with the emotion of the subject PA can be examined.
- the excitement degree may be a value outside the range of 0 to 10.
- the extraction unit 10 multiplies the obtained excitement level by the ratios of normal, sadness, anger, and joy, and determines the strengths of normal, sadness, anger, and joy.
- the degree of excitement is an example of first information
- the intensity of normality, sadness, anger, and joy are examples of second information.
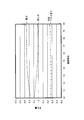
- FIG. 4 to FIG. 7 show examples of temporal changes in the intensity of excitement, normality, sadness, anger and joy for each subject PA.
- the horizontal axis in FIGS. 4 to 7 shows the order of speech units by the subject PA as the time axis
- the vertical axis in FIGS. 4 to 7 shows the excitement level and the strengths of normality, sadness, anger, and joy.
- the solid line shows the time change of the excitement level
- the one-dot broken line shows the time change of a value obtained by adding the strengths of normality and anger (hereinafter also referred to as “normal plus anger”).
- the dotted line indicates the temporal change in the intensity of sadness
- the broken line indicates the temporal change in the intensity of pleasure.
- temporal changes in the degree of excitement, normal plus anger, sadness, and joy shown in FIGS. 4 to 7 are values obtained by moving average with a window width of 10 utterances by the computing unit 20, for example.
- FIG. 4 shows temporal changes in the intensity of excitement, normality, sadness, anger, and joy when the subject PA is a healthy psychiatric doctor who does not suffer from mental illness and is examining a depressed patient.
- the excitement level of the doctor who is the subject PA shows a fluctuation in the range of 1 to 3.5 while speaking.
- doctors' emotions are generally higher than grief and joy during utterances, and the intensity of joy is generally lower than sadness because they are examining depressed patients. .
- FIG. 5 shows temporal changes in the intensity of excitement, normality, sadness, anger, and joy when the subject PA is a depressed patient and is being examined by the doctor shown in FIG.
- the degree of excitement of the depressed patient of subject PA shows a variation in the range of 2 to 5 while speaking, and is larger than the degree of excitement of the doctor shown in FIG. 4.
- the emotion of a depressed patient has a normal plus anger intensity greater than sadness or joy while speaking, and the sadness intensity is greater than the joy intensity.
- the intensity of sadness and joy of a depression patient shows a larger value than the case of the doctor shown in FIG.
- FIG. 6 shows changes over time in the intensity of excitement, normality, sadness, anger, and joy when the subject PA is a healthy general person A who does not suffer from mental illness.
- the excitement degree of the general person A who is the subject PA shows a fluctuation in the range of 1.5 to 4.5.
- the emotion of ordinary person A has normal plus anger intensity greater than sadness and joy while speaking. Indicates.
- the intensity of joy in the general person A is greater than the intensity of sadness.
- the intensity of pleasure of the general person A is distributed in a range of larger values than the case of the doctor shown in FIG. 4 and the case of the depression patient shown in FIG.
- the intensity of sadness is distributed in a range of lower values than the case of the doctor shown in FIG. 4 and the case of the depression patient shown in FIG.
- FIG. 7 shows temporal changes in the intensity of excitement, normality, sadness, anger, and joy when the subject PA is a healthy general person B who does not suffer from a mental illness different from the general person A shown in FIG.
- the excitement level of the general person B who is the subject PA shows a fluctuation in the range of 3 to 7.
- the emotion of the general person B shows a greater value of normal plus anger than sadness or joy while speaking.
- the intensity of pleasure of the ordinary person B is larger than the intensity of sadness as in the case of the ordinary person A shown in FIG.
- the calculation unit 20 performs a cross-correlation process between the time change of the excitement degree and the time change of the intensity of normal plus anger, sadness, and joy.
- the computing unit 20 obtains a cross-correlation coefficient between the degree of excitement in each subject PA and the intensity of normal plus anger, sadness and joy.
- the window width of the cross-correlation process by the calculation unit 20 is, for example, 150 utterances, but may be set for each subject PA or according to the required processing speed, estimation accuracy, and the like.
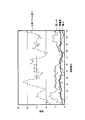
- FIGS. 8 to 11 show an example of the result of the cross-correlation process between the degree of excitement in the subject PA and each emotion by the calculation unit 20 shown in FIG.
- the horizontal axis in FIGS. 8 to 11 is shown in the order of speech units by the subject PA as the time axis, and the vertical axis in FIGS. 8 to 11 shows the cross-correlation coefficient.
- the dashed line shows the time change of the cross-correlation coefficient between the degree of excitement and normal plus anger
- the dotted line shows the time change of the degree of excitement, the intensity of sadness and the cross-correlation coefficient
- the broken line shows the excitement It shows the time change of cross-correlation coefficient between degree and intensity of pleasure.
- FIG. 8 shows the change over time in the cross-correlation coefficient between the excitement level of the doctor shown in FIG. 4 and the strengths of normal plus anger, sadness, and joy.
- the cross-correlation coefficient of normal plus anger shows a larger value than that of joy and sadness
- the cross-correlation coefficient of sadness shows the smallest value.
- the excitement level of each doctor and the degree of excitement calculated by the calculation unit 20 are small because the excitement level of the doctor and the number of data of each emotion are small in the window width of the cross-correlation process (for example, 150 utterance units).
- the value of the cross-correlation coefficient with is unstable, and the reliability of the calculation result is low. Therefore, in the following description, the cross-correlation coefficient after 40 utterance units is used in the case of the doctor shown in FIG.
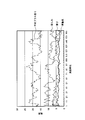
- FIG. 9 shows the change over time in the cross-correlation coefficient between the excitement level of the depressed patient shown in FIG. 5 and the intensity of normal plus anger, sadness, and joy.
- the sadness cross-correlation coefficient shows the largest value
- the pleasure cross-correlation coefficient shows the smallest value after 100 utterance units.
- the value of the cross-correlation coefficient between the degree of excitement calculated by the calculation unit 20 and each emotion during the period from the start of utterance to 100 utterance units is not stable. Is unreliable. Therefore, in the following description, the cross-correlation coefficient after 100 utterance units is used in the case of the depression patient shown in FIG.
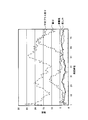
- FIG. 10 shows temporal changes in the cross-correlation coefficient between the excitement level of the general person A shown in FIG. 6 and the strengths of normal plus anger, sadness, and joy.
- the joy cross-correlation coefficient shows the largest value
- the sadness cross-correlation coefficient shows the smallest value after 70 utterance units.
- the value of the cross-correlation coefficient between the degree of excitement calculated by the calculation unit 20 and each emotion is stable between the start of utterance and 70 utterance units. And the reliability of the results is low. Therefore, in the following description, in the case of the general person A shown in FIG. 10, the cross-correlation coefficient after 70 utterance units is used.
- FIG. 11 shows temporal changes in the cross-correlation coefficient between the excitement level of the general person B shown in FIG. 7 and the strengths of normal plus anger, sadness, and joy.
- the joy cross-correlation coefficient shows the largest value
- the sadness cross-correlation coefficient shows the smallest value after 70 utterance units.
- the reliability of the calculation result of the cross-correlation coefficient between the degree of excitement and each emotion by the arithmetic unit 20 is from the start of utterance to 70 utterance units. Since it is low, in the case of the general person B, the cross correlation coefficient after 70 utterance units is used.
- the emotion of normal plus anger or joy shows the strongest correlation with the degree of excitement
- the emotion of sadness is the degree of excitement. Shows the weakest correlation. That is, it can be considered that the healthy subject PA is in a mental state in which emotions can be freely expressed as the excitement increases. Such mental states are often in relatively primitive emotional states such as anger.
- the emotion of sadness has the strongest correlation with the degree of excitement
- the emotion of joy has the weakest correlation with the degree of excitement. That is, even if the subject PA who is a depression patient is in an excited state, it is considered that he is in a mental state that freezes from the bottom of his heart.
- the arithmetic unit 20 uses, for example, the cross-correlation coefficient between the excitement level of each subject PA and the intensity of normal plus anger, sadness, and joy shown in FIGS. 8 to 11, and normal plus anger, sadness and so on in the subject PA. Find the equilibrium between the emotions of joy. That is, a living body such as a human has a property of maintaining a physiological state and a mental state in a predetermined state throughout the living body regardless of changes in internal and external environmental factors. Find the equilibrium state. The property of maintaining a predetermined state throughout the living body is referred to as “homeostasis” or “homeostasis”.
- FIG. 12 shows an example of emotional homeostasis in the subject PA.
- FIG. 12A shows a coordinate system in which coordinate axes representing, for example, normal plus anger, sadness, and joy affect each other at an angle of 120 degrees.
- FIG. 12A shows the cross-correlation coefficients of normal plus anger, sadness and joy obtained by the calculation unit 20 as the strength of each emotion of the subject PA. Expressed as a vector in the coordinate direction.
- the computing unit 20 obtains the balance between emotions from the vector of each emotion shown in FIG. It should be noted that the range of the strength of each emotion of normal plus anger, sadness and joy is equal to the range of the cross-correlation coefficient and is in the range of ⁇ 1 to 1.
- FIG. 12B shows that the emotions in the subject PA obtained by the calculation unit 20 are balanced when the subject PA has normal plus anger, sadness, and joy strength in the vector shown in FIG.
- the equilibrium position P1 is shown.
- the calculation unit 20 obtains the distance between the center of the coordinate system and the equilibrium position P1 of the emotion of the subject PA as a constancy shift amount.
- the calculation unit 20 obtains the constancy shift amount as values ⁇ , ⁇ , and ⁇ on the coordinate axes of normal plus anger, sadness, and joy.
- the calculation unit 20 uses the cross-correlation coefficient of each emotion obtained as a vector component to determine the constancy shift of the subject PA, for example, by using differentiation or integration. Compared with the case of calculating the deviation amount, the calculation process can be speeded up.
- FIG. 13 to FIG. 16 show an example of temporal changes in the constancy shift amounts ⁇ , ⁇ , ⁇ in each subject PA obtained by the calculation unit 20 shown in FIG.
- the vertical axis in FIGS. 13 to 16 shows the amount of shift of each emotion
- the horizontal axis in FIGS. 13 to 16 shows the order of speech units by the subject PA as the time axis.
- the dashed line shows the time change of the shift amount ⁇ in the coordinate axis direction of normal plus anger
- the dotted line shows the time change of the shift amount ⁇ in the coordinate axis direction of sadness
- the broken line shows the shift amount ⁇ in the coordinate axis direction of pleasure.
- the time change of is shown.
- FIG. 13 shows changes over time in the amount of emotional constancy shift in the doctor shown in FIG.
- FIG. 13 shows temporal changes in the shift amounts ⁇ , ⁇ , ⁇ after 40 utterances in which the cross-correlation coefficient between the excitement level and each emotion is stable.
- the normal plus anger deviation amount ⁇ is a positive value and is larger than the sadness and joy deviation amounts ⁇ and ⁇ .
- the sadness shift amount ⁇ of the doctor is smaller than the pleasure shift amount ⁇ and shows a negative value.
- FIG. 14 shows changes over time in the amount of emotional homeostasis in the depressed patient shown in FIG.
- FIG. 14 shows temporal changes in the shift amounts ⁇ , ⁇ , and ⁇ after 100 utterances where the cross-correlation coefficient between the excitement level and each emotion is stable.
- the sadness shift amount ⁇ is a positive value, which is larger than the normal plus anger and joy shift amounts ⁇ and ⁇ .
- the joy shift amount ⁇ in the depressed patient is smaller than the normal plus anger shift amount ⁇ and shows a negative value.
- FIG. 15 shows the change over time in the amount of deviation in emotion constancy in the general person A shown in FIG.
- FIG. 15 shows temporal changes in the shift amounts ⁇ , ⁇ , and ⁇ after 70 utterances in which the cross-correlation coefficient between the excitement level and each emotion is stable.
- the joy shift amount ⁇ is a positive value and is larger than the normal plus anger and sadness shift amounts ⁇ and ⁇ .
- the sadness shift amount ⁇ of the general person A is smaller than the normal plus anger shift amount ⁇ and shows a negative value.
- FIG. 16 shows the change over time of the amount of deviation in emotion constancy in the general person B shown in FIG.
- FIG. 16 shows temporal changes in the shift amounts ⁇ , ⁇ , and ⁇ after 70 utterances in which the cross-correlation coefficient between the excitement level and each emotion is stable.
- the joy shift amount ⁇ is a positive value and is larger than the normal plus anger and sadness shift amounts ⁇ and ⁇ .
- the sadness shift amount ⁇ in the general person B is smaller than the normal plus anger shift amount ⁇ and shows a negative value.
- the estimation unit 30 obtains the distance between the coordinate center shown in FIG. 12B and the equilibrium position P1 based on, for example, the constancy shift amount shown in FIGS.
- the estimation unit 30 estimates the pathological condition of the subject PA based on the shift amounts ⁇ , ⁇ , ⁇ and the obtained distance of the equilibrium position P1. For example, like the doctor shown in FIG. 13, the normal plus anger deviation amount ⁇ is a positive value, the sadness deviation amount ⁇ is a negative value, and is smaller than the deviation amounts ⁇ , ⁇ , and the equilibrium position P1. Is equal to or less than the predetermined value, the estimation unit 30 estimates that the subject PA is healthy (or normal).
- the estimation unit 30 estimates that the subject PA is in that state.
- the estimation unit 30 estimates that the subject PA is healthy (or normal). However, the distance of the equilibrium position P1 is larger than the predetermined value even though the pleasure shift amount ⁇ is a positive value and the sadness shift amount ⁇ is a negative value and smaller than the shift amounts ⁇ and ⁇ . The estimation unit 30 estimates that the subject PA is in that state.
- the estimation unit 30 determines that the subject PA Is estimated to be in a depressed state.
- the magnitude relationship of the shift amounts ⁇ , ⁇ , ⁇ and the relationship between the predetermined value with respect to the distance of the equilibrium position P1 and the disease state for example, International Statistical Classification of Diseases 10th Edition (ICD-10) etc. It should be determined based on this.
- the determined magnitude relationship between the shift amounts ⁇ , ⁇ , ⁇ and the relationship between the predetermined value and the disease state with respect to the distance of the equilibrium position P1 are stored in advance in the storage device of the estimation device 100.
- ICD is an abbreviation for International, Statistical, Classification, of Disseases, and Related, Health, and Problems.
- the predetermined value may be adjusted in consideration of individual differences of the subject PA.
- the estimation unit 30 may determine the pathological condition of the subject PA in detail in consideration of the deviation amounts ⁇ , ⁇ , ⁇ and the distance of the equilibrium position P1 as well as the direction in which the equilibrium position P1 is biased with respect to the coordinate center. .
- the estimation unit 30 may estimate the pathological condition of the subject PA based on the deviation amounts ⁇ , ⁇ , ⁇ .
- the estimation unit 30 may estimate the pathological condition of the subject PA based on, for example, the immobilization or the speed of change of the bias indicated by the homeostasis deviation amounts ⁇ , ⁇ , ⁇ in the subject PA.
- the estimation unit 30 may estimate the pathological condition of the subject PA using the deviation amounts ⁇ , ⁇ , ⁇ calculated by the calculation unit 20 over a long period of time such as two weeks. By using the deviation amount data over a long period of time, the estimation unit 30 can estimate the pathology of the subject PA with high accuracy.
- FIG. 17 shows an example of an estimation process performed by the estimation apparatus 100 shown in FIG. Steps S10 to S40 are executed when the CPU mounted on the estimation device 100 executes the estimation program. That is, FIG. 17 shows another embodiment of the program and the estimation method.
- the extraction unit 10, the calculation unit 20, and the estimation unit 30 illustrated in FIG. 2 are realized by executing a program. Note that the processing illustrated in FIG. 17 may be realized by hardware mounted on the estimation apparatus 100. In this case, the extraction unit 10, the calculation unit 20, and the estimation unit 30 illustrated in FIG. 2 are realized by a circuit arranged in the estimation device 100.
- the extraction unit 10 includes the first information indicating the physiological state of the subject PA based on the information indicating the physiological state of the subject PA measured by the measuring device 1. Second information indicating at least one of emotion and organ activity is extracted.
- step S20 as described with reference to FIGS. 4 to 11, the calculation unit 20 performs a cross-correlation process on the temporal change between the extracted first information and second information, and indicates a mutual degree. A correlation coefficient is calculated.
- step S30 as described with reference to FIG. 12 to FIG. 16, the arithmetic unit 20 obtains a constancy shift amount in the subject PA based on the obtained cross-correlation coefficient.
- step S40 the estimation unit 30 estimates the pathological condition of the subject PA based on the constancy shift amount in the subject PA obtained by the calculation unit 20, as described with reference to FIGS.
- the estimation process by the estimation apparatus 100 ends.
- the flow shown in FIG. 17 may be repeatedly executed every time an instruction from the doctor or the subject PA is received, or may be executed at a predetermined frequency.
- the estimation device 100 outputs the estimation result to the output device 2.
- the output device 2 displays a homeostatic deviation amount together with the estimated pathological result.
- the output device 2 displays the magnitude of the constancy shift amount, that is, the degree of the symptom in the estimated pathological condition or the degree of health in the subject PA, as a color or an animated expression of a person or animal, and displays it on the display. May be.
- the output device 2 may display advice such as a treatment method for the estimated disease state according to the magnitude of the homeostatic deviation amount.
- the first information indicating the physiological state of the subject PA and the second information indicating at least one of the emotion and organ activity of the subject PA are used.
- the amount of sex deviation is calculated.
- the estimation apparatus 100 can easily estimate the pathological condition of the subject PA by referring to the index of the constancy shift amount without having specialized medical knowledge.
- calculation unit 20 uses, for example, a determination tree that indicates the relationship between the fundamental frequency of the utterance and the emotion shown in FIG. The intensity of emotions of normality, sadness, anger and joy may be sought.
- FIG. 18 shows an example of a judgment tree between the heart rate and heart rate variability of the subject PA and the emotion of the subject PA.
- RRV R ⁇ RariVariance
- a normal emotion is defined as a case where the heart rate is less than 80 bps and the RRV is 100 or more.
- sadness is defined as a case where the heart rate is less than 80 bps and the RRV is less than 100.
- An anger emotion is defined as a case where the heart rate is 80 bps or more and the power of the low frequency component LF of the heart rate variability is 80 or more.
- the emotion of joy is defined as a case where the heart rate is 80 bps or more and the power of the low frequency component LF is less than 80.
- the calculation unit 20 calculates the constancy shift amounts ⁇ , ⁇ , ⁇ in the subject PA as shown in FIG. 12C. For example, the shift amounts ⁇ , ⁇ , ⁇ as shown in FIG. You may ask for.
- FIG. 19 shows another example of emotional homeostasis in the subject PA.
- the coefficient h shown in FIG. 19 is an index indicating which of the deviation amount ⁇ in the coordinate axis direction of pleasure and the deviation amount ⁇ in the coordinate axis direction of sadness is larger in the vector V1 from the center of the coordinate system toward the equilibrium position P1. . That is, the coefficient h indicates a positive value when the joy shift amount ⁇ is greater than the sadness shift amount ⁇ , and indicates a negative value when the sadness shift amount ⁇ is greater than the joy shift amount ⁇ .
- the coefficient h is 0.
- the computing unit 20 obtains an angle ⁇ between the vector V1 and the pleasure coordinate axis, for example, to obtain the coefficient h.
- the angle ⁇ indicates a small value close to 0 degrees (that is, the direction of the vector V1 is the direction of the pleasure coordinate axis) when the pleasure shift amount ⁇ is larger than the sadness shift amount ⁇ .
- the angle ⁇ indicates a large value in which the direction of the vector V1 is close to the coordinate axis direction of the sadness. As shown in FIG.
- the calculation unit 20 includes a case where the equilibrium position P1 is in a region between pleasure and sadness (counterclockwise) (hereinafter, region A) and a region between pleasure and sadness (clockwise).
- region A a region between pleasure and sadness
- region B a region between pleasure and sadness
- the direction of the vector V1 is the negative direction of the coordinate axis of normal plus anger.
- the joy shift amount ⁇ and the sadness shift amount ⁇ antagonize each other and indicate a shift amount larger than the normal plus anger shift amount ⁇ .
- the normal plus anger shift amount ⁇ indicates a smaller shift amount than the pleasure shift amount ⁇ and the sadness shift amount ⁇ . Therefore, when the vector V1 is in the region A, the calculation unit 20 obtains
- the direction of the vector V1 is the positive direction of the coordinate axis of normal plus anger.
- the amount of joy shift ⁇ and the amount of sadness shift ⁇ are antagonistic to each other but are smaller than the normal plus anger shift ⁇ .
- the normal plus anger shift amount ⁇ is larger than the pleasure shift amount ⁇ and the sadness shift amount ⁇ . Therefore, when the vector V1 is in the region B, the arithmetic unit 20 obtains L ⁇
- the calculation unit 20 can calculate the positive shift amount ⁇ when the equilibrium position P1 is near the positive normal plus anger axis, and is negative when the equilibrium position P1 is near the negative normal plus anger axis.
- the shift amount ⁇ can be calculated.
- the estimation unit 30 uses the shift amounts ⁇ , ⁇ , and ⁇ shown in FIG. 19 so that the shift amount ⁇ of sadness is a positive value larger than 0, and the shift amounts ⁇ , ⁇ of normal plus anger and joy are set to 0. If the value is near small, it is estimated that the subject PA is in a depressed state. Further, the estimation unit 30 determines that the subject PA is in such a state when the joy shift amount ⁇ is a positive value larger than 0 and the normal plus anger and sadness shift amounts ⁇ and ⁇ are close to 0. presume.
- the estimation unit 30 antagonizes the subject PA. Presumes that he is so depressed.
- FIG. 20 shows another embodiment of the estimation device and the estimation process. Elements having the same or similar functions as those described in FIG. 2 are denoted by the same or similar reference numerals, and detailed description thereof will be omitted.
- the estimation device 100a is connected to the measurement device 1a and the output device 2 in a wired or wireless manner via an interface unit included in the estimation device 100a. Thereby, the estimation apparatus 100a, the measurement apparatus 1a, and the output apparatus 2 operate
- the measuring device 1a includes, for example, a microphone, a heart rate meter, an electrocardiograph, a blood pressure meter, a thermometer, a skin resistance meter, or a plurality of devices such as a camera and an MRI (Magnetic-Resonance-Imaging) device, and information indicating the physiology of the subject PA. Measure.
- the measuring device 1a outputs information indicating the measured physiology of the subject PA to the estimating device 100a.
- the measuring device 1a may include an acceleration sensor or an electronic gyro.
- Information indicating the physiology of the subject PA measured by the measuring device 1a includes, for example, the heart rate (pulse rate), heart rate variability, blood pressure, body temperature, sweating amount (skin resistance, skin potential), eye movement, pupil, along with audio signals. It has a diameter and number of blinks.
- the physiological information to be measured includes, for example, inhalation, hormones, internal secretions such as biomolecules, brain waves, fMRI (functional MRI) information, and the like.
- the estimation apparatus 100a includes an extraction unit 10a, a calculation unit 20a, an estimation unit 30a, a test unit 40, and a storage unit 50.
- the functions of the extraction unit 10a, the calculation unit 20a, the estimation unit 30a, and the test unit 40 may be realized by a program executed by the CPU, or may be realized by hardware.
- the extraction unit 10a extracts the first information indicating the physiological state of the subject PA from the information indicating the physiological state of the subject PA measured by the measuring device 1a in the same or similar manner as the extraction unit 10 illustrated in FIG. Further, the extraction unit 10a is the same as or similar to the extraction unit 10 shown in FIG. 2, and information on the physiology of the subject PA measured by the measuring device 1a is used to determine the emotion in the subject PA and the heart and intestine of the subject PA. Second information indicating at least one of organ activities is extracted.
- the extraction unit 10a extracts, for example, the heart rate (pulse rate) measured by a heart rate meter or the like included in the measurement device 1a as second information indicating the emotion or organ activity in the subject PA.
- the heart rate pulse rate
- it has the property that the pulsation of the heart increases by increasing the amount of adrenaline secretion in the body due to excitement and tension, and the heart rate (pulse rate) increases.
- the extraction unit 10a performs frequency analysis such as FFT on the electrocardiogram waveform of the subject PA measured using the electrocardiograph included in the measuring device 1a, and acquires the heart rate variability of the subject PA. Then, the extraction unit 10a compares the amount of the acquired low-frequency component LF (for example, 0.04 to 0.14 hertz) and the high-frequency component HF (for example, 0.14 to 0.5 hertz) of the heartbeat variability. The level of PA excitement and tension is extracted as first information indicating the physiological state of the subject PA.
- the low frequency component LF of heart rate variability mainly increases with the activity of the sympathetic nerve
- the high frequency component HF has a property of increasing with the activity of the parasympathetic nerve.
- the extraction unit 10a extracts, for example, a blood pressure value measured using a sphygmomanometer included in the measurement device 1a as second information indicating the emotion of the subject PA and the activity of the organ.
- blood pressure has the property that when blood vessels contract with excitement or tension, blood flow resistance increases and blood pressure increases.
- the extraction unit 10a extracts, for example, the value of the body temperature measured using a thermometer included in the measuring device 1a as the second information indicating the emotion of the subject PA and the activity of the organ.
- body temperature has the property that an increase in heart rate, an increase in blood sugar level, a tension in muscle, and the like occur due to excitement and tension, and heat is generated in the body to increase body temperature.
- the extraction unit 10a uses, for example, the value of the sweating amount (skin resistance, skin potential) measured by using a skin resistance meter included in the measuring device 1a to indicate the emotion and organ activity in the subject PA. Extract as The amount of perspiration (skin resistance, skin potential) has the property that perspiration is promoted by excitement and tension, and the skin resistance decreases.
- the extraction unit 10a uses, for example, eye movements, pupil diameters, and the number of blinks measured using an electrooculometer, a camera, or the like of the measurement apparatus 1a as the second information indicating the emotion or organ activity in the subject PA. Extract.
- the extraction unit 10a performs face recognition processing on an image photographed by a camera or the like, and extracts the recognized facial expression and the temporal change of the facial expression as second information indicating the emotion and organ activity in the subject PA. May be.
- the movement of the eyeball is such that the movement of the eyeball becomes intense due to excitement and tension
- the pupil diameter has the property that the pupil expands due to excitement and tension
- the number of blinks increases due to the excitement and tension.
- the extraction unit 10a determines, for example, the number of breaths, the number of breaths, the speed, the amount of exhaust, and the like measured from the respiratory volume and respiratory sound by a respiratory meter (respiratory flow meter), a spirometer, or a microphone included in the measuring device 1a. This is extracted as second information indicating emotions and organ activities. Exhalation has the property that the number of breaths, speed, and displacement increase due to excitement and tension.
- the extraction unit 10a extracts, for example, each endocrine product such as a hormone or a biomolecule measured using an analysis device included in the measurement device 1a as second information indicating emotion or organ activity in the subject PA.
- endocrine secretions such as hormones and biomolecules are measured by the chemical analyzer of saliva, blood, lymph, sweat, digestive fluid, urine, etc. collected from the subject PA by the analyzer of the measuring device 1a.
- the endocrine secretion may be measured by the measuring device 1a from the peripheral blood vessel, digestive system, myoelectric potential, skin temperature, blood flow volume, immune system or the like in the subject PA.
- Endocrine secretions have the property that the excretion or tension changes the amount or quality of hormones or biomolecules secreted in the body.
- the extraction unit 10a shows the amount of change with respect to time of the electroencephalogram measured using a brain activity meter such as an optical type, a magnetic type or a potential type included in the measuring device 1a. It extracts as the 1st information to show.
- the electroencephalogram has the property that the waveform changes due to excitement and tension.
- the extraction unit 10a determines the blood flow volume and oxyhemoglobin distribution in each active site in the brain included in the fMRI information measured by the MRI apparatus included in the measurement apparatus 1a, and the emotion and organ activity in the subject PA. It extracts as the 2nd information which shows.
- the measured fMRI information has a property that an active site in the brain changes due to excitement or tension. For example, emotional excitement and tension appear as changes in blood flow in the limbic system (amygdala), hypothalamus, cerebellum, brainstem or hippocampus. Such a change in blood flow changes the distribution of oxyhemoglobin in the brain.
- the extraction unit 10a may extract the movement of the subject PA as second information indicating the emotion or organ activity in the subject PA.
- the calculation unit 20a calculates the degree of similarity of the time change between the first information and the second information extracted by the extraction unit 10a. For example, the computing unit 20a performs a cross-correlation process of the time change between the extracted first information and the second information, and calculates the cross-correlation coefficient as a degree of similarity. The computing unit 20a obtains a constancy shift amount in the subject PA using the plurality of similarities in the emotion and organ activity of the subject PA calculated. The operation and constancy of the calculation unit 20a will be described with reference to FIG.
- the test unit 40 calculates energy acting on the emotion and organ activity of the subject PA from the constancy shift calculated by the calculation unit 20a.
- the test unit 40 inputs the calculated energy into a calculation model representing the living body of the subject PA, and simulates homeostasis in the subject PA.
- the calculation model and the operation of the test unit 40 will be described with reference to FIGS.
- the storage unit 50 is a hard disk device, a memory, or the like.
- the storage unit 50 stores a program executed by the CPU. Further, the storage unit 50 stores data 60 indicating the result of the simulation by the test unit 40. The data 60 will be described with reference to FIG.
- the program for executing the estimation process can be recorded and distributed on a removable disk such as a CD (Compact Disc) or a DVD (Digital Versatile Disc).
- the estimation device 100a may download a program for executing the estimation process from a network via a network interface included in the estimation device 100a and store the program in the storage unit 50.
- the estimation unit 30a estimates the pathology of the subject PA from the pattern of homeostasis simulated by the test unit 40. The operation of the estimation unit 30a will be described with reference to FIGS.
- FIG. 21 schematically shows an example of a homeostatic chain in the subject PA.
- the balance of homeostasis in the whole living body of the subject PA is represented by the rotation of a circular figure, and is defined as a circulatory system 200.
- the circulatory system 200 further includes a plurality of circulatory systems K (K1-K10) such as substances and organs that form the subject PA, for example.
- the circulatory system K1-K10 is represented by a circular rotation smaller than the circulatory system 200 that is linked to each other to maintain the balance of homeostasis.
- the circulatory system K1 shows the homeostasis of the subject PA based on the voice signal uttered by the subject PA via the vocal cords.
- the circulatory system K2 indicates heart homeostasis in the subject PA based on, for example, heart rate and heart rate variability.
- the circulatory system K3 indicates the homeostasis of the digestive system in the subject PA such as the stomach, the small intestine, and the large intestine.
- the circulatory system K4 indicates, for example, the homeostasis of the immune system that protects the subject PA from illness and the like.
- the circulatory system K5 indicates, for example, the homeostasis of a hormone that transmits information that regulates the function of an organ included in the living body of the subject PA.
- the circulatory system K6 shows homeostasis of biomolecules such as plural kinds of proteins generated by the gene of the subject PA, for example.
- the circulatory system K7 shows, for example, the homeostasis of the gene of the subject PA.
- the circulatory system K8 shows, for example, the homeostasis of the cells that form the subject PA.
- the circulatory system K9 indicates, for example, homeostasis in the limbic system of the subject PA including the amygdala among the brain closely related to the emotion.
- the circulatory system K10 shows homeostasis of a neurotransmitter that mediates information transmission at a synapse, for example.
- the circulation system 200 has 10 circulation systems K1 to K10, the circulation system 200 is not limited to this and may include a plurality of circulation systems other than 10.
- Each circulation system K may further include a plurality of circulation systems.
- the circulatory system K1 of the vocal cords may have a plurality of circulatory systems showing emotions such as anger, normality, sadness, and joy in the subject PA.
- the cardiac circulatory system K2 may include a plurality of circulatory systems that indicate, for example, the heart rate and heart rate variability in the subject PA.
- the calculation unit 20a uses a plurality of similar degrees in the emotion and organ activity of the subject PA calculated, for example, to calculate the constancy shift amount in each circulatory system K in the subject PA as described in FIG. Ask. For example, similarly to the calculation unit 20 illustrated in FIG. 2, the calculation unit 20 a calculates the amount of emotional constancy shift in the subject PA based on the voice signal of the subject PA. In addition, the calculation unit 20a, for example, with respect to the temporal change of the excitement level or the tension level obtained from the ratio between the low frequency component LF and the high frequency component HF of the heart rate fluctuation measured by the electrocardiograph, the heart rate, the blood pressure, and the like. To perform cross-correlation processing.
- the calculating part 20a calculates the deviation
- the arithmetic unit 20a calculates the constancy shift amount in all the circulatory systems K1-K10, but may calculate the constancy shift amount in some of the circulatory systems K.
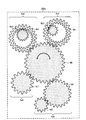
- FIG. 22 shows an example of a calculation model of the circulatory system 200 used by the test unit 40 shown in FIG. 20 for simulation of homeostasis in the subject PA.
- the circulatory system K1-K10 included in the circulatory system 200 shown in FIG. 21 is represented by a shaft SH (SH1-SH10), Built in.
- the length, pitch width, thread direction, and the like of each of the shafts SH1 to SH10 are determined based on the characteristics of the living body of the subject PA.
- the shafts SH1 to SH10 are connected at the joint B1 so that the centers of the axes between the shafts coincide with each other, thereby forming the circulation system 200.
- nuts NT1-NT10 are arranged on the shafts SH1-SH10 of the circulation system K1-K10.
- the test unit 40 simulates the homeostasis in the circulation system 200 by rotating the shaft SH, and detects the homeostasis state in each of the circulation systems K1-K10 from the change in the position of the nuts NT1-NT10.
- the length, pitch width, screw thread direction, and the like of the shaft SH1 of the vocal cord circulation system K1 are determined based on, for example, the frequency distribution indicated by the speech signal of the speech by the subject PA, and the frequency characteristics such as inflection and pitch frequency. Is done. Further, the length, pitch width, screw thread direction, and the like of the shaft SH2 of the cardiac circulatory system K2 are determined based on characteristics such as the heart beat time interval of the subject PA and the frequency distribution of heartbeat variability, for example. .
- the length, pitch width, and thread direction of the shaft SH3 of the circulatory system K3 of the digestive system are, for example, characteristics such as the length of the small intestine and large intestine of the subject PA or the moving speed of contraction waves accompanying peristalsis To be determined.
- the length, pitch width, and thread direction of the circulatory system K4 of the immune system are, for example, the number of leukocytes including neutrophils, eosinophils, basophils, lymphocytes, monocytes, etc. in the blood of the subject PA. Determined based on the characteristics of The length of the circulatory system K5, the pitch width, the direction of the thread, etc. are, for example, the amount of hormone synthesized or secreted in each organ of the subject PA, the rate at which the hormone circulates in the body by body fluid such as blood, etc. Determined based on the characteristics of
- the length, pitch width, screw thread direction, etc. of the circulatory system K6 of biomolecules are, for example, nucleic acids, proteins, polysaccharides, amino acids that are constituents thereof, and various kinds of foods ingested by the subject PA. It is determined based on the amount of sugar, as well as the intake of lipids and vitamins.
- the length, pitch width, and thread direction of the gene circulation system K7 are determined based on characteristics such as the frequency of gene division and the length of the gene of the subject PA, for example.
- the length, pitch width, and thread direction of the cell circulatory system K8 are, for example, the amount of carbohydrates, lipids, proteins (amino acids), nucleic acids, etc.
- the length, pitch width, screw thread direction, and the like of the circulatory system K9 of the brain are determined based on characteristics such as temporal variation of the brain activity including the amygdala and the frequency distribution in the brain of the subject PA.
- the length, pitch width, and thread direction of the neurotransmitter circulatory system K10 are, for example, dependent on the secretion amount and characteristic reaction rate of amino acids, peptides, monoamines, etc. that mediate information transmission at the synapse of the subject PA. To be determined.
- Information indicating the length, pitch width, screw thread direction, and the like of each of the set shafts SH1 to SH10 is stored in advance in the storage unit 50 for each subject PA. Further, for example, the test unit 40 receives information indicating the length, pitch width, screw thread direction, and the like of each of the shafts SH1 to SH10 of the subject PA via an input device such as a keyboard or a touch panel included in the estimation device 100a. You may receive it.
- the test unit 40 calculates the energy acting on the emotion and organ activity of the subject PA from the constancy shift amount in each of the circulatory systems K1-K10 calculated by the calculation unit 20a. For example, as shown in FIG. 12B, when the emotional equilibrium position P1 in the subject PA calculated by the calculation unit 20a is different from the center of the coordinate system, similar to the calculation unit 20 shown in FIG. It shows that the emotion of the PA, that is, the constancy of the circulatory system K1 is displaced from the predetermined state. The deviation of homeostasis appears in the subject PA in the form of stress, for example, and affects not only the circulatory system K1 of the subject PA but also other circulatory systems K2-K10 such as the heart or digestive system.
- the test unit 40 calculates the energy acting on the emotion of the subject PA such as stress and the activity of the organ from the constancy shift amount calculated for each of the circulatory systems K1 to K10 by the calculation unit 20a.
- the test unit 40 calculates energy E (K1) from the emotion constancy shift amounts ⁇ , ⁇ , ⁇ calculated by the calculation unit 20a in the vocal cord circulation system K1.
- E (K1) sqrt ( ⁇ ⁇ ⁇ + ⁇ ⁇ ⁇ + ⁇ ⁇ ⁇ ) (1)
- the test unit 40 calculates the energy E (K1) generated in the vocal circulatory system K1 from the constancy shift amounts ⁇ , ⁇ , ⁇ of the emotion as shown in the equation (1).
- the energy E (K1) may be calculated using a function F ( ⁇ , ⁇ , ⁇ ) having the constancy shift amounts ⁇ , ⁇ , ⁇ as variables.
- the test unit 40 For each of the circulatory systems K2 to K10, the test unit 40 uses the amount of heat consumed by stress, exercise, etc. or the ingested food, etc. as energy from the constancy shift in each circulatory system K calculated by the arithmetic unit 20a. Calculated as E (K2) -E (K10), respectively. The test unit 40 sums the energy calculated in each of the circulation systems K1 to K10 using the equation (2).
- TE E (K1) + E (K2) + E (K3) + E (K4) + E (K5) + E (K6) + E (K7) + E (K8) + E (K9) + E (K10) (2)
- E (K2), E (K3), E (K4), E (K5), E (K6), E (K7), E (K8), E (K9), and E (K10) are circulating.
- the energy generated in the system K2-K10 is shown.
- TE indicates the total energy.
- the test unit 40 calculates the energy TE by summing the energy E (K1) -E (K10) generated in each of the circulation systems K1-K10, but weights the energy E (K1) -E (K10).
- the energy TE may be obtained by addition.
- the test unit 40 may obtain the energy TE by multiplying the energy E (K1) ⁇ E (K10).
- the test unit 40 inputs the calculated energy TE to the circulation system 200 and rotates the shaft SH at a rotation speed corresponding to the magnitude of the energy TE. For example, when the energy TE is a positive value, the test unit 40 rotates the shaft SH clockwise, and when the energy TE is a negative value, the test unit 40 rotates the shaft SH counterclockwise.
- the input energy TE is applied by the test unit 40 so that the displacement amounts L1-L10 in which the nuts NT1-NT10 are displaced in accordance with the rotation of the shaft SH are within the range of the lengths of the shafts SH1-SH10. Be controlled.
- the energy TE becomes a positive or negative value because, for example, the energy that causes the shaft SH to rotate clockwise or counterclockwise depends on the direction of the thread of each of the shafts SH1 to SH10 in the circulation system K1 to K10. This is because it is generated. That is, for example, in the circulation system K in which the shaft SH rotates clockwise according to the direction of the thread, positive energy is generated, and in the circulation system K in which the shaft SH rotates counterclockwise, negative energy is generated. . Note that, for example, when the energy TE is a negative value, the test unit 40 rotates the entire shaft SH1-SH10 clockwise, and when the energy TE is a positive value, the entire shaft SH1-SH10 rotates counterclockwise. You may let them.
- the test unit 40 displaces the position of the nuts NT1-NT10 by rotating the shafts SH1-SH10 with energy TE.
- the test unit 40 uses the displacements L1-L10 of the nuts NT1-NT10 from the centers C1-C10 of the shafts SH1-SH10 as changes in the homeostasis (or deviations in homeostasis) of the circulation systems K1-K10.
- the test unit 40 stores the detected displacement amounts L1 to L10 as data 60 in the storage unit 50.
- the test unit 40 detects from the displacements L1-L10 the speed at which the nuts NT1-NT10 move in the axial directions of the shafts SH1-SH10.
- the test unit 40 inputs the velocity detected in the circulation system K1-K10 to the circulation system 200 as newly generated energy E (K1) -E (K10).
- the test unit 40 determines that some of the circulation systems K calculated by the calculation unit 20a.
- the energy TE may be obtained from the constancy shift amount at, and the constancy of the circulatory system 200 may be simulated based on the obtained energy TE.
- the test unit 40 may detect all the displacements L1-L10 in the circulation system K1-K10 from the simulation. Since the test unit 40 detects the displacement amount L of all the circulatory systems K from the simulation, the estimation device 100a is more subject than the case where the constancy shift amount in the circulatory system K calculated by the arithmetic unit 20a is used.
- the pathological condition of PA can be estimated with high accuracy.
- test unit 40 uses the distances from the centers C1-C10 of the shafts SH1-SH10 as the displacements L1-L10 in the respective circulation systems K1-K10, it is not limited to this.
- the displacement amount L1-L10 may be the distance between the nuts NT1-NT10 or the distance from the joint B1.
- FIG. 23 shows an example of data 60 of the displacement L1-L10 of each circulation system K1-K10 in the subject PA.
- the data 60 has storage areas for the date and the circulation system K1-K10, respectively.
- the date and time (for example, October 2013) when the test unit 40 executes a simulation of the change in constancy of the circulatory system 200 and detects the displacement L1-L10 in each of the circulatory systems K1-K10. 29th, 9: 10: 0, etc.) are stored.
- the time interval at which the test unit 40 detects the displacements L1-L10 is 1 minute, 1 hour, 1 day, 1 week, 1 month, etc. In the case of the data 60 shown in FIG. Time interval.
- the displacement amounts L1-L10 of the nuts NT1-NT10 detected by the test unit 40 are stored.
- the units of the displacements L1-L10 are centimeters, millimeters, etc.
- the estimation unit 30a reads the date of the data 60 and the displacements L1-L10 in the circulation system K1-K10 from the storage unit 50.
- the estimation unit 30a estimates the pathological condition of the subject PA from the time variation patterns of the read displacement amounts L1-L10.
- the storage unit 50 stores in advance data of typical time variation patterns of the displacement amounts L1-L10 indicated by the circulatory systems K1-K10 when the subject PA is healthy.
- the estimation unit 30a compares the time change of the displacement amount L1-L10 detected by the test unit 40 with a typical time change of the displacement amount L1-L10 when the subject PA is healthy, The pathological condition of the subject PA is estimated from the results. For example, the estimation unit 30a obtains a pattern difference between the time change of the displacement amount L1-L10 detected by the test unit 40 and a typical time change of the displacement amount L1-L10 when the subject PA is healthy. The obtained difference is compared with a predetermined threshold value indicating each disease state.
- the estimation unit 30a calculates the time variation of the displacement amount L2 detected by the test unit 40 and a typical time variation of the displacement amount L2 when the subject PA is healthy. Find the difference.
- the estimation unit 30a compares a predetermined threshold value indicating a heart disease such as myocardial infarction or angina pectoris and the obtained difference, and determines whether the subject PA suffers from a heart disease such as myocardial infarction or angina Estimate whether or not.
- FIG. 24 shows an example of an estimation process performed by the estimation apparatus 100a shown in FIG. Steps S100 to S160 are realized by the CPU installed in the estimation device 100a executing the estimation program. That is, FIG. 24 shows another embodiment of the estimation program and the estimation method.
- the extraction unit 10a, the calculation unit 20a, the estimation unit 30a, and the test unit 40 illustrated in FIG. 20 are realized by executing the estimation program.
- the processing illustrated in FIG. 24 may be realized by hardware mounted on the estimation device 100a.
- the calculation unit 10a, the calculation unit 20a, the estimation unit 30a, and the test unit 40 illustrated in FIG. 20 are realized by a circuit arranged in the estimation device 100a.
- step S100 as described in FIG. 20, the extraction unit 10a, based on the information indicating the physiology of the subject PA measured by the measurement device 1a, the first information indicating the physiology state of the subject PA, the emotion and Second information indicating the state of activity of the organ is extracted.
- step S110 as described with reference to FIG. 21, the calculation unit 20a performs a cross-correlation process on the temporal change between the extracted first information and second information, and shows a cross-correlation coefficient indicating the degree of similarity. Is calculated.
- step S120 as described with reference to FIGS. 12 and 21, the calculation unit 20a obtains a constancy shift amount in each of the circulation systems K1-K10 of the subject PA based on the obtained cross-correlation coefficient.
- step S130 the test unit 40 calculates energy E (K1) -E (K10) from the constancy shift amount in each of the circulation systems K1-K10 calculated by the calculation unit 20a. . Using the equation (2), the test unit 40 adds the calculated energies E (K1) -E (K10) to obtain the energy TE.
- step S140 as described in FIG. 22, the test unit 40 inputs the energy TE totaled in step S130 to the circulatory system 200, and simulates the homeostasis of the circulatory system 200 in the subject PA.
- step S150 the test unit 40 detects the displacement amounts L1-L10 in each circulation system K1-K10 from the constancy simulation executed in step S140.
- the test unit 40 stores the detected displacements L1-L10 in each circulation system K1-K10 as data 60 in the storage unit 50.
- the estimation unit 30a estimates the pathological condition of the subject PA from the temporal change patterns of the displacement amounts L1-L10 in the circulatory system K1-K10. For example, the estimating unit 30a compares the time variation pattern of the displacement amount L1-L10 detected by the test unit 40 with a typical time variation pattern of the displacement amount L1-L10 when the subject PA is healthy, The pathological condition of the subject PA is estimated from the comparison result.
- the estimation process by the estimation apparatus 100a ends.
- the flow shown in FIG. 24 may be repeatedly executed every time an instruction from the doctor or the subject PA is received, or may be executed at a predetermined frequency.
- the estimation device 100a outputs the estimation result to the output device 2.
- the output device 2 displays a homeostatic deviation amount together with the estimated pathological result.
- the output device 2 displays the magnitude of the constancy shift amount, that is, the degree of the symptom in the estimated pathological condition or the degree of health in the subject PA, as a color or an animated expression of a person or animal, and displays it on the display. May be.
- the output device 2 may display advice such as a treatment method for the estimated disease state according to the magnitude of the homeostatic deviation amount.
- the estimation apparatus 100a can easily estimate the pathological condition of the subject PA by referring to the index of the constancy shift amount without having specialized medical knowledge.
- the estimation device 100a executes a constancy simulation in the subject PA using the constancy shift amount in each circulation system K as input energy.
- the estimation apparatus 100a compares the time change of homeostasis detected from the executed simulation with the time change of homeostasis shown when the subject PA is healthy, so that the pathological condition of the subject PA can be accurately compared to the conventional case. Can be estimated.
- FIG. 25 shows another embodiment of the estimation device. Elements having the same or similar functions as those described in FIG. 20 are denoted by the same or similar reference numerals, and detailed description thereof will be omitted.
- the estimation device 100b, the measurement device 1a, and the output device 2 operate as the estimation system SYS.
- the estimation device 100b shown in FIG. 25 is a computer device having an arithmetic processing device such as a CPU and a storage device such as a hard disk device.
- the estimation device 100b is connected to the measurement device 1a and the output device 2 in a wired or wireless manner via an interface unit included in the estimation device 100b. Accordingly, the estimation device 100b, the measurement device 1a, and the output device 2 operate as the estimation system SYS.
- the estimation device 100b includes an extraction unit 10a, a calculation unit 20a, an estimation unit 30b, a test unit 40a, and a storage unit 50a.
- the functions of the extraction unit 10a, the calculation unit 20a, the estimation unit 30b, and the test unit 40a may be realized by a program executed by the CPU or may be realized by hardware.
- the storage unit 50a is a hard disk device, a memory, or the like.
- the storage unit 50a stores a program executed by the CPU.
- the storage unit 50a stores data 60a indicating the result of simulation by the test unit 40a, and a pathological condition table 70 for the estimation unit 30b to determine the pathological condition of the subject PA using the data 60a.
- the data 60a and the disease state table 70 will be described with reference to FIGS.
- the program for executing the estimation process can be recorded and distributed on a removable disk such as a CD or a DVD, for example.
- the estimation device 100b may download a program for executing the estimation process from a network via a network interface included in the estimation device 100b and store the program in the storage unit 50a.
- the test unit 40a calculates the energy acting on the emotion and organ activity of the subject PA from the constancy shift calculated by the calculation unit 20a.
- the test unit 40a inputs the calculated energy to a calculation model representing the living body of the subject PA, and simulates homeostasis in the subject PA.
- the calculation model and the operation of the test unit 40a will be described with reference to FIG.
- the estimation unit 30b estimates the pathology of the subject PA from the pattern of homeostasis simulated by the test unit 40a. The operation of the estimation unit 30b will be described with reference to FIGS.
- FIG. 26 shows an example of a calculation model of the circulatory system 200a in which the test unit 40a shown in FIG. 25 uses the homeostasis in the subject PA for simulation.
- the calculation model of the circulatory system 200a shown in FIG. 26 includes, for example, four circulatory systems Ka (Ka1-Ka4) included in the circulatory system 200a.
- Circulation system 200a and circulation system Ka1-Ka4 included in circulation system 200a are represented by gear MG and gears Ga1-Ga2, Gb1-Gb2, Gc1, Gd1-Gd2, and are constructed in a virtual space such as a computer device.
- the gear MG rotates based on energy E (Ka1) -E (Ka4) calculated from the constancy shift amount in each circulation system Ka1-Ka4 obtained by the calculation unit 20a.
- E Ka1 -E (Ka4)
- the gears Ga1-Ga2, Gb1-Gb2, Gc1, Gd1-Gd2 of each circulation system Ka1-Ka4 rotate.
- each of the circulation systems Ka1, Ka2, Ka4 has two gears Ga1-Ga2, Gb1-Gb2, Gd1-Gd2, and the circulation system Ka3 has one gear Gc1.
- each circulation system Ka1-Ka4 the diameter and number of teeth of the gear MG and the number, diameter, number of teeth, and the like included in each circulation system Ka1-Ka4 are determined based on the characteristics of the living body of the subject PA.
- the test unit 40a simulates homeostasis in the circulation system 200a by rotating the gear MG, and detects the homeostasis state in each of the circulation systems Ka1 to Ka4 from the rotation speeds of the gears Ga2, Gb2, Gc1, and Gd2. .
- the number of gears, the diameter, the number of teeth, etc. included in the circulatory system Ka are frequency characteristics such as frequency distribution, inflection and pitch frequency in the speech signal uttered by the subject PA, for example. To be determined.
- the number of gears, the diameter, the number of teeth, etc. included in the circulatory system Ka are determined based on characteristics such as the heart beat time interval and the frequency distribution of heartbeat variability, for example. Is done.
- the circulatory system Ka is a digestive system, the number of gears, the diameter, the number of teeth, etc.
- the circulatory system Ka included in the circulatory system Ka are, for example, the length of the small intestine, the large intestine, etc., or the moving speed of contraction waves accompanying peristalsis Determined based on the characteristics of
- the number of gears, diameter, number of teeth, etc. included in the circulatory system Ka are, for example, neutrophils, eosinophils, basophils, lymphocytes in the blood of the subject PA. It is determined based on the characteristics of the white blood cell count including monocytes.
- the number of gears, the diameter, the number of teeth, etc. included in the circulatory system Ka are, for example, the amount of hormone synthesized or secreted in each organ of the subject PA, blood, etc. It is determined on the basis of characteristics such as the rate at which hormones circulate in the body by body fluids.
- the number of gears, the diameter, the number of teeth, etc. included in the circulatory system Ka are, for example, nucleic acids, proteins, polysaccharides, constituents thereof contained in food etc. taken by the subject PA It is determined based on the intake amount of amino acids and various sugars as well as lipids and vitamins.
- the number of gears, the diameter, the number of teeth, etc. included in the circulatory system Ka are determined based on characteristics such as the frequency of gene division and the length of the gene in the subject PA, for example.
- the circulatory system Ka included in the circulatory system Ka are, for example, the time variation of the brain activity including the amygdala, the frequency distribution, etc. Determined based on characteristics.
- the number of gears, diameter, number of teeth, etc. contained in the circulatory system Ka include, for example, the secreted amount of amino acids, peptides, monoamines, etc. that mediate information transmission at synapses. It is determined based on the characteristic reaction rate.
- Information indicating the set diameter and the number of teeth of the gear MG and the number of gears, the diameter and the number of teeth of each of the gears Ga1-Ga2, Gb1-Gb2, Gc1, Gd1-Gd2 are stored in the storage unit 50 of the estimation device 100b. , Stored in advance for each subject PA. Further, the test unit 40, for example, via the input device such as a keyboard included in the estimation device 100b, the diameter and the number of teeth of the gear MG, and the gears of the gears Ga1-Ga2, Gb1-Gb2, Gc1, Gd1-Gd2 You may receive the information which shows the number of teeth, a diameter, the number of teeth, etc.
- each circulation system Ka may further include a plurality of circulation systems.
- the circulatory system Ka when the circulatory system Ka is a vocal cord, the subject PA may have a plurality of gears indicating a plurality of circulatory systems indicating emotions such as anger, normality, sadness, and joy.
- the circulatory system Ka when the circulatory system Ka is a heart, for example, it may have a plurality of gears indicating a plurality of circulatory systems indicating the heart rate, heart rate variability, etc. in the subject PA.
- the test unit 40a uses the equations (1) and (2) to calculate the energy from the constancy shift amount in each of the circulation systems Ka1-Ka4 calculated by the calculation unit 20a.
- TE is calculated.
- the test unit 40a inputs the calculated energy TE to the circulation system 200a, and rotates the gear MG at a rotation speed corresponding to the magnitude of the energy TE. For example, when the energy TE is a positive value, the test unit 40a rotates the gear MG clockwise, and when the energy TE is a negative value, the test unit 40a rotates the gear MG counterclockwise. Note that, for example, the test unit 40a may rotate the gear MG counterclockwise when the energy TE is a positive value, and rotate the gear MG clockwise when the energy TE is a negative value.
- the test unit 40a simulates the homeostasis in the circulation system 200a by rotating the gear MG, and detects, for example, the homeostasis state in each of the circulation systems Ka1 to Ka4 as the rotation speed of the gear.
- the test unit 40a stores the detected rotation speed R1-R4 in the storage unit 50a. Further, the test unit 40a inputs the rotation speed R1-R4 detected in each circulation system Ka1-Ka4 to the circulation system 200a as newly generated energy E (Ka1) -E (Ka4).
- the test unit 40a uses the partial circulation system Ka calculated by the calculation unit 20a.
- the energy TE may be obtained from the constancy shift amount at, and the homeostasis of the circulation system 200a may be simulated based on the obtained energy TE.
- the test unit 40a may detect all the rotational speeds R1-R4 in the circulation system Ka1-Ka4 from the simulation. Since the test unit 40a detects the rotational speed R of all the circulatory systems Ka from the simulation, the estimation device 100b is more subject than the case where the constancy shift amount in the circulatory system Ka calculated by the arithmetic unit 20a is used.
- the pathological condition of PA can be estimated with high accuracy.
- FIG. 27 shows an example of data 60a of the rotational speeds R1-R4 of each circulatory system Ka1-Ka4 in the subject PA.
- the data 60a has storage areas for date and circulation systems Ka1-Ka4, respectively.
- the time interval at which the test unit 40a detects the rotational speed R1-R4 is 1 minute, 1 hour, 1 day, 1 week, 1 month, etc. In the case of the data 60a shown in FIG. A time interval of minutes.
- the rotational speeds R1-R4 for example, 20 revolutions per minute
- the rotational speeds R1-R4 for example, 20 revolutions per minute
- FIG. 28 shows an example of the disease state table 70.
- the pathological condition table 70 has storage areas for pathological conditions and circulatory systems Ka1-Ka4.
- the pathological condition storage area stores pathological conditions such as major depression, depression, normality (ie, subject PA is healthy), depression, and personality disorder.
- pathological conditions such as major depression, depression, normality (ie, subject PA is healthy), depression, and personality disorder.
- disease state table 70 shown in FIG. 28 mental disease is shown as the disease state, but it may have heart disease such as myocardial infarction or brain disease such as cerebral infarction.
- the storage area of the circulatory system Ka1-Ka4 conditions for estimating each pathological condition stored in the pathological condition storage area by the estimation unit 30b are stored. It should be noted that the storage area in which “-” is stored indicates that it is not included in the condition for estimating the corresponding disease state.
- the estimation unit 30b presumes subject PA as major depression. That is, major depression indicates a state in which the homeostasis that all emotions of anger, normality, sadness, and joy do not appear in the subject PA is biased.
- the estimation unit 30b estimates subject PA to be depressed. That is, depression indicates a state in which constancy is biased such that the emotion of sadness appears less frequently in the subject PA.
- the threshold ⁇ is set in advance and stored in the storage unit 50a. Moreover, the threshold value ⁇ may be set to a different value for each subject PA.
- the estimating unit 30b When each of the circulatory systems Ka1-Ka4 shows emotions of anger, normality, sadness, and joy, and when the rotational speed R3 of sadness is a rotational speed between the threshold value ⁇ and the threshold value ⁇ ( ⁇ > ⁇ ), the estimating unit 30b
- the subject PA is assumed to be normal (that is, the subject PA is healthy). That is, the pathological condition of normal indicates that the emotion of sadness appears moderately in the subject PA together with other emotions, and homeostasis is not biased.
- the threshold value ⁇ is set in advance and stored in the storage unit 50a.
- the threshold value ⁇ may be set to a different value for each subject PA.
- the estimation unit 30b estimates the subject PA to be depressed. That is, the depression indicates that sad emotions frequently appear in the subject PA and the homeostasis is biased. Further, the estimation unit 30b estimates that the personality disorder is the case where the rotation speed R1 of anger and the rotation speed R4 of joy are equal to each other regardless of the rotation speed of emotions of normal and sadness. That is, the personality disorder indicates that emotions that conflict with anger and joy appear simultaneously in the subject PA.
- Each of the circulatory systems Ka1-Ka4 has emotions of anger, normality, sadness and joy.
- the pathological condition is panic disorder
- the circulatory system of emotions such as anger, normality, sadness and joy
- the circulatory system of heartbeats etc. It is good to do.
- the estimation unit 30b reads the data 60a and the disease state table 70 from the storage unit 50a.
- the estimation unit 30b for a predetermined period such as one day or two weeks, reads out the frequency of appearance of the rotational speed satisfying the conditions of the circulatory systems Ka1-Ka4 indicated by each pathological condition stored in the pathological condition table 70 from the read data 60a Calculate using. That is, for example, when the circulatory system Ka1-Ka4 has an emotion of anger, normality, sadness, and joy, the estimation unit 30b determines the appearance frequency at which the rotational speed R1-R4 is 0 (no rotation) in the predetermined period. Calculated for each Ka.
- the estimation unit 30b calculates the appearance frequency when the rotation speed R3 in the sadness circulation system Ka3 is smaller than the threshold value ⁇ , between the threshold value ⁇ and the threshold value ⁇ , and larger than the threshold value ⁇ , respectively, in a predetermined period. To do. Further, the estimation unit 30b calculates an appearance frequency at which the rotation speed R1 of the angry circulation system Ka1 and the rotation speed R4 of the pleasure circulation system Ka4 are equal to each other in a predetermined period.
- the appearance frequency of the rotational speed of each circulation system Ka in a predetermined period is an example of a pattern of change in homeostasis.
- the estimation unit 30b extracts, for example, a condition indicating an appearance frequency equal to or higher than the threshold Th among the calculated appearance frequencies.
- the estimation unit 30b uses the extracted condition and the disease state table 70 to estimate a disease state satisfying the combination of the extracted conditions as the disease state of the subject PA.
- the predetermined period is determined based on a psychiatric standard such as ICD-10.
- the threshold Th is set in advance and stored in the storage unit 50a.
- the threshold Th may be set to a different value for each subject PA and pathological condition.
- the estimation unit 30b calculates the appearance frequency of the rotation speed R1-R4 in each circulation system Ka1-Ka4, but calculates the average value and deviation of the rotation speed R1-R4 of each circulation system Ka1-Ka4 in a predetermined period. May be. The estimating unit 30b then calculates the average value and deviation time variation of the calculated rotation speeds R1-R4 of each circulatory system Ka1-Ka4, and the typical time variation of the average value and deviation when the subject PA is healthy. And the pathological condition of the subject PA may be estimated from the comparison result.
- FIG. 29 shows an example of the estimation process by the estimation apparatus 100b shown in FIG. Note that, among the processes of the steps shown in FIG. 29, those showing the same or similar processes as the steps shown in FIG. 24 are given the same step numbers, and detailed description thereof is omitted.
- Step S100 to step S140, step S150a, and step S160a are realized when the CPU mounted on the estimation device 100b executes the estimation program. That is, FIG. 29 shows another embodiment of the estimation program and the estimation method.
- the extraction unit 10a, the calculation unit 20a, the estimation unit 30b, and the test unit 40a illustrated in FIG. 25 are realized by executing the estimation program.
- the processing illustrated in FIG. 29 may be realized by hardware mounted on the estimation device 100b.
- the extraction unit 10a, the calculation unit 20a, the estimation unit 30b, and the test unit 40a illustrated in FIG. 25 are realized by a circuit arranged in the estimation device 100b.
- the estimation apparatus 100b performs the process of step S150a after performing the process of step S100 to step S140 shown in FIG.
- step S150a the test unit 40a detects the rotational speed R1-R4 in each circulation system Ka1-Ka4 from the constancy simulation executed in step S140.
- the test unit 40a stores the detected rotation speed R1-R4 in each circulation system Ka1-Ka4 as data 60a in the storage unit 50a.
- step S160a the estimation unit 30b estimates the pathological condition of the subject PA based on the data 60a of the rotational speed R1-R4 in the circulatory system Ka1-Ka4 and the pathological table 70 as described with reference to FIGS.
- the estimation process by the estimation apparatus 100b ends.
- the flow shown in FIG. 29 may be repeatedly executed every time an instruction from the doctor or the subject PA is received, or may be executed at a predetermined frequency.
- the estimation device 100b outputs the estimation result to the output device 2.
- the output device 2 displays the amount of homeostasis along with the estimated pathological result.
- the output device 2 displays the magnitude of the constancy shift amount, that is, the degree of the symptom in the estimated pathological condition or the degree of health in the subject PA, as a color or an animated expression of a person or animal, and displays it on the display. May be.
- the output device 2 may display advice such as a treatment method for the estimated disease state according to the magnitude of the homeostatic deviation amount.
- the estimation apparatus 100b can easily estimate the pathological condition of the subject PA by referring to the index of the constancy shift amount without having specialized medical knowledge.
- the estimating apparatus 100b executes a constancy simulation in the subject PA using the constancy shift amount in each circulation system Ka as input energy.
- the estimation device 100b calculates the appearance frequency of the rotation speed in each circulatory system Ka indicating the change in homeostasis detected from the executed simulation and the appearance frequency of the rotation speed in each circulatory system Ka when the subject PA is healthy. Compare. And the estimation apparatus 100b can estimate the pathological condition of the subject PA with higher accuracy than before by using the comparison result and the pathological condition table 70.
- FIG. 30 shows another embodiment of the estimation device. Elements having the same or similar functions as those described in FIG. 25 are denoted by the same or similar reference numerals, and detailed description thereof will be omitted.
- the estimation device 100c is a computer device having an arithmetic processing device such as a CPU and a storage device such as a hard disk device.
- the estimation device 100c is connected to the measurement device 1a and the output device 2a by wire or wireless via an interface unit included in the estimation device 100c. Accordingly, the estimation device 100c, the measurement device 1a, and the output device 2a operate as the estimation system SYS.
- the output device 2a has, for example, a display such as an organic EL or liquid crystal, and a speaker that outputs sound.
- the output device 2a receives the estimation result of the pathological condition of the subject PA by the estimation device 100, and displays the received estimation result on a display such as an organic EL. Further, the output device 2a outputs a voice or the like according to the disease state estimated by the estimation device 100c by voice. Note that the output device 2a may be provided inside the estimation device 100c.
- the estimation apparatus 100c includes an extraction unit 10a, a calculation unit 20a, an estimation unit 30c, a test unit 40a, and a storage unit 50b.
- the functions of the extraction unit 10a, the calculation unit 20a, the estimation unit 30c, and the test unit 40a may be realized by a program executed by the CPU or may be realized by hardware.
- the storage unit 50b is a hard disk device, a memory, or the like.
- the storage unit 50b stores a program executed by the CPU, data 60a indicating a result of simulation by the test unit 40a, and a pathological table 70 for the estimation unit 30c to estimate the pathological condition of the subject PA using the data 60a.
- the storage unit 50b stores an utterance table 80 having voice data such as advice for the subject PA based on the pathological condition estimated by the estimation unit 30c.
- the utterance table 80 will be described with reference to FIG.
- the program for executing the estimation process can be recorded and distributed on a removable disk such as a CD or a DVD, for example.
- the estimation device 100c may download a program for executing the estimation process from the network via a network interface included in the estimation device 100c and store the program in the storage unit 50b.
- the estimation unit 30c estimates the pathology of the subject PA from the pattern of homeostasis simulated by the test unit 40. In addition, the estimation unit 30c selects voice data such as advice for the subject PA based on the estimated pathology of the subject PA and the utterance table 80. The operation of the estimation unit 30c will be described with reference to FIG.
- FIG. 31 shows an example of the utterance table 80.
- the utterance table 80 has storage areas for pathological conditions and utterances.
- the pathological condition storage area stores pathological conditions such as major depression, depression, personality disorder (male) and personality disorder (female).
- pathological conditions such as major depression, depression, personality disorder (male) and personality disorder (female).
- personality disorder the treatment differs between men and women, so the utterance table 80 has storage areas for personality disorder between men and women.
- mental disease is shown as a disease state, but it may have a storage area for heart disease such as myocardial infarction or other diseases of the brain such as cerebral infarction.
- voice data such as advice to the subject PA based on a psychiatric standard such as ICD-10 is stored in accordance with each pathological condition stored in the pathological condition storage area.
- a psychiatric standard such as ICD-10
- voice data for instructing the subject PA such as “Go to the hospital early” is stored in the utterance storage area.
- the subject PA is estimated to be depressed by the estimation unit 30c, it is estimated that the subject PA is in a depressed state.
- the estimation device 100c in order for the estimation device 100c to function as a teacher or trainer for the subject PA, for example, “simply stay inside the house.
- Voice data is stored in the utterance storage area. That is, when the subject PA is major depression or depression, the estimation device 100c stores the speech data as the teacher or trainer of the subject PA in the utterance storage area, thereby improving the depression state in the subject PA and the subject PA.
- the personality can be strengthened.
- the subject PA when the subject PA is male and is estimated to have personality disorder, the subject PA tends to be unilaterally aggressive. Therefore, in order for the estimation device 100c to function as a counselor for the subject PA, for example, the subject PA may be sympathetic with the subject PA such as “Think about not only yourself but also the feelings of the other party”. Is stored in the utterance storage area. On the other hand, when the subject PA is female and is determined to have personality disorder, the subject PA is likely to be performing self-harm such as wrist cut. Therefore, in order for the estimation device 100c to function as a counselor for the subject PA, for example, “I'm always doing my best. So stop that.” Voice data to be instructed is stored in the utterance storage area. That is, when the subject PA has a personality disorder or the like, the estimation device 100c stores voice data as a counselor of the subject PA in the storage area of the utterance, thereby developing empathy in the subject PA and improving the personality of the subject PA. Can be achieved.
- an address indicating the area of the storage unit 50b in which the voice data is stored may be stored instead of the voice data.
- the voice data stored in the utterance storage area of the utterance table 80 may store a plurality of voice data having different utterance contents based on psychiatric standards such as ICD-10 for one disease state.
- the extraction unit 10a extracts a break for each phoneme from the voice signal of the subject PA. That is, when the voice “Today is a good weather” is input, the extraction unit 10a reads “Kyo / U / H / I / I / T / N / Ki / D / S / Ne”. Extract breaks for each phoneme. Furthermore, the extraction unit 10a extracts a break for each word from the voice signal of the subject PA. For example, when the voice “Today is a good weather” is input, the extraction unit 10a extracts a word-by-word break such as “Kyo / Ha / Nai / Tenki / That”.
- the estimation unit 30c performs recognition and parsing for each word included in the speech of the subject PA based on information indicating phonemes and word breaks in the speech of the subject PA extracted by the extraction unit 10a. That is, the estimation unit 30c recognizes information indicating 5W1H of “Who”, “What”, “When”, “Where”, “Why”, “How” from the voice of the subject PA, Understand the content as a natural language. And the estimation part 30c judges what kind of situation or position the subject PA is placed from the voice of the subject PA based on the content of the grasped voice. Then, the estimation unit 30c selects one of a plurality of voice data such as advice on a disease state estimated according to the determined situation or position. Thereby, the estimation apparatus 100c can perform a finer treatment with respect to the subject PA as compared with the related art.
- the estimation unit 30c can treat the subject PA with a communication disorder by grasping the content of the voice of the subject PA. For example, the estimation unit 30c estimates whether or not the subject PA is a communication disorder from the emotion of the subject PA extracted by the extraction unit 10a when the subject PA utters a predetermined word. For example, when the extraction unit 10a utters a predetermined word indicating an emotion such as anger when the subject PA utters an emotion such as anger at the subject PA, the estimation unit 30c I can't read the atmosphere of the place and I presume it is a communication failure.
- the estimation unit 30c estimates that there is a communication failure
- the speech data for instructing the subject PA to have communication ability such as “read the air” is stored in the utterance so that the estimation device 100c functions as a teacher or the like. Read from area.
- the estimation apparatus 100c can treat the communication failure of the subject PA so that the subject PA can read and communicate with the air in the field.
- FIG. 32 shows an example of the estimation process by the estimation apparatus 100c shown in FIG. Note that among the processing of the steps shown in FIG. 30, the same or similar steps as those shown in FIG. 29 are denoted by the same step numbers, and detailed description thereof is omitted.
- Step S100 to step S140, step S150a, step S160a, and step S170 are realized by the CPU installed in the estimation device 100c executing the estimation program. That is, FIG. 32 shows another embodiment of the estimation program and the estimation method.
- the extraction unit 10a, the calculation unit 20a, the estimation unit 30c, and the test unit 40a illustrated in FIG. 30 are realized by executing the estimation program.
- the processing illustrated in FIG. 32 may be realized by hardware mounted on the estimation device 100c.
- the extraction unit 10a, the calculation unit 20a, the estimation unit 30c, and the test unit 40a illustrated in FIG. 30 are realized by a circuit arranged in the estimation device 100c.
- the estimation apparatus 100c performs the process of step S170 after performing the process of step S100 to step S140, step S150a, and step S160a shown in FIG.
- step S170 the estimation unit 30c reads voice data such as advice for the subject PA based on the pathological condition estimated in step S160a and the utterance table 80, as described in FIG.
- the estimation unit 30c outputs the read audio data to the output device 2a.
- the output device 2a displays the amount of homeostasis along with the estimated pathological result. Further, the output device 2a utters advice or the like according to the estimated pathological condition for the subject PA by outputting the voice data received from the estimation device 100c from the speaker.
- the output device 2a displays the magnitude of the constancy shift amount, that is, the degree of the symptom in the estimated pathological condition or the degree of the health of the subject PA, with a color or an expression such as a person or animal in animation, and displays it on the display. May be. Further, the output device 2a may display an animated person or animal on the display and output the received audio data as if the displayed person or animal is speaking.
- the flow shown in FIG. 32 may be repeatedly executed every time an instruction from the doctor or the subject PA is received, or may be executed at a predetermined frequency.
- the estimation apparatus 100c can easily estimate the pathological condition of the subject PA by referring to the index of the constancy shift amount without having specialized medical knowledge. Further, the estimating apparatus 100c executes a constancy simulation in the subject PA using the constancy shift amount in each circulation system Ka as input energy. The estimation apparatus 100c calculates the appearance frequency of the rotation speed in each circulatory system Ka indicating the change in homeostasis detected from the executed simulation and the appearance frequency of the rotation speed in each circulatory system Ka when the subject PA is healthy. Compare. And the estimation apparatus 100c can estimate the pathological condition of the subject PA with higher accuracy than the conventional one by using the comparison result and the pathological condition table 70.
- the estimation device 100c may estimate the state of the subject PA by measuring the physiology of the subject PA again after giving an utterance such as advice. Then, the estimation apparatus 100c evaluates the effect of the utterance such as advice based on the estimation result, and corrects the content of the advice stored in the utterance storage area of the utterance table 80 based on the evaluation. Good. Thereby, the estimation apparatus 100c can perform a fine treatment with respect to the subject PA as compared with the related art.
- the estimation apparatus 100 (100a, 100b, 100c) showed the case where it applied to the interview and prescription in psychological counseling, psychiatry, general medical care, such as mental analysis, behavior prediction, and behavior analysis, it is not limited to this.
- the estimation device 100 may be applied to robots, artificial intelligence, automobiles, call centers, entertainment, the Internet, mobile terminal device applications such as smartphones and tablet terminals, services, and search systems.
- the estimation device 100 may be applied to a diagnosis device, an automatic inquiry device, a disaster triage, and the like.
- the estimation device 100 may be applied to financial credit management systems, behavior predictions, companies, schools, government agencies, police and military, information analysis in information collection activities, psychological analysis leading to false discovery, and organization group management. Good.
- the estimation apparatus 100 is a system that manages mental health and behavior prediction of members of an organization, researchers, employees, managers, etc., a system that controls an environment such as a residence, an office, an airplane or a spaceship, or a family It may also be applied to a means for knowing the state of mind or behavior prediction of a friend or a friend. Further, the estimation apparatus 100 may be applied to music and movie distribution, general information search, information analysis management and information processing, customer sensitivity preference market analysis, and the like, a system for managing these via a network or stand-alone, and the like. .
Landscapes
- Health & Medical Sciences (AREA)
- Life Sciences & Earth Sciences (AREA)
- Engineering & Computer Science (AREA)
- Physics & Mathematics (AREA)
- Molecular Biology (AREA)
- Surgery (AREA)
- Biomedical Technology (AREA)
- Heart & Thoracic Surgery (AREA)
- Medical Informatics (AREA)
- Veterinary Medicine (AREA)
- Animal Behavior & Ethology (AREA)
- General Health & Medical Sciences (AREA)
- Public Health (AREA)
- Pathology (AREA)
- Biophysics (AREA)
- Physiology (AREA)
- Cardiology (AREA)
- Psychiatry (AREA)
- Audiology, Speech & Language Pathology (AREA)
- Acoustics & Sound (AREA)
- Signal Processing (AREA)
- Pulmonology (AREA)
- Artificial Intelligence (AREA)
- Computer Vision & Pattern Recognition (AREA)
- Nuclear Medicine, Radiotherapy & Molecular Imaging (AREA)
- Child & Adolescent Psychology (AREA)
- Social Psychology (AREA)
- Psychology (AREA)
- Hospice & Palliative Care (AREA)
- Educational Technology (AREA)
- Developmental Disabilities (AREA)
- Human Computer Interaction (AREA)
- Multimedia (AREA)
- Radiology & Medical Imaging (AREA)
- Dermatology (AREA)
- Gastroenterology & Hepatology (AREA)
- Endocrinology (AREA)
- High Energy & Nuclear Physics (AREA)
- Vascular Medicine (AREA)
- Measurement Of The Respiration, Hearing Ability, Form, And Blood Characteristics Of Living Organisms (AREA)
Abstract
Description
E(K1)=sqrt(α×α+β×β+γ×γ) ・・・(1)
なお、試験部40は、式(1)に示すように、情動の恒常性のずれ量α,β,γから声帯の循環系K1において生成されるエネルギーE(K1)を算出したが、情動の恒常性のずれ量α,β,γを変数とする関数F(α,β,γ)を用い、エネルギーE(K1)を算出してもよい。 The
E (K1) = sqrt (α × α + β × β + γ × γ) (1)
The
TE=E(K1)+E(K2)+E(K3)+E(K4)+E(K5)+E(K6)+E(K7)+E(K8)+E(K9)+E(K10) ・・・(2)
ここで、E(K2),E(K3),E(K4),E(K5),E(K6),E(K7),E(K8),E(K9),E(K10)は、循環系K2-K10において生成されたエネルギーを示す。TEは、合計したエネルギーを示す。なお、試験部40は、循環系K1-K10それぞれで生成されたエネルギーE(K1)-E(K10)を合計してエネルギーTEを求めたが、エネルギーE(K1)-E(K10)を重み付け加算してエネルギーTEを求めてもよい。あるいは、試験部40は、エネルギーE(K1)-E(K10)を乗算してエネルギーTEを求めてもよい。 For each of the circulatory systems K2 to K10, the
TE = E (K1) + E (K2) + E (K3) + E (K4) + E (K5) + E (K6) + E (K7) + E (K8) + E (K9) + E (K10) (2)
Here, E (K2), E (K3), E (K4), E (K5), E (K6), E (K7), E (K8), E (K9), and E (K10) are circulating. The energy generated in the system K2-K10 is shown. TE indicates the total energy. The
推定部30aは、記憶部50からデータ60の日付および循環系K1-K10における変位量L1-L10を読み出す。推定部30aは、読み出した変位量L1-L10それぞれの時間変化のパターンから被験者PAの病態を推定する。例えば、記憶部50には、被験者PAが健康である場合に循環系K1-K10それぞれが示す変位量L1-L10それぞれの典型的な時間変化のパターンのデータを予め格納される。そして、推定部30aは、試験部40により検出された変位量L1-L10の時間変化と、被験者PAが健康である場合の変位量L1-L10の典型的な時間変化とを比較し、比較の結果から被験者PAの病態を推定する。例えば、推定部30aは、試験部40により検出された変位量L1-L10の時間変化と、被験者PAが健康である場合の変位量L1-L10の典型的な時間変化とのパターンの差分を求め、求めた差分と各病態を示す所定の閾値とを比較する。すなわち、例えば、心臓の循環系K2の場合、推定部30aは、試験部40により検出された変位量L2の時間変化と被験者PAが健康である場合の変位量L2の典型的な時間変化との差分を求める。推定部30aは、予め設定された心筋梗塞あるいは狭心症等の心臓病を示す所定の閾値と求めた差分とを比較し、被験者PAが心筋梗塞あるいは狭心症等の心臓病を患っているか否かを推定する。 In each storage area of the circulation system K1-K10, for example, the displacement amounts L1-L10 of the nuts NT1-NT10 detected by the
Claims (8)
- 被験者の生理を示す情報から、前記被験者の生理の状態を示す第1情報と前記被験者の情動および器官の活動の少なくとも一方を示す第2情報とを抽出する抽出部と、
抽出した前記第1情報と前記第2情報とが示す時間変化における類似の度合いを求め、求めた前記類似の度合いに基づき前記被験者における恒常性が保たれた所定状態からのずれ量を算出する演算部と、
算出された前記ずれ量に基づいて前記被験者の病態を推定する推定部と
を備えることを特徴とする推定装置。 An extraction unit that extracts, from information indicating a subject's physiology, first information indicating the state of the subject's physiology and second information indicating at least one of the subject's emotion and organ activity;
An operation for obtaining a degree of similarity in the time change indicated by the extracted first information and the second information, and calculating a deviation amount from a predetermined state in which the subject's constancy is maintained based on the obtained degree of similarity. And
An estimation device comprising: an estimation unit configured to estimate a pathological condition of the subject based on the calculated deviation amount. - 請求項1に記載の推定装置において、
前記演算部により算出された前記ずれ量から前記被験者の情動および器官の活動に作用するエネルギーを算出し、算出した前記エネルギーを入力として前記被験者における恒常性をシミュレーションする試験部を備え、
前記推定部は、シミュレーションされた前記恒常性の変化のパターンから前記被験者の病態を推定する
ことを特徴とする推定装置。 The estimation apparatus according to claim 1,
From the amount of deviation calculated by the arithmetic unit, calculating the energy acting on the subject's emotion and organ activity, comprising a test unit for simulating homeostasis in the subject with the calculated energy as an input,
The estimator estimates a pathological condition of the subject from a simulated pattern of change in homeostasis. - 請求項1または請求項2に記載の推定装置において、
前記被験者からの音声信号を前記被験者の生理を示す情報として受信する入力部を備えることを特徴とする推定装置。 In the estimation apparatus according to claim 1 or 2,
An estimation apparatus comprising: an input unit that receives an audio signal from the subject as information indicating the physiology of the subject. - 請求項1または請求項2に記載の推定装置において、
前記被験者の前記器官の活動を前記被験者の生理を示す情報として受信する入力部を備えることを特徴とする推定装置。 In the estimation apparatus according to claim 1 or 2,
An estimation apparatus comprising: an input unit that receives the activity of the organ of the subject as information indicating the physiology of the subject. - 請求項1ないし請求項4のいずれか1項に記載の推定装置において、
病態ごとに前記被験者への助言の音声データを格納する記憶部を備え、
前記推定部は、推定した前記被験者の病態に基づいて前記被験者に対する助言を示す音声データを選択し、選択した前記音声データを外部の出力装置に出力する
ことを特徴とする推定装置。 The estimation apparatus according to any one of claims 1 to 4,
A storage unit that stores voice data of advice to the subject for each disease state,
The estimation unit selects voice data indicating advice to the subject based on the estimated pathological condition of the subject, and outputs the selected voice data to an external output device. - 被験者の生理を示す情報から、前記被験者の生理の状態を示す第1情報と前記被験者の情動および器官の活動の少なくとも一方を示す第2情報とを抽出し、
抽出した前記第1情報と前記第2情報とが示す時間変化における類似の度合いを求め、求めた前記類似の度合いに基づき前記被験者における恒常性が保たれた所定状態からのずれ量を算出し、
算出された前記ずれ量に基づいて前記被験者の病態を推定する
処理をコンピュータに実行させるプログラム。 Extracting from the information indicating the subject's physiology first information indicating the state of the subject's physiology and second information indicating at least one of the subject's emotion and organ activity,
Obtaining the degree of similarity in the time change indicated by the extracted first information and the second information, and calculating a deviation amount from a predetermined state in which the subject's constancy is maintained based on the obtained degree of similarity;
A program for causing a computer to execute a process of estimating the pathological condition of the subject based on the calculated deviation amount. - 被験者の生理を示す情報から、前記被験者の生理の状態を示す第1情報と前記被験者の情動および器官の活動の少なくとも一方を示す第2情報とを抽出部により抽出し、
抽出した前記第1情報と前記第2情報とが示す時間変化における類似の度合いを求め、求めた前記類似の度合いに基づき前記被験者における恒常性が保たれた所定状態からのずれ量を演算部により算出し、
算出された前記ずれ量に基づいて前記被験者の病態を推定部により推定する
ことを特徴とする推定方法。 From the information indicating the subject's physiology, the extraction unit extracts first information indicating the state of the subject's physiology and second information indicating at least one of the subject's emotion and organ activity,
The degree of similarity in the time change indicated by the extracted first information and the second information is obtained, and the amount of deviation from the predetermined state in which the subject's constancy is maintained based on the obtained degree of similarity is calculated by the calculation unit. Calculate
An estimation method, wherein an estimation unit estimates a pathological condition of the subject based on the calculated deviation amount. - 被験者の生理を計測する計測装置と、
前記計測装置により計測された前記被験者の生理を示す情報を用い前記被験者の病態を推定する推定装置と、
前記推定装置により推定された病態の結果を出力する出力装置とを備え、
前記推定装置は、
前記被験者の生理を示す情報から、前記被験者の生理の状態を示す第1情報と前記被験者の情動および器官の活動の少なくとも一方を示す第2情報とを抽出する抽出部と、
抽出した前記第1情報と前記第2情報とが示す時間変化における類似の度合いを求め、求めた前記類似の度合いに基づき前記被験者における恒常性が保たれた所定状態からのずれ量を算出する演算部と、
算出された前記ずれ量に基づいて前記被験者の病態を推定する推定部とを備える
ことを特徴とする推定システム。 A measuring device for measuring the physiology of the subject;
An estimation device that estimates the pathology of the subject using information indicating the physiology of the subject measured by the measurement device;
An output device that outputs the result of the disease state estimated by the estimation device;
The estimation device includes:
An extraction unit that extracts, from information indicating the physiology of the subject, first information indicating the state of the physiology of the subject and second information indicating at least one of the emotion and organ activity of the subject;
An operation for obtaining a degree of similarity in the time change indicated by the extracted first information and the second information, and calculating a deviation amount from a predetermined state in which the subject's constancy is maintained based on the obtained degree of similarity. And
An estimation system comprising: an estimation unit that estimates the pathological condition of the subject based on the calculated deviation amount.
Priority Applications (6)
| Application Number | Priority Date | Filing Date | Title |
|---|---|---|---|
| CN201480065678.6A CN105792758B (en) | 2013-12-05 | 2014-11-28 | Estimating device, recording medium and deduction system |
| CA2932689A CA2932689C (en) | 2013-12-05 | 2014-11-28 | Estimation device, program, estimation method, and estimation system |
| RU2016126695A RU2682607C1 (en) | 2013-12-05 | 2014-11-28 | Evaluation device, program, assessment method and evaluation system |
| KR1020167017552A KR101867198B1 (en) | 2013-12-05 | 2014-11-28 | Estimation device, program, estimation method, and estimation system |
| EP14867047.4A EP3078331B1 (en) | 2013-12-05 | 2014-11-28 | Estimation program and estimation system |
| US15/039,907 US10485467B2 (en) | 2013-12-05 | 2014-11-28 | Estimation device, program, estimation method, and estimation system |
Applications Claiming Priority (2)
| Application Number | Priority Date | Filing Date | Title |
|---|---|---|---|
| JP2013251867 | 2013-12-05 | ||
| JP2013-251867 | 2013-12-05 |
Publications (1)
| Publication Number | Publication Date |
|---|---|
| WO2015083357A1 true WO2015083357A1 (en) | 2015-06-11 |
Family
ID=53273142
Family Applications (1)
| Application Number | Title | Priority Date | Filing Date |
|---|---|---|---|
| PCT/JP2014/005977 WO2015083357A1 (en) | 2013-12-05 | 2014-11-28 | Estimation device, program, estimation method, and estimation system |
Country Status (9)
| Country | Link |
|---|---|
| US (1) | US10485467B2 (en) |
| EP (1) | EP3078331B1 (en) |
| JP (1) | JP5755791B2 (en) |
| KR (1) | KR101867198B1 (en) |
| CN (1) | CN105792758B (en) |
| CA (1) | CA2932689C (en) |
| HK (1) | HK1225941A1 (en) |
| RU (1) | RU2682607C1 (en) |
| WO (1) | WO2015083357A1 (en) |
Cited By (1)
| Publication number | Priority date | Publication date | Assignee | Title |
|---|---|---|---|---|
| CN108885711A (en) * | 2016-03-30 | 2018-11-23 | 株式会社日本数理研究所 | The meaning emerges in large numbers device, meaning emergence and the meaning and emerges in large numbers program |
Families Citing this family (17)
| Publication number | Priority date | Publication date | Assignee | Title |
|---|---|---|---|---|
| JP6436030B2 (en) * | 2015-09-17 | 2018-12-12 | トヨタ自動車株式会社 | Life log recording system |
| JP6365554B2 (en) * | 2016-01-14 | 2018-08-01 | マツダ株式会社 | Driving assistance device |
| JP6306071B2 (en) | 2016-02-09 | 2018-04-04 | Pst株式会社 | Estimation device, estimation program, operation method of estimation device, and estimation system |
| WO2017170404A1 (en) | 2016-03-30 | 2017-10-05 | 光吉 俊二 | Intention emergence device, intention emergence method, and intention emergence program |
| JP6350586B2 (en) * | 2016-04-25 | 2018-07-04 | マツダ株式会社 | Driving assistance device |
| JP2017220807A (en) * | 2016-06-08 | 2017-12-14 | 株式会社日立システムズ | Voice data collection system |
| USD837235S1 (en) * | 2016-07-11 | 2019-01-01 | Pmd Healthcare | Display screen with graphical user interface |
| WO2018066674A1 (en) * | 2016-10-05 | 2018-04-12 | 京セラ株式会社 | Measurement device, measurement method, and measurement program |
| JP2018102705A (en) * | 2016-12-27 | 2018-07-05 | 本田技研工業株式会社 | Feeling improvement device and feeling improvement method |
| US10593351B2 (en) * | 2017-05-03 | 2020-03-17 | Ajit Arun Zadgaonkar | System and method for estimating hormone level and physiological conditions by analysing speech samples |
| JP7058383B2 (en) * | 2017-10-02 | 2022-04-22 | 日本電気株式会社 | Affect judgment device, emotion judgment method, and program |
| CN107802273A (en) * | 2017-11-21 | 2018-03-16 | 重庆邮电大学 | A kind of depressive state monitoring device, system and Forecasting Methodology |
| JP7112851B2 (en) * | 2018-02-05 | 2022-08-04 | 株式会社疲労科学研究所 | Information processing device, fatigue evaluation method and program |
| KR102429447B1 (en) * | 2020-05-19 | 2022-08-04 | 한양대학교 산학협력단 | Information provision method for diagnosing mood disorders using facial expression recognition |
| US11671754B2 (en) * | 2020-06-24 | 2023-06-06 | Hyundai Motor Company | Vehicle and method for controlling thereof |
| JP7477172B2 (en) * | 2021-02-19 | 2024-05-01 | 株式会社Kort Valuta | Information processing device, information processing system, information processing method, and program |
| JPWO2022264219A1 (en) * | 2021-06-14 | 2022-12-22 |
Citations (4)
| Publication number | Priority date | Publication date | Assignee | Title |
|---|---|---|---|---|
| JP2006132159A (en) | 2004-11-04 | 2006-05-25 | Taiyo Kogyo Corp | Roof unit |
| WO2006132159A1 (en) * | 2005-06-09 | 2006-12-14 | A.G.I. Inc. | Speech analyzer detecting pitch frequency, speech analyzing method, and speech analyzing program |
| JP2012000449A (en) * | 2010-05-17 | 2012-01-05 | Mitsuyoshi Kenkyusho:Kk | Behavior analysis method and apparatus |
| JP2012061057A (en) | 2010-09-14 | 2012-03-29 | Kitasato Institute | Electrical impedance tomographic image measuring device of living body |
Family Cites Families (14)
| Publication number | Priority date | Publication date | Assignee | Title |
|---|---|---|---|---|
| JP3676969B2 (en) | 2000-09-13 | 2005-07-27 | 株式会社エイ・ジー・アイ | Emotion detection method, emotion detection apparatus, and recording medium |
| TWI221574B (en) * | 2000-09-13 | 2004-10-01 | Agi Inc | Sentiment sensing method, perception generation method and device thereof and software |
| EP1282113B1 (en) * | 2001-08-02 | 2005-01-12 | Sony International (Europe) GmbH | Method for detecting emotions from speech using speaker identification |
| KR20030029308A (en) * | 2001-10-06 | 2003-04-14 | 정용석 | Health care system and diagnosys method by using voice analysis |
| JP2003263503A (en) * | 2002-03-08 | 2003-09-19 | Matsushita Electric Ind Co Ltd | Health care system |
| JP2006006355A (en) * | 2004-06-22 | 2006-01-12 | Sony Corp | Processor for biological information and video and sound reproducing device |
| JP4590555B2 (en) * | 2004-09-02 | 2010-12-01 | 国立大学法人長岡技術科学大学 | Sensitive state discrimination method and apparatus |
| JP4704952B2 (en) | 2006-05-01 | 2011-06-22 | 株式会社エイ・ジー・アイ | Mental state determination device and program |
| US7539533B2 (en) | 2006-05-16 | 2009-05-26 | Bao Tran | Mesh network monitoring appliance |
| US8337404B2 (en) * | 2010-10-01 | 2012-12-25 | Flint Hills Scientific, Llc | Detecting, quantifying, and/or classifying seizures using multimodal data |
| KR101437186B1 (en) * | 2009-01-28 | 2014-09-05 | 경희대학교 산학협력단 | Method for responding to user emotion with multiple sensors |
| WO2011011413A2 (en) * | 2009-07-20 | 2011-01-27 | University Of Florida Research Foundation, Inc. | Method and apparatus for evaluation of a subject's emotional, physiological and/or physical state with the subject's physiological and/or acoustic data |
| US20130102859A1 (en) * | 2010-06-22 | 2013-04-25 | Gili Medical Ltd. | System and method for detecting symptoms of hypoglycemia |
| US9763617B2 (en) | 2011-08-02 | 2017-09-19 | Massachusetts Institute Of Technology | Phonologically-based biomarkers for major depressive disorder |
-
2014
- 2014-11-28 WO PCT/JP2014/005977 patent/WO2015083357A1/en active Application Filing
- 2014-11-28 KR KR1020167017552A patent/KR101867198B1/en active IP Right Grant
- 2014-11-28 RU RU2016126695A patent/RU2682607C1/en active
- 2014-11-28 EP EP14867047.4A patent/EP3078331B1/en active Active
- 2014-11-28 JP JP2014242001A patent/JP5755791B2/en active Active
- 2014-11-28 CA CA2932689A patent/CA2932689C/en active Active
- 2014-11-28 US US15/039,907 patent/US10485467B2/en active Active
- 2014-11-28 CN CN201480065678.6A patent/CN105792758B/en not_active Expired - Fee Related
-
2016
- 2016-12-22 HK HK16114552A patent/HK1225941A1/en unknown
Patent Citations (4)
| Publication number | Priority date | Publication date | Assignee | Title |
|---|---|---|---|---|
| JP2006132159A (en) | 2004-11-04 | 2006-05-25 | Taiyo Kogyo Corp | Roof unit |
| WO2006132159A1 (en) * | 2005-06-09 | 2006-12-14 | A.G.I. Inc. | Speech analyzer detecting pitch frequency, speech analyzing method, and speech analyzing program |
| JP2012000449A (en) * | 2010-05-17 | 2012-01-05 | Mitsuyoshi Kenkyusho:Kk | Behavior analysis method and apparatus |
| JP2012061057A (en) | 2010-09-14 | 2012-03-29 | Kitasato Institute | Electrical impedance tomographic image measuring device of living body |
Non-Patent Citations (1)
| Title |
|---|
| See also references of EP3078331A4 |
Cited By (2)
| Publication number | Priority date | Publication date | Assignee | Title |
|---|---|---|---|---|
| CN108885711A (en) * | 2016-03-30 | 2018-11-23 | 株式会社日本数理研究所 | The meaning emerges in large numbers device, meaning emergence and the meaning and emerges in large numbers program |
| CN108885711B (en) * | 2016-03-30 | 2022-09-20 | 株式会社日本数理研究所 | Intention emergence device, intention emergence method, and storage medium |
Also Published As
| Publication number | Publication date |
|---|---|
| KR101867198B1 (en) | 2018-06-12 |
| EP3078331B1 (en) | 2022-05-11 |
| KR20160092011A (en) | 2016-08-03 |
| JP5755791B2 (en) | 2015-07-29 |
| CN105792758A (en) | 2016-07-20 |
| HK1225941A1 (en) | 2017-09-22 |
| CA2932689C (en) | 2018-07-31 |
| US20170000397A1 (en) | 2017-01-05 |
| EP3078331A1 (en) | 2016-10-12 |
| JP2015128579A (en) | 2015-07-16 |
| US10485467B2 (en) | 2019-11-26 |
| EP3078331A4 (en) | 2017-08-09 |
| CA2932689A1 (en) | 2015-06-11 |
| CN105792758B (en) | 2019-05-03 |
| RU2682607C1 (en) | 2019-03-19 |
Similar Documents
| Publication | Publication Date | Title |
|---|---|---|
| JP5755791B2 (en) | Estimation device, program, operation method of estimation device, and estimation system | |
| US12076136B2 (en) | Smart watch | |
| Yannakakis et al. | Psychophysiology in games | |
| TWI722160B (en) | Meaning creation device, meaning creation method and meaning creation program | |
| CN112040849B (en) | System and method for determining blood pressure of a subject | |
| Vakulenko et al. | Prospect of Creating a Virtual Reality System with Feedback for the Correction of the Patient’s Psychological State Based on the Results of the Analysis of Arterial Pulsations Registered during Blood Pressure Measurement Using the Oranta-AO Information System | |
| US10791985B2 (en) | Cardio-kinetic cross-spectral density for assessment of sleep physiology | |
| US20240008813A1 (en) | Smart wearable device and method for estimating traditional medicine system parameters | |
| Oviedo et al. | Cardiorespiratory coordination during exercise in adults with Down syndrome | |
| Coppini et al. | Moving Medical Semeiotics to the Digital Realm | |
| Amira et al. | Stress level classification using heart rate variability | |
| WO2017170404A1 (en) | Intention emergence device, intention emergence method, and intention emergence program | |
| Tokmak et al. | Investigating the Effect of Body Composition Differences on Seismocardiogram Characteristics | |
| Choudhury et al. | New Frontiers of Cardiovascular Screening Using Unobtrusive Sensors, AI, and IoT | |
| Nesaragi et al. | Non-invasive waveform analysis for emergency triage via simulated hemorrhage: An experimental study using novel dynamic lower body negative pressure model | |
| Arsalan et al. | Human Stress Assessment: A Comprehensive Review of Methods Using Wearable Sensors and Non-wearable Techniques | |
| RU2279847C2 (en) | Method for predicting eeg alpha-rhythm index in patients with psychosomatic diseases | |
| Fallmann et al. | Fine-grained sleep-wake behaviour analysis | |
| Gharamyan | Meta-analysis of randomized clinical trials on the speed of pulse wave propagation | |
| Zhou et al. | On Design of SILU Algorithm to Enable Our New ABPM System for Stroke Risk Early-Warning | |
| Taghibeyglou et al. | Machine Learning-Enabled Hypertension Screening Through Acoustical Speech Analysis: Model Development and Validation | |
| Tavares | Study of Physiological Parameters of the Human Body for Variability: Case Study of Heart | |
| Radha | Data-driven health monitoring and lifestyle interventions |
Legal Events
| Date | Code | Title | Description |
|---|---|---|---|
| 121 | Ep: the epo has been informed by wipo that ep was designated in this application |
Ref document number: 14867047 Country of ref document: EP Kind code of ref document: A1 |
|
| WWE | Wipo information: entry into national phase |
Ref document number: 15039907 Country of ref document: US |
|
| ENP | Entry into the national phase |
Ref document number: 2932689 Country of ref document: CA |
|
| NENP | Non-entry into the national phase |
Ref country code: DE |
|
| REEP | Request for entry into the european phase |
Ref document number: 2014867047 Country of ref document: EP |
|
| WWE | Wipo information: entry into national phase |
Ref document number: 2014867047 Country of ref document: EP |
|
| ENP | Entry into the national phase |
Ref document number: 20167017552 Country of ref document: KR Kind code of ref document: A |
|
| ENP | Entry into the national phase |
Ref document number: 2016126695 Country of ref document: RU Kind code of ref document: A |