WO2015053007A1 - 超音波診断装置、超音波診断方法、及び超音波診断プログラム - Google Patents
超音波診断装置、超音波診断方法、及び超音波診断プログラム Download PDFInfo
- Publication number
- WO2015053007A1 WO2015053007A1 PCT/JP2014/072998 JP2014072998W WO2015053007A1 WO 2015053007 A1 WO2015053007 A1 WO 2015053007A1 JP 2014072998 W JP2014072998 W JP 2014072998W WO 2015053007 A1 WO2015053007 A1 WO 2015053007A1
- Authority
- WO
- WIPO (PCT)
- Prior art keywords
- echo
- ultrasonic diagnostic
- diagnostic apparatus
- region
- interest
- Prior art date
- Legal status (The legal status is an assumption and is not a legal conclusion. Google has not performed a legal analysis and makes no representation as to the accuracy of the status listed.)
- Ceased
Links
Images







Classifications
-
- A—HUMAN NECESSITIES
- A61—MEDICAL OR VETERINARY SCIENCE; HYGIENE
- A61B—DIAGNOSIS; SURGERY; IDENTIFICATION
- A61B8/00—Diagnosis using ultrasonic, sonic or infrasonic waves
- A61B8/13—Tomography
- A61B8/14—Echo-tomography
-
- A—HUMAN NECESSITIES
- A61—MEDICAL OR VETERINARY SCIENCE; HYGIENE
- A61B—DIAGNOSIS; SURGERY; IDENTIFICATION
- A61B8/00—Diagnosis using ultrasonic, sonic or infrasonic waves
- A61B8/08—Clinical applications
- A61B8/0858—Clinical applications involving measuring tissue layers, e.g. skin, interfaces
-
- A—HUMAN NECESSITIES
- A61—MEDICAL OR VETERINARY SCIENCE; HYGIENE
- A61B—DIAGNOSIS; SURGERY; IDENTIFICATION
- A61B8/00—Diagnosis using ultrasonic, sonic or infrasonic waves
- A61B8/52—Devices using data or image processing specially adapted for diagnosis using ultrasonic, sonic or infrasonic waves
- A61B8/5207—Devices using data or image processing specially adapted for diagnosis using ultrasonic, sonic or infrasonic waves involving processing of raw data to produce diagnostic data, e.g. for generating an image
-
- A—HUMAN NECESSITIES
- A61—MEDICAL OR VETERINARY SCIENCE; HYGIENE
- A61B—DIAGNOSIS; SURGERY; IDENTIFICATION
- A61B8/00—Diagnosis using ultrasonic, sonic or infrasonic waves
- A61B8/08—Clinical applications
- A61B8/0875—Clinical applications for diagnosis of bone
-
- A—HUMAN NECESSITIES
- A61—MEDICAL OR VETERINARY SCIENCE; HYGIENE
- A61B—DIAGNOSIS; SURGERY; IDENTIFICATION
- A61B8/00—Diagnosis using ultrasonic, sonic or infrasonic waves
- A61B8/46—Ultrasonic, sonic or infrasonic diagnostic devices with special arrangements for interfacing with the operator or the patient
- A61B8/461—Displaying means of special interest
Definitions
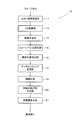
- the present invention relates to an ultrasonic diagnostic apparatus for diagnosing the state of a detected part to be examined in a subject, an ultrasonic diagnostic method and an ultrasonic diagnostic program for diagnosing the state of the detected part.
- This invention is for solving the said subject,
- the objective is to grasp
- an ultrasonic diagnostic apparatus for diagnosing the state of a detection target portion to be examined in a subject.
- Each position of the region of interest calculated based on the echo signal of the ultrasonic signal irradiated to the inside of the subject from the acoustic probe and specified by the depth direction of the subject and the direction intersecting the depth direction
- a stepping unit that steps the echo intensity, which is the intensity of the echo signal of the sample corresponding to, in accordance with one of the echo intensities set in a plurality of steps, and each of the echoes stepped by the stepping unit
- samples having intensities samples having a predetermined positional relationship with each other are targeted, and the region of interest is based on a combination of echo intensities stepped by the staging unit in each of the samples.
- the ultrasonic diagnostic apparatus has a luminance level corresponding to each echo intensity stepped by the stepping unit, and each of the plurality of pixels corresponding to each position of the region of interest,
- An image generation unit configured to generate an echo level image constituted by:
- the ultrasonic diagnostic apparatus has an upper and lower limit value setting unit that sets an upper limit echo intensity having the largest value and a lower limit echo intensity having the smallest value among the echo intensities set in a plurality of stages. Is further provided.
- the region of interest is set as a region including an echo signal from the surface of the detected portion.
- the ultrasonic diagnostic apparatus generates a co-occurrence matrix based on the echo intensities stepped by the staging unit in the sample corresponding to each position of the region of interest.
- a generation unit is further provided, and the feature amount calculation unit calculates the feature amount from the co-occurrence matrix generated by the co-occurrence matrix generation unit.
- the feature amount calculation unit calculates a correlation as the feature amount.
- the co-occurrence matrix generator generates a sample pair composed of a pair of samples in a position of a predetermined distance apart in a direction intersecting the depth direction in the region of interest.
- a first co-occurrence matrix as the co-occurrence matrix is calculated, and the feature amount calculation unit calculates the correlation from the first co-occurrence matrix.
- the feature amount calculation unit calculates contrast as the feature amount.
- the co-occurrence matrix generation unit targets each of the sample pairs formed of a pair of samples in a positional relationship of a predetermined distance apart in the depth direction in the region of interest.
- a second co-occurrence matrix is calculated as a co-occurrence matrix, and the feature amount calculation unit calculates the contrast from the second co-occurrence matrix.
- the ultrasonic diagnostic apparatus is detected by a surface position detection unit that detects a position of the surface of the detected part in the depth direction based on the echo signal, and the surface position detection unit.
- a region-of-interest setting unit that sets the region of interest based on the position of the surface of the detected portion;
- the staging unit includes an upper and lower limit value setting unit that sets an upper limit echo intensity having the largest value and a lower limit echo intensity having the smallest value among the echo intensities set in a plurality of stages.
- the upper / lower limit value setting unit detects a maximum value of an echo signal from the surface of the detected portion detected by the surface position detection unit, sets the maximum value as the upper limit value, and
- the ultrasonic diagnostic apparatus further includes an echo level normalization unit that divides the echo intensity at each position in the analysis region by the maximum value detected by the upper / lower limit value setting unit.
- the depth position of the sample in the region of interest so that the position of the surface of the detected part in the region of interest is included in a predetermined range in the depth direction.
- a surface position correction unit that corrects.
- the ultrasonic diagnostic apparatus is based on the ultrasonic probe that irradiates an ultrasonic signal inside the subject and the feature amount calculated by the feature amount calculation unit or the feature amount. And a display unit that displays an index indicating the state of the detection unit of the subject derived from the above.
- the ultrasonic probe is scanned along the surface of the subject, whereby the depth direction and the scanning direction of the ultrasonic probe that is a direction intersecting the depth direction are scanned. Then, it is possible to transmit / receive ultrasonic waves to the region of interest specified by
- an ultrasonic diagnostic method for diagnosing the state of a detection target portion to be inspected in a subject.
- Each position of the region of interest calculated based on the echo signal of the ultrasonic signal irradiated to the inside of the subject from the acoustic probe and specified by the depth direction of the subject and the direction intersecting the depth direction.
- the step of stepping the echo intensity which is the intensity of the echo signal of the sample corresponding to, in accordance with one of the echo intensities set in a plurality of steps, and each of the echo intensities stepped in the step of stepping Among samples having a predetermined positional relationship with each other, and based on the combination of the stepped echo intensities in each of the samples, the interest Comprising a step of calculating a feature quantity representing the feature of frequency, the.
- an ultrasound diagnostic program for diagnosing the state of a detection target portion to be examined in a subject.
- Each position of the region of interest calculated based on the echo signal of the ultrasonic signal irradiated to the inside of the subject from the acoustic probe and specified by the depth direction of the subject and the direction intersecting the depth direction.
- the step of stepping the echo intensity which is the intensity of the echo signal of the sample corresponding to, in accordance with one of the echo intensities set in a plurality of steps, and each of the echo intensities stepped in the step of stepping Among samples having a predetermined positional relationship with each other, and based on the combination of the stepped echo intensities in each of the samples
- the state of the detected part can be accurately grasped even when the state of the detected part is analyzed transcutaneously.
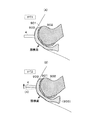
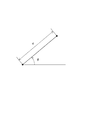
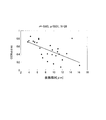
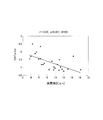
- FIG. 1 is a block diagram showing a configuration of an ultrasonic diagnostic apparatus according to an embodiment of the present invention. It is a schematic diagram which shows the installation aspect with respect to the knee of the probe of an ultrasonic diagnosing device. It is the model which looked at the knee vicinity of the state in which the probe was installed from the side, (A) is a figure which shows the case of a 1st state, (B) is a figure which shows the case of a 2nd state. It is a block diagram which shows the structure of the signal processing part of the ultrasonic diagnosing device shown in FIG. It is a figure which shows an example of the echo level image produced
- FIG. 1 is a block diagram showing a configuration of an ultrasonic diagnostic apparatus 1 according to an embodiment of the present invention.
- the ultrasonic diagnostic apparatus 1 is for diagnosing the state of the cartilage (detected portion) of a patient's knee (subject).
- FIG. 2 is a diagram showing an installation mode of the probe 4 of the ultrasonic diagnostic apparatus 1 according to the embodiment of the present invention with respect to the subject.
- the probe 4 is moved in the vertical direction of the knee while the probe 4 is in contact with the knee surface, and the relative position between the soft tissue 903 and the cartilage 901 is shown in FIG. Switching between the first state and the second state shown in FIG.
- an ultrasonic wave is irradiated from the probe 4 in each state, and an index indicating the state of the cartilage 901 (such as the roughness of the cartilage surface) is a numerical value based on the echo signal obtained in each state. Is calculated as A user (for example, a doctor) of the ultrasonic diagnostic apparatus 1 looks at the index displayed on the display unit 5 and diagnoses the state of the cartilage of the patient's knee joint.
- the ultrasonic diagnostic apparatus 1 includes an operation unit 2, a transmission control unit 3, a probe 4, a signal processing unit 10, and a display unit 5.
- the operation unit 2 is composed of, for example, a keyboard or a touch panel, and accepts user operation input.
- the operation unit 2 instructs the transmission control unit 3 to start executing a process for detecting the cartilage surface in accordance with a user operation input.
- the operation unit 2 outputs an instruction to set or switch the display mode to the display unit 5 in accordance with a user operation input.
- the operation unit 2 may be incorporated in the display unit 5.
- the transmission control unit 3 generates a pulsed ultrasonic signal.
- the transmission control unit 3 generates an ultrasonic signal in each of the first state [T1] and the second state [T2].
- the transmission control unit 3 outputs an ultrasonic signal to the probe 4.
- the probe 4 includes a plurality of transducers 4a arranged in a direction parallel to the transmission / reception surface (see FIG. 3).
- the array direction of the transducers 4a is the scanning direction.
- Each transducer 4a transmits an ultrasonic signal toward the inside of the subject.
- Each transducer 4a transmits an ultrasonic signal at a predetermined time interval and receives the reflected echo signal.
- the probe 4 has a plurality of transducers 4a. As shown in FIG. 2, the probe 4 is arranged such that the end surface on the wave transmitting / receiving surface side is in contact with the surface of the soft tissue 903 of the knee that is the subject.
- the soft tissue 903 is a portion that exists on the surface side of the subject with respect to the cartilage 901.
- the cartilage 901 is attached to the subchondral bone 911, and the subchondral bone 911 is a tissue connected to the bone (cancellous bone) 902.
- the probe may have only one transducer.
- the moving direction of the vibrator is the scanning direction.
- the probe 4 is moved along the surface as shown in FIG. 2B while contacting the probe 4 with the surface of the soft tissue 903.
- the soft tissue 903 moves according to the probe 4 while sliding on the surface of the cartilage 901.
- the probe 4 is moved along the arrangement direction (scanning direction) of the transducers.
- Each transducer 4a transmits an ultrasonic signal toward the subject in each of the first state [T1] and the second state [T1]. At this time, each transducer 4a of the probe 4 transmits an ultrasonic signal such that the direction orthogonal to the surface of the soft tissue 903 is the direction of the central axis of the transmission beam.
- Each transducer 4 a receives an echo signal obtained by reflecting an ultrasonic signal from the soft tissue 903 or cartilage 901 in the subject, and outputs the echo signal to the signal processing unit 10.
- the probe 4 has a first echo group SW [T1] composed of echo signals obtained by the transducer 4a in the first state [T1] and a first echo group obtained from each transducer in the second state [T2].
- the two echo groups SW [T2] are each output to the signal processing unit 10.
- the signal processing unit 10 analyzes the state of the cartilage 901 based on each echo signal and outputs the analysis result to the display unit 5. The detailed configuration and operation of the signal processing unit 10 will be described later in detail.
- the display unit 5 displays the analysis result of the cartilage 901 analyzed by the signal processing unit 10. Specifically, the display unit 5 displays the feature amount as an index indicating the state of the cartilage calculated by the signal processing unit 10. The user estimates the state of the cartilage 901 of the patient's knee from this feature quantity.
- FIG. 4 is a block diagram illustrating a configuration of the signal processing unit 10 of the ultrasonic diagnostic apparatus 1 according to the present embodiment.
- the signal processing unit 10 includes an echo signal reception unit 11, an AD conversion unit 12, a surface position detection unit 13, an image generation unit 14, an echo level normalization unit 15, and a surface position correction.
- Unit 16 dynamic range setting unit 17, region of interest setting unit 18, gradation unit 19, co-occurrence matrix generation unit 20, and feature amount calculation unit 21.
- the signal processing unit 10 is configured using hardware including a CPU, a RAM, a ROM (not shown), and the like.
- the signal processing unit 10 is configured using software including an ultrasound diagnostic program stored in the ROM.
- the ultrasonic diagnostic program is a program for causing the signal processing unit 10 to execute the ultrasonic diagnostic method according to the embodiment of the present invention.
- This program can be installed externally.
- the installed program is distributed while being stored in a recording medium.
- the hardware and software are configured to operate in cooperation.
- the signal processing unit 10 can function as the above-described echo signal receiving unit 11, AD conversion unit 12, surface position detection unit 13, image generation unit 14, echo level normalization unit 15, and the like.
- the echo signal receiving unit 11 performs a predetermined amplification process on each echo signal and outputs it to the AD conversion unit 12.
- the echo signal receiving unit 11 individually amplifies each echo signal of the first echo group SW [T1] and each echo signal of the second echo group SW [T2], and outputs the amplified signal to the AD conversion unit 12.
- the AD conversion unit 12 converts the echo signal into discrete data by sampling at predetermined time intervals.
- the echo signal converted into discrete data becomes echo data. Thereby, echo data sampled at predetermined intervals in the depth direction can be obtained.
- the AD conversion unit 12 outputs the echo data to the surface position detection unit 13 and the image generation unit 14.
- the surface position detection unit 13 includes a storage unit 13a and a determination unit 13b.
- the storage unit 13a has a capacity for storing a plurality of echo data obtained in the first state [T1] and a plurality of echo data obtained in the second state [T2].
- the storage unit 13 a stores each echo data output from the AD conversion unit 12.
- the determination unit 13b performs waveforms of each region of interest in the first state [T1] (sweep echo data string) and waveforms of each comparison target region in the second state (sweep echo data). Column). Based on the comparison result, the determination unit 13b detects which position in the second state the selected region of interest corresponds to.
- the determination unit 13b detects the comparison target region in the second state [T2] that is most similar to the attention region in the first state [T1].
- the determination unit 13b detects how the region (or the representative position of the region) with the most similar waveform is displaced in the first state [T1] and the second state [T2] (has not been displaced). .
- the determination unit 13b determines the soft tissue region and the cartilage region from the difference in displacement tendency of the position of the region, and detects the surface position of the cartilage 901.
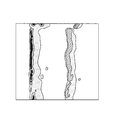
- FIG. 5 is a diagram illustrating an example of an echo level image generated by the image generation unit 14.
- the image generation unit 14 is based on the echo data from the AD conversion unit 12, for example, as shown in FIG. 5 as an example, the scanning direction of the ultrasonic probe 4 (direction intersecting the depth direction of the subject), and the cartilage 901. Echo level images based on echo signals from each position in the analysis region specified by the depth direction (direction perpendicular to the scanning direction and toward the inside of the knee) are generated.
- the echo level image is composed of a plurality of pixels arranged in a grid pattern. Each pixel is arranged at a position corresponding to each position in the analysis area, and has a luminance level corresponding to the echo intensity at each position in the analysis area.
- colors that gradually change in the order of red, orange, yellow, green, blue, and dark blue are displayed in association with each other.
- the echo level normalization unit 15 detects the echo intensity having the highest echo signal intensity (echo intensity) from each position in the analysis area, and divides the echo intensity at each position in the analysis area by the echo intensity. That is, the echo intensity at each position in the analysis region is normalized so that the maximum value is 0 dB.
- FIG. 6 is a view showing an example of an echo level image in which the surface position of the cartilage 901 is corrected.
- the surface position correction unit 16 corrects the surface position of the cartilage 901 in the echo level image generated by the image generation unit 14 so that it is included in a predetermined range in the depth direction (becomes linear). For example, as an example, the surface position correction unit 16 appropriately delays the echo signal corresponding to each position in the scanning direction, thereby linearizing the surface position of the cartilage 901 in the echo level image.
- the dynamic range setting unit 17 is provided as an upper and lower limit value setting unit for setting an upper limit value (upper limit echo intensity) and a lower limit value (lower limit echo intensity) of echo intensity at each position in the analysis region.
- the dynamic range setting unit 17 sets the maximum value (0 dB) of the signal level normalized by the echo level normalization unit 15 as the upper limit value, and sets ⁇ 40 dB as an example of the lower limit value.
- This lower limit value ( ⁇ 40 dB) is a value obtained empirically, and is set to a value capable of detecting echoes scattered inside the cartilage from the cartilage surface.
- the region-of-interest setting unit 18 extends from the surface position of the cartilage to a predetermined length in the depth direction (for example, about 0.24 mm) based on the analysis data (the surface position of the cartilage) calculated by the surface position detection unit 13. In addition, a range over a predetermined length in the scanning direction (for example, about 4 mm) is set as a region of interest.
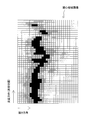
- FIG. 7 is a diagram illustrating an example of a gradation-of-interest area image.
- the gradation unit 19 gradations the luminance level of each pixel of the region-of-interest image, which is an echo level image in the region of interest set by the region-of-interest setting unit 18, in a plurality of stages (16 gradations as an example). . That is, the gradation unit 19 is provided as a stepping unit that steps the echo intensity corresponding to one of the echo intensities set in a plurality of stages. In the example illustrated in FIG. 7, an example of the region-of-interest image that is gradationized in four stages is illustrated.
- the co-occurrence matrix generation unit 20 generates a co-occurrence matrix from the echo level image in the region of interest in which the luminance level of each pixel is gradationized in 16 levels.
- the co-occurrence matrix is given by the following equation (1).
- the co-occurrence matrix generation unit 20 generates two co-occurrence matrices (a first co-occurrence matrix P d5 ⁇ 90 (i, j) and a second co-occurrence matrix P d1 ⁇ 0 (i, j)).
- the first co-occurrence matrix P d5 ⁇ 90 (i, j) is generated for a pixel pair that is 5 pixels away from each other in the scanning direction.
- the second co-occurrence matrix P d1 ⁇ 0 (i, j) is generated for a pixel pair that is one pixel apart in the depth direction.
- d which is the distance between the pixel pair
- d is a value set in advance by experiment or the like, but is not limited to the above-described value, and depends on the pixel size, beam diameter, scanning step, sampling frequency, and the like. Is set as appropriate.
- the feature quantity calculation unit 21 calculates a predetermined feature quantity from the co-occurrence matrix generated by the co-occurrence matrix generation unit 20.
- the feature amount calculation unit 21 calculates a correlation COR and a contrast CNT as the feature amount.
- the feature amount calculating unit 21 the first co-occurrence matrix P d5 ⁇ 90 (i, j) to calculate the correlation COR D5shita90 from the calculated contrast CNT D1shita0 from the second co-occurrence matrix P d1 ⁇ 0 (i, j) To do.
- Correlation COR and contrast CNT are given by the following equations (1) and (2).
- a relatively high negative correlation was observed between the correlation COR d5 ⁇ 90 in the direction parallel to the cartilage surface and the surface roughness.
- the echo intensity varies in the direction along the in-plane direction of the cartilage surface.
- the correlation COR d5 ⁇ 90 calculated by the feature amount calculation unit 21 when the correlation COR d5 ⁇ 90 calculated by the feature amount calculation unit 21 is large, it can be estimated that the degree of degeneration of the cartilage is low, and when the correlation COR d5 ⁇ 90 is small, it can be estimated that the degree of degeneration of the cartilage is high.
- a relatively high negative correlation was observed between the contrast CNT d1 ⁇ 0 in the direction perpendicular to the cartilage surface and the surface roughness. This is because, in the case of cartilage with a low degree of degeneration, an abrupt change in echo intensity occurs in the depth direction with reference to the cartilage surface, whereas in the case of a cartilage with a high degree of degeneration, an abrupt change in echo intensity is unlikely to occur. Possible cause.
- the contrast CNT d1 ⁇ 0 calculated by the feature amount calculation unit 21 when the contrast CNT d1 ⁇ 0 calculated by the feature amount calculation unit 21 is large, it can be estimated that the degree of degeneration of the cartilage is low, and when the contrast CNT d1 ⁇ 0 is small, it can be estimated that the degree of degeneration of the cartilage is high.
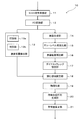
- FIG. 11 is a flowchart for explaining the operation of the signal processing unit 10. The operation of the signal processing unit 10 will be described with reference to FIG.
- step S1 the echo signal receiving unit 11 individually amplifies each echo signal of the first echo group SW [T1] and each echo signal of the second echo group SW [T2], and performs AD conversion. To the unit 12.
- step S2 the AD conversion unit 12 samples each echo signal of the first echo group SW [T1] and each echo signal of the second echo group SW [T2] at a predetermined time interval, and performs discrete processing. Convert to data.
- the AD conversion unit 12 outputs each piece of echo data converted into discrete data to the surface position detection unit 13, while outputting either one of the two echo groups to the image generation unit 14.
- step S3 the surface position detector 13 detects the surface position of the cartilage 901.
- a more specific cartilage surface detection method executed by the surface position detection unit 13 in step S3 will be described with reference to FIG. 3 and FIG.
- the movement distance ⁇ x of the probe 4 (vibrator 4a) between the first state [T1] and the second state [T2] matches the arrangement interval of the vibrators. Will be described.
- the probe 4 is brought into contact with the knee surface in a state where the subject knee is bent at the first angle. In other words, the probe 4 is brought into contact with the surface of the soft tissue 903. This is the state of FIG.
- Each transducer arranged on the probe 4 with a predetermined interval transmits an ultrasonic signal in a direction parallel to the surface of the soft tissue 903 (a scanning direction parallel to the transmission / reception surface).
- the probe 4 has five transducers arranged at equal intervals along the scanning direction.
- the vibrator transmits an ultrasonic signal in a direction orthogonal to the surface of the soft tissue 903.
- the ultrasonic signals at the respective arrangement positions are reflected and scattered at the respective depth positions of the soft tissue 903, the cartilage 901, and the subchondral bone 911, so that echo signals at respective positions (scanning direction positions) spaced at a predetermined interval in the scanning direction.
- SWT11, SWT12, SWT13, SWT14, and SWT15 are obtained.
- Each transducer receives an echo signal.
- the echo signal group of the echo signals SWT11, SWT12, SWT13, SWT14, and SWT15 obtained by each transducer becomes the first echo group SW [T1].
- the probe 4 is moved by a distance ⁇ x in a direction parallel to the surface of the soft tissue 903 and in a direction parallel to the scanning direction.
- This state is the second state [T2], which is the state shown in FIG.
- the soft tissue 903 moves following the movement of the probe 4. Therefore, the relative positional relationship between the wave transmitting / receiving surface of the probe 4 and each position in the scanning direction of the soft tissue 903 does not change without depending on the movement of the probe 4.
- the cartilage 901 is fixed to the bone 902 via the subchondral bone 911, it does not move even if the probe 4 moves. Therefore, the relative positional relationship between the transmission / reception surface of the probe 4 and each position of the cartilage 901 in the scanning direction changes according to the movement of the probe 4.
- an ultrasonic signal is transmitted from each transducer of the probe 4 in a direction parallel to the surface of the soft tissue 903 (scanning direction parallel to the transmission / reception surface).
- the ultrasonic signals at the respective scanning positions are reflected and scattered at the respective depth positions of the soft tissue 903, the cartilage 901, and the subchondral bone 911, so that the echo signals SWT21, SWT22, and SWT23 at the respective positions spaced in the scanning direction. , SWT24, SWT25 are obtained.
- Each transducer receives an echo signal.
- the echo signal group of the echo signals SWT21, SWT22, SWT23, SWT24, and SWT25 obtained by each transducer is the second echo group SW [T2].
- the first echo group SW [T1] including the plurality of echo signals SWT11, SWT12, SWT13, SWT14, and SWT15 is acquired.
- a second echo group SW [T2] including a plurality of echo signals SWT21, SWT22, SWT23, SWT24, and SWT25 is acquired.
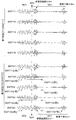
- FIG. 12 is a diagram illustrating a waveform example of each echo signal in the first state [T1] and the second state [T2].
- the distance ⁇ x that the probe 4 has moved is equal to the interval between the transducers, that is, the interval between scanning positions.
- detection of the surface of the cartilage 901 under this condition will be described.
- the soft part of the echo signal SWT11 in the first echo group SW [T1] substantially matches the region of the tissue 903 and the region of the soft tissue 903 of the echo signal SWT21 of the second echo group SW [T2].
- the waveform of the echo signal substantially coincides with the area of the soft tissue 903 of the echo signal SWT12 and the area of the soft tissue 903 of the echo signal SWT22.
- the waveform of the echo signal substantially coincides with the area of the soft tissue 903 of the echo signal SWT13 and the area of the soft tissue 903 of the echo signal SWT23.
- the waveform of the echo signal substantially matches the area of the soft tissue 903 of the echo signal SWT14 and the area of the soft tissue 903 of the echo signal SWT24.
- the waveform of the echo signal substantially coincides with the area of the soft tissue 903 of the echo signal SWT15 and the area of the soft tissue 903 of the echo signal SWT25.
- the echo signals at the respective scanning positions substantially coincide with each other in the first state [T1] and the second state [T2] along the scanning direction with respect to the probe 4.
- the cartilage of the echo signal SWT11 in the first echo group SW [T1] does not match between the region 901 and the region of the cartilage 901 of the echo signal SWT21 of the second echo group SW [T2], and the cartilage 901 of the echo signal SWT22 of the second echo group SW [T2]
- the waveform of the echo signal substantially matches the area.
- the waveform of the echo signal substantially coincides with the region of the cartilage 901 of the echo signal SWT12 and the region of the cartilage 901 of the echo signal SWT23.
- the waveform of the echo signal substantially coincides with the region of the cartilage 901 of the echo signal SWT13 and the region of the cartilage 901 of the echo signal SWT24.
- the waveform of the echo signal substantially matches the region of the cartilage 901 of the echo signal SWT14 and the region of the cartilage 901 of the echo signal SWT25.
- the echo signals at the respective scanning positions substantially coincide with each other in the first state [T1] and the second state [T2] with the scanning position shifted by one by the transducer arrangement interval.
- the echo data from the soft tissue 903 and the echo data from the cartilage 901 show different behaviors in the first state [T1] and the second state [T2]. Therefore, by detecting this behavior (change in the relative position of the target point in the first state and the second state), the region of the soft tissue 903 and the region of the cartilage 901 can be identified. Then, a cartilage surface that is a boundary surface between the soft tissue 903 and the cartilage 901 can be detected.
- step S4 the image generation unit 14 generates an echo level image as shown in FIG. 5 based on the echo data output from the AD conversion unit 12.
- step S5 the echo level normalization unit 15 normalizes the echo intensity at each position in the analysis region.
- step S6 the surface position correction unit 16 corrects the echo level image so that the surface position of the cartilage 901 in the echo level image is included in a predetermined range in the depth direction. If the surface position of the cartilage 901 in the echo level image is included in the predetermined range in the depth direction, the step S6 is omitted.
- step S7 the dynamic range setting unit 17 sets the maximum value (0 dB) of the signal level normalized by the echo level normalization unit 15 as an upper limit value, and sets ⁇ 40 dB as a lower limit value.
- step S8 the region-of-interest setting unit 18 sets a range extending from the cartilage surface position to a predetermined length in the depth direction and a predetermined length in the scanning direction as a region of interest.
- step S9 the gradation unit 19 sets the luminance level of each pixel of the region of interest image, which is an echo level image in the region of interest set in step S8, in a plurality of stages (for example, 16 gradations). Gradation.
- step S10 the co-occurrence matrix generation unit 20 generates the first co-occurrence matrix P d5 ⁇ 90 (i, j) and the second co-occurrence matrix P d1 ⁇ 0 (i, j) based on the equation (1). To do.
- step S11 the feature quantity calculating unit 21 calculates a correlation COR d5 ⁇ 90 from the first co-occurrence matrix P d5 ⁇ 90 (i, j) generated in step S10 based on the equations (2) and (3).
- the contrast CNT d1 ⁇ 0 is calculated from the second co-occurrence matrix P d1 ⁇ 0 (i, j).
- the correlation COR d5 ⁇ 90 and contrast CNT d1 ⁇ 0 calculated in this way are displayed as numerical values on the display unit 5.
- the ultrasonic diagnostic apparatus 1 can accurately grasp the state (surface roughness) of the cartilage 901 even when the state of the cartilage 901 is analyzed percutaneously.
- the ultrasound diagnostic apparatus 1 calculates the feature amount based on an echo level image formed of pixels having a luminance level corresponding to the echo intensity of the sample corresponding to each position of the region of interest, the feature amount Can be calculated appropriately.
- the upper limit echo intensity and the lower limit echo intensity are set by the dynamic range setting unit 17. Thereby, gradation of each pixel which comprises an echo level image can be performed appropriately.
- the detected portion can be reliably included in the diagnosis target.
- the feature amount is calculated from the occurrence matrix calculated by the co-occurrence matrix generation unit 20. Thereby, the feature amount can be calculated appropriately.
- the ultrasonic diagnostic apparatus 1 can appropriately estimate the surface roughness of the cartilage 901 by calculating the correlation COR having a high correlation with the surface roughness of the cartilage 901 as the feature amount.
- the first co-occurrence matrix P d5 ⁇ 90 generated for each of the pixel pairs formed by a pair of the pixels that are in a positional relationship separated by a predetermined distance in the scanning direction. From this, the correlation COR d5 ⁇ 90 is calculated. As shown in FIG. 9, the correlation COR d5 ⁇ 90 has a large correlation with the surface roughness. Therefore, the surface roughness of the cartilage 901 can be estimated more appropriately by calculating the correlation COR d5 ⁇ 90 .
- the ultrasonic diagnostic apparatus 1 can appropriately estimate the surface roughness of the cartilage 901 by calculating the contrast CNT having a high correlation with the surface roughness of the cartilage 901 as the feature amount.
- the second co-occurrence matrix P generated for each pixel pair composed of a pair of the pixels that are in a positional relationship separated by a predetermined distance in the depth direction.
- the contrast CNT d1 ⁇ 0 is calculated from d1 ⁇ 0 .
- the contrast CNT d1 ⁇ 0 has a large correlation with the surface roughness, as shown in FIG. Therefore, the surface roughness of the cartilage 901 can be estimated more appropriately by calculating the contrast CNT d1 ⁇ 0 .
- a region of interest to be analyzed is set based on the surface position of the cartilage 901 detected by the surface position detection unit. Thereby, a region of interest can be set automatically.
- the echo intensity at each position in the echo level image is normalized by dividing by the maximum value of the echo signal from the cartilage 901. In this way, individual differences in the soft tissue 903 that occur for each subject can be eliminated, so that a more accurate feature amount can be calculated for each subject.
- the echo level image is corrected so that the surface position of the cartilage 901 in the echo level image is included in a predetermined range in the depth direction.
- a co-occurrence matrix can be generated appropriately.
- the feature amount calculated by the signal processing unit 10 is displayed on the display unit 5. Thereby, the user can visually recognize the feature amount as an index indicating the degree of degeneration of the cartilage 901.
- FIG. 13 is a block diagram illustrating a configuration of a signal processing unit 10a of an ultrasonic diagnostic apparatus according to a modification.
- the signal processing unit 10a of this modification has a configuration in which the surface position detection unit 13 and the region-of-interest setting unit 18 are omitted as compared with the signal processing unit 10 of the above embodiment.
- the echo level image generated by the image generation unit 14 is displayed on the display unit 5. Then, the user views the echo level image and selects a portion including the cartilage surface in the echo level image as the region of interest. Thereafter, the signal processing unit 10 sequentially performs gradation, generation of a co-occurrence matrix, and calculation of a feature amount for the region of interest image that is an echo level image in the region of interest. Therefore, even if the signal processing unit 10a is configured as in the present modification, even if the state of the cartilage 901 is percutaneously analyzed as in the case of the above embodiment, the state of the cartilage 901 (surface (Roughness) can be accurately grasped.
- the second co-occurrence matrix P d1 ⁇ 0 (i, j) has been calculated contrast CNT D1shita0 from, the first co-occurrence matrix P d5 ⁇ 90 (i, j) and calculate the contrast CNT D5shita90 from Good.
- FIG. 14 is a graph for calculating the correlation coefficient between the contrast CNT d5 ⁇ 90 calculated by the equation (3) and the surface roughness of the cartilage surface for a plurality of samples. As shown in FIG. 14, a positive correlation was observed between the contrast CNT d5 ⁇ 90 in the direction parallel to the cartilage surface and the surface roughness.
- the correlation COR and the contrast CNT are calculated as the feature values, but the present invention is not limited to this, and other feature values may be calculated.
- local uniformity IDM, entropy EPY, arithmetic mean SUMA, arithmetic variance SUMV, etc. may be calculated as feature quantities, and the degree of cartilage degeneration may be estimated based on these.
- the probe 4 is moved in the vertical direction in close contact with the knee, thereby changing the relative positions of the probe 4, the soft tissue 903, and the cartilage 901, and detecting the surface position of the cartilage 901.
- the relative positional relationship between the probe 4, the soft tissue 903, and the cartilage 901 may be changed by fixing the probe 4 and bending the knee with a jig or the like.
- the depth position detected by the surface position detection unit 13 is the surface position of the cartilage 901, but the present invention is not limited to this.
- the moving average process may be performed along the surface position detected by the surface position detection unit 13. Thereby, the noise (spike noise etc.) at the time of surface position detection can be smoothed.
- the numerical value of the feature amount calculated by the feature amount calculation unit 21 is displayed on the display unit 5 as it is.
- the present invention is not limited to this, and indicates the degree of cartilage degeneration derived from this feature amount.
- the indicator may be displayed on the display unit 5.
- the feature amounts may be ranked in a plurality of stages according to the feature amount values, and the ranks (for example, alphabets such as A to C) may be displayed on the display unit 5.
- FIG. 15 is a block diagram showing a configuration of an ultrasonic diagnostic apparatus 1a according to a modification.
- the ultrasonic diagnostic apparatus 1 provided with the ultrasonic probe 4 and the display part 5 was illustrated, not only this but this invention is as shown in FIG.
- the present invention can also be applied to an ultrasonic diagnostic apparatus in which the unit 5 and the like are omitted.
- the echo level image is generated based on the echo signal received by the probe, and the feature amount is calculated based on the echo level image.
- the present invention is not limited to this.
- the feature amount may be calculated based on the echo intensity of the sample corresponding to each position of the region of interest without generating an echo image.
- FIG. 16 is a block diagram showing a configuration of an ultrasonic diagnostic apparatus 1b according to a modification.
- the ultrasonic diagnostic apparatus 1b according to this modification includes a staging unit 19a.
- the staging unit 19a is the echo intensity of the echo data output from the AD conversion unit 12, and the echo intensity of the sample echo data corresponding to each position of the region of interest is selected from any of the echo intensities set in a plurality of stages. Step by step.
- the feature amount calculation unit 21 targets samples having a predetermined positional relationship among samples having the stepped echo intensity, and based on a combination of the stepped echo intensities in each of the samples. The feature amount is calculated.
- each sample pair including a pair of samples that are in a predetermined distance apart in a predetermined direction in the region of interest is targeted.
- a co-occurrence matrix is generated.
- the region of interest is extracted from the analysis region, and the feature amount is calculated based on the echo data of the sample in the region of interest.
- the present invention is not limited to this. Specifically, the entire range of the analysis region may be set as the region of interest, and the feature amount may be calculated based on the sample echo data in the region of interest (that is, the analysis region).
- Ultrasonic diagnostic apparatus 4 Probe, Ultrasonic probe 19 Gradation unit (stage unit) 19a Staging unit 21 Feature amount calculation unit
Landscapes
- Health & Medical Sciences (AREA)
- Life Sciences & Earth Sciences (AREA)
- Engineering & Computer Science (AREA)
- Biomedical Technology (AREA)
- Medical Informatics (AREA)
- Pathology (AREA)
- Radiology & Medical Imaging (AREA)
- Biophysics (AREA)
- Physics & Mathematics (AREA)
- Heart & Thoracic Surgery (AREA)
- Nuclear Medicine, Radiotherapy & Molecular Imaging (AREA)
- Molecular Biology (AREA)
- Surgery (AREA)
- Animal Behavior & Ethology (AREA)
- General Health & Medical Sciences (AREA)
- Public Health (AREA)
- Veterinary Medicine (AREA)
- Computer Vision & Pattern Recognition (AREA)
- Ultra Sonic Daignosis Equipment (AREA)
Abstract
Description
超音波診断装置1は、図1に示すように、操作部2と、送信制御部3と、プローブ4と、信号処理部10と、表示部5と、を備えている。
図4は、本実施形態に係る超音波診断装置1の信号処理部10の構成を示すブロック図である。信号処理部10は、図4に示すように、エコー信号受信部11と、AD変換部12と、表面位置検出部13と、画像生成部14と、エコーレベル正規化部15と、表面位置補正部16と、ダイナミックレンジ設定部17と、関心領域設定部18と、階調化部19と、同時生起行列生成部20と、特徴量算出部21と、を備えている。信号処理部10は、CPU、RAM及びROM(図示せず)等を含むハードウェアを用いて構成されている。また、信号処理部10は、ROMに記憶された超音波診断プログラムを含むソフトウェアを用いて構成されている。

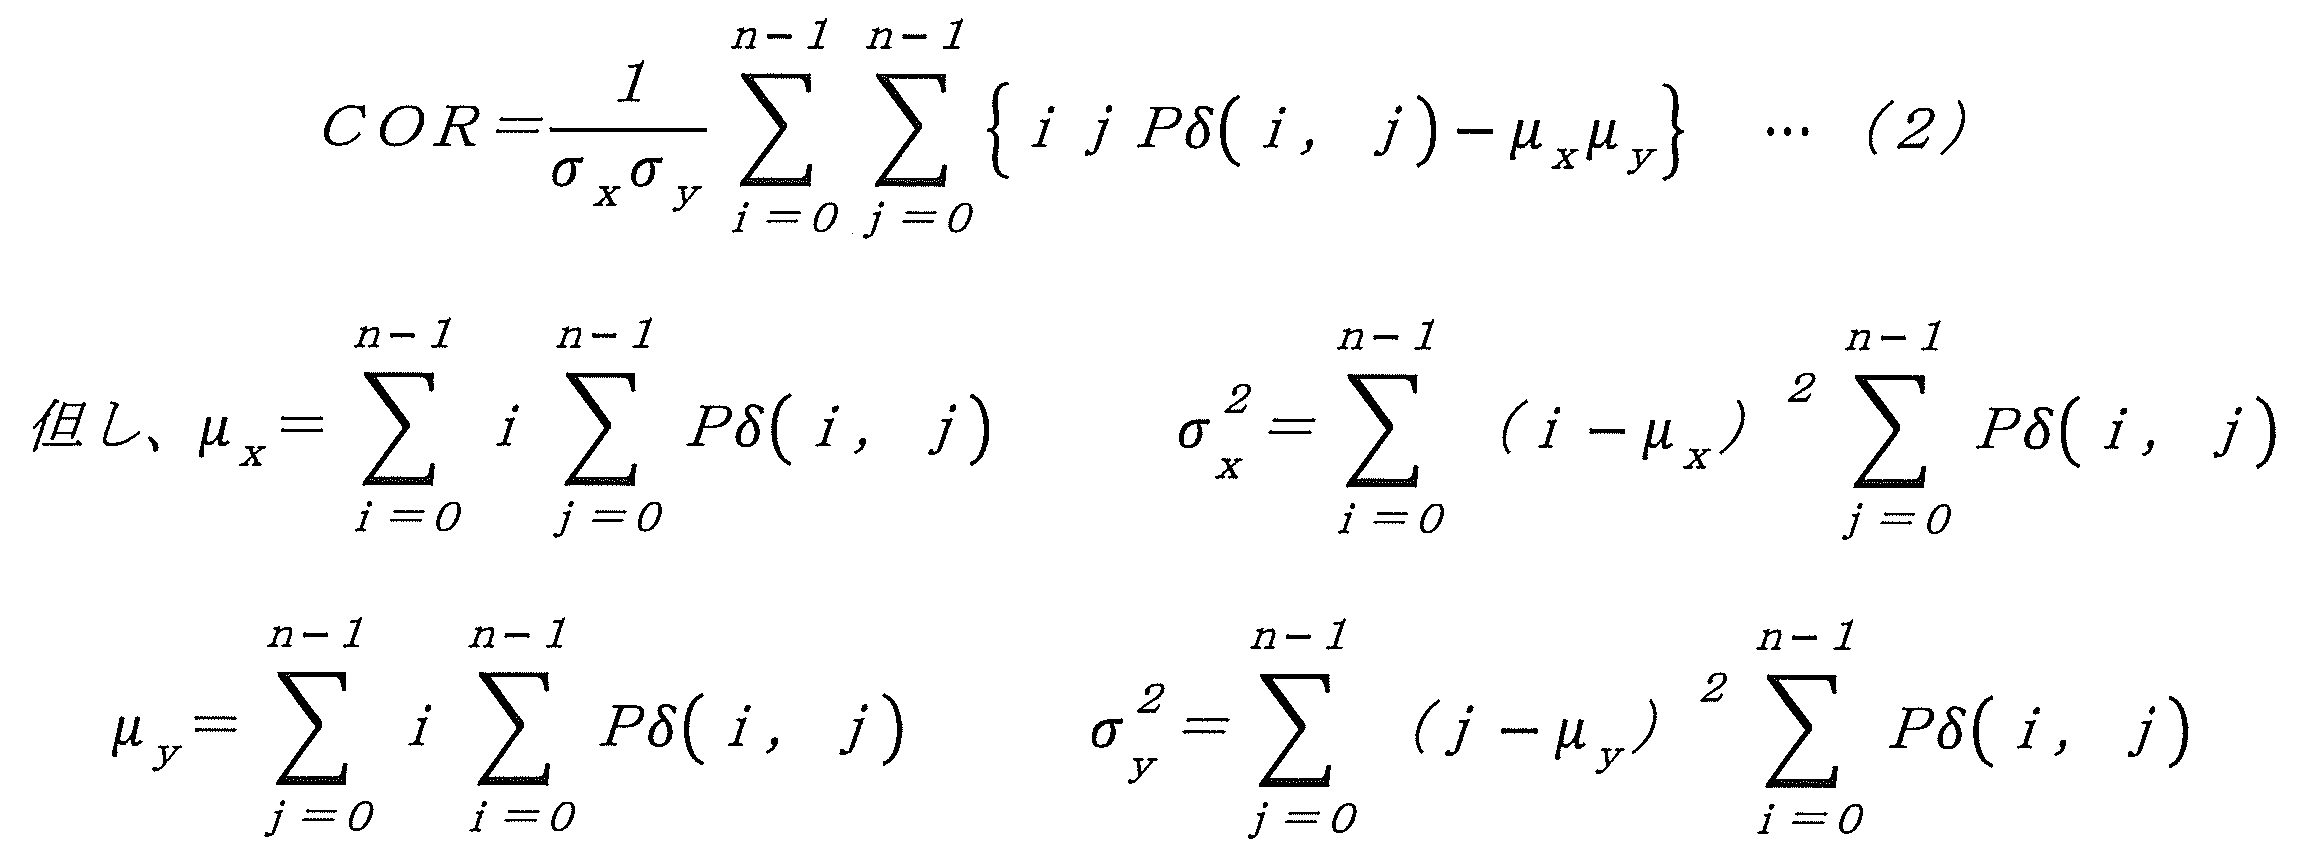

図11は、信号処理部10の動作を説明するためのフローチャートである。図11を参照して、信号処理部10の動作について説明する。
以上のように、本実施形態に係る超音波診断装置1では、膝周辺の軟部組織903を切開せずに、被検知部の状態(本実施形態では、軟骨901の表面粗さ)と相関性が高い特徴量を、関心領域の各位置に対応するサンプルのエコー信号の強度に基づいて算出し、当該特徴量から軟骨の状態を推測することができる。
(1)図13は、変形例に係る超音波診断装置の信号処理部10aの構成を示すブロック図である。本変形例の信号処理部10aは、上記実施形態の信号処理部10と比べて、表面位置検出部13及び関心領域設定部18が省略された構成となっている。




4 プローブ、超音波プローブ
19 階調化部(段階化部)
19a 段階化部
21 特徴量算出部
Claims (16)
- 被検体において検査対象となる被検知部の状態を診断するための超音波診断装置であって、
超音波プローブから前記被検体の内部に照射された超音波信号のエコー信号に基づいて算出され、前記被検体の深さ方向と該深さ方向と交差する方向とで特定される関心領域の各位置に対応するサンプルのエコー信号の強度であるエコー強度を、複数段階に設定されたエコー強度のいずれかに対応させて段階化する段階化部と、
前記段階化部で段階化された各前記エコー強度を有するサンプルの中から、互いに所定の位置関係にあるサンプルを対象とし、各該サンプルのそれぞれにおける前記段階化部で段階化されたエコー強度の組み合わせに基づいて、前記関心領域の特徴を表す特徴量を算出する特徴量算出部と、
を備えていることを特徴とする、超音波診断装置。 - 請求項1に記載の超音波診断装置において、
前記関心領域の各位置に対応するサンプルのエコー信号のエコー強度に対応する輝度レベルを有し、それぞれが前記関心領域の各位置に対応する複数の画素、で構成されたエコーレベル画像を生成する画像生成部、を更に備えていることを特徴とする、超音波診断装置。 - 請求項1又は請求項2に記載の超音波診断装置において、
複数段階に設定される前記エコー強度のうちの値が最も大きい上限エコー強度と値が最も小さい下限エコー強度とを設定する上下限値設定部、を更に備えていることを特徴とする、超音波診断装置。 - 請求項1から請求項3のいずれか1項に記載の超音波診断装置において、
前記関心領域は、前記被検知部の表面からのエコー信号を含む領域として設定されることを特徴とする、超音波診断装置。 - 請求項1から請求項4のいずれか1項に記載の超音波診断装置において、
前記関心領域の各位置に対応するサンプルにおける前記段階化部で段階化された各前記エコー強度に基づいて、同時生起行列を生成する同時生起行列生成部を更に備え、
前記特徴量算出部は、前記同時生起行列生成部で生成された前記同時生起行列から、前記特徴量を算出することを特徴とする、超音波診断装置。 - 請求項5に記載の超音波診断装置において、
前記特徴量算出部は、前記特徴量として相関を算出することを特徴とする、超音波診断装置。 - 請求項6に記載の超音波診断装置において、
前記同時生起行列生成部は、前記関心領域における、前記深さ方向と交差する方向に所定距離離れた位置関係にある一対のサンプルで構成されるサンプル対、のそれぞれを対象として、前記同時生起行列としての第1同時生起行列を算出し、
前記特徴量算出部は、前記第1同時生起行列から前記相関を算出することを特徴とする、超音波診断装置。 - 請求項5から請求項7のいずれか1項に記載の超音波診断装置において、
前記特徴量算出部は、前記特徴量としてコントラストを算出することを特徴とする、超音波診断装置。 - 請求項8に記載の超音波診断装置において、
前記同時生起行列生成部は、前記関心領域における、前記深さ方向に所定距離離れた位置関係にある一対のサンプルで構成されるサンプル対、のそれぞれを対象として、前記同時生起行列としての第2同時生起行列を算出し、
前記特徴量算出部は、前記第2同時生起行列から前記コントラストを算出することを特徴とする、超音波診断装置。 - 請求項1から請求項9のいずれか1項に記載の超音波診断装置において、
前記エコー信号に基づき、前記被検知部の表面の前記深さ方向における位置を検出する表面位置検出部と、
前記表面位置検出部で検出された前記被検知部の表面の位置に基づいて、前記関心領域を設定する関心領域設定部と、
を更に備えていることを特徴とする、超音波診断装置。 - 請求項10に記載の超音波診断装置において、
複数段階に設定される前記エコー強度のうちの値が最も大きい上限エコー強度と値が最も小さい下限エコー強度とを設定する上下限値設定部、を更に備え、
前記上下限値設定部は、前記表面位置検出部で検出された前記被検知部の表面からのエコー信号の最大値を検出し、該最大値を前記上限エコー強度として設定し、
前記関心領域の各位置における前記エコー強度を、前記上下限値設定部で検出された前記最大値で除算するエコーレベル正規化部、を更に備えることを特徴とする、超音波診断装置。 - 請求項10又は請求項11に記載の超音波診断装置において、
前記関心領域における前記被検知部の表面の位置が、前記深さ方向における所定範囲内に含まれるように、前記関心領域におけるサンプルの深さ位置を補正する表面位置補正部、を更に備えることを特徴とする、超音波診断装置。 - 請求項1から請求項12のいずれか1項に記載の超音波診断装置において、
前記被検体の内部に超音波信号を照射する前記超音波プローブと、
前記特徴量算出部によって算出された前記特徴量、又は該特徴量に基づいて導出された、前記被検体の被検知部の状態を示す指標、を表示する表示部と、
を更に備えていることを特徴とする、超音波診断装置。 - 請求項13に記載の超音波診断装置において、
前記超音波プローブは、前記被検体の表面に沿って走査されることにより、前記深さ方向と、前記深さ方向と交差する方向である該超音波プローブの走査方向と、で特定される前記関心領域、に対する超音波の送受信が可能であることを特徴とする、超音波診断装置。 - 被検体において検査対象となる被検知部の状態を診断するための超音波診断方法であって、
超音波プローブから前記被検体の内部に照射された超音波信号のエコー信号に基づいて算出され、前記被検体の深さ方向と該深さ方向と交差する方向とで特定される関心領域の各位置に対応するサンプルのエコー信号の強度であるエコー強度を、複数段階に設定されたエコー強度のいずれかに対応させて段階化するステップと、
前記段階化するステップで段階化された各前記エコー強度を有するサンプルの中から、互いに所定の位置関係にあるサンプルを対象とし、各該サンプルのそれぞれにおける前記段階化されたエコー強度の組み合わせに基づいて、前記関心領域の特徴を表す特徴量を算出するステップと、
を含むことを特徴とする、超音波診断方法。 - 被検体において検査対象となる被検知部の状態を診断するための超音波診断プログラムであって、
超音波プローブから前記被検体の内部に照射された超音波信号のエコー信号に基づいて算出され、前記被検体の深さ方向と該深さ方向と交差する方向とで特定される関心領域の各位置に対応するサンプルのエコー信号の強度であるエコー強度を、複数段階に設定されたエコー強度のいずれかに対応させて段階化するステップと、
前記段階化するステップで段階化された各前記エコー強度を有するサンプルの中から、互いに所定の位置関係にあるサンプルを対象とし、各該サンプルのそれぞれにおける前記段階化されたエコー強度の組み合わせに基づいて、前記関心領域の特徴を表す特徴量を算出するステップと、
をコンピュータに実行させることを特徴とする、超音波診断プログラム。
Priority Applications (3)
| Application Number | Priority Date | Filing Date | Title |
|---|---|---|---|
| CN201480055246.7A CN105636520B (zh) | 2013-10-07 | 2014-09-02 | 超声波诊断装置以及特征量计算方法 |
| US15/027,680 US11020088B2 (en) | 2013-10-07 | 2014-09-02 | Program, method and device for ultrasonic diagnosis |
| JP2015541476A JP6038338B2 (ja) | 2013-10-07 | 2014-09-02 | 超音波診断装置、超音波診断方法、及び超音波診断プログラム |
Applications Claiming Priority (2)
| Application Number | Priority Date | Filing Date | Title |
|---|---|---|---|
| JP2013-210183 | 2013-10-07 | ||
| JP2013210183 | 2013-10-07 |
Publications (1)
| Publication Number | Publication Date |
|---|---|
| WO2015053007A1 true WO2015053007A1 (ja) | 2015-04-16 |
Family
ID=52812827
Family Applications (1)
| Application Number | Title | Priority Date | Filing Date |
|---|---|---|---|
| PCT/JP2014/072998 Ceased WO2015053007A1 (ja) | 2013-10-07 | 2014-09-02 | 超音波診断装置、超音波診断方法、及び超音波診断プログラム |
Country Status (4)
| Country | Link |
|---|---|
| US (1) | US11020088B2 (ja) |
| JP (1) | JP6038338B2 (ja) |
| CN (1) | CN105636520B (ja) |
| WO (1) | WO2015053007A1 (ja) |
Cited By (3)
| Publication number | Priority date | Publication date | Assignee | Title |
|---|---|---|---|---|
| WO2017094397A1 (ja) * | 2015-12-04 | 2017-06-08 | 古野電気株式会社 | 超音波解析装置、超音波解析方法及び超音波解析プログラム |
| WO2017110361A1 (ja) * | 2015-12-25 | 2017-06-29 | 古野電気株式会社 | 超音波解析装置、超音波解析方法、および超音波解析プログラム |
| JP2019208971A (ja) * | 2018-06-07 | 2019-12-12 | 古野電気株式会社 | 超音波解析装置、超音波解析方法および超音波解析プログラム |
Families Citing this family (2)
| Publication number | Priority date | Publication date | Assignee | Title |
|---|---|---|---|---|
| CN112308065B (zh) * | 2020-07-09 | 2024-05-24 | 什维新智医疗科技(上海)有限公司 | 一种识别超声图像中特征的方法、系统及电子设备 |
| CN112807024B (zh) * | 2021-01-28 | 2022-05-24 | 清华大学 | 一种超声图像定量评估系统 |
Citations (6)
| Publication number | Priority date | Publication date | Assignee | Title |
|---|---|---|---|---|
| JP2010000126A (ja) * | 2008-06-18 | 2010-01-07 | Aloka Co Ltd | 超音波診断装置 |
| JP2010017530A (ja) * | 2008-06-13 | 2010-01-28 | Canon Inc | 超音波装置及びその制御方法 |
| JP2011050555A (ja) * | 2009-09-01 | 2011-03-17 | Furuno Electric Co Ltd | 超音波骨解析装置 |
| JP5302578B2 (ja) * | 2008-06-18 | 2013-10-02 | 日立アロカメディカル株式会社 | 超音波診断装置 |
| WO2014045924A1 (ja) * | 2012-09-19 | 2014-03-27 | 古野電気株式会社 | 軟組織軟骨境界面検出方法、軟組織軟骨境界面検出装置、および軟組織軟骨境界面検出プログラム |
| WO2014103512A1 (ja) * | 2012-12-28 | 2014-07-03 | 古野電気株式会社 | 軟組織軟骨境界面検出方法、軟組織軟骨境界面検出装置、および軟組織軟骨境界面検出プログラム |
Family Cites Families (14)
| Publication number | Priority date | Publication date | Assignee | Title |
|---|---|---|---|---|
| JPS532578B2 (ja) | 1972-09-20 | 1978-01-30 | ||
| US6088295A (en) * | 1998-12-29 | 2000-07-11 | The United States Of America As Represented By The Secretary Of The Navy | Feature imaging and adaptive focusing for synthetic aperture processor |
| WO2001057514A1 (en) * | 2000-01-31 | 2001-08-09 | Angelsen Bjoern A J | Correction of phasefront aberrations and pulse reverberations in medical ultrasound imaging |
| US6494840B1 (en) * | 2000-07-31 | 2002-12-17 | The Hong Kong Polytechnic University | Portable ultrasonic palpation system |
| JP2002345821A (ja) | 2001-05-29 | 2002-12-03 | Koji Hattori | 関節腔内の超音波解析システム |
| US6932770B2 (en) * | 2003-08-04 | 2005-08-23 | Prisma Medical Technologies Llc | Method and apparatus for ultrasonic imaging |
| WO2006064470A2 (en) * | 2004-12-17 | 2006-06-22 | Koninklijke Philips Electronics, N.V. | Method and apparatus for automatically developing a high performance classifier for producing medically meaningful descriptors in medical diagnosis imaging |
| US7555152B2 (en) * | 2005-01-06 | 2009-06-30 | Siemens Medical Solutions Usa, Inc. | System and method for detecting ground glass nodules in medical images |
| CN1969766A (zh) * | 2006-12-01 | 2007-05-30 | 华中科技大学 | 单定标脂肪肝b超图像定量分析方法 |
| WO2008139812A1 (ja) * | 2007-05-08 | 2008-11-20 | Olympus Corporation | 画像処理装置および画像処理プログラム |
| CN101744641A (zh) * | 2008-11-28 | 2010-06-23 | 李乾 | 超声波组织评价装置 |
| CN102324094A (zh) * | 2011-05-30 | 2012-01-18 | 复旦大学 | 骨骼肌损伤超声图像纹理定量分析的强度界面多级分解法 |
| CN102488963B (zh) * | 2011-12-08 | 2013-10-09 | 天津大学 | 一种功能性电刺激膝关节角度控制方法 |
| JP6081139B2 (ja) * | 2011-12-26 | 2017-02-15 | 東芝メディカルシステムズ株式会社 | 超音波診断装置、医用画像処理装置、及び医用画像処理方法 |
-
2014
- 2014-09-02 CN CN201480055246.7A patent/CN105636520B/zh not_active Expired - Fee Related
- 2014-09-02 JP JP2015541476A patent/JP6038338B2/ja not_active Expired - Fee Related
- 2014-09-02 US US15/027,680 patent/US11020088B2/en not_active Expired - Fee Related
- 2014-09-02 WO PCT/JP2014/072998 patent/WO2015053007A1/ja not_active Ceased
Patent Citations (6)
| Publication number | Priority date | Publication date | Assignee | Title |
|---|---|---|---|---|
| JP2010017530A (ja) * | 2008-06-13 | 2010-01-28 | Canon Inc | 超音波装置及びその制御方法 |
| JP2010000126A (ja) * | 2008-06-18 | 2010-01-07 | Aloka Co Ltd | 超音波診断装置 |
| JP5302578B2 (ja) * | 2008-06-18 | 2013-10-02 | 日立アロカメディカル株式会社 | 超音波診断装置 |
| JP2011050555A (ja) * | 2009-09-01 | 2011-03-17 | Furuno Electric Co Ltd | 超音波骨解析装置 |
| WO2014045924A1 (ja) * | 2012-09-19 | 2014-03-27 | 古野電気株式会社 | 軟組織軟骨境界面検出方法、軟組織軟骨境界面検出装置、および軟組織軟骨境界面検出プログラム |
| WO2014103512A1 (ja) * | 2012-12-28 | 2014-07-03 | 古野電気株式会社 | 軟組織軟骨境界面検出方法、軟組織軟骨境界面検出装置、および軟組織軟骨境界面検出プログラム |
Cited By (9)
| Publication number | Priority date | Publication date | Assignee | Title |
|---|---|---|---|---|
| WO2017094397A1 (ja) * | 2015-12-04 | 2017-06-08 | 古野電気株式会社 | 超音波解析装置、超音波解析方法及び超音波解析プログラム |
| JPWO2017094397A1 (ja) * | 2015-12-04 | 2018-09-20 | 古野電気株式会社 | 超音波解析装置、超音波解析方法及び超音波解析プログラム |
| CN108601584A (zh) * | 2015-12-04 | 2018-09-28 | 古野电气株式会社 | 超声波解析装置、超声波解析方法及超声波解析程序 |
| CN108601584B (zh) * | 2015-12-04 | 2021-05-28 | 古野电气株式会社 | 超声波解析装置、超声波解析方法及存储介质 |
| WO2017110361A1 (ja) * | 2015-12-25 | 2017-06-29 | 古野電気株式会社 | 超音波解析装置、超音波解析方法、および超音波解析プログラム |
| JPWO2017110361A1 (ja) * | 2015-12-25 | 2018-10-04 | 古野電気株式会社 | 超音波解析装置、超音波解析方法、および超音波解析プログラム |
| JP2019208971A (ja) * | 2018-06-07 | 2019-12-12 | 古野電気株式会社 | 超音波解析装置、超音波解析方法および超音波解析プログラム |
| CN110575197A (zh) * | 2018-06-07 | 2019-12-17 | 古野电气株式会社 | 超声波解析装置、超声波解析方法及存储介质 |
| JP7107522B2 (ja) | 2018-06-07 | 2022-07-27 | 古野電気株式会社 | 超音波解析装置、超音波解析方法および超音波解析プログラム |
Also Published As
| Publication number | Publication date |
|---|---|
| US20160242735A1 (en) | 2016-08-25 |
| JP6038338B2 (ja) | 2016-12-07 |
| CN105636520A (zh) | 2016-06-01 |
| CN105636520B (zh) | 2018-12-07 |
| US11020088B2 (en) | 2021-06-01 |
| JPWO2015053007A1 (ja) | 2017-03-09 |
Similar Documents
| Publication | Publication Date | Title |
|---|---|---|
| EP1974672B1 (en) | Ultrasonic imaging apparatus and ultrasonic velocity optimization method | |
| US7887485B2 (en) | Ultrasonic image boundary extracting method, ultrasonic image boundary extracting apparatus, and ultrasonic imaging apparatus | |
| US7833159B2 (en) | Image processing system and method of enhancing the quality of an ultrasound image | |
| CN106963419B (zh) | 解析装置 | |
| JP6038338B2 (ja) | 超音波診断装置、超音波診断方法、及び超音波診断プログラム | |
| CN114360727A (zh) | 超声弹性成像装置及弹性成像结果评价方法 | |
| CN102802536A (zh) | 超声波诊断装置、超声波诊断装置的动作方法以及超声波诊断装置的动作程序 | |
| CN103239258A (zh) | 采用超声波的同轴切变波表征 | |
| KR20150037689A (ko) | 의료용 초음파 영상의 전단파 검출 | |
| US11432806B2 (en) | Information processing apparatus, information processing method, and storage medium | |
| CN114144120A (zh) | 超声波诊断装置及超声波诊断装置的控制方法 | |
| US20060079780A1 (en) | Ultrasonic imaging apparatus | |
| CN110840488B (zh) | 一种基于剪切波的成像方法、系统及装置 | |
| US7713206B2 (en) | Ultrasonic imaging apparatus | |
| US20190328363A1 (en) | Ultrasound diagnostic apparatus and ultrasound signal processing method | |
| US20150316514A1 (en) | Signal processing device, ultrasound diagnostic apparatus, and signal processing method | |
| WO2014017255A1 (ja) | 超音波観測装置、超音波観測装置の作動方法および超音波観測装置の作動プログラム | |
| WO2013176259A1 (ja) | 超音波診断装置、超音波診断方法、及び超音波診断プログラム | |
| Joseph et al. | A virtual instrument for automated measurement of arterial compliance | |
| US8795181B2 (en) | System and method for analyzing carpal tunnel using ultrasound imaging | |
| US10492762B2 (en) | Ultrasound diagnostic device, ultrasound diagnostic method, and program | |
| JPWO2017110361A1 (ja) | 超音波解析装置、超音波解析方法、および超音波解析プログラム | |
| EP4195146B1 (en) | Ultrasound diagnostic apparatus and control method of ultrasound diagnostic apparatus | |
| US20240081788A1 (en) | Ultrasound diagnostic apparatus and control method for ultrasound diagnostic apparatus | |
| JP7302651B2 (ja) | 超音波信号処理装置、超音波診断装置、超音波信号処理方法、およびプログラム |
Legal Events
| Date | Code | Title | Description |
|---|---|---|---|
| 121 | Ep: the epo has been informed by wipo that ep was designated in this application |
Ref document number: 14852385 Country of ref document: EP Kind code of ref document: A1 |
|
| ENP | Entry into the national phase |
Ref document number: 2015541476 Country of ref document: JP Kind code of ref document: A |
|
| WWE | Wipo information: entry into national phase |
Ref document number: 15027680 Country of ref document: US |
|
| NENP | Non-entry into the national phase |
Ref country code: DE |
|
| 122 | Ep: pct application non-entry in european phase |
Ref document number: 14852385 Country of ref document: EP Kind code of ref document: A1 |