WO2015045191A1 - 光学的測定方法および光学的測定システム - Google Patents
光学的測定方法および光学的測定システム Download PDFInfo
- Publication number
- WO2015045191A1 WO2015045191A1 PCT/JP2013/080817 JP2013080817W WO2015045191A1 WO 2015045191 A1 WO2015045191 A1 WO 2015045191A1 JP 2013080817 W JP2013080817 W JP 2013080817W WO 2015045191 A1 WO2015045191 A1 WO 2015045191A1
- Authority
- WO
- WIPO (PCT)
- Prior art keywords
- interference
- light
- tissues
- oct
- spectrum
- Prior art date
- Legal status (The legal status is an assumption and is not a legal conclusion. Google has not performed a legal analysis and makes no representation as to the accuracy of the status listed.)
- Ceased
Links
Images


Classifications
-
- A—HUMAN NECESSITIES
- A61—MEDICAL OR VETERINARY SCIENCE; HYGIENE
- A61B—DIAGNOSIS; SURGERY; IDENTIFICATION
- A61B1/00—Instruments for performing medical examinations of the interior of cavities or tubes of the body by visual or photographical inspection, e.g. endoscopes; Illuminating arrangements therefor
- A61B1/00163—Optical arrangements
- A61B1/00194—Optical arrangements adapted for three-dimensional imaging
-
- A—HUMAN NECESSITIES
- A61—MEDICAL OR VETERINARY SCIENCE; HYGIENE
- A61B—DIAGNOSIS; SURGERY; IDENTIFICATION
- A61B1/00—Instruments for performing medical examinations of the interior of cavities or tubes of the body by visual or photographical inspection, e.g. endoscopes; Illuminating arrangements therefor
- A61B1/00163—Optical arrangements
- A61B1/00172—Optical arrangements with means for scanning
-
- A—HUMAN NECESSITIES
- A61—MEDICAL OR VETERINARY SCIENCE; HYGIENE
- A61B—DIAGNOSIS; SURGERY; IDENTIFICATION
- A61B5/00—Measuring for diagnostic purposes; Identification of persons
- A61B5/0059—Measuring for diagnostic purposes; Identification of persons using light, e.g. diagnosis by transillumination, diascopy, fluorescence
- A61B5/0062—Arrangements for scanning
- A61B5/0066—Optical coherence imaging
-
- A—HUMAN NECESSITIES
- A61—MEDICAL OR VETERINARY SCIENCE; HYGIENE
- A61B—DIAGNOSIS; SURGERY; IDENTIFICATION
- A61B5/00—Measuring for diagnostic purposes; Identification of persons
- A61B5/0059—Measuring for diagnostic purposes; Identification of persons using light, e.g. diagnosis by transillumination, diascopy, fluorescence
- A61B5/0075—Measuring for diagnostic purposes; Identification of persons using light, e.g. diagnosis by transillumination, diascopy, fluorescence by spectroscopy, i.e. measuring spectra, e.g. Raman spectroscopy, infrared absorption spectroscopy
-
- A—HUMAN NECESSITIES
- A61—MEDICAL OR VETERINARY SCIENCE; HYGIENE
- A61B—DIAGNOSIS; SURGERY; IDENTIFICATION
- A61B5/00—Measuring for diagnostic purposes; Identification of persons
- A61B5/0059—Measuring for diagnostic purposes; Identification of persons using light, e.g. diagnosis by transillumination, diascopy, fluorescence
- A61B5/0082—Measuring for diagnostic purposes; Identification of persons using light, e.g. diagnosis by transillumination, diascopy, fluorescence adapted for particular medical purposes
- A61B5/0084—Measuring for diagnostic purposes; Identification of persons using light, e.g. diagnosis by transillumination, diascopy, fluorescence adapted for particular medical purposes for introduction into the body, e.g. by catheters
-
- A—HUMAN NECESSITIES
- A61—MEDICAL OR VETERINARY SCIENCE; HYGIENE
- A61B—DIAGNOSIS; SURGERY; IDENTIFICATION
- A61B5/00—Measuring for diagnostic purposes; Identification of persons
- A61B5/02—Detecting, measuring or recording for evaluating the cardiovascular system, e.g. pulse, heart rate, blood pressure or blood flow
- A61B5/02007—Evaluating blood vessel condition, e.g. elasticity, compliance
-
- G—PHYSICS
- G01—MEASURING; TESTING
- G01N—INVESTIGATING OR ANALYSING MATERIALS BY DETERMINING THEIR CHEMICAL OR PHYSICAL PROPERTIES
- G01N21/00—Investigating or analysing materials by the use of optical means, i.e. using sub-millimetre waves, infrared, visible or ultraviolet light
- G01N21/17—Systems in which incident light is modified in accordance with the properties of the material investigated
- G01N21/47—Scattering, i.e. diffuse reflection
- G01N21/4795—Scattering, i.e. diffuse reflection spatially resolved investigating of object in scattering medium
-
- G—PHYSICS
- G06—COMPUTING OR CALCULATING; COUNTING
- G06F—ELECTRIC DIGITAL DATA PROCESSING
- G06F18/00—Pattern recognition
- G06F18/20—Analysing
- G06F18/24—Classification techniques
-
- G—PHYSICS
- G06—COMPUTING OR CALCULATING; COUNTING
- G06T—IMAGE DATA PROCESSING OR GENERATION, IN GENERAL
- G06T7/00—Image analysis
- G06T7/0002—Inspection of images, e.g. flaw detection
- G06T7/0012—Biomedical image inspection
-
- G—PHYSICS
- G06—COMPUTING OR CALCULATING; COUNTING
- G06T—IMAGE DATA PROCESSING OR GENERATION, IN GENERAL
- G06T7/00—Image analysis
- G06T7/10—Segmentation; Edge detection
- G06T7/12—Edge-based segmentation
-
- A—HUMAN NECESSITIES
- A61—MEDICAL OR VETERINARY SCIENCE; HYGIENE
- A61B—DIAGNOSIS; SURGERY; IDENTIFICATION
- A61B2576/00—Medical imaging apparatus involving image processing or analysis
- A61B2576/02—Medical imaging apparatus involving image processing or analysis specially adapted for a particular organ or body part
-
- G—PHYSICS
- G01—MEASURING; TESTING
- G01N—INVESTIGATING OR ANALYSING MATERIALS BY DETERMINING THEIR CHEMICAL OR PHYSICAL PROPERTIES
- G01N21/00—Investigating or analysing materials by the use of optical means, i.e. using sub-millimetre waves, infrared, visible or ultraviolet light
- G01N21/17—Systems in which incident light is modified in accordance with the properties of the material investigated
- G01N2021/178—Methods for obtaining spatial resolution of the property being measured
- G01N2021/1785—Three dimensional
- G01N2021/1787—Tomographic, i.e. computerised reconstruction from projective measurements
-
- G—PHYSICS
- G06—COMPUTING OR CALCULATING; COUNTING
- G06T—IMAGE DATA PROCESSING OR GENERATION, IN GENERAL
- G06T2207/00—Indexing scheme for image analysis or image enhancement
- G06T2207/10—Image acquisition modality
- G06T2207/10004—Still image; Photographic image
-
- G—PHYSICS
- G06—COMPUTING OR CALCULATING; COUNTING
- G06T—IMAGE DATA PROCESSING OR GENERATION, IN GENERAL
- G06T2207/00—Indexing scheme for image analysis or image enhancement
- G06T2207/10—Image acquisition modality
- G06T2207/10072—Tomographic images
- G06T2207/10101—Optical tomography; Optical coherence tomography [OCT]
-
- G—PHYSICS
- G06—COMPUTING OR CALCULATING; COUNTING
- G06T—IMAGE DATA PROCESSING OR GENERATION, IN GENERAL
- G06T2207/00—Indexing scheme for image analysis or image enhancement
- G06T2207/30—Subject of image; Context of image processing
- G06T2207/30004—Biomedical image processing
- G06T2207/30024—Cell structures in vitro; Tissue sections in vitro
-
- G—PHYSICS
- G06—COMPUTING OR CALCULATING; COUNTING
- G06T—IMAGE DATA PROCESSING OR GENERATION, IN GENERAL
- G06T2207/00—Indexing scheme for image analysis or image enhancement
- G06T2207/30—Subject of image; Context of image processing
- G06T2207/30004—Biomedical image processing
- G06T2207/30101—Blood vessel; Artery; Vein; Vascular
-
- G—PHYSICS
- G06—COMPUTING OR CALCULATING; COUNTING
- G06T—IMAGE DATA PROCESSING OR GENERATION, IN GENERAL
- G06T2210/00—Indexing scheme for image generation or computer graphics
- G06T2210/41—Medical
-
- G—PHYSICS
- G16—INFORMATION AND COMMUNICATION TECHNOLOGY [ICT] SPECIALLY ADAPTED FOR SPECIFIC APPLICATION FIELDS
- G16H—HEALTHCARE INFORMATICS, i.e. INFORMATION AND COMMUNICATION TECHNOLOGY [ICT] SPECIALLY ADAPTED FOR THE HANDLING OR PROCESSING OF MEDICAL OR HEALTHCARE DATA
- G16H30/00—ICT specially adapted for the handling or processing of medical images
- G16H30/40—ICT specially adapted for the handling or processing of medical images for processing medical images, e.g. editing
Definitions
- the present invention relates to a method and a system for measuring a living tissue or the like using a technique of optical coherence tomography (Optical Coherence Tomography: OCT).
- OCT optical Coherence Tomography
- OCT optical coherence tomography
- OCT causes the back reflected light generated when the measurement object is irradiated with the measurement light to interfere with the reference light that has passed through the reference light path, and detects and analyzes the interference light, thereby detecting the interference light on the optical path of the measurement light. This is a technique for measuring the reflectance distribution.
- the OCT measurement is performed by irradiating the blood vessel wall from the lumen of the blood vessel, and the inner wall of the blood vessel is scanned with the measurement light. Can be measured in two or three dimensions.
- the intima, media, and outer membranes that make up blood vessels and the lipids, calcareous, and fibers that make up plaque lesions have different reflectance distributions, so the plaque composition is identified from OCT blood vessel tomographic images.
- Patent Documents 1 and 2 disclose a method of calculating an attenuation coefficient and a backscattering coefficient from an OCT image and classifying the plaque composition based on these values.
- the risk of complications during treatment and the risk of recurrence of lesions after treatment can be reduced, and the patient's life prognosis can be improved.
- Patent Document 3 discloses that the accuracy of identifying a plaque can be improved by acquiring spectroscopic wavelength spectrum information together with an OCT image using an optical system common to OCT.
- Patent Document 3 has a problem that the measurement accuracy of the optical attenuation value is lowered due to speckle noise peculiar to OCT.
- Speckle noise is noise caused by detecting light by interfering with light, and randomly modulates the luminance of an OCT image. Since the light attenuation value is calculated as the slope of the function of the OCT image luminance with respect to the depth, it is affected by speckle noise.
- the present invention has been made to solve the above-mentioned problems, and an optical measurement method capable of reducing the influence of errors due to speckle noise in OCT and measuring a measurement object with high accuracy.
- An object is to provide an optical measurement system.
- the optical measurement method of the present invention includes an acquisition step of acquiring a spectrum of interference light formed by interference between back reflected light from a measurement object including a plurality of tissues and reference light using an interference optical system, and Based on the spectrum of the interference light, a reflectance image creating step for creating a two-dimensional reflectance image of the measurement object by OCT, and the reflectance based on the luminance distribution in the created reflectance image.
- An extraction step for extracting a region occupied by each of the plurality of tissues in the image and a boundary between the plurality of tissues, and a setting for setting an analysis target range and a spatial averaging range based on the extracted region and the boundary And, for each pixel in the set analysis target range, the density distribution of the component obtained by spectral OCT is calculated in the spatial averaging range including the pixels. And calculating the concentration distribution of the component in each of the plurality of tissues, and calculating the concentration distribution of the extracted component and the calculated component A classification step for classifying the type of tissue, and a tissue classification image generation step for generating a tissue classification image based on the classified tissue type.
- the optical measurement system of the present invention includes an interference optical system that measures a spectrum of interference light formed by interference between back reflected light from a measurement object including a plurality of tissues and reference light, and analyzes the spectrum of the interference light. And an analyzing unit that obtains a spectrum of interference light formed by interference between back reflected light from a measurement object and reference light using an interference optical system, and the acquired interference light Based on the spectrum, a two-dimensional reflectance image of the measurement object is generated by OCT, and a region occupied by each of the plurality of tissues in the reflectance image based on a luminance distribution in the generated reflectance image And a boundary between the plurality of tissues is extracted, an analysis target range and a spatial averaging range are set based on the extracted region and the boundary, and each of the set analysis target ranges is set.
- a configuration in each of the plurality of tissues is obtained by averaging the concentration distribution of the component obtained by spectral OCT in the spatial averaging range including each pixel to obtain the component concentration in each pixel.
- a component concentration distribution is calculated, a tissue type is classified based on the extracted region and the calculated component concentration distribution, and a tissue classification image is generated based on the classified tissue type. .
- the interference optical system measures a spectrum of interference light in a wavelength band including 1.70 to 1.75 ⁇ m, and the constituent component is a lipid. Is preferred.
- the present invention it is possible to reduce the influence of errors due to speckle noise in OCT and to measure a measurement object with high accuracy.
- FIG. 1 is a diagram illustrating a configuration of an OCT apparatus 1 including an optical probe 10 according to the present embodiment.
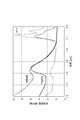
- FIG. 2 is a diagram showing the transmittance spectra of lipid lesions, normal blood vessels, and lards.
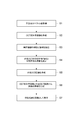
- FIG. 3 is a diagram showing a flow of the optical measurement method of the present embodiment.
- FIG. 4 is a table for explaining the classification of the types of tissues.
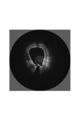
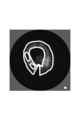
- FIG. 5 is a diagram showing the reflectance image created in the reflectance image creation step S2.
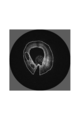
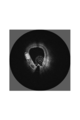
- FIG. 6 is a diagram showing the boundary extracted in the extraction step S3 as a broken line and superimposed on the OCT reflectance image.
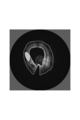
- FIG. 7 is a diagram illustrating the analysis target range and the spatial averaging range of the spectroscopic OCT set in the setting step S4.
- FIG. 8 is a diagram illustrating a region that is determined to be lipid as a result of calculation of spectroscopic OCT in calculation step S5.
- FIG. 9 is a diagram showing the result of classification of
- FIG. 1 is a diagram illustrating a configuration of an OCT apparatus 1 including an optical probe 10 according to the present embodiment.
- the OCT apparatus 1 includes an optical probe 10 and a measurement unit 30 and is an optical measurement system that acquires an optical coherence tomographic image of the object 3.
- the optical probe 10 includes an optical fiber 11 that transmits light between a proximal end 11a and a distal end 11b, an optical connector 12 that is connected to the optical fiber 11 at the proximal end 11a, and a distal end 11b.
- a condensing optical system 13 and a deflection optical system 14 that are optically connected to the optical fiber 11, a cap 15 that embeds the condensing optical system 13 and the deflection optical system 14, and an optical fiber that surrounds the optical fiber 11. 11, and a support tube 16 and a jacket tube 17 extending along the line 11.
- the optical connector 12 is optically connected to a probe rotation moving mechanism 38 that is a part of the measuring unit 30.
- the optical fiber 11 has a cutoff wavelength shorter than 1.53 ⁇ m.
- the optical fiber 11, the condensing optical system 13, the deflecting optical system 14, and the cap 15 and the jacket tube 17 on the optical path coupled to the fundamental mode of the optical fiber 11 are ⁇ 2 dB in the wavelength band of 1.6 ⁇ m to 1.8 ⁇ m. It has a light transmittance of ⁇ 0 dB.
- the optical fiber 11 has a length of 1 to 3 m and is made of quartz glass.
- the optical fiber 11 has a transmission loss of 2 dB or less, preferably 1 dB or less in the wavelength range of 1.6 ⁇ m to 1.8 ⁇ m, has a cutoff wavelength of 1.53 ⁇ m or less, and operates in a single mode in the wavelength range. .
- an optical fiber conforming to ITU-T G.652, G.654, G.657 is suitable.
- an optical fiber compliant with ITU-T G.654A or C has a transmission loss as low as 0.22 dB / km or less at a wavelength of 1.55 ⁇ m, typically has a pure silica glass core, and has a nonlinear optical coefficient. This is particularly suitable because it can reduce noise due to non-linear optical effects such as self-phase modulation.
- a graded index (GRIN) lens as a condensing optical system 13 is fused and connected to the distal end 11 b of the optical fiber 11. Further, the GRIN lens has a tilted end surface at the tip, and this tilted end surface functions as the deflection optical system 14 by reflecting light. As light passes through the condensing optical system 13 and the deflecting optical system 14, the light exits while converging in the radial direction.
- GRIN graded index
- the GRIN lens (the condensing optical system 13 and the deflecting optical system 14) is made of quartz glass or borosilicate glass, and has a transmission loss of 2 dB or less in a wavelength range of 1.6 ⁇ m to 1.8 ⁇ m.
- the mirror has a structure in which a flat reflecting surface inclined by 35 to 44 degrees with respect to the axis of the GRIN lens is formed on a cylindrical glass. Although this flat reflecting surface can reflect light as it is, it is preferable to increase the reflectance at a wavelength of 1.6 to 1.8 ⁇ m by further depositing aluminum or gold on the reflecting surface.
- the cap 15 is made of urethane acrylate resin or epoxy resin, and has a transmission loss of 2 dB or less in a wavelength range of 1.6 ⁇ m to 1.8 ⁇ m.
- the cap 15 has a refractive index substantially equal to that of the condensing optical system 13 and has a function of reducing reflection on the light exit surface of the GRIN lens by being in close contact with the condensing optical system 13.
- the cap 15 mechanically protects the condensing optical system 13 and the deflecting optical system 14 and also has a function of confining air so as to be in contact with the mirror interface of the deflecting optical system 14 and realizing a mirror by total reflection. Have.
- the optical fiber 11 is accommodated in the lumen of the support tube 16.
- the support tube 16 is fixed to the tip of the optical fiber 11 and the optical connector 12.
- the support tube 16 is also rotated together with the optical connector 12, and the rotational torque is transmitted to the optical fiber 11, and the optical fiber 11, the condensing optical system 13, the deflecting optical system 14, the cap 15 and the support.
- the tube 16 rotates as a unit. Thereby, compared with the case where only the optical fiber 11 is rotated, the torque loaded on the optical fiber 11 is reduced, and the breakage of the optical fiber 11 due to the torque can be prevented.
- the support tube 16 has a thickness of 0.15 mm or more and a Young's modulus of 100 to 300 GPa, which is equivalent to stainless steel.
- the support tube 16 does not necessarily have to be connected in the circumferential direction, and may have a structure in which about 5 to 20 wires are twisted to adjust flexibility.
- the optical fiber 11, the condensing optical system 13, the deflecting optical system 14, the cap 15 and the support tube 16 are accommodated in the inner cavity of the jacket tube 17, and can be rotated therein. Thereby, it is prevented that the rotating part contacts the target object 3 and the target object 3 is damaged.
- the illumination light is emitted from the deflection optical system 14, passes through the cap 15 and the jacket tube 17, and is irradiated onto the object 3.
- the jacket tube 17 is made of polyamide (nylon, polyether block amide), fluororesin (FEP, PFA, PTFE), polyester (PET), polyolefin (polyethylene, polypropylene), and has a thickness of 30 to 100 ⁇ m.
- the transparency is such that the transmission loss at a wavelength of 1.6 to 1.8 ⁇ m is 2 dB or less.
- the spatial resolution is usually 30 ⁇ m or less, and the reflection of the inner surface and the outer surface of the jacket tube 17 is detected and used for calibration such as dispersion compensation. Therefore, the thickness of the jacket tube 17 is OCT. Thicker than the spatial resolution of the measurement is desirable.
- the inner cavity of the jacket tube 17 is filled with gas or liquid.
- gas gas, air, nitrogen, carbon dioxide and the like are preferable because they are inert and easily available.
- liquid silicone oil, physiological saline, and dextran aqueous solution are preferable because they cause less harm to the living body even if the probe is unexpectedly damaged during use and leaks out of the jacket tube 17.
- the measuring unit 30 detects a light source 31 that generates light, a light branching unit 32 that bifurcates the light emitted from the light source 31 and outputs it as illumination light and reference light, and light that has arrived from the light branching unit 32. Detected by the photodetector 33, the optical terminal 34 that outputs the reference light that has arrived from the optical branching unit 32, the reflecting mirror 35 that reflects the reference light output from the optical terminal 34 to the optical terminal 34, and the photodetector 33
- the analyzing unit 36 that analyzes the spectrum of the emitted light, the output port 37 that outputs the result of the analysis by the analyzing unit 36, and the optical probe rotational movement mechanism 38 that couples the illumination light that has arrived from the optical branching unit 32 to the optical probe 10. And comprising.
- the light output from the light source 31 in the measuring unit 30 is branched into two by the light branching unit 32 and output as illumination light and reference light.
- the illumination light output from the optical branching unit 32 is incident on the proximal end 11a of the optical fiber 11 through the optical probe rotational movement mechanism 38 and the optical connector 12, guided by the optical fiber 11, and emitted from the distal end 11b. Then, the object 3 is irradiated through the condensing optical system 13, the deflection optical system 14, and the cap 15.
- Backscattered light generated in response to irradiation of the illumination light to the object 3 is incident on the distal end 11b of the optical fiber 11 through the cap 15, the deflection optical system 14, and the condensing optical system 13, and the optical fiber 11 , Is emitted from the proximal end 11a, and is coupled to the photodetector 33 via the optical connector 12, the optical probe rotating / moving mechanism 38, and the optical branching section 32.
- the reference light output from the optical branching unit 32 is emitted from the optical terminal 34, reflected by the reflecting mirror 35, and coupled to the detector 33 via the optical terminal 34 and the optical branching unit 32.
- the back-reflected light from the object 3 and the reference light interfere with each other at the photodetector 33, and the interference light is detected by the photodetector 33.
- the spectrum of the interference light is input to the analysis unit 36.
- the analysis unit 36 the spectrum of the interference light is analyzed, and the distribution of the backscattering efficiency at each point inside the object 3 is calculated.
- a tomographic image of the object 3 is calculated based on the calculation result, and is output from the signal output port 37 as an image signal.
- the light source 31 in the measurement unit 30, the light source 31 generates broadband light whose spectrum continuously spreads over a wavelength range of 1.6 ⁇ m to 1.8 ⁇ m.
- the lipid lesion has an absorption peak at a wavelength of 1.70 to 1.75 ⁇ m, which is different from normal blood vessels in this respect. Since lard, which is a pure lipid, also has a similar absorption peak, it can be said that this absorption peak is due to lipid. Therefore, when the object 3 containing lipid is measured, the spectrum of the interference light is affected by absorption by the lipid, and shows a greater attenuation at wavelengths of 1.70 to 1.75 ⁇ m than the adjacent wavelength band.
- the spectrum of the interference light is not only modulated by light absorption by lipids on the optical path of the object 3, but also modulated by interference between the back-reflected light and the reference light. Therefore, by analyzing the spectrum of the interference light, information on both the reflectance distribution and the lipid distribution in the object 3 can be acquired.
- Such a technique is known as spectroscopic OCT and is disclosed in Non-Patent Document 1.
- the spectrum of interference light is divided into a plurality of bands and the result of Fourier analysis in each band is fitted to a model consisting of a previously acquired substance-specific wavelength spectrum and an unknown substance concentration distribution. An unknown substance concentration distribution can be obtained. Further, the reflectance distribution information can be acquired by performing Fourier analysis on the entire interference light spectrum. Therefore, the analysis unit 36 can acquire an image of the reflectance distribution of the target object 3 by normal OCT, and can acquire an image of the lipid distribution of the target object 3 by performing analysis by spectral OCT. .
- Non-Patent Document 1 discloses a method of introducing a smoothing coefficient as a method for reducing the influence of noise.
- the introduction of the smoothing factor essentially corresponds to spatial averaging.
- spatial averaging if the averaging range is too narrow, the effect of averaging is small. Conversely, if the averaging range is too wide and exceeds the plaque size, the plaque is overlooked. There is.
- spatial averaging is applied to the boundary between plaques and normal blood vessels, erroneous determination may occur by averaging data with different properties.
- the reflectance distribution image acquired by normal OCT can be used to extract different tissue regions and tissue boundaries. Therefore, based on the tissue region and boundary extracted from the reflectance distribution image acquired by normal OCT, it is possible to set an image range to be analyzed by performing spatial averaging with spectral OCT.
- FIG. 3 is a diagram showing a flow of the optical measurement method of the present embodiment.
- acquisition step S ⁇ b> the interference light spectrum obtained by the interference between the back reflected light and the reference light from the measurement object 3 including a plurality of tissues is acquired using the interference optical system of the OCT apparatus 1.
- the analysis unit 36 performs the following processing based on the acquired interference light spectrum according to a built-in program.
- a two-dimensional reflectance image of the measurement object 3 is created by normal OCT based on the interference light spectrum acquired in the acquisition step S1.
- a mapping process to a wave number space, a dispersion compensation process, and the like are performed on the spectrum of interference light, and a discrete Fourier transform is performed to create a tomographic image.
- the regions occupied by the plurality of tissues of the measurement object 3 in the reflectance image and the boundaries between the tissues are determined. Extract.
- boundary extraction is performed by edge detection processing, and segmentation processing is performed in which adjacent pixels having similar luminance values and textures are grouped into a single cluster as a homogeneous tissue region.
- an analysis target range and a spatial averaging range in the next calculation step S5 are set.
- a pixel range for spatial averaging is set within a range that does not exceed the size of the extracted same-type tissue region. More preferably, 9% to 100% of the area of the homogenous tissue region is set as the range of spatial averaging. If it is smaller than this, the number of pixels to be averaged is small, and the effect of averaging becomes small. If it is larger than this, misjudgment may occur by mixing and averaging regions of different tissues. By performing spatial averaging in the above range, the influence of noise can be reduced most effectively, and the tissue properties can be accurately determined.
- the pixel corresponding to the boundary and the pixel whose spatial averaging range centering on the pixel includes the boundary are excluded from the analysis target of the spectral OCT, and normal / abnormal is not determined. . Thereby, the misjudgment resulting from a boundary can be reduced.
- the concentration distribution of the component in each of the plurality of tissues is calculated by spectroscopic OCT. That is, in the calculation step S5, for each pixel in the set analysis target range, the density distribution of the component obtained by the spectral OCT is averaged in the spatial averaging range including each pixel, and the component component in each pixel is calculated. By using the concentration, the concentration distribution of the component in each of the plurality of tissues is calculated.
- a light attenuation spectrum per unit amount of a known substance such as lipid or normal blood vessel is acquired in advance and held in the analysis unit 36, and the method described in Non-Patent Document 1 or the same kind of method is used.
- the amount of the known substance is estimated by decomposing the measured spectrum into the spectrum of the known substance. Based on the estimated amount of known material, the pixels are assigned brightness or color and imaged.
- the type of tissue is classified based on the region extracted in the extraction step S3 and the concentration distribution of the component calculated in the calculation step S5.
- lipid can be detected based on spectroscopic characteristics by spectroscopic OCT using a wavelength band of 1.7 ⁇ m, and therefore, a region where lipid is detected by spectroscopic OCT. Is classified as a lipid.
- the region having relatively low luminance is classified as a calcified lesion.
- the other region is classified as a normal blood vessel, but the region having a shape protruding into the blood vessel lumen is classified as a thrombus.
- the blood vessel lumen can be identified during the process of detecting the boundary in the extraction step S3.
- a classification table for determining a tissue classification from the reflectance image and the result of the spectral OCT is held in the analysis unit 36.
- tissue classification image generation step S7 a tissue classification image is generated based on the type of tissue classified in classification step S6. At this time, different colors, luminances, and textures are assigned according to the type of classified tissue and displayed as an image. A correspondence table of the tissue type, display color, brightness, and texture is held in the analysis unit 36. More preferably, a tomographic image showing a distribution of tissue types is presented almost simultaneously with a tomographic image of OCT reflectivity familiar to doctors from the past. As a method of presenting almost at the same time, a method of displaying two types of images side by side, a method of making one of the two types of images translucent and overlaying the other image, and the like are preferable because they are easily visible.
- a switch for switching the display method is provided on the OCT apparatus or on the screen, and by switching the display to be arranged and the display to be superimposed by this switch operation, it is possible to select a method that is easier for the viewer to visually recognize. Become.
- FIGS. are images added by processing a range corresponding to a lesion based on an OCT image of a porcine blood vessel.
- FIG. 5 is a diagram showing the reflectance image created in the reflectance image creation step S2.
- the circumference of the OCT catheter is the lumen of the blood vessel, and the circumference is the blood vessel wall. Since the measurement light is reflected backward on the blood vessel wall and the reflectance is high, the OCT reflectance image is displayed with high luminance (white in the figure).
- FIG. 6 is a diagram showing the boundary extracted in the extraction step S3 as a broken line and superimposed on the OCT reflectance image.
- the surface of the blood vessel wall is detected as an edge because the luminance changes sharply.
- a position where the OCT signal falls below the noise floor in the deep blood vessel is also detected as a boundary due to a difference in luminance between the noise floor and the OCT signal.
- the low-luminance regions at the lower left and the left with respect to the center position are lesion candidate regions, and the boundary is detected based on the change in luminance.
- FIG. 7 is a diagram showing the analysis target range and spatial averaging range of the spectroscopic OCT set in the setting step S4.
- the boundary extracted in the previous step and the range of ⁇ 40 ⁇ m on both sides of the boundary are indicated by bold lines as a range excluded from the analysis range of the spectroscopic OCT.
- the spatial resolution of OCT measurement is typically about 15 ⁇ m.
- the wavelength band is divided into about five in order to analyze the wavelength dependence, so the spatial resolution becomes about five times coarser. It becomes about 75 ⁇ m. Therefore, it is preferable to exclude an area having a width of 80 ⁇ m ( ⁇ 40 ⁇ m) larger than the spatial resolution around the boundary from the analysis range of the spectroscopic OCT.
- the size of the range in which spatial averaging is performed in the spectral OCT analysis is indicated by a circle.
- This range is set as a size range that can be inscribed in the lesion candidate extracted in the previous step, and has an area of about 25% of the lesion candidate region.
- FIG. 8 is a diagram showing a region determined to be lipid as a result of calculation of spectroscopic OCT in calculation step S5.
- spectroscopic OCT there are three types: lipids, normal blood vessels, and others (including regions not subject to analysis). Among these, the area classified as lipid is indicated by hatching.
- FIG. 9 is a diagram showing the result of classification of the organization type in the classification step S6.
- the two regions that are extracted as lesion candidates in the extraction step S3 and located at the lower left and the left of the center position no lipid was detected in the spectral OCT of the calculation step S5. Classified as being. Regarding the latter, since lipid is detected, the entire region extracted as a lesion candidate is classified as a lipid lesion.
- lipids and other lesions in living tissue can be accurately identified.
- SYMBOLS 1 OCT apparatus, 3 ... Object, 10 ... Optical probe, 11 ... Optical fiber, 11a ... Proximal end, 11b ... Distal end, 12 ... Optical connector, 13 ... Condensing optical system, 14 ... Deflection optical system, DESCRIPTION OF SYMBOLS 15 ... Cap, 16 ... Support tube, 17 ... Jacket tube, 30 ... Measuring part, 31 ... Light source, 32 ... Light branching part, 33 ... Optical detector, 34 ... Optical terminal, 35 ... Reflector, 36 ... Analyzing part, 37: Output port, 38: Probe rotational movement mechanism.
Landscapes
- Health & Medical Sciences (AREA)
- Life Sciences & Earth Sciences (AREA)
- Engineering & Computer Science (AREA)
- Physics & Mathematics (AREA)
- General Health & Medical Sciences (AREA)
- Surgery (AREA)
- Medical Informatics (AREA)
- Pathology (AREA)
- Biophysics (AREA)
- Public Health (AREA)
- Animal Behavior & Ethology (AREA)
- Veterinary Medicine (AREA)
- Biomedical Technology (AREA)
- Heart & Thoracic Surgery (AREA)
- Molecular Biology (AREA)
- Radiology & Medical Imaging (AREA)
- Nuclear Medicine, Radiotherapy & Molecular Imaging (AREA)
- General Physics & Mathematics (AREA)
- Optics & Photonics (AREA)
- Theoretical Computer Science (AREA)
- Computer Vision & Pattern Recognition (AREA)
- Biochemistry (AREA)
- Data Mining & Analysis (AREA)
- Vascular Medicine (AREA)
- Cardiology (AREA)
- Physiology (AREA)
- Chemical & Material Sciences (AREA)
- Analytical Chemistry (AREA)
- Quality & Reliability (AREA)
- Immunology (AREA)
- Spectroscopy & Molecular Physics (AREA)
- Artificial Intelligence (AREA)
- Bioinformatics & Cheminformatics (AREA)
- Bioinformatics & Computational Biology (AREA)
- Evolutionary Biology (AREA)
- Evolutionary Computation (AREA)
- General Engineering & Computer Science (AREA)
- Investigating Or Analysing Materials By Optical Means (AREA)
- Endoscopes (AREA)
Abstract
本発明の光学的測定方法は、複数の組織を含む測定対象物からの後方反射光と参照光とが干渉してなる干渉光のスペクトルを取得し、前記干渉光のスペクトルに基づいてOCTにより前記測定対象物の2次元の反射率画像を作成し、前記反射率画像において前記複数の組織それぞれが占める領域および前記複数の組織の間の境界を抽出し、前記領域および前記境界に基づいて解析対象範囲および空間平均化範囲を設定し、設定された前記解析対象範囲内の各画素に対して、分光OCTにより得た構成成分の濃度分布を前記各画素を含む前記空間平均化範囲で平均化して前記各画素における構成成分の濃度とすることにより、前記複数の組織それぞれにおける構成成分の濃度分布を計算し、前記領域および計算された前記構成成分の濃度分布に基づいて組織の種類を分類して組織分類画像を生成する。
Description
本発明は、光干渉断層撮像(Optical Coherence Tomography : OCT)の手法を用いて生体組織などを測定するための方法およびシステムに関するものである。
生体組織などの測定対象物の断層構造を測定する手法として光干渉断層撮像(OCT)が知られている。OCTは、測定対象物に測定光を照射したときに生じる後方反射光と、参照光路を経由した参照光とを干渉させ、その干渉光を検出して解析することにより、測定光の光路上の反射率の分布を測定する技術である。
光ファイバを内蔵したカテーテルを用いて、血管の内腔から血管壁に測定光を照射してOCT測定を行い、さらに血管内壁を測定光で走査することにより、血管の断面内の反射率の分布を2次元または3次元で測定することができる。血管を構成する内膜、中膜、外膜や、プラーク病変を構成する脂質、石灰質、繊維質は、それぞれ異なった反射率分布を有するので、OCTによる血管断層画像から、プラークの組成を識別することができると期待される。特許文献1、2には、OCT画像から、減衰係数や後方散乱係数を算出し、これらの値に基づいてプラークの組成を分類する方法が開示されている。
プラークの組成を識別し、それに基づいて最適な治療を選択することにより、治療時の合併症のリスクや治療後の病変再発のリスクを低減し、患者の生命予後を改善することができる。
また、プラークの光減衰の波長スペクトルは、正常な血管組織のそれと異なるので、分光学的な波長スペクトルの情報を用いることも、プラークの組成を識別する上で有効である。特許文献3には、OCTと共通の光学系を用いてOCT画像とともに分光学的な波長スペクトルの情報を取得することにより、プラークを識別する精度を高められることが開示されている。
C. Xu et al. Optics Express Vol.12, No.20,pp.4790-4803 (2004)
Z. Wang et al. Journal of BiomedicalOptics Vol.15, No.6, pp.061711-1~10 (2010)
しかし、特許文献3に記載されている従来技術では、OCTに特有のスペックルノイズによって光減衰値の測定精度が低下する問題がある。スペックルノイズは、光を干渉させて検出することに起因するノイズであり、OCTの画像の輝度をランダムに変調させる。光減衰値は、深さに対するOCT画像輝度の関数の傾きとして算出されるので、スペックルノイズの影響を受ける。
スペックルノイズを低減する上では、OCT画像輝度を空間的に平均化することが有効であることが知られている。ただし、血管組織やプラークの境界部では画像輝度が急峻に変化するので、この部分で平均化を行なうと誤差を生じやすい。
本発明は、上記問題点を解消する為になされたものであり、OCTのスペックルノイズによる誤差の影響を低減することができ測定対象物を高精度に測定することができる光学的測定方法および光学的測定システムを提供することを目的とする。
本発明の光学的測定方法は、干渉光学系を用いて複数の組織を含む測定対象物からの後方反射光と参照光とが干渉してなる干渉光のスペクトルを取得する取得ステップと、取得された前記干渉光のスペクトルに基づいて、OCTにより前記測定対象物の2次元の反射率画像を作成する反射率画像作成ステップと、作成された前記反射率画像における輝度分布に基づいて、前記反射率画像において前記複数の組織それぞれが占める領域および前記複数の組織の間の境界を抽出する抽出ステップと、抽出された前記領域および前記境界に基づいて、解析対象範囲および空間平均化範囲を設定する設定ステップと、設定された前記解析対象範囲内の各画素に対して、分光OCTにより得た構成成分の濃度分布を前記各画素を含む前記空間平均化範囲で平均化して前記各画素における構成成分の濃度とすることにより、前記複数の組織それぞれにおける構成成分の濃度分布を計算する計算ステップと、抽出された前記領域および計算された前記構成成分の濃度分布に基づいて、組織の種類を分類する分類ステップと、分類された前記組織の種類に基づいて組織分類画像を生成する組織分類画像生成ステップと、を備える。
本発明の光学的測定システムは、複数の組織を含む測定対象物からの後方反射光と参照光とが干渉してなる干渉光のスペクトルを測定する干渉光学系と、この干渉光のスペクトルを分析する分析部と、を備え、前記分析部が、干渉光学系を用いて測定対象物からの後方反射光と参照光とが干渉してなる干渉光のスペクトルを取得し、取得された前記干渉光のスペクトルに基づいて、OCTにより前記測定対象物の2次元の反射率画像を生成し、生成された前記反射率画像における輝度分布に基づいて、前記反射率画像において前記複数の組織それぞれが占める領域および前記複数の組織の間の境界を抽出し、抽出された前記領域および前記境界に基づいて、解析対象範囲および空間平均化範囲を設定し、設定された前記解析対象範囲内の各画素に対して、分光OCTにより得た構成成分の濃度分布を前記各画素を含む前記空間平均化範囲で平均化して前記各画素における構成成分の濃度とすることにより、前記複数の組織それぞれにおける構成成分の濃度分布を計算し、抽出された前記領域および計算された前記構成成分の濃度分布に基づいて、組織の種類を分類し、分類された前記組織の種類に基づいて組織分類画像を生成する。
本発明の光学的測定方法または本発明の光学的測定システムでは、前記干渉光学系が1.70~1.75μmを含む波長帯において干渉光のスペクトルを測定し、前記構成成分は脂質であるのが好適である。
本発明によれば、OCTのスペックルノイズによる誤差の影響を低減することができ測定対象物を高精度に測定することができる。
以下、添付図面を参照して、本発明を実施するための形態を詳細に説明する。なお、図面の説明において同一の要素には同一の符号を付し、重複する説明を省略する。本発明は、これらの例示に限定されるものではなく、特許請求の範囲によって示され、特許請求の範囲と均等の意味および範囲内でのすべての変更が含まれることが意図される。
図1は、本実施形態の光プローブ10を備えるOCT装置1の構成を示す図である。OCT装置1は、光プローブ10および測定部30を備え、対象物3の光干渉断層画像を取得する光学的測定システムである。
光プローブ10は、近位端11aと遠位端11bとの間で光を伝送する光ファイバ11と、近位端11aにおいて光ファイバ11と接続されている光コネクタ12と、遠位端11bにおいて光ファイバ11と光学的に接続されている集光光学系13および偏向光学系14と、集光光学系13および偏向光学系14を包埋するキャップ15と、光ファイバ11を包囲して光ファイバ11に沿って延びるサポートチューブ16およびジャケットチューブ17と、を備える。
光コネクタ12は測定部30の一部であるプローブ回転移動機構38に光学的に接続される。光ファイバ11は1.53μmより短いカットオフ波長を有する。光ファイバ11,集光光学系13,偏向光学系14,ならびに,光ファイバ11の基底モードに結合する光路上にあるキャップ15およびジャケットチューブ17は、波長帯域1.6μm~1.8μmにおいて-2dB~0dBの光透過率を有する。
光ファイバ11は、1~3mの長さを有し、石英ガラスで構成される。光ファイバ11は、波長範囲1.6μm~1.8μmにおいて2dB以下、好ましくは1dB以下の伝送損失を有し、1.53μm以下のカットオフ波長を有し、上記波長範囲においてシングルモードで動作する。そのような光ファイバとしては、ITU-T G.652,G.654、G.657に準拠した光ファイバが好適である。特にITU-T G.654AまたはCに準拠した光ファイバは、波長1.55μmにおいて伝送損失が0.22dB/km以下と低く、典型的には純シリカガラスのコアを有し、非線形光学係数が低く、自己位相変調などの非線形光学効果による雑音を低減できるので特に好適である。
光ファイバ11の遠位端11bには、集光光学系13としてのグレーデッドインデックス(GRIN)レンズが融着接続されている。さらに、GRINレンズの先端は傾斜端面が形成されており、この傾斜端面が光を反射させることで偏向光学系14として機能する。集光光学系13および偏向光学系14を光が経由することにより、光が径方向に収束しながら出射する。
GRINレンズ(集光光学系13および偏向光学系14)は、石英ガラスまたはホウケイ酸ガラスで構成され、波長1.6μm~1.8μmの波長範囲において2dB以下の伝送損失を有する。ミラーは、円柱形のガラスに、GRINレンズの軸に対して35~44度傾いた平坦な反射面を形成した構造をとる。この平坦な反射面はそのままでも光を反射させることができるが、さらに反射面にアルミニウムまたは金を蒸着することで、波長1.6~1.8μmにおける反射率を高めることが好適である。
キャップ15は、ウレタンアクリレート樹脂またはエポキシ樹脂で構成され、波長1.6μm~1.8μmの波長範囲において2dB以下の伝送損失を有する。キャップ15は、集光光学系13と屈折率が略等しく、集光光学系13と密着することによりGRINレンズの光出射面での反射を低減する機能を有する。また、キャップ15は、集光光学系13および偏向光学系14を機械的に保護するとともに、偏向光学系14のミラーの界面に接するように空気を閉じ込め、全反射によるミラーを実現する機能をも有する。
光ファイバ11はサポートチューブ16の内腔に収納されている。サポートチューブ16は、光ファイバ11の先端部および光コネクタ12に固定されている。その結果、光コネクタ12を回転させると、それと共にサポートチューブ16も回転し、さらに回転トルクが光ファイバ11に伝達され、光ファイバ11、集光光学系13、偏向光学系14、キャップ15およびサポートチューブ16が一体となって回転する。それにより、光ファイバ11だけを回転させた場合に比べて、光ファイバ11に負荷されるトルクが低減され、トルクによる光ファイバ11の破断を防ぐことができる。
サポートチューブ16は、0.15mm以上の厚さを持つと共に、ステンレスと同等程度の100~300GPaのヤング率を持つことが望ましい。サポートチューブ16は、必ずしも周方向に連結していなくともよく、5~20本程度の線を撚り合わせた構造とし、それによって柔軟性を調整しても良い。
光ファイバ11、集光光学系13、偏向光学系14、キャップ15およびサポートチューブ16は、ジャケットチューブ17の内腔に収納され、その中で回転することができる。それにより、回転する部分が対象物3に接触して対象物3が破損することが防止される。照明光は偏向光学系14から出射され、キャップ15およびジャケットチューブ17を透過して、対象物3へ照射される。
ジャケットチューブ17は、ポリアミド(ナイロン、ポリエーテルブロックアミド)、フッ素樹脂(FEP、PFA、PTFE)、ポリエステル(PET)、ポリオレフィン(ポリエチレン、ポリプロピレン)で構成され、30~100μmの厚さを有し、波長1.6~1.8μmにおける透過損失が2dB以下となる透明度を有する。OCT測定では、空間分解能は通常は30μm以下であり、ジャケットチューブ17の内面および外面の反射を区別して検出し、これを分散補償などの校正のために用いるので、ジャケットチューブ17の厚さはOCT測定の空間分解能よりも厚いことが望ましい。
ジャケットチューブ17の内腔は気体または液体が充填される。気体としては、空気、窒素、二酸化炭素等が、不活性であり入手が容易であることから好ましい。液体としては、シリコーンオイル、生理食塩水、デキストラン水溶液が、プローブが使用中に予期せず破損するなどしてジャケットチューブ17の外に漏出しても生体に及ぼす危害が少ないので好ましい。
測定部30は、光を発生させる光源31と、光源31から発せられた光を2分岐して照明光および参照光として出力する光分岐部32と、光分岐部32から到達した光を検出する光検出器33と、光分岐部32から到達した参照光を出力する光端末34と、光端末34から出力された参照光を光端末34へ反射させる反射鏡35と、光検出器33により検出された光のスペクトルを分析する分析部36と、分析部36による分析の結果を出力する出力ポート37と、光分岐部32から到達した照明光を光プローブ10に結合する光プローブ回転移動機構38と、を備える。
測定部30において光源31から出力された光は、光分岐部32により2分岐され照明光および参照光として出力される。光分岐部32から出力された照明光は、光プローブ回転移動機構38および光コネクタ12を経て光ファイバ11の近位端11aに入射され、光ファイバ11により導光されて遠位端11bから出射されて、集光光学系13、偏向光学系14およびキャップ15を経て対象物3に照射される。その対象物3への照明光の照射に応じて生じた後方散乱光は、キャップ15,偏向光学系14および集光光学系13を経て光ファイバ11の遠位端11bに入射され、光ファイバ11により導光されて近位端11aから出射されて、光コネクタ12、光プローブ回転移動機構38および光分岐部32を経て光検出器33に結合される。
光分岐部32から出力された参照光は、光端末34から出射されて反射鏡35で反射され、光端末34および光分岐部32を経て検出器33に結合される。対象物3からの後方反射光と参照光とは光検出器33において干渉し、この干渉光が光検出器33により検出される。干渉光のスペクトルは分析部36に入力される。分析部36において、干渉光のスペクトルの解析が行われ、対象物3の内部の各点における後方散乱効率の分布が計算される。その計算結果に基づいて対象物3の断層画像が計算され、画像信号として信号出力ポート37から出力される。
本実施形態においては、測定部30において、光源31は、波長1.6μm~1.8μmの波長範囲にわたってスペクトルが連続的に広がった広帯域の光を発生させる。この波長範囲では、図2に示すように、脂質病変は、波長1.70~1.75μmに吸収ピークを持っており、この点で正常血管と異なる。純粋な脂質であるラードも同様の吸収ピークを持つことから、この吸収ピークは脂質による寄与であるといえる。したがって、脂質を含む対象物3を測定すると、干渉光のスペクトルは、脂質による吸収の影響を受け、波長1.70~1.75μmにおいて隣接波長帯に比べて大きな減衰を示す。
干渉光のスペクトルは、対象物3の光路上の脂質による光吸収によって変調を受けるだけでなく、後方反射された光と参照光との干渉によっても変調を受ける。従って、干渉光のスペクトルを解析することにより、対象物3中の反射率分布および脂質の分布の両方の情報を取得することができる。このような手法は分光OCTとして知られており、非特許文献1に開示されている。
分光OCTでは、干渉光のスペクトルを複数の帯域に分割して各帯域でフーリエ解析した結果を、予め取得されている物質固有の波長スペクトルと未知の物質濃度分布とからなるモデルにフィッティングすることで、未知の物質濃度分布を得ることができる。また、反射率分布の情報は、干渉光のスペクトル全体をフーリエ解析することで取得することができる。従って、分析部36において、通常のOCTにより対象物3の反射率分布の画像を取得することができるとともに、分光OCTによる解析を行なうことにより対象物3の脂質分布の画像を取得することができる。
ただし、分光OCTでは、干渉光のスペクトルは、物質による光吸収によって変調を受けるだけでなく、後方反射光と参照光との干渉によっても変調を受けることから、干渉に起因するスペックル雑音の影響を受けやすい。非特許文献1では、雑音の影響を低減するための方法として、平滑化係数を導入する方法が開示されている。平滑化係数の導入は、本質的には空間的な平均化に相当する。ただし、空間平均化には、平均化を行なう範囲が狭すぎると平均化の効果が小さく、逆に平均化範囲が広すぎてプラークの大きさを越えてしまうとプラークを見落としてしまう、という問題がある。また、プラークと正常血管との境界に空間平均化を適用すると、異なる性状のデータを平均化することにより、誤判定が生じうる。
一方、反射率を画像化する通常のOCTでは、反射率の異なる組織は画像上で輝度が異なる領域として描出され、屈折率の異なる組織の境界部は高輝度の線として描出される。それ故、通常のOCTで取得される反射率分布画像は、異なる組織の領域や組織の境界を抽出することに用いることができる。そこで、通常のOCTにより取得された反射率分布画像から抽出された組織の領域や境界に基づいて、分光OCTで空間平均化を行なって解析する画像範囲を設定することができる。
図3は、本実施形態の光学的測定方法のフローを示す図である。取得ステップS1において、OCT装置1の干渉光学系を用いて複数の組織を含む測定対象物3からの後方反射光と参照光とが干渉してなる干渉光のスペクトルを取得する。分析部36は、内蔵するプログラムに従って、取得した干渉光スペクトルに基づいて以下の処理を行う。
反射率画像作成ステップS2において、取得ステップS1で取得された干渉光スペクトルに基づいて、通常のOCTにより測定対象物3の2次元の反射率画像を作成する。反射率画像作成に際しては、干渉光のスペクトルに対して、波数空間へのマッピング処理や分散補償処理などを行ない、離散フーリエ変換を行なって断層画像を作成する。
抽出ステップS3において、反射率画像作成ステップS2で作成された反射率画像における輝度分布に基づいて、反射率画像において測定対象物3の複数の組織それぞれが占める領域および複数の組織の間の境界を抽出する。領域および境界の抽出に際しては、エッジ検出処理による境界の抽出や、輝度の値およびテクスチャーが近い隣接画素を同種組織領域として一つのかたまりにまとめるセグメンテーション処理を行なう。これらの処理については、例えば非特許文献2に開示されている。
設定ステップS4において、抽出ステップS3で抽出された領域および境界に基づいて、次の計算ステップS5の計算の際の解析対象範囲および空間平均化範囲を設定する。具体的には、抽出された同種組織領域の大きさを超えない範囲で空間平均化の画素範囲を設定する。より好ましくは同種組織領域の面積の9%~100%を空間平均化の範囲とすることが望ましい。これより小さいと、平均化される画素の数が少なく平均化の効果が小さくなる。また、これより大きいと、異種組織の領域を混合して平均化することにより、誤判定が生じうる。上記の範囲で空間平均化を行なうことにより、雑音の影響を最も効果的に低減して精度よく組織の性状を判定することができる。また、抽出された境界に基づき、境界の該当する画素と、その画素を中心とする空間平均化範囲が境界を含む画素は、分光OCTの解析対象から除外し、正常・異常の判別を行なわない。これにより、境界に起因する誤判定を低減することができる。
計算ステップS5において、設定ステップS4で設定された解析対象範囲および空間平均化範囲に基づいて、分光OCTにより複数の組織それぞれにおける構成成分の濃度分布を計算する。すなわち、計算ステップS5において、設定された解析対象範囲内の各画素に対して、分光OCTにより得た構成成分の濃度分布を各画素を含む空間平均化範囲で平均化して各画素における構成成分の濃度とすることにより、複数の組織それぞれにおける構成成分の濃度分布を計算する。具体的には、脂質や正常血管などの既知物質の単位量あたりの光減衰スペクトルを予め取得して分析部36の内部に保持しておき、非特許文献1に記載されている方法または同種の方法により、測定されたスペクトルを既知物質のスペクトルに分解することで、既知物質の量を推定する。推定された既知物質の量に基づいて、画素に輝度または色を割り当て、画像化する。
分類ステップS6において、抽出ステップS3で抽出された領域および計算ステップS5で計算された構成成分の濃度分布に基づいて、組織の種類を分類する。具体的には、図4に示されるように、波長1.7μm帯を用いた分光OCTにより、分光学的特徴に基づいて脂質を検出することができるので、分光OCTで脂質が検出された領域は脂質であると分類する。それ以外の領域については、石灰化病変はOCT反射率画像において輝度が低いことが知られているので、相対的に輝度の低い領域は石灰化病変であると分類する。それ以外の領域については、正常血管であると分類するが、血管内腔へ突出した形状を有する領域は血栓であると分類する。なお、血管内腔は、抽出ステップS3において境界を検出する処理の際に識別することが可能である。反射率画像及び分光OCTの結果から組織の分類を決定する分類表は、分析部36に保持されている。
組織分類画像生成ステップS7において、分類ステップS6で分類された組織の種類に基づいて組織分類画像を生成する。このとき、分類された組織の種類に応じて、異なる色、輝度、テクスチャーを割り当てて、画像として表示する。組織の種類と表示色、輝度、テクスチャーの対応表は、分析部36の内部に保持される。より好ましくは、医師が従来より慣れ親しんでいるOCT反射率の断層画像とほぼ同時に、組織の種類の分布を示す断層画像を提示する。ほぼ同時に提示する方法として、2種類の画像を並べて表示する方法や、2種類の画像の一方を半透明化して他方の画像に重ねる方法等が、視認しやすく好適である。より好ましくは、OCT装置上あるいは画面上に、表示方法を切り替えるスイッチを備え、このスイッチ操作によって並べる表示と重ねる表示とを切り替えることで、閲覧者がより視認しやすい方法を選択することが可能となる。
次に、図5~図9を用いて、ブタの血管を測定対象物とした場合の測定の具体例を説明する。これらの図は、ブタの血管のOCT画像に基づいて病変部に対応する範囲を加工して追加した画像である。
図5は、反射率画像作成ステップS2で作成された反射率画像を示す図である。画像の中央にOCTカテーテルがあり、OCTカテーテルの周囲が血管の内腔であり、その周囲が血管壁である。血管壁では測定光が後方反射され反射率が高いので、OCT反射率画像では高い輝度(図中では白色)で表示される。
図6は、抽出ステップS3で抽出された境界を破線で表示してOCT反射率画像に重ねて示す図である。血管壁の表面は、輝度が急峻に変化するので、エッジとして検出される。また、血管深部でOCT信号がノイズフロア以下に落ちる位置も、ノイズフロアとOCT信号との輝度の違いにより境界として検出される。また、中心位置に対して左下および左にある輝度が低い領域は、病変候補の領域であり、輝度の変化に基づいて境界が検出される。
図7は、設定ステップS4で設定された分光OCTの解析対象範囲および空間平均化範囲を示す図である。前のステップで抽出された境界、および、境界の両側の±40μmの範囲は、分光OCTの解析範囲から除外される範囲として、太線で示されている。OCT測定の空間分解能は典型的には15μm程度であるが、分光OCTでは波長依存性を解析するために波長帯域を5つ程度に分割して解析するので、空間分解能が5倍程度粗くなって75μm程度となる。それ故、境界を中心として空間分解能よりも大きな80μmの幅の領域(±40μm)を分光OCTの解析範囲から除外することが好ましい。また、図7の右下には、分光OCTの解析において空間平均化を行なう範囲の大きさを円で示す。この範囲は、前のステップで抽出された病変候補に内接できる大きさの範囲として設定され、病変候補の領域の約25%の面積を有する。
図8は、計算ステップS5で分光OCTの計算の結果、脂質であると判定される領域を示す図である。分光OCTでは、脂質、正常血管、それ以外(解析対象外の領域も含む)の3通りに分類される。このうち、脂質であると分類された領域をハッチングで示す。
図9は、分類ステップS6による組織の種類の分類の結果を示す図である。抽出ステップS3で病変候補として抽出された、中心位置に対して左下および左にある2つの領域のうち、前者については、計算ステップS5の分光OCTにおいて脂質が検出されなかったので、石灰化病変であると分類される。後者については、脂質が検出されているので、病変候補として抽出された領域全体を脂質病変であると分類する。
以上のように、本実施形態によれば、OCTのスペックルノイズによる誤差の影響を低減することができ測定対象物を高精度に測定することができる。また、生体組織内(特に血管組織)の脂質および他の病変を精度よく識別することができる。
1…OCT装置、3…対象物、10…光プローブ、11…光ファイバ、11a…近位端、11b…遠位端、12…光コネクタ、13…集光光学系、14…偏向光学系、15…キャップ、16…サポートチューブ、17…ジャケットチューブ、30…測定部、31…光源、32…光分岐部、33…光検出器、34…光端末、35…反射鏡、36…分析部、37…出力ポート、38…プローブ回転移動機構。
Claims (4)
- 干渉光学系を用いて複数の組織を含む測定対象物からの後方反射光と参照光とが干渉してなる干渉光のスペクトルを取得する取得ステップと、
取得された前記干渉光のスペクトルに基づいて、OCTにより前記測定対象物の2次元の反射率画像を作成する反射率画像作成ステップと、
作成された前記反射率画像における輝度分布に基づいて、前記反射率画像において前記複数の組織それぞれが占める領域および前記複数の組織の間の境界を抽出する抽出ステップと、
抽出された前記領域および前記境界に基づいて、解析対象範囲および空間平均化範囲を設定する設定ステップと、
設定された前記解析対象範囲内の各画素に対して、分光OCTにより得た構成成分の濃度分布を前記各画素を含む前記空間平均化範囲で平均化して前記各画素における構成成分の濃度とすることにより、前記複数の組織それぞれにおける構成成分の濃度分布を計算する計算ステップと、
抽出された前記領域および計算された前記構成成分の濃度分布に基づいて、組織の種類を分類する分類ステップと、
分類された前記組織の種類に基づいて組織分類画像を生成する組織分類画像生成ステップと、
を備える光学的測定方法。 - 前記干渉光学系が1.70~1.75μmを含む波長帯において干渉光のスペクトルを測定し、
前記構成成分は脂質である、
請求項1に記載の光学的測定方法。 - 複数の組織を含む測定対象物からの後方反射光と参照光とが干渉してなる干渉光のスペクトルを測定する干渉光学系と、この干渉光のスペクトルを分析する分析部と、を備え、
前記分析部が、
干渉光学系を用いて測定対象物からの後方反射光と参照光とが干渉してなる干渉光のスペクトルを取得し、
取得された前記干渉光のスペクトルに基づいて、OCTにより前記測定対象物の2次元の反射率画像を生成し、
生成された前記反射率画像における輝度分布に基づいて、前記反射率画像において前記複数の組織それぞれが占める領域および前記複数の組織の間の境界を抽出し、
抽出された前記領域および前記境界に基づいて、解析対象範囲および空間平均化範囲を設定し、
設定された前記解析対象範囲内の各画素に対して、分光OCTにより得た構成成分の濃度分布を前記各画素を含む前記空間平均化範囲で平均化して前記各画素における構成成分の濃度とすることにより、前記複数の組織それぞれにおける構成成分の濃度分布を計算し、
抽出された前記領域および計算された前記構成成分の濃度分布に基づいて、組織の種類を分類し、
分類された前記組織の種類に基づいて組織分類画像を生成する、
光学的測定システム。 - 前記干渉光学系が1.70~1.75μmを含む波長帯において干渉光のスペクトルを測定し、
前記構成成分は脂質である、
請求項3に記載の光学的測定システム。
Priority Applications (1)
| Application Number | Priority Date | Filing Date | Title |
|---|---|---|---|
| US14/350,782 US20150248770A1 (en) | 2013-09-24 | 2013-11-14 | Optical measurement method and optical measurement system |
Applications Claiming Priority (2)
| Application Number | Priority Date | Filing Date | Title |
|---|---|---|---|
| JP2013-196894 | 2013-09-24 | ||
| JP2013196894A JP5522305B1 (ja) | 2013-09-24 | 2013-09-24 | 光学的測定システムおよびその作動方法 |
Publications (1)
| Publication Number | Publication Date |
|---|---|
| WO2015045191A1 true WO2015045191A1 (ja) | 2015-04-02 |
Family
ID=51175636
Family Applications (1)
| Application Number | Title | Priority Date | Filing Date |
|---|---|---|---|
| PCT/JP2013/080817 Ceased WO2015045191A1 (ja) | 2013-09-24 | 2013-11-14 | 光学的測定方法および光学的測定システム |
Country Status (3)
| Country | Link |
|---|---|
| US (1) | US20150248770A1 (ja) |
| JP (1) | JP5522305B1 (ja) |
| WO (1) | WO2015045191A1 (ja) |
Cited By (2)
| Publication number | Priority date | Publication date | Assignee | Title |
|---|---|---|---|---|
| WO2018079326A1 (ja) * | 2016-10-28 | 2018-05-03 | 富士フイルム株式会社 | 光干渉断層画像撮像装置および計測方法 |
| WO2018123212A1 (ja) * | 2016-12-27 | 2018-07-05 | ソニー株式会社 | 医療用レーザ照射装置及び医療用レーザ照射方法 |
Families Citing this family (14)
| Publication number | Priority date | Publication date | Assignee | Title |
|---|---|---|---|---|
| US11278206B2 (en) * | 2015-04-16 | 2022-03-22 | Gentuity, Llc | Micro-optic probes for neurology |
| JP6581923B2 (ja) * | 2016-03-03 | 2019-09-25 | 富士フイルム株式会社 | 画像処理装置とその作動方法および作動プログラム |
| JP7426823B2 (ja) * | 2017-01-24 | 2024-02-02 | コーニンクレッカ フィリップス エヌ ヴェ | 懸念閉塞物に関連する情報を決定するためのデバイス |
| US10806334B2 (en) * | 2017-02-28 | 2020-10-20 | Verily Life Sciences Llc | System and method for multiclass classification of images using a programmable light source |
| WO2019161284A1 (en) * | 2018-02-16 | 2019-08-22 | Board Of Supervisors Of Louisiana State University And Agricultural And Mechanical College | Ionizing radiation-free dental imaging by near-infrared fluorescence, and related systems |
| JP2022500174A (ja) | 2018-09-17 | 2022-01-04 | ジェンテュイティ・リミテッド・ライアビリティ・カンパニーGentuity, LLC | 光学経路を有する撮像システム |
| WO2020086591A1 (en) * | 2018-10-23 | 2020-04-30 | The Johns Hopkins University | Deep learning based image enhancement |
| EP3929647B1 (en) * | 2019-02-14 | 2026-07-08 | Dai Nippon Printing Co., Ltd. | Medical instrument color correction device |
| US11361481B2 (en) * | 2019-09-18 | 2022-06-14 | Topcon Corporation | 3D shadow reduction signal processing method for optical coherence tomography (OCT) images |
| CN112508066A (zh) * | 2020-11-25 | 2021-03-16 | 四川大学 | 一种基于残差全卷积分割网络的高光谱图像分类方法 |
| CN113160160B (zh) * | 2021-04-12 | 2022-07-08 | 哈尔滨医科大学 | 一种基于oct光衰图像的钙化识别方法 |
| JPWO2023127785A1 (ja) * | 2021-12-28 | 2023-07-06 | ||
| KR102901285B1 (ko) * | 2022-09-19 | 2025-12-18 | 부산대학교 산학협력단 | 근적외선 광원을 이용한 뇌종양의 병변 분석이 가능한 광단층 영상 시스템 및 이의 제어 방법 |
| KR102847457B1 (ko) * | 2022-09-19 | 2025-08-19 | 부산대학교 산학협력단 | 근적외선 광원을 이용한 동맥경화반 성분분석이 가능한 광단층 내시경 시스템 및 이의 제어 방법 |
Citations (2)
| Publication number | Priority date | Publication date | Assignee | Title |
|---|---|---|---|---|
| JPH11337475A (ja) * | 1997-11-13 | 1999-12-10 | Seitai Hikari Joho Kenkyusho:Kk | 光計測装置 |
| JP2011125569A (ja) * | 2009-12-18 | 2011-06-30 | Canon Inc | 画像処理装置、画像処理方法、画像処理システム及びプログラム |
Family Cites Families (1)
| Publication number | Priority date | Publication date | Assignee | Title |
|---|---|---|---|---|
| JP5543171B2 (ja) * | 2009-10-27 | 2014-07-09 | 株式会社トプコン | 光画像計測装置 |
-
2013
- 2013-09-24 JP JP2013196894A patent/JP5522305B1/ja active Active
- 2013-11-14 US US14/350,782 patent/US20150248770A1/en not_active Abandoned
- 2013-11-14 WO PCT/JP2013/080817 patent/WO2015045191A1/ja not_active Ceased
Patent Citations (2)
| Publication number | Priority date | Publication date | Assignee | Title |
|---|---|---|---|---|
| JPH11337475A (ja) * | 1997-11-13 | 1999-12-10 | Seitai Hikari Joho Kenkyusho:Kk | 光計測装置 |
| JP2011125569A (ja) * | 2009-12-18 | 2011-06-30 | Canon Inc | 画像処理装置、画像処理方法、画像処理システム及びプログラム |
Cited By (5)
| Publication number | Priority date | Publication date | Assignee | Title |
|---|---|---|---|---|
| WO2018079326A1 (ja) * | 2016-10-28 | 2018-05-03 | 富士フイルム株式会社 | 光干渉断層画像撮像装置および計測方法 |
| JPWO2018079326A1 (ja) * | 2016-10-28 | 2019-09-26 | 富士フイルム株式会社 | 光干渉断層画像撮像装置および計測方法 |
| US11357403B2 (en) | 2016-10-28 | 2022-06-14 | Fujifilm Corporation | Optical coherence tomography apparatus and measurement method |
| WO2018123212A1 (ja) * | 2016-12-27 | 2018-07-05 | ソニー株式会社 | 医療用レーザ照射装置及び医療用レーザ照射方法 |
| JPWO2018123212A1 (ja) * | 2016-12-27 | 2019-10-31 | ソニー株式会社 | 医療用レーザ照射装置及び医療用レーザ照射方法 |
Also Published As
| Publication number | Publication date |
|---|---|
| US20150248770A1 (en) | 2015-09-03 |
| JP5522305B1 (ja) | 2014-06-18 |
| JP2015064218A (ja) | 2015-04-09 |
Similar Documents
| Publication | Publication Date | Title |
|---|---|---|
| JP5522305B1 (ja) | 光学的測定システムおよびその作動方法 | |
| JP5120509B1 (ja) | 光プローブおよび光学的測定方法 | |
| JP4870356B2 (ja) | 組織を測定するための高波数ラマン分光法の使用 | |
| US8078265B2 (en) | Systems and methods for generating fluorescent light images | |
| US11779246B2 (en) | Hemoglobin measurement from a single vessel | |
| US11147440B2 (en) | Otoscope and otoscopic method based on spectral analysis | |
| EP2359745A1 (en) | Method and device for multi-spectral photonic imaging | |
| JP2021536591A (ja) | 光学形状感知及びスペクトル組織感知のための統合型ファイバ | |
| JP7219323B2 (ja) | 涙液層厚み測定装置及び方法 | |
| WO2014007759A1 (en) | Methods related to real-time cancer diagnostics at endoscopy utilizing fiber-optic raman spectroscopy | |
| US11707186B2 (en) | Fluorescence or auto-fluorescence trigger or triggers | |
| KR20170038024A (ko) | 생체 내 이미징 및 진단을 위한 장치, 디바이스 및 방법 | |
| JP2018094395A (ja) | 診断用スペクトル符号化内視鏡検査装置およびシステム、ならびにこれらと共に使用するための方法 | |
| WO2015025932A1 (ja) | 光プローブおよび光学的測定方法 | |
| JP7470761B2 (ja) | 手動管腔検出に基づく蛍光較正 | |
| US7756569B2 (en) | Method for measuring the vessel diameter of optically accessible blood vessels | |
| JP2023054764A5 (ja) | ||
| JP2012013520A (ja) | 光断層画像化装置、及び、その光プローブ押付力推定方法 | |
| JP2023538251A (ja) | ガイドワイヤセンシング装置 | |
| JP5505553B2 (ja) | 光学的測定装置 | |
| JP5700165B2 (ja) | 光学的測定装置 | |
| JP5708599B2 (ja) | 光プローブ | |
| JP5545423B1 (ja) | 光学的測定装置 | |
| JP2009516848A (ja) | 混濁媒質の幾何を考慮に入れて混濁媒質の内部を撮像する方法およびシステム |
Legal Events
| Date | Code | Title | Description |
|---|---|---|---|
| WWE | Wipo information: entry into national phase |
Ref document number: 14350782 Country of ref document: US |
|
| 121 | Ep: the epo has been informed by wipo that ep was designated in this application |
Ref document number: 13894929 Country of ref document: EP Kind code of ref document: A1 |
|
| NENP | Non-entry into the national phase |
Ref country code: DE |
|
| 122 | Ep: pct application non-entry in european phase |
Ref document number: 13894929 Country of ref document: EP Kind code of ref document: A1 |