WO2014155918A1 - グラフ表示装置およびグラフ表示装置の作動方法並びにグラフ表示プログラム - Google Patents
グラフ表示装置およびグラフ表示装置の作動方法並びにグラフ表示プログラム Download PDFInfo
- Publication number
- WO2014155918A1 WO2014155918A1 PCT/JP2014/000360 JP2014000360W WO2014155918A1 WO 2014155918 A1 WO2014155918 A1 WO 2014155918A1 JP 2014000360 W JP2014000360 W JP 2014000360W WO 2014155918 A1 WO2014155918 A1 WO 2014155918A1
- Authority
- WO
- WIPO (PCT)
- Prior art keywords
- inspection
- interval
- graph
- graph display
- maximum connection
- Prior art date
- Legal status (The legal status is an assumption and is not a legal conclusion. Google has not performed a legal analysis and makes no representation as to the accuracy of the status listed.)
- Ceased
Links
Images


Classifications
-
- G—PHYSICS
- G06—COMPUTING OR CALCULATING; COUNTING
- G06T—IMAGE DATA PROCESSING OR GENERATION, IN GENERAL
- G06T11/00—Two-dimensional [2D] image generation
- G06T11/20—Drawing from basic elements
- G06T11/26—Drawing of charts or graphs
-
- G—PHYSICS
- G06—COMPUTING OR CALCULATING; COUNTING
- G06T—IMAGE DATA PROCESSING OR GENERATION, IN GENERAL
- G06T7/00—Image analysis
- G06T7/0002—Inspection of images, e.g. flaw detection
- G06T7/0012—Biomedical image inspection
-
- G—PHYSICS
- G06—COMPUTING OR CALCULATING; COUNTING
- G06T—IMAGE DATA PROCESSING OR GENERATION, IN GENERAL
- G06T7/00—Image analysis
- G06T7/60—Analysis of geometric attributes
-
- G—PHYSICS
- G16—INFORMATION AND COMMUNICATION TECHNOLOGY [ICT] SPECIALLY ADAPTED FOR SPECIFIC APPLICATION FIELDS
- G16H—HEALTHCARE INFORMATICS, i.e. INFORMATION AND COMMUNICATION TECHNOLOGY [ICT] SPECIALLY ADAPTED FOR THE HANDLING OR PROCESSING OF MEDICAL OR HEALTHCARE DATA
- G16H10/00—ICT specially adapted for the handling or processing of patient-related medical or healthcare data
- G16H10/60—ICT specially adapted for the handling or processing of patient-related medical or healthcare data for patient-specific data, e.g. for electronic patient records
-
- G—PHYSICS
- G16—INFORMATION AND COMMUNICATION TECHNOLOGY [ICT] SPECIALLY ADAPTED FOR SPECIFIC APPLICATION FIELDS
- G16H—HEALTHCARE INFORMATICS, i.e. INFORMATION AND COMMUNICATION TECHNOLOGY [ICT] SPECIALLY ADAPTED FOR THE HANDLING OR PROCESSING OF MEDICAL OR HEALTHCARE DATA
- G16H15/00—ICT specially adapted for medical reports, e.g. generation or transmission thereof
Definitions
- the present invention relates to a graph display device for displaying test results of a plurality of tests performed on a patient as a line graph, a method for operating the graph display device, and a graph display program.
- the necessary test items are determined depending on the disease, while there are cases where the same disease has to be measured several times daily during hospitalization, it is necessary to grasp the short-term progress of the patient. Some are performed every few days to several months, and the inspection is performed at different intervals depending on the inspection. In order to confirm the transition of examinations with different examination intervals, it is necessary to switch the graph display period and confirm the trend at a display interval appropriate for each confirmation. In particular, cardiovascular diseases and kidney diseases need to be judged by checking a large number of tests, and graphs are crowded. When viewing the long-term progress in such a situation, there is a problem that if there is a vital data graph with a large number of inspection data, the change for viewing the long-term progress becomes difficult to see.
- the present invention has been made in view of the above circumstances, and a graph display device and a graph display device for creating a graph representing a transition of inspection data of a plurality of inspections so that a transition of inspection data of a plurality of inspections can be grasped.
- An object is to provide an operating method and a graph display program.
- the graph display device of the present invention uses a line graph connected in the order of time when examination data for a plurality of examination items of a patient is examined, with one of the horizontal axis and the vertical axis as a time axis and the other as an axis of examination values.
- the maximum connection interval that determines the maximum connection interval in which the time interval between the temporally adjacent inspections is the maximum time interval for connecting the inspection data of the inspection item
- the interval determination means connects inspection data whose time interval between adjacent inspections is within the maximum connection interval of the inspection item, and the time interval between adjacent inspections indicates the maximum connection interval of the inspection item. It is characterized by comprising a line graph generating means for generating a line graph without connecting the inspection data exceeding, and a graph display means for displaying the line graph on coordinates.
- the graph display device operating method of the present invention is a line graph in which test data for a plurality of examination items of a patient are inspected in order of time, one of the horizontal axis and the vertical axis is set as a time axis, and the other is checked.
- the graph display program of the present invention provides a line graph in which test data for a plurality of test items of a patient are connected in order of time, one of the horizontal axis and the vertical axis as a time axis, and the other as an axis of test values.
- the computer of the graph display device to be displayed is, for each inspection item, the maximum connection interval in which the time interval between the temporally adjacent inspections is the maximum time interval for connecting the inspection data of the inspection item.
- Maximum connection interval determining means to determine, and for each inspection item, inspection data whose time interval between adjacent inspections is within the maximum connection interval of the inspection item is connected, and the time interval between adjacent inspections is the time interval of the inspection item It functions as a line graph generation unit that generates a line graph without connecting the inspection data exceeding the maximum connection interval, and a graph display unit that displays the line graph on coordinates. It is an.
- the maximum connection interval determining means obtains the inspection interval at which each inspection is performed for each of the plurality of inspection items for a plurality of patients, and among the inspection intervals at which each inspection is performed for each inspection item, The inspection interval within the predetermined range from the average value or the median of the inspection intervals is set as the standard inspection interval, and the time interval within the predetermined range is determined as the maximum connection interval from the maximum value among the standard inspection intervals. You may do it.
- the graph display means displays all the line graphs of a plurality of inspection items in a period in which no connection exists, by reducing the length of the time axis relative to the unit time, or by cutting down in the direction of the time axis. What is displayed is preferable.
- the maximum connection interval may be determined according to the disease.
- a maximum connection interval that is the maximum time interval for connecting test data is determined in advance.
- inspection data whose time interval between inspections is within the maximum connection interval is connected, and inspection data whose time interval exceeds the maximum connection interval is not connected, and a line graph is generated, so it is as short as vital data. Because no connection is made for parts that have not been inspected for a long period of time to check changes in the test data, it is possible to observe changes in the inspection data over a long period of time without being obstructed by a graph with short-term changes. Can significantly reduce the decline in performance.
- the graph period when there is no connection is the period when there is no meaningful data. Therefore, in the present invention, such a period is reduced or truncated and displayed so that the transition of data in a wider period can be displayed on one screen, and the past medical history can be easily confirmed.
- the maximum display period for each test item is determined according to the disease, so that an optimal display that takes into account the difference in characteristics from each disease is achieved. be able to.
- Flowchart showing the flow of processing for determining the maximum connection period The flowchart which shows the flow of the processing which displays the graph with the medical department terminal White blood cell count frequency histogram Frequency distribution histogram of body temperature
- Example of line graph when all inspection data are connected An example of a line graph in which inspection data exceeding the maximum connection interval is not connected
- An example of a line graph in which the length of the time axis during a period when there is no connection is reduced
- FIG. 1 is a diagram showing a schematic configuration of a medical information system to which a graph display device according to an embodiment of the present invention is applied.
- a medical information system 10 includes a medical department terminal 2, a medical information management server 3, an electronic medical record management server 4, and an examination room terminal 5 that are communicably connected via a network 6. Yes.
- the electronic medical record management server 4 is a computer having an electronic medical record database in which electronic medical records are stored. In addition to the operating system and database management software, the electronic medical record management server 4 is associated with each electronic medical record in response to a request from the medical department terminal 2 or the like. Software for searching the medical information S such as the inspection data and transmitting / receiving the search results is incorporated.
- the electronic medical record management server 4 is connected to the medical information management server 3, the medical department terminal 2, the examination room terminal 5, and the like via the network 6 so that each medical information S recorded in the electronic medical record can be acquired.
- the examination room terminal 5 is a computer that is used to input information on examination data performed in the examination room according to the examination order input from each examination department terminal 2 in an examination room that is separated from each department.
- software for browsing inspection orders and inputting inspection data is incorporated.
- Information on examination data performed in each examination room is input from the examination room terminal 5 in association with the examination order and patient ID.
- the medical information management server 3 described later also functions as a management server for information on examination data input by the laboratory terminal 5, and information on the entered examination data is also stored as medical information S in the medical information database 32.
- the graph display device 1 in this embodiment includes a medical information management server 3 and a medical department terminal 2.
- Each computer of the medical information management server 3 and the medical department terminal 2 is controlled by a graph display program installed from a recording medium such as a CD-ROM and functions as the graph display device 1 of the present embodiment.
- the graph display program may be installed after being downloaded from a storage device of a server connected via a network such as the Internet.
- the medical information management server 3 and the medical department terminal 2 are directly connected, but may be connected via the network 6.
- the medical information management server 3 is a computer having a medical information database 32.
- the medical information management server 3 is connected to the electronic medical record management server 4 and the examination room terminal 5 via the network 6, and the patient's electronic medical record and various examinations based on the patient ID from each connected server or the like.
- Medical information S such as data is retrieved and acquired, and stored in association with each patient ID.
- the medical information S related to the patient ID is divided and stored for each disease.
- the medical information management server 3 updates the medical information S to be managed every day on a regular basis.
- the medical information management server 3 is installed with a program related to the maximum connection interval determination process among the graph display programs according to the present embodiment. By executing this program, the medical information management server 3 functions as a maximum connection interval determination means 31 that determines the maximum connection interval corresponding to each examination for a plurality of examinations for diagnosis or medical treatment.
- the medical department terminal 2 is a computer that is used by a doctor in the medical department for browsing the patient's medical information S and inputting a test order.
- the medical department terminal 2 includes a display device that is a general display, and an input device that includes a keyboard and a mouse. And. Furthermore, the medical department terminal 2 is also used to display and refer to a graph indicating the transition of the examination data performed and the medical information S such as the created electronic medical record, and is a standard software such as an operating system. And application software such as a medical information integrated display viewer for displaying the created medical information S such as an electronic medical record is installed.
- the medical information integrated display viewer incorporates a part for defining patient designation reception processing, medical information acquisition processing, line graph generation processing, and graph display processing in the graph display program according to the present embodiment.
- the medical department terminal 2 functions as a patient designation receiving unit 21, a medical information acquisition unit 22, a line graph generation unit 23, and a graph display unit 24.
- graph creation information necessary for creating a time series graph is preset for each disease.
- the graph creation information includes the disease name, the examination item of the test represented in the graph, the display range of the vertical axis of the graph, the display range of the horizontal axis of the graph, color, line type, mark, font, font size, etc. Contains information necessary for creation.
- the test items represented in the graph are obtained by presetting a plurality of test items that are considered to be important in diagnosing the disease according to the disease.
- the display range of the vertical axis of the graph is set according to the value that the inspection data can take for each inspection corresponding to the inspection item.
- the display range on the horizontal axis in the graph creation information is determined so that it matches the period in which each patient's examination data exists after obtaining the medical information S for each patient. Values other than are preset.
- FIGS. 2A and 2B are flowcharts showing the flow of processing of the graph creating apparatus.
- the maximum connection interval determination means 31 calculates the cumulative frequency of each time interval for each inspection item i, and sets the time interval in which the ratio of the cumulative frequency to the total number of inspections (cumulative relative frequency) is equal to or less than a predetermined threshold. Is determined as a proper inspection interval. Specifically, from the plurality of pieces of medical information S stored in the medical information database 32, each of the examination intervals at which the examination Ti for the examination item i (1 ⁇ i ⁇ n: n is the number of examination types) is obtained ( S1), a frequency distribution of the inspection interval of the inspection Ti is created from the plurality of inspection intervals of the acquired inspection Ti (S2).
- an inspection interval in a range of 98% centering on the average or median inspection interval is considered to be a standard inspection interval. Therefore, an inspection interval including 98% of the inspection interval is obtained and set as a standard inspection interval (S3), and the maximum value among them is set as the maximum connection interval I (S4).
- the range including 98% of the inspection intervals is the standard inspection interval, but an appropriate threshold value is determined so that an interval not normally performed among the inspection intervals in which the inspection Ti is performed can be excluded. That's fine.
- the maximum connection interval I is stored in the medical care information database 32 for each examination item i.
- Table 1 shows the frequency (number of cases) from which the white blood cell count interval was extracted, and the cumulative relative frequency.
- FIG. 3 is a frequency distribution histogram corresponding to Table 1.
- Table 2 shows the frequency (number of cases) from which the body temperature test interval was extracted, and the cumulative relative frequency.
- FIG. 4 is a frequency distribution histogram corresponding to Table 2. The range indicated by the lower arrows in FIGS. 3 and 4 is a 98% section.
- the maximum connection interval I is determined to be 8 weeks. In the example of body temperature shown in Table 2, if the examination interval is 2.75 days, the cumulative relative frequency exceeds 0.98. In addition, the maximum connection interval I is set to 3 days in order to obtain a good number of days on the graph display. In the examples shown in Tables 1 and 2, the determined maximum connection interval I is shown in italics.
- the method of determining the maximum connection interval from the frequency distribution has been described.
- the inspection data of the past inspection interval is a distribution according to the normal distribution
- the standard inspection interval is obtained using the standard deviation. explain.
- the maximum connection interval determination means 31 acquires a plurality of inspection intervals of the inspection Ti for each inspection item i (S1), and obtains the average value ⁇ and the variance ⁇ 2 of the inspection interval of the inspection Ti from the acquired inspection interval of the inspection Ti. (S2).
- the inspection interval that falls within the 98% interval of the normal distribution is the standard inspection interval, and the 98% interval is in the range of about 2.05 * ⁇ (standard deviation). That means Standard inspection interval ⁇ ⁇ + 2.05 ⁇ ⁇ (1) (S3).
- the maximum inspection interval among the standard inspection intervals is set as the maximum connection interval I (S4).
- the maximum connection interval I is stored in the medical care information database 32 for each examination item i.
- Table 3 shows an interval including the mean value ⁇ , standard deviation ⁇ , and 98% of test data of the test interval of body temperature and white blood cell count. If the mean interval between white blood cell counts is 2.8 weeks and the standard deviation is 2.0 weeks, the standard test interval 98% interval from equation (1) is 6.9 weeks, which is the maximum connection. Interval I is 6.9 weeks. On the other hand, since the average body temperature test interval is 1.0 day and the standard deviation is 0.7 day, the 98% interval, which is the standard test interval, is 2.4 days from Equation (1), and the maximum connection interval Is 2.4 days. As for the maximum connection interval, a time interval within a predetermined range from the maximum value among standard inspection intervals may be determined as the maximum connection interval according to the inspection item i. For example, the maximum connection interval I for the white blood cell count may be set to 7 weeks and the maximum connection interval I for the body temperature may be set to 3 days so as to improve the quality.
- the calculation is performed on the assumption that the inspection interval follows the normal distribution.
- the inspection interval does not necessarily follow the normal distribution, and in fact, a difference may appear in the 98% interval obtained using the normal distribution and the cumulative frequency. Therefore, an inspection interval appropriately adjusted within a predetermined range from the maximum value of the 98% interval obtained by normal distribution based on experience may be determined as the maximum connection interval.
- the maximum connection interval is determined from the test interval for the test item without being distinguished by the disease.
- the maximum connection interval may be determined by taking statistics of inspection items.
- the maximum connection interval is determined from the inspection intervals for the inspection items of a large number of patients. However, it may be better for the patient to determine the inspection interval of each inspection item. May be determined according to the examination item of each patient.
- the maximum connection interval may be input in advance from the input device for each examination item and stored in the medical information database 32 or the medical information integrated display viewer, and the maximum connection interval determining means may store the recorded maximum connection.
- the maximum connection interval is determined by acquiring the interval.
- the doctor in the medical department inputs the patient ID in the input frame displayed on the display screen of the display device (S10).
- the input patient ID is received by the patient designation receiving means 21, and a patient medical information integrated display viewer is displayed on the display screen.
- the medical information acquisition means 22 acquires the corresponding medical information S from the medical information database 32 of the medical information management server 3 based on the received patient ID, and acquires it in the memory of the medical department terminal 2 (S11).
- the medical information acquisition means 22 acquires the patient's disease name from the electronic medical record included in the acquired medical information S.
- the line graph generation means 23 performs an examination of a plurality of examination items i corresponding to the diseases set in the graph creation information from the acquired diagnosis information S of the patient to be diagnosed based on the graph creation information corresponding to the patient's disease. Extract data. Further, the maximum connection interval I for each of the plurality of examination items i is acquired from the medical information database 32 of the medical information management server 3 (S12).
- the graph display means 24 determines the display range of the horizontal and vertical axes of the graph and the scale of each axis (S13).
- a scale is assigned according to the range of inspection values that can be taken by the inspection data of each inspection item i to be displayed. Since the range of inspection values that can be taken varies depending on each inspection item i, the scale on the vertical axis varies depending on the inspection item i. In addition, a scale on the vertical axis is assigned so that the line graphs of each inspection item i do not overlap.
- the horizontal axis is a time axis, and the entire range in which the examination data of all examination items of the patient exists is used as the display range. Alternatively, the doctor may input the graph display period from the input device, and determine the display range of the horizontal axis of the graph according to the input display range.
- the line graph generating means 23 has the color and line of the line graph determined for each inspection item i on the coordinates determined with the vertical axis as the inspection value and the horizontal axis as the time axis as described above.
- a line graph is created by connecting inspection data using seeds and marks (marks indicating the position of inspection data such as ⁇ and ⁇ ).
- a line graph is created according to the maximum connection interval I corresponding to each inspection item i, and if the time interval between inspections adjacent in time is within the maximum connection interval I, inspection data are connected and inspections adjacent in time No connection is made between inspection data whose time interval exceeds the maximum connection interval I (S14).
- the graph display unit 24 displays the created line graphs of all the inspection items i on the same coordinates (S15).
- a graph period in which no connection exists is a period in which no meaningful data exists. Therefore, when there is an area where no connection exists in all the line graphs of the inspection item i (S16), the length of the time axis with respect to the unit time is reduced or displayed, or displayed in the direction of the time axis. (S17) Thereby, since the transition of data in a wider period can be displayed on one screen, it becomes easy to observe a line graph in a period in which examination data exists, and it becomes easy to confirm past medical history.
- FIG. 5 shows an example when all inspection data of inspection items are connected.
- the solid line of the line graph indicates the body temperature
- the broken line indicates the blood pressure
- the one-dot oblique line indicates the blood pressure
- the two-dot oblique line indicates the hemoglobin
- the thick line indicates the white blood cell count.
- one square on the horizontal axis represents one week. Since the periods A1 and A2 in FIG. 5 are hospitalization periods of patients, vital (body temperature, blood pressure) data exists. Hemoglobin and white blood cell counts are regularly examined over the entire period A1, B, A2 regardless of whether or not they are hospitalized.
- FIG. 6 shows an example in which the connection control of the graph of FIG. 5 is performed using the graph creation device 1 of the present invention. If the maximum connection interval I of body temperature is 3 days, no connection is made between inspection data of body temperature in period B in which the time interval between adjacent tests exceeds the maximum connection interval I. Assuming that the maximum blood pressure connection interval I is 4 days, no connection is made between the blood pressure test data of period B as with body temperature. Since the maximum connection interval I between white blood cells and hemoglobin is 8 weeks, the connection is performed in period B.
- FIG. 7 shows an example in which the length of the time axis in a region where no connection exists is reduced and displayed using the graph creating apparatus 1 of the present invention. Since the maximum connection period of the white blood cell count is 8 weeks, no connection is made for the white blood cell count when there is no examination data in the period D (9 weeks). Similarly, no connection is made for hemoglobin. Since there is no inspection data during this period, it is an area that does not require observation. Therefore, in the period D in which no connection exists in all the line graphs of the inspection items, the length of the time axis with respect to the unit time is made smaller than the periods C1 and C2 in which the line graph exists. Or as shown in FIG. 8, about the area
- the present invention is not limited to this embodiment, and some or all of the components of the graph creating apparatus may be configured by a single workstation, and may be one or more connected via a network. It may be configured by a workstation, a server, and a storage device. Each device is controlled by a program for creating a graph according to the present specification installed from a recording medium such as a CD-ROM. The program may be installed after being downloaded from a storage device of a server connected via a network such as the Internet.
Landscapes
- Engineering & Computer Science (AREA)
- Physics & Mathematics (AREA)
- Medical Informatics (AREA)
- Health & Medical Sciences (AREA)
- General Health & Medical Sciences (AREA)
- General Physics & Mathematics (AREA)
- Theoretical Computer Science (AREA)
- Primary Health Care (AREA)
- Epidemiology (AREA)
- Public Health (AREA)
- Computer Vision & Pattern Recognition (AREA)
- Nuclear Medicine, Radiotherapy & Molecular Imaging (AREA)
- Radiology & Medical Imaging (AREA)
- Quality & Reliability (AREA)
- Geometry (AREA)
- Measuring And Recording Apparatus For Diagnosis (AREA)
- Medical Treatment And Welfare Office Work (AREA)
Abstract
患者に対して行われた複数の検査の検査データを表す折れ線グラフの視認性を向上させる。 横軸を時間軸とし縦軸を検査値の軸とする座標上に折れ線グラフを表示する際に、時間的に隣り合う検査間の時間間隔が最大結線間隔以内の検査データは結線し、隣り合う検査間の時間間隔が該検査項目の前記最大結線間隔を超える検査データは結線しないで折れ線グラフを生成し、複数の折れ線グラフを座標上に重ねて表示させる。
Description
本発明は、患者に対して行われた複数の検査の検査結果を折れ線グラフで表示するためのグラフ表示装置およびグラフ表示装置の作動方法並びにグラフ表示プログラムに関するものである。
近年、医療分野においては、診察が行われる際に患者に対して実施された複数の検査結果が表示され、病名の診断や治療方針などを決定するための参考情報として利用されている。
患者に実施される検査には様々な種類があり、実際の医療現場では、患者に特定の疾患が疑われるときには、その特定の疾患の診断に重要と考えられている複数の検査の各検査結果を参照して、診断または治療を行っている。しかし、実施した全ての検査結果を表示することは、ディスプレイの大きさの制約もあり、困難であるばかりでなく、画面が込み合って、むしろ見にくくなるといったマイナス要因にもなる。
従来のシステムでは検査を実施して得た結果のうち、重要なもの、あるいは注目しているものを操作者が選択し、グラフ表示させるようにしたり、また、実施された多くの治療項目(投薬や注射)の中から、上記グラフと合わせて表示すべき項目を選択させていた。そこで、操作者の手間を軽減するために、疾患毎にグラフに表示する項目・形態などを管理して、治療内容および検査結果の変化を表示するための条件を決定するようにしたものがある(例えば、特許文献1)。
疾患によって必要な検査項目は決まっているが、同じ疾患でも入院中はバイタル検査を日々何度も測定し、短期的な患者の経過を把握しなければならないものがある一方で、他の検査には数日から数ヶ月毎に行われるものがあり、検査によって異なる間隔で検査が実施される。このような検査間隔が異なる検査の推移を確認するためには、グラフ表示期間を切換えてそれぞれの確認に適切な表示間隔で傾向を確認する必要がある。特に、循環器疾患や腎臓疾患は多数の検査を確認して判断する必要があり、グラフが混み合ってしまう。このような状況で長期経過を見る場合には、検査データ数の多いバイタルデータのグラフが存在すると、その影響で長期経過を見るための変化が見にくくなるという問題点がある。
特許文献1の手法によれば、疾患毎にグラフに表示する項目・形態などを管理して、治療内容および検査データの変化を表示するための条件を決定していたが、検査データ数の多いバイタルデータと長期経過を見るための検査データが混在する場合には、グラフが見にくくなるのは避けられなかった。
本発明は上記事情に鑑みてなされたものであり、複数の検査の検査データの推移が把握できるように、複数の検査の検査データの推移を表すグラフを作成するグラフ表示装置およびグラフ表示装置の作動方法並びにグラフ表示プログラムを提供することを目的とする。
本発明のグラフ表示装置は、患者の複数の検査項目に対する検査データが検査された時刻の順に結線された折れ線グラフを、横軸と縦軸の一方を時間軸とし他方を検査値の軸とする座標上に、表示するグラフ表示装置において、検査項目毎に、時間的に隣り合う検査間の時間間隔が該検査項目の検査データを結線する最大の時間間隔である最大結線間隔を決定する最大結線間隔決定手段と、検査項目毎に、隣り合う検査間の時間間隔が該検査項目の前記最大結線間隔以内の検査データは結線し、隣り合う検査間の時間間隔が該検査項目の最大結線間隔を超える検査データは結線しないで折れ線グラフを生成する折れ線グラフ生成手段と、折れ線グラフを座標上に表示させるグラフ表示手段とを備えたことを特徴とするものである。
また、本発明のグラフ表示装置の作動方法は、患者の複数の検査項目に対する検査データが検査された時刻の順に結線された折れ線グラフを、横軸と縦軸の一方を時間軸とし他方を検査値の軸とする座標上に、表示するグラフ表示装置の作動方法であって、最大結線間隔決定手段が、検査項目毎に、時間的に隣り合う検査間の時間間隔が該検査項目の検査データを結線する最大の時間間隔である最大結線間隔を決定する最大結線間隔決定ステップと、折れ線グラフ生成手段が、検査項目毎に、隣り合う検査間の時間間隔が該検査項目の最大結線間隔以内の検査データは結線し、隣り合う検査間の時間間隔が該検査項目の最大結線間隔を超える検査データは結線しないで折れ線グラフを生成する折れ線グラフ生成ステップと、グラフ表示手段が、折れ線グラフを座標上に表示させるグラフ表示ステップとを備えたことを特徴とするものである。
さらに、本発明のグラフ表示プログラムは、患者の複数の検査項目に対する検査データが検査された時刻の順に結線された折れ線グラフを、横軸と縦軸の一方を時間軸とし他方を検査値の軸とする座標上に、表示するグラフ表示装置のコンピュータを、検査項目毎に、時間的に隣り合う検査間の時間間隔が該検査項目の検査データを結線する最大の時間間隔である最大結線間隔を決定する最大結線間隔決定手段と、検査項目毎に、隣り合う検査間の時間間隔が該検査項目の前記最大結線間隔以内の検査データは結線し、隣り合う検査間の時間間隔が該検査項目の最大結線間隔を超える検査データは結線しないで折れ線グラフを生成する折れ線グラフ生成手段と、折れ線グラフを座標上に表示させるグラフ表示手段として機能させることを特徴とするものである。
また、最大結線間隔決定手段が、複数の患者に対して前記複数の検査項目のそれぞれについて各検査が実施された検査間隔を取得し、検査項目毎に各検査が実施された検査間隔のうち、検査間隔の平均値または中央値から所定の範囲内の検査間隔を標準的な検査間隔とし、標準的な検査間隔のうちの最大値から所定の範囲内の時間間隔を前記最大結線間隔に決定するようにしてもよい。
また、グラフ表示手段が、複数の検査項目の全ての折れ線グラフで結線が存在しない期間の領域については、単位時間に対する時間軸の長さを縮小して表示、あるいは、時間軸の方向に切り詰めて表示させるものが好ましい。
さらに、最大結線間隔が疾患に応じて決められるようにしてもよい。
本発明によれば、患者の複数の検査項目に対する検査データが検査された時刻の順に結線された折れ線グラフ作成する際に、検査データを結線する最大の時間間隔である最大結線間隔を予め決めておき、検査間の時間間隔が最大結線間隔以内の検査データは結線し、検査間の時間間隔が最大結線間隔を超える検査データは結線しないで折れ線グラフを生成するので、バイタルデータのように短期間の変化を見る検査が長期間行われていない部分については結線しないので、長期経過を見る検査データの変化を短期的な変化があるグラフに邪魔されることなく観察することが可能になり、視認性の低下を大幅に削減できる。
また、複数の患者に対して各検査が実施された時間間隔の統計を取り、検査が実施された標準的な検査間隔のうち最大の検査間隔を基準に最大結線間隔を決定することにより、各検査が実施される検査間隔に即して結線することが可能になる。
また、結線が存在しないグラフ期間は意味のあるデータが存在しない期間である。そこで、本発明では、この様な期間は縮小または切り詰めて表示することで、1画面上により広い期間のデータの推移を表示できることになり、過去の病歴の確認が容易になる。
さらに、最大結線期間を各検査項目毎に決定するのではなく、疾患に応じて各検査項目毎の最大結線期間を決定することで、より疾患毎と特性の違いを考慮した最適な表示にすることができる。
本発明のグラフ表示装置の実施の形態について、以下図1に基づいて説明する。図1は、本発明の実施形態によるグラフ表示装置を適用した医療情報システムの概略構成を示す図である。
図1に示すように、医療情報システム10は、診療科端末2、医療情報管理サーバ3、電子カルテ管理サーバ4、および検査室端末5がネットワーク6を介して通信可能に接続されて構成されている。
電子カルテ管理サーバ4は、電子カルテが格納された電子カルテデータベースを備えたコンピュータであり、オペレーティングシステムやデータベース管理用ソフトウェアに加え、診療科端末2等の要求に応じて、各電子カルテに対応付けられた検査データ等の診療情報Sの検索および検索結果の送受信を行なうためのソフトウェアが組み込まれている。電子カルテ管理サーバ4は、電子カルテに記録された各診療情報Sを取得可能に、医療情報管理サーバ3、診療科端末2、検査室端末5などとネットワーク6を介して接続されている。
検査室端末5は、各診療科と離れた検査室におかれ、各診療科端末2から入力された検査オーダにしたがって検査室で実施された検査データの情報を入力するために利用するコンピュータであり、オペレーティングシステムなどの標準的なソフトウェアに加え検査オーダの閲覧および検査データの入力を行なうためのソフトウェアが組み込まれている。各検査室で行なわれた検査データの情報は、検査室端末5から検査オーダや患者IDと関連づけて入力される。また、後述の医療情報管理サーバ3が、検査室端末5により入力された検査データの情報の管理サーバとしても機能し、入力された検査データの情報も診療情報Sとして診療情報データベース32に記憶される。
本実施形態におけるグラフ表示装置1は、医療情報管理サーバ3、および診療科端末2により構成される。医療情報管理サーバ3、および診療科端末2の各コンピュータは、CD-ROM等の記録媒体からインストールされたグラフ表示プログラムによって制御されて、本実施形態のグラフ表示装置1として機能する。また、グラフ表示プログラムは、インターネット等のネットワーク経由で接続されたサーバの記憶装置からダウンロードされた後にインストールされたものであってもよい。図1では、医療情報管理サーバ3と診療科端末2が直接接続されているがネットワーク6を介して接続されるようにしてもよい。
医療情報管理サーバ3は、診療情報データベース32を備えたコンピュータである。医療情報管理サーバ3は、電子カルテ管理サーバ4と、検査室端末5とにネットワーク6を介して接続され、接続された各サーバ等から、患者IDに基づいて、その患者の電子カルテ、各種検査データなどの診療情報Sを検索して取得し、患者IDごとに対応付けて記憶する。また、1人の患者が複数の疾患を有する場合には、疾患ごとに、患者IDに関連する診療情報Sを分割して記憶する。なお、医療情報管理サーバ3は、管理する診療情報Sを毎日定時に更新する。
また、医療情報管理サーバ3には、オペレーティングシステムやデータベース管理用ソフトウェアの他、本実施形態にかかるグラフ表示プログラムのうち最大結線間隔決定処理に関するプログラムがインストールされている。このプログラムの実行により、医療情報管理サーバ3は、診断または診療のための複数の検査について、各検査にそれぞれ対応する最大結線間隔を決定する最大結線間隔決定手段31として機能する。
診療科端末2は、診療科の医師などが患者の診療情報Sの閲覧や検査オーダの入力などに利用するコンピュータであり、一般的なディスプレイである表示装置と、キーボード及びマウスなどからなる入力装置とを備えている。さらに、診療科端末2は、実施された検査データの推移を表すグラフや、作成された電子カルテなどの診療情報Sを表示して参照するためにも利用され、オペレーティングシステムなどの標準的なソフトウェアと、作成された電子カルテなどの診療情報Sを表示するための診療情報統合表示ビューワなどのアプリケーションソフトウェアとがそれぞれインストールされている。
診療情報統合表示ビューワには、本実施形態にかかるグラフ表示プログラムにおける患者指定受付処理、診療情報取得処理、折れ線グラフ生成処理、グラフ表示処理とを規定する部分が組み込まれている。このグラフ表示プログラムの実行により、診療科端末2は、患者指定受付手段21、診療情報取得手段22、折れ線グラフ生成手段23、グラフ表示手段24として機能する。
また、診療情報統合表示ビューワには、疾患ごとに、時系列グラフの作成に必要なグラフ作成情報が予め設定されている。グラフ作成情報には、疾患名、グラフに表される検査の検査項目、グラフの縦軸の表示範囲、グラフの横軸の表示範囲、色、線種、マーク、フォント、フォントサイズなどのグラフの作成に必要な情報が含まれる。グラフに表される検査項目は、疾患に応じて、その疾患の診断上重要と考えられる複数の検査項目が予め設定されたものである。また、グラフの縦軸の表示範囲は、検査項目に対応する検査ごとに、検査データが取り得る値に応じて設定されている。グラフ作成情報のうち横軸の表示範囲は、各患者の診療情報Sを取得した後に各患者の検査データが存在する期間と一致するように決められるが、グラフ作成情報のうち横軸の表示範囲以外の値は予め設定されている。
図2A、図2Bにグラフ作成装置の処理の流れを表すフローチャートを示す。
まず、医療情報管理サーバ3で最大結線期間を決定する処理の流れを図1および図2Aに従って説明する。
最大結線間隔決定手段31は、検査項目i毎に各時間間隔の累積度数を求め、その検査が実施された総数に対する累積度数の割合(累積相対度数)が所定の閾値以下の時間間隔を標準的な検査間隔として決定する。具体的には、診療情報データベース32に記憶された複数の診療情報Sから、検査項目iに対する検査Ti(1<i≦n:nは検査の種類数)を実施した検査間隔をそれぞれ取得し(S1)、取得した検査Tiの複数の検査間隔から検査Tiの検査間隔の度数分布を作成する(S2)。ただし、検査間隔が1年以上など長期の間隔があいている場合は、患者が通院していなかった時期である可能性が高いので統計に含めない。検査Tiを実施した検査間隔のうち、平均値または中央値の検査間隔を中心とした98%の範囲の検査間隔が標準的な検査間隔であると考えられる。そこで、検査間隔の98%が含まれる検査間隔を求めて標準的な検査間隔とし(S3)、その中の最大値を最大結線間隔Iとする(S4)。ここでは、検査間隔のうち98%を含む範囲が標準的な検査間隔であるとしたが、検査Tiを実施した検査間隔のうち通常では行われない間隔が除外できるように適切な閾値を決定すればよい。最大結線間隔Iは、検査項目i毎に診療情報データベース32に記憶される。
表1および表2に示す例を用いて、累積度数を用いて、体温と白血球数の標準的な検査間隔と最大結線間隔を決定する具体的な算出方法を説明する。表1は、白血球数の検査間隔が抽出された度数(件数)、累積相対度数を表しており、図3は、表1に対応する度数分布ヒストグラムである。表2は、体温の検査間隔が抽出された度数(件数)、累積相対度数を表しており、図4は、表2に対応する度数分布ヒストグラムである。また、図3、4の下の矢印が示す範囲が98%の区間である。

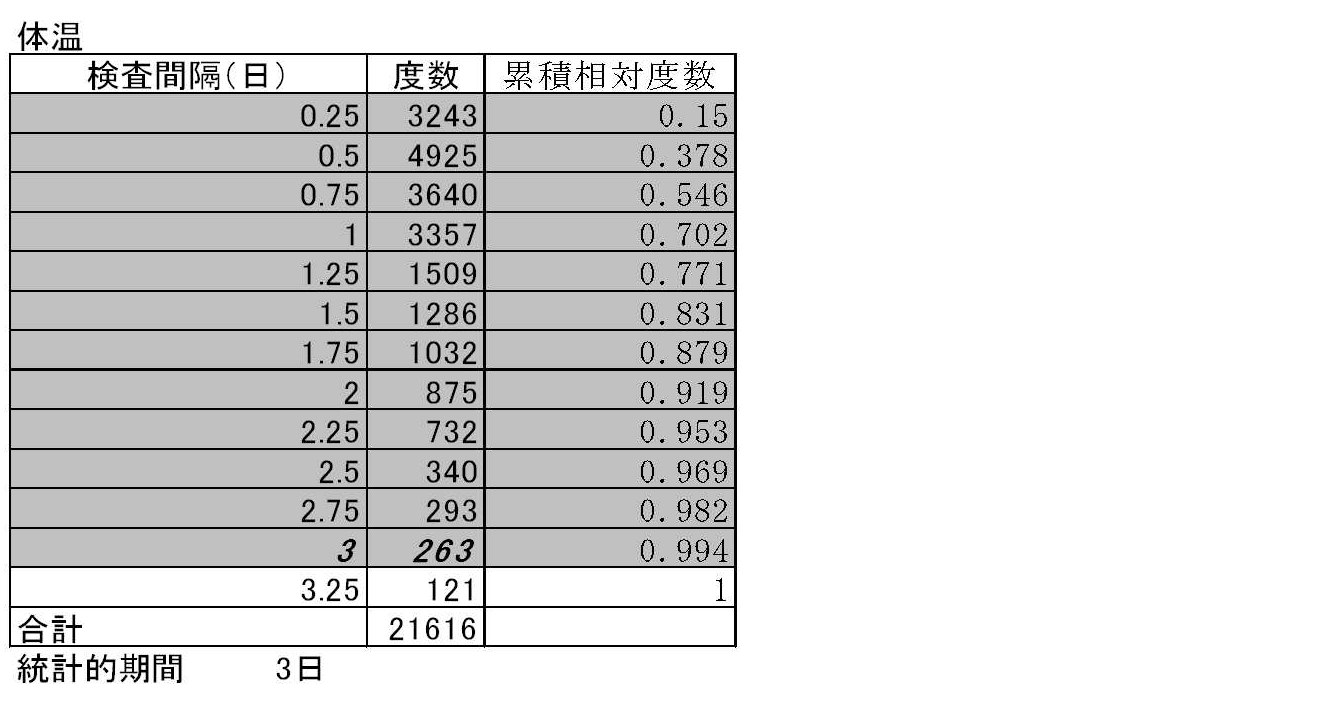
表1に示す白血球数の例では、検査間隔が約8週で、累積相対度数が0.98を超えているため、白血球数の標準的な検査間隔は8週以下となる。そこで、最大結線間隔Iを8週に決定する。表2に示す体温の例では、検査間隔が2.75日であれば、累積相対度数が0.98を超えている。また、グラフ表示上きりが良い日数にするために最大結線間隔Iを3日とする。また、表1および表2に示す例では、決定された最大結線間隔Iを斜体文字で示している。
上記では度数分布から最大結線間隔を決定する手法について説明したが、過去の検査間隔の検査データが正規分布に準じた分布になると仮定して標準偏差を用いて標準的な検査間隔を求める場合について説明する。
最大結線間隔決定手段31は、検査項目i毎に検査Tiの複数の検査間隔を取得し(S1)、取得した検査Tiの検査間隔から検査Tiの検査間隔の平均値μと分散σ2を求める(S2)。正規分布の98%の区間に入る検査間隔が標準的な検査間隔であり、98%の区間は約2.05*σ(標準偏差)の範囲にある。つまり、
標準的な検査間隔≦μ+2.05×σ (1)
となる(S3)。標準的な検査間隔のうち最大の検査間隔を最大結線間隔Iとする(S4)。最大結線間隔Iは、検査項目i毎に診療情報データベース32に記憶される。
標準的な検査間隔≦μ+2.05×σ (1)
となる(S3)。標準的な検査間隔のうち最大の検査間隔を最大結線間隔Iとする(S4)。最大結線間隔Iは、検査項目i毎に診療情報データベース32に記憶される。
表3に、体温と白血球数の検査間隔の平均値μと標準偏差σと98%の検査データが含まれる区間を示す。白血球数の平均検査間隔が2.8週間で、標準偏差が2.0週間である場合には、(1)式から標準的な検査間隔である98%区間は6.9週となり、最大結線間隔Iを6.9週とする。一方、体温の平均検査間隔は1.0日で、標準偏差が0.7日であるので、(1)式から標準的な検査間隔である98%区間は2.4日となり、最大結線間隔は2.4日にする。最大結線間隔は、検査項目iに応じて、標準的な検査間隔のうちの最大値から所定の範囲内にある時間間隔を最大結線間隔に決定すれば良い。例えば、きりが良いように白血球数の最大結線間隔Iを7週とし、体温の最大結線間隔Iを3日としても良い。

上記では、検査間隔が正規分布に従うものと仮定して計算したが、必ずしも正規分布に従うわけではなく、実際には正規分布と累積頻度を用いて得られる98%区間に差が現れる場合がある。そこで、経験に基づいて正規分布で得られた98%区間の最大値から所定の範囲内で適宜調整した検査間隔を最大結線間隔として決定しても良い。
上記は検査間隔の分布を正規分布に従うものと仮定したが、より正確にはガンマ分布などを使用する方が望ましい。
上記では、最大結線間隔を、疾患では区別せずに検査項目に対する検査間隔から決定する場合について説明したが、疾患によって同じ検査項目であっても検査間隔が異なる場合があるので、疾患毎に各検査項目の統計を取って最大結線間隔を決定しても良い。
また、上記では、最大結線間隔を、多数の患者の検査項目に対する検査間隔から決定する場合について説明したが、患者によって各検査項目の検査間隔が決めた方が良い場合があるので、最大結線間隔を、各患者の検査項目に応じて決めるようにしても良い。
あるいは、最大結線間隔を各検査項目毎に予め入力装置から入力して診療情報データベース32または診療情報統合表示ビューワに記憶しておいても良く、最大結線間隔決定手段は、記録されている最大結線間隔を取得することで、最大結線間隔を決定する。
次に、診療科端末2でグラフを表示する処理の流れについて図1および図2Bに従って説明する。
診療科端末2から診療科の医師が、診断対象患者の診療情報Sを確認するために、表示装置の表示画面に表示されている入力枠に患者IDを入力する(S10)。入力された患者IDが患者指定受付手段21で受け付けられ、患者の診療情報統合表示ビューワが表示画面上に表示される。診療情報取得手段22は、受け付けられた患者IDに基づいて対応する診療情報Sを医療情報管理サーバ3の診療情報データベース32から取得して、診療科端末2のメモリに取得する(S11)。また、診療情報取得手段22は、取得した診療情報Sに含まれる電子カルテからその患者の疾患名を取得する。
折れ線グラフ生成手段23は、患者の疾患に対応するグラフ作成情報に基づいて、取得した診断対象患者の診療情報Sから、グラフ作成情報に設定されている疾患に対応した複数の検査項目iの検査データを抽出する。さらに、複数の検査項目iのそれぞれに対する最大結線間隔Iを医療情報管理サーバ3の診療情報データベース32から取得する(S12)。
グラフ表示手段24で、グラフの横軸と縦軸の表示範囲と各軸の目盛りを決定する(S13)。グラフの縦軸には、表示する各検査項目iの検査データが取り得る検査値の範囲に応じて目盛りが振られる。各検査項目iによって取り得る検査値の範囲が異なるため、縦軸の目盛りは検査項目iによって異なるスケールになる。また、各検査項目iの折れ線グラフが重ならないように縦軸の目盛りが割り当てられる。横軸には時間軸をとり、患者の全ての検査項目の検査データが存在する全期間を表示範囲とする。あるいは、医師が入力装置からグラフの表示期間を入力して、入力された表示範囲に従ってグラフの横軸の表示範囲を決定するようにしても良い。
次に、折れ線グラフ生成手段23は、上記のように縦軸を検査値とし横軸を時間軸として決められた座標上に、各検査項目iに対して決められている折れ線グラフの色、線種、マーク(〇や■等の検査データの位置を示す印)を用いて検査データを結線した折れ線グラフを作成する。折れ線グラフは、各検査項目iに対応する最大結線間隔Iに従って作成され、時間的に隣り合う検査の時間間隔が最大結線間隔I以内であれば検査データ間は結線し、時間的に隣り合う検査の時間間隔が最大結線間隔Iを超える検査データ間は結線しない(S14)。
最後に、グラフ表示手段24は、作成された全ての検査項目iの折れ線グラフを同じ座標上に表示する(S15)。また、結線が存在しないグラフ期間は意味のあるデータが存在しない期間である。そこで、検査項目iの全ての折れ線グラフで結線が存在しない領域がある場合には(S16)、単位時間に対する時間軸の長さを縮小して表示する、あるいは、時間軸の方向に切り詰めて表示するようにする(S17)。これにより、1画面上により広い期間のデータの推移を表示できるので、検査データが存在する期間の折れ線グラフが観察しやすくなり、過去の病歴の確認が容易になる。
ここで、図5~図8を用いて、折れ線グラフの具体例について説明する。図5に、検査項目の全ての検査データを結線した時の例を示す。折れ線グラフの実線は体温を示し、破線が血圧の上を示し、一点斜線が血圧の下を示し、二点斜線がヘモグロビンを示し、太線が白血球数を示している。図5~図8では、横軸の1マスが1週間をあらわす。図5のA1とA2の期間は患者の入院期間であるためバイタル(体温、血圧)データが存在する。ヘモグロビンと白血球数は、入院期間であるかないかに関わらず全期間A1,B,A2に亘って定期的に検査が行われている。
図6に、本発明のグラフ作成装置1を用いて図5のグラフの結線制御を行った例を示す。体温の最大結線間隔Iは3日とすると、隣り合う検査の時間間隔が最大結線間隔Iを超える期間Bの体温の検査データ間では結線を行わない。血圧の最大結線間隔Iを4日とすると、体温と同じく期間Bの血圧の検査データ間では結線を行わない。白血球とヘモグロビンの最大結線間隔Iは8週であるので、期間Bで結線が行われる。
図7には、本発明のグラフ作成装置1を用いて結線が存在しない領域の時間軸の長さを縮小して表示した例を示す。白血球数の最大結線期間は8週であるので、期間D(9週)に検査データがない場合には白血球数についても結線が行われない。同様に、ヘモグロビンについても結線が行われない。この期間は検査データがないため、観察の必要がない領域である。そこで、折れ線グラフが存在する期間C1,C2よりも、検査項目の全ての折れ線グラフで結線が存在しない期間Dの領域については、単位時間に対する時間軸の長さを縮小した座標にする。あるいは、図8に示すように、検査項目の全ての折れ線グラフで結線が存在しない期間Dの領域については、時間軸の方向に切り詰めて表示をしてもよい。
なお、本実施形態に限定されず、グラフ作成装置の構成要素の一部または全部は、1台のワークステーションにより構成されたものであってもよく、ネットワークを介して接続された一台以上のワークステーション、サーバ、記憶装置によって構成されたものであってもよい。なお、各機器は、CD-ROM等の記録媒体からインストールされた本明細書のグラフ作成を行うプログラムによって制御される。また、プログラムは、インターネット等のネットワーク経由で接続されたサーバの記憶装置からダウンロードされた後にインストールされたものであってもよい。
Claims (6)
- 患者の複数の検査項目に対する検査データが検査された時刻の順に結線された折れ線グラフを、横軸と縦軸の一方を時間軸とし他方を検査値の軸とする座標上に、表示するグラフ表示装置において、
前記検査項目毎に、時間的に隣り合う検査間の時間間隔が該検査項目の検査データを結線する最大の時間間隔である最大結線間隔を決定する最大結線間隔決定手段と、
前記検査項目毎に、前記隣り合う検査間の時間間隔が該検査項目の前記最大結線間隔以内の検査データは結線し、前記隣り合う検査間の時間間隔が該検査項目の前記最大結線間隔を超える検査データは結線しないで折れ線グラフを生成する折れ線グラフ生成手段と、
前記折れ線グラフを前記座標上に表示させるグラフ表示手段とを備えたグラフ表示装置。 - 前記最大結線間隔決定手段は、複数の患者に対して前記複数の検査項目のそれぞれについて各検査が実施された検査間隔を取得し、前記検査項目毎に各検査が実施された検査間隔のうち、該検査間隔の平均値または中央値から所定の範囲内の検査間隔を標準的な検査間隔とし、該標準的な検査間隔のうちの最大値から所定の範囲内の時間間隔を前記最大結線間隔に決定することを特徴とする請求項1記載のグラフ表示装置。
- 前記グラフ表示手段は、前記複数の検査項目の全ての折れ線グラフで結線が存在しない期間の領域については、単位時間に対する時間軸の長さを縮小して表示、あるいは、時間軸の方向に切り詰めて表示させることを特徴とする請求項1または2項記載のグラフ表示装置。
- 前記最大結線間隔は、疾患に応じて決められることを特徴とする請求項1~3のいずれか1項記載のグラフ表示装置。
- 患者の複数の検査項目に対する検査データが検査された時刻の順に結線された折れ線グラフを、横軸と縦軸の一方を時間軸とし他方を検査値の軸とする座標上に、表示するグラフ表示装置の作動方法であって、
最大結線間隔決定手段が、前記検査項目毎に、時間的に隣り合う検査間の時間間隔が該検査項目の検査データを結線する最大の時間間隔である最大結線間隔を決定する最大結線間隔決定ステップと、
折れ線グラフ生成手段が、前記検査項目毎に、前記隣り合う検査間の時間間隔が該検査項目の前記最大結線間隔以内の検査データは結線し、前記隣り合う検査間の時間間隔が該検査項目の前記最大結線間隔を超える検査データは結線しないで折れ線グラフを生成する折れ線グラフ生成ステップと、
グラフ表示手段が、前記折れ線グラフを前記座標上に表示させるグラフ表示ステップとを備えたグラフ表示装置の作動方法。 - 患者の複数の検査項目に対する検査データが検査された時刻の順に結線された折れ線グラフを、横軸と縦軸の一方を時間軸とし他方を検査値の軸とする座標上に、表示するグラフ表示装置のコンピュータを、
前記検査項目毎に、時間的に隣り合う検査間の時間間隔が該検査項目の検査データを結線する最大の時間間隔である最大結線間隔を決定する最大結線間隔決定手段と、
前記検査項目毎に、前記隣り合う検査間の時間間隔が該検査項目の前記最大結線間隔以内の検査データは結線し、前記隣り合う検査間の時間間隔が該検査項目の前記最大結線間隔を超える検査データは結線しないで折れ線グラフを生成する折れ線グラフ生成手段と、
前記折れ線グラフを前記座標上に表示させるグラフ表示手段として機能させるためのグラフ表示プログラム。
Priority Applications (1)
| Application Number | Priority Date | Filing Date | Title |
|---|---|---|---|
| US14/863,462 US9898843B2 (en) | 2013-03-28 | 2015-09-24 | Graph display apparatus, its operation method and non-transitory computer-readable recording medium having stored therein graph display program |
Applications Claiming Priority (2)
| Application Number | Priority Date | Filing Date | Title |
|---|---|---|---|
| JP2013-068218 | 2013-03-28 | ||
| JP2013068218A JP6049194B2 (ja) | 2013-03-28 | 2013-03-28 | グラフ表示装置およびグラフ表示装置の作動方法並びにグラフ表示プログラム |
Related Child Applications (1)
| Application Number | Title | Priority Date | Filing Date |
|---|---|---|---|
| US14/863,462 Continuation US9898843B2 (en) | 2013-03-28 | 2015-09-24 | Graph display apparatus, its operation method and non-transitory computer-readable recording medium having stored therein graph display program |
Publications (1)
| Publication Number | Publication Date |
|---|---|
| WO2014155918A1 true WO2014155918A1 (ja) | 2014-10-02 |
Family
ID=51622945
Family Applications (1)
| Application Number | Title | Priority Date | Filing Date |
|---|---|---|---|
| PCT/JP2014/000360 Ceased WO2014155918A1 (ja) | 2013-03-28 | 2014-01-24 | グラフ表示装置およびグラフ表示装置の作動方法並びにグラフ表示プログラム |
Country Status (3)
| Country | Link |
|---|---|
| US (1) | US9898843B2 (ja) |
| JP (1) | JP6049194B2 (ja) |
| WO (1) | WO2014155918A1 (ja) |
Families Citing this family (7)
| Publication number | Priority date | Publication date | Assignee | Title |
|---|---|---|---|---|
| JP6486061B2 (ja) * | 2014-10-24 | 2019-03-20 | キヤノン株式会社 | 情報処理装置、情報処理方法及びプログラム |
| JP6532762B2 (ja) * | 2015-06-02 | 2019-06-19 | 株式会社東芝 | 情報生成システム、装置、方法、及びプログラム |
| JP6772768B2 (ja) * | 2016-11-09 | 2020-10-21 | 株式会社デンソー | 半導体装置 |
| EP4148593A1 (en) | 2017-02-27 | 2023-03-15 | QlikTech International AB | Methods and systems for extracting and visualizing patterns in large-scale data sets |
| US11294911B2 (en) * | 2017-09-29 | 2022-04-05 | Apple Inc. | Methods and systems for client side search ranking improvements |
| JP6715886B2 (ja) * | 2018-07-04 | 2020-07-01 | 株式会社Tkc | 処理状況確認支援装置、処理状況確認支援方法および処理状況確認支援プログラム |
| CN113255654A (zh) * | 2020-02-12 | 2021-08-13 | 斯凯孚公司 | 特征数据的图像化处理方法及其应用 |
Citations (3)
| Publication number | Priority date | Publication date | Assignee | Title |
|---|---|---|---|---|
| JPH0683880A (ja) * | 1992-08-31 | 1994-03-25 | Toshiba Corp | 病院用診断支援装置 |
| JP2011238029A (ja) * | 2010-05-11 | 2011-11-24 | Seiko Epson Corp | 接客データ記録装置、接客データ記録方法およびプログラム |
| JP2012127762A (ja) * | 2010-12-14 | 2012-07-05 | Fujitsu Ten Ltd | 情報提供システム、車載装置、および携帯端末装置 |
Family Cites Families (5)
| Publication number | Priority date | Publication date | Assignee | Title |
|---|---|---|---|---|
| JP4869951B2 (ja) * | 2005-01-19 | 2012-02-08 | オリンパス株式会社 | 医療機器データ解析装置 |
| PT1973549T (pt) * | 2006-01-06 | 2016-10-25 | Luitpold Pharm Inc | Métodos e composições para administração de ferro |
| JP4330593B2 (ja) * | 2006-03-13 | 2009-09-16 | 任天堂株式会社 | ゲーム装置およびゲームプログラム |
| US20110282662A1 (en) | 2010-05-11 | 2011-11-17 | Seiko Epson Corporation | Customer Service Data Recording Device, Customer Service Data Recording Method, and Recording Medium |
| JP5953704B2 (ja) * | 2011-10-31 | 2016-07-20 | 富士通株式会社 | 検索支援方法、検索支援プログラムおよびシステム |
-
2013
- 2013-03-28 JP JP2013068218A patent/JP6049194B2/ja not_active Expired - Fee Related
-
2014
- 2014-01-24 WO PCT/JP2014/000360 patent/WO2014155918A1/ja not_active Ceased
-
2015
- 2015-09-24 US US14/863,462 patent/US9898843B2/en not_active Expired - Fee Related
Patent Citations (3)
| Publication number | Priority date | Publication date | Assignee | Title |
|---|---|---|---|---|
| JPH0683880A (ja) * | 1992-08-31 | 1994-03-25 | Toshiba Corp | 病院用診断支援装置 |
| JP2011238029A (ja) * | 2010-05-11 | 2011-11-24 | Seiko Epson Corp | 接客データ記録装置、接客データ記録方法およびプログラム |
| JP2012127762A (ja) * | 2010-12-14 | 2012-07-05 | Fujitsu Ten Ltd | 情報提供システム、車載装置、および携帯端末装置 |
Non-Patent Citations (1)
| Title |
|---|
| TAKAHIRO FUJII: "Tokushu: Koritsuteki na Daicho Gan Kensa Kankaku, Shokaki Naishikyo", KABUSHIKI KAISHA TOKYO IGAKUSHA, vol. 14, 25 April 2002 (2002-04-25), pages 439 - 445 * |
Also Published As
| Publication number | Publication date |
|---|---|
| US20160012620A1 (en) | 2016-01-14 |
| JP6049194B2 (ja) | 2016-12-21 |
| US9898843B2 (en) | 2018-02-20 |
| JP2014191702A (ja) | 2014-10-06 |
Similar Documents
| Publication | Publication Date | Title |
|---|---|---|
| JP6049194B2 (ja) | グラフ表示装置およびグラフ表示装置の作動方法並びにグラフ表示プログラム | |
| US10685412B2 (en) | Medical test result display device and method for operating the same | |
| JP6097949B2 (ja) | グラフ表示装置およびグラフ表示装置の作動方法並びにグラフ表示プログラム | |
| US8676597B2 (en) | Methods and systems for mapping healthcare services analytics for volume and trends | |
| US20160253460A1 (en) | Diagnostic information display control device, method, and program | |
| JP5879308B2 (ja) | 診療情報表示制御装置および方法並びにプログラム | |
| JP5834042B2 (ja) | 診療情報表示制御装置および診療情報表示制御方法並びに診療情報表示制御プログラム | |
| US9805161B2 (en) | Medical care data display control device, method and program | |
| WO2015079705A1 (ja) | 診療情報処理装置および方法並びにプログラム | |
| US20180286504A1 (en) | Challenge value icons for radiology report selection | |
| JP2014067344A (ja) | グラフ作成装置およびグラフ作成方法並びにグラフ作成プログラム | |
| US20110145274A1 (en) | Exemplary Data Guidance in a Multi-Modality Data Viewer | |
| WO2021205033A1 (en) | Clinically meaningful and personalized disease progression monitoring incorporating established disease staging definitions | |
| EP2849104B1 (en) | Medical care information display control apparatus, method, and medium with medical care information display control program recorded thereon | |
| US20150371419A1 (en) | Inspection data display control apparatus, method, and recording medium | |
| JP6514818B1 (ja) | システム、プログラム及び方法 | |
| JP5256875B2 (ja) | 診察結果表示プログラム、診察結果表示装置および診察結果表示方法 | |
| CN105103157A (zh) | 检查数据显示控制装置、方法以及程序 | |
| US8005278B2 (en) | System and method for patient acuity driven workflow using computer-aided diagnosis of medical images | |
| JP2015114686A (ja) | 診療情報表示装置、方法およびプログラム | |
| US20150149213A1 (en) | Medical care information display control apparatus, method, and medium | |
| JP5760551B2 (ja) | 医用画像表示装置及びプログラム | |
| JP2011248607A (ja) | 情報処理装置、情報処理方法、及びプログラム | |
| WO2022024618A1 (ja) | 診療支援装置、診療支援装置の作動方法 | |
| JP2015102922A (ja) | 診療情報表示装置、方法およびプログラム |
Legal Events
| Date | Code | Title | Description |
|---|---|---|---|
| 121 | Ep: the epo has been informed by wipo that ep was designated in this application |
Ref document number: 14775674 Country of ref document: EP Kind code of ref document: A1 |
|
| NENP | Non-entry into the national phase |
Ref country code: DE |
|
| 122 | Ep: pct application non-entry in european phase |
Ref document number: 14775674 Country of ref document: EP Kind code of ref document: A1 |