WO2014136299A1 - 設計支援システム、設計支援方法、およびプログラム - Google Patents
設計支援システム、設計支援方法、およびプログラム Download PDFInfo
- Publication number
- WO2014136299A1 WO2014136299A1 PCT/JP2013/075516 JP2013075516W WO2014136299A1 WO 2014136299 A1 WO2014136299 A1 WO 2014136299A1 JP 2013075516 W JP2013075516 W JP 2013075516W WO 2014136299 A1 WO2014136299 A1 WO 2014136299A1
- Authority
- WO
- WIPO (PCT)
- Prior art keywords
- cost
- demand
- present
- service level
- expected life
- Prior art date
- Legal status (The legal status is an assumption and is not a legal conclusion. Google has not performed a legal analysis and makes no representation as to the accuracy of the status listed.)
- Ceased
Links
Images






Classifications
-
- G—PHYSICS
- G06—COMPUTING OR CALCULATING; COUNTING
- G06Q—INFORMATION AND COMMUNICATION TECHNOLOGY [ICT] SPECIALLY ADAPTED FOR ADMINISTRATIVE, COMMERCIAL, FINANCIAL, MANAGERIAL OR SUPERVISORY PURPOSES; SYSTEMS OR METHODS SPECIALLY ADAPTED FOR ADMINISTRATIVE, COMMERCIAL, FINANCIAL, MANAGERIAL OR SUPERVISORY PURPOSES, NOT OTHERWISE PROVIDED FOR
- G06Q10/00—Administration; Management
- G06Q10/04—Forecasting or optimisation specially adapted for administrative or management purposes, e.g. linear programming or "cutting stock problem"
-
- G—PHYSICS
- G06—COMPUTING OR CALCULATING; COUNTING
- G06Q—INFORMATION AND COMMUNICATION TECHNOLOGY [ICT] SPECIALLY ADAPTED FOR ADMINISTRATIVE, COMMERCIAL, FINANCIAL, MANAGERIAL OR SUPERVISORY PURPOSES; SYSTEMS OR METHODS SPECIALLY ADAPTED FOR ADMINISTRATIVE, COMMERCIAL, FINANCIAL, MANAGERIAL OR SUPERVISORY PURPOSES, NOT OTHERWISE PROVIDED FOR
- G06Q50/00—Information and communication technology [ICT] specially adapted for implementation of business processes of specific business sectors, e.g. utilities or tourism
- G06Q50/10—Services
Definitions
- the present invention relates to a design support system, a design support method, and a program.
- IT information technology
- system designers need to determine the optimal architecture in consideration of future demand for the system to be designed. If the processing capacity of the IT system falls below the required processing capacity, the necessary services cannot be continued. On the other hand, if the system has more processing capacity than necessary, useless costs (capital investment costs, operation costs) are incurred. Assuming that the demand for the system is constant in the future, the optimal system configuration can meet the demand and meet the required quality (performance, availability, etc.), the cheapest system at present It is a configuration.
- the IT system design support system described in Patent Document 1 designs a system that satisfies both the design specifications of system processing performance and the design specifications of system reliability, and the cost is within an allowable range.
- a genetic algorithm is used in the system design method described in Patent Document 2.
- Patent Document 1 cannot be expanded when the demand for the system increases in the future. Further, in Patent Document 2, the expandability of the system is evaluated based on the number of expansion slots and the like, but the expandability in consideration of the expected increase in demand and cost cannot be evaluated.
- an object of the present invention is to obtain a design support system capable of designing a system in consideration of a change in demand for a future system and an appropriate cost.
- the design support system includes a demand prediction that represents a predicted value of a processing amount required for the system during the period from the present to the estimated life of the system, and a period between the present and the estimated life of the system. From the present to the expected life of the system based on a cost prediction that represents a predicted value of the amount including the procurement cost and operational cost of the system components, and a scaling policy that indicates a changeable range of the system configuration
- a cost calculation unit for calculating the cost of the system, service level requirements including performance requirements to be satisfied by the system, design parameters representing the components of the system, and performance of the system Based on the system model indicating the relationship with the service level variable representing the system cost and the cost of the system.
- optimization unit for calculating an optimum combination of design parameters, but with a.
- FIG. 1 is a block diagram showing a configuration of a design support system according to Embodiment 1 of the present invention.
- FIG. 1 is a block diagram showing a configuration of a design support system 10 according to Embodiment 1 of the present invention.
- the design support system 10 includes a cost calculation unit 101 and an optimization unit 102.
- the design support system 10 includes a CPU (Central Processing Unit), a ROM (Read Only Memory), a RAM (Random Access Memory), an external storage device for storing various information, an input interface, an output interface, a communication interface, and the like. Can be constituted by a dedicated or general-purpose computer having a bus connecting the two.
- the design support system 10 may be constituted by a single computer or may be constituted by a plurality of computers connected to each other via a communication line.
- the cost calculation unit 101 and the optimization unit 102 correspond to modules of functions realized when the CPU executes a predetermined program stored in a ROM or the like.
- the cost calculation unit 101 calculates the predicted cost of the future system component based on the demand prediction 501, the cost prediction 502, and the scaling policy 503 given by the designer via the input means.
- the cost includes not only procurement cost (equipment purchase price) but also operation cost (maintenance cost, electricity bill, etc.).
- the optimization unit 102 calculates an optimal scaling method of design parameters in the system model based on the service level requirement 504, the system model 505, and the cost calculation result calculated by the cost calculation unit 101.
- the service level requirement 504 represents a non-functional requirement (mainly performance requirement) to be satisfied by the system.
- Equations (1) and (2) are examples of service level requirements 504.
- the “average response time” in equation (1) and the “maximum resource usage rate” in equation (2) are variables (service level variables) representing the quality of service.
- the service level requirement 504 can be described by an inequality that includes service level variables. Average response time ⁇ 3 seconds (1) Maximum resource utilization ⁇ 80% (2)
- the system model 505 represents the relationship between design parameters of the system model and service level variables.
- the system model design parameters are items to be determined by the designer, such as the number and model of servers and the size of the thread pool.
- the design parameter has a pre-defined range (domain) of possible values.
- the system configuration can be represented by a vector of design parameters. For example, if there are two design parameters, the number of servers in the cluster N and the server model S to be used, the system configuration is determined by the vector (N, S).
- the vector (1, s1) represents a configuration using one model s1.
- Such a vector is hereinafter referred to as a constituent vector.
- the dimension of the configuration vector is increased accordingly (for example, (N1, S1, N2, S2)).
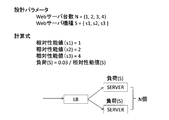
- the relationship between the design parameter and the service level variable may be expressed by a closed expression as shown in FIG. 2, or may be expressed by a model based on simulation as shown in FIG.
- the average response time is expressed by an approximate function.
- the model shown in FIG. 3 is composed of a model that simulates the operation of the load balancer and the server, and the average response time can be obtained only by simulation.
- high-speed calculation is possible, but there is a difference between the model and the actual system operation except in special cases. That is, a closed expression can only be expressed as an approximate expression.
- the example of FIG. 3 can accurately model the system, but it takes time to obtain a solution.
- ⁇ represents the demand for the system.
- the demand forecast 501 is a forecast of the demand for the system from the present time to the expected life of the system.
- the demand is represented by a numerical value representing the demand for the system such as “10 transactions / second”.
- the demand forecast 501 can be expressed by, for example, three parameters of (current demand, yearly rate of increase in demand, and estimated life expectancy). Or it can represent as an arbitrary function showing the relation between elapsed years and demand.
- the cost prediction 502 is a prediction of a procurement cost and an operation cost of system components from the present time to the expected life of the system. Cost is expressed in money.
- the cost prediction 502 is represented by, for example, two parameters (price at the present time, annual rate of price decline). Alternatively, the cost prediction 502 can be expressed as an arbitrary function that represents the relationship between the elapsed years and the cost.
- the scaling policy 503 represents a configuration vector that can be scaled from a certain configuration vector.
- the scaling policy 503 can be defined as a function having a configuration vector as an input and a set of configuration vectors as an output.
- FIG. 4 shows examples of two types of scaling policies.
- the example of FIG. 4 indicates that the original configuration vector of the arrow can be scaled to the configuration vector of the arrow destination.
- the example on the left of FIG. 4 represents a policy that when a server of a certain model (for example, s1) is adopted, the model cannot be changed, but the number can be added.
- a server of a certain model for example, s1
- the model can be changed if there is one server, but in the case of a configuration including two or more servers, the model cannot be changed and only the number of servers can be added.
- transition such a change in the system configuration is referred to as “transition” in the scaling policy.
- a series of transitions is referred to as a “scaling path”.
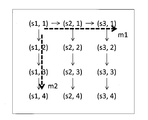
- m1 and m2 are examples of scaling paths.
- m1 represents a scaling path in which the number of servers remains one and the model is changed from s1 ⁇ s2 ⁇ s3.
- m2 represents a scaling path where the model is fixed to s1 and the number is changed from 1 ⁇ 2 ⁇ 3 ⁇ 4cm.
- the optimum scaling method 506 output by the optimization unit 102 satisfies the service level requirement and has the lowest cost among the transitions on the scaling policy.
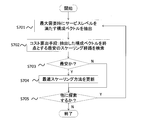
- FIG. 6 is a flowchart of the operation of the design support system 10.
- the optimization unit 102 extracts a configuration vector that satisfies the service level requirement 504 at the time of the maximum demand from the entire space of the configuration vector (step S701).
- the maximum demand can be easily calculated based on the demand forecast 501. For example, in FIG. 5, if (s3,1) satisfies the service level requirement at the time of maximum demand, (s3,1) is extracted.
- the cost calculating unit 101 searches the scaling policy 503 for the lowest cost scaling path whose end point is the extracted configuration vector and the cost (step S702). Specifically, the cost calculation unit 101 compares the demand curve obtained from the demand prediction 501 with the demand that can be processed by the extracted configuration vector, and searches for the route with the lowest cost that exceeds the demand curve. Detailed processing of the cost calculation unit 101 will be described later.
- step S702 If the cost obtained in step S702 is lower than the cost obtained so far (step S702; Y), the optimization unit 102 updates the route with the lowest cost (step S704).
- the design support system 10 repeats steps S701 to S704 until there are no more configuration vectors to be searched (step S705). Through the series of processes, the cheapest scaling path that satisfies the service level can be obtained.
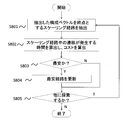
- FIG. 7 is a flowchart of the operation of the cost calculation unit 101.
- the cost calculation unit 101 extracts a scaling path whose end point is the extracted configuration vector with reference to the scaling policy 503 (step S801).
- the scaling path that ends at (s 3,1) is [(s3,1)], [(s2,1), (s3,1)], [(s1,1), (s3,1) ], [(s1,1), (s2,1), (s3,1)].
- the cost calculation unit 101 extracts one of these.
- the cost calculation unit 101 calculates the time when the transition occurs in the scaling path extracted in step S801, and calculates the cost based on the time (step S802). Specifically, the cost calculation unit 101 calculates the demand that can be processed by the configuration vector in the route, and calculates the lowest price when the obtained processable demand line is placed so as to exceed the demand curve. To do. In general, the procurement cost of a server with a certain specification decreases with time, and the lowest price can be obtained by determining the transition time so that the broken line of demand that can be processed by the server is in contact with the demand curve.
- the demand that can be processed by a certain configuration vector can be obtained by calculating the maximum resource utilization rate that satisfies the service level requirement 504 in the configuration vector based on the system model.
- the cost calculation unit 101 searches for the cheapest route and stores the cheapest route (steps S803 and S804), and repeats the search as necessary (step S805). As described above, the cheapest scaling path having the extracted configuration vector as an end point can be obtained.
- step S701 extracting the configuration vector
- step S801 extracting the scaling path
- step S805 determines whether to search elsewhere
- the number of design parameters is very small, it is possible to enumerate all the configuration vectors and scalings and perform a search for all of them. Even when the number of design parameters increases, it is possible to obtain a strict optimal solution at high speed without examining the entire search space by using a known method such as a branch and bound method up to a certain scale. Further, when the number of design parameters further increases, a search may be performed using a metaheuristic algorithm such as a genetic algorithm.
- the demand that can be processed by the configuration vector is calculated by calculating backward from the closed calculation formula of FIG. 2, but when the system model is given by the simulation model as shown in FIG. In general, such a calculation is not possible. However, even in such a case, it is possible to calculate the demand that can be processed by the configuration vector by the following method.
- Method 1 The calculation of the usage rate in a certain demand is repeated by simulation, and the demand value at which the usage rate becomes equal to the upper limit of the service level requirement is calculated by the bisection method.
- Method 2 Based on simulation results for several demands, a function between demand and usage rate is obtained by regression analysis / curve fitting, and the inverse value of the demand value at which the usage rate is equal to the upper limit of the service level requirement Ask for.
- the present embodiment can also be applied when the system model is given as a simulation model as shown in FIG.
- the transition time on the scaling path is determined based only on the function for calculating the resource maximum utilization rate in the cost calculation, the service level requirement related to the resource maximum utilization rate, and the demand curve.
- Other service level requirements eg, average response time
- the time required for the cost calculation process increases, but it can be ensured that other service level requirements are satisfied even at times other than the maximum load of the system.
- the optimization unit 102 calculates the cost based on the future demand prediction and cost prediction about the system, satisfies the service level requirement, and satisfies the scaling policy. Since a low-scaling path is output, an optimal system configuration that takes into account future demand fluctuations and cost fluctuations can be presented to the user.
- FIG. 9 is a block diagram showing a configuration of the design support system 20 according to the second embodiment of the present invention.
- the input to the cost calculation unit 101 is not a scaling policy but a scaling policy candidate 603.
- the scaling policy candidate 603 is composed of a plurality of scaling policies.
- FIG. 10 is a flowchart of the operation of the cost calculation unit 101 according to the second embodiment.
- the cost calculation unit 101 searches for a scaling policy candidate 603. Thereby, the cost calculation unit 101 can search for a scaling method with the lowest cost from a plurality of scaling policies.
- FIG. 11 is a block diagram showing the configuration of the design support system 30 according to the third embodiment of the present invention.
- the demand prediction accuracy 701 is further input to the cost calculation unit 101.
- the demand prediction accuracy 701 represents the certainty of the demand prediction 501.
- the demand prediction accuracy 701 can be expressed as a probability density distribution of the probability of the demand prediction 501.
- FIG. 12 is a diagram illustrating an example of the demand prediction accuracy 701.
- the lifetime of the system is 5 years.
- the demand for the system after 5 years is expected to be about 50 at the maximum, but the most likely is that it will reach a peak at around 30, and it may be only up to around 15 although it is unlikely .
- the cost calculation unit 101 first divides the demand prediction accuracy 701 into appropriate regions and converts them into a table of demand and probability density in each region.
- FIG. 13 is a diagram illustrating an example of conversion of the demand prediction accuracy 701 by the cost calculation unit 101.
- the cost calculation unit 101 divides the demand prediction accuracy shown in FIG. 12 into four demands 20, 30, 40, and 50, and calculates the probability of reaching each demand. Note that a table as shown in FIG. 13 may be directly provided to the cost calculation unit 101 as the demand prediction accuracy 701.
- the cost calculation unit 101 performs the cheapest route search process shown in FIG. 7 for the demand value in each region, and calculates the cheapest route and cost for each region. Then, the total cost is calculated by multiplying and summing the cost value for each region and the probability for each region.
- FIG. 14 is a diagram for explaining a cost calculation process according to the third embodiment.
- the upper left of FIG. 14 shows the cost calculation of the demand 50 area
- the upper right shows the demand 40 area
- the lower left shows the demand 30 area
- the lower right shows the cost calculation of the demand 20 area.
- the cost is c1 (t0) + c2 (t1 ′).
- the cost is c1 (t0).
- a part or all of the above embodiment can be described as in the following supplementary notes, but is not limited thereto.
- Demand prediction that represents the predicted value of the processing amount required for the system from the present to the assumed life of the system, and the configuration of the system from the present to the assumed life of the system
- the cost forecast that represents the predicted value of the amount including the procurement cost and operational cost of the element, and the scaling policy that indicates the range in which the configuration of the system can be changed, it will take from the present to the expected life of the system
- a cost calculation unit for calculating the cost of the system Based on service level requirements including performance requirements to be satisfied by the system, a system model indicating a relationship between design parameters representing the components of the system and service level variables representing the performance of the system, and cost of the system
- a design support system comprising: an optimization unit that calculates an optimum combination of design parameters of the system.
- the cost calculation unit The design support system according to appendix 1 or 2, wherein the cost of the system is calculated in consideration of the uncertainty of future demand prediction based on the demand prediction accuracy representing the certainty of the demand prediction.
- the present invention is suitable for designing a system in consideration of a change in demand for a future system and an appropriate cost.
Landscapes
- Business, Economics & Management (AREA)
- Engineering & Computer Science (AREA)
- Strategic Management (AREA)
- Economics (AREA)
- Tourism & Hospitality (AREA)
- Human Resources & Organizations (AREA)
- Theoretical Computer Science (AREA)
- Physics & Mathematics (AREA)
- Marketing (AREA)
- General Physics & Mathematics (AREA)
- General Business, Economics & Management (AREA)
- Quality & Reliability (AREA)
- Game Theory and Decision Science (AREA)
- Entrepreneurship & Innovation (AREA)
- Operations Research (AREA)
- Development Economics (AREA)
- Health & Medical Sciences (AREA)
- General Health & Medical Sciences (AREA)
- Primary Health Care (AREA)
- Management, Administration, Business Operations System, And Electronic Commerce (AREA)
Abstract
現在からシステムの想定寿命までの間に、システムに対して要求される処理量の予測値を表す需要予測と、現在から前記システムの想定寿命までの間の、システムの構成要素の調達コストと運用コストを含む金額の予測値を表すコスト予測と、システムの構成の変更可能な範囲を示すスケーリングポリシーとに基づいて、現在からシステムの想定寿命までの間に掛かることが予測される、システムのコストを算出するコスト算出部と、システムが満たすべき性能要件を含むサービスレベル要件と、システムの構成要素を表す設計パラメータとシステムの性能を表すサービスレベル変数との関係を示すシステムモデルと、システムのコストとに基づいて、システムの最適な設計パラメータの組み合わせを算出する最適化部と、を備える。
Description
本発明は、設計支援システム、設計支援方法、およびプログラムに関する。
IT(information technology)システムの設計者は、設計対象のシステムの将来的な需要を考慮して最適なアーキテクチャを決定する必要がある。ITシステムの処理能力が必要とされる処理能力を下回ると、必要なサービスを継続することができなくなる。一方、必要以上の処理能力をシステムに持たせると、無駄なコスト(設備投資費用、運用費用)がかかる。将来に渡ってシステムに対する需要が一定であると仮定すれば、最適なシステム構成は、その需要に対応でき、要求された品質(性能・可用性など)を満たすことができる、現時点において最安のシステム構成である。
一方、将来、システムに対する需要が増大すると予測される場合は、需要が増大しても少ないコストで対応可能なアーキテクチャ、すなわち拡張性の高いアーキテクチャがより最適なシステム構成になる。ただし、拡張性は高ければ高いほど良いわけではなく、予測される需要を上回る拡張性を得るためにコストをかけることは無駄である。このように、ITシステムの設計時には、アーキテクチャの拡張性を評価し、最適な設計を決定する必要がある。
特許文献1に記載されたITシステムの設計支援システムは、システム処理性能の設計仕様とシステム信頼性の設計仕様の両方を満足し、かつコストが許容範囲に収まるようなシステムを設計する。
特許文献2に記載されたシステム設計方法では、遺伝的アルゴリズムを使用している。
特許文献2に記載されたシステム設計方法では、遺伝的アルゴリズムを使用している。
しかし、特許文献1のシステムでは、将来的にシステムに対する需要が増大した場合に、システムを拡張することができなかった。また、特許文献2では、拡張スロットの個数などによってシステムの拡張性を評価しているが、予測される需要の増大とコストを考慮した拡張性を評価することはできなかった。
そこで、本発明の目的は、将来のシステムに対する需要の変化と適正なコストを考慮してシステムを設計することが可能な、設計支援システムを得ることである。
本発明に係る設計支援システムは、現在からシステムの想定寿命までの間に、前記システムに対して要求される処理量の予測値を表す需要予測と、現在から前記システムの想定寿命までの間の、前記システムの構成要素の調達コストと運用コストを含む金額の予測値を表すコスト予測と、前記システムの構成の変更可能な範囲を示すスケーリングポリシーとに基づいて、現在から前記システムの想定寿命までの間に掛かることが予測される、前記システムのコストを算出するコスト算出部と、前記システムが満たすべき性能要件を含むサービスレベル要件と、前記システムの構成要素を表す設計パラメータと前記システムの性能を表すサービスレベル変数との関係を示すシステムモデルと、前記システムのコストとに基づいて、前記システムの最適な設計パラメータの組み合わせを算出する最適化部と、を備えたものである。
本発明によれば、将来のシステムに対する需要の変化と適正なコストを考慮してシステムを設計することが可能な、設計支援システムを得ることができる。
実施の形態1.
次に、本発明を実施するための形態について、図面を参照して詳細に説明する。
図1は、本発明の実施の形態1による設計支援システム10の構成を示すブロック図である。図1に示すように、設計支援システム10は、コスト算出部101および最適化部102を備えている。
次に、本発明を実施するための形態について、図面を参照して詳細に説明する。
図1は、本発明の実施の形態1による設計支援システム10の構成を示すブロック図である。図1に示すように、設計支援システム10は、コスト算出部101および最適化部102を備えている。
設計支援システム10は、CPU(Central Processing Unit)、ROM(Read Only Memory)やRAM(Random Access Memory)等のメモリ、各種の情報を格納する外部記憶装置、入力インタフェース、出力インタフェース、通信インタフェース及びこれらを結ぶバスを備える専用又は汎用のコンピュータによって構成されうる。なお、設計支援システム10は、単一のコンピュータにより構成されるものであっても、通信回線を介して互いに接続された複数のコンピュータにより構成されるものであってもよい。
コスト算出部101および最適化部102は、CPUがROM等に格納された所定のプログラムを実行することにより実現される機能のモジュールに相当する。
コスト算出部101は、入力手段を介して設計者から与えられた需要予測501、コスト予測502、およびスケーリングポリシー503に基づいて、予測される将来のシステムの構成要素のコストを算出する。コストとは、調達コスト(機材の購入金額)だけでなく、運用コスト(保守費用、電気代など)を含む。
最適化部102は、サービスレベル要件504、システムモデル505、およびコスト算出部101によって算出されたコスト算出結果に基づいて、システムモデル中の設計パラメータの最適なスケーリング方法を算出する。
サービスレベル要件504は、システムが満たすべき非機能要件(主に性能要件)を表す。式(1)、(2)は、サービスレベル要件504の例である。式(1)の「平均応答時間」と式(2)の「リソース最大使用率」は、サービスの品質を表す変数(サービスレベル変数)である。式(1)、(2)に示すとおり、サービスレベル要件504は、サービスレベル変数を含む不等式で記述することができる。
平均応答時間 ≦ 3秒 …(1)
リソース最大使用率 ≦ 80% …(2)
平均応答時間 ≦ 3秒 …(1)
リソース最大使用率 ≦ 80% …(2)
システムモデル505は、システムモデルの設計パラメータとサービスレベル変数との関係を表す。システムモデルの設計パラメータとは、サーバの台数や機種、スレッドプールのサイズなど、設計者が決定すべき項目である。設計パラメータは、取りうる値の範囲(ドメイン)が事前に定義されている。システムの構成は、設計パラメータのベクトルで表すことができる。例えば、クラスタのサーバ台数N、使用するサーバ機種Sという2つの設計パラメータがある場合、システム構成はベクトル (N, S) によって決定される。例えば、ベクトル(1, s1)は機種s1を1台用いる構成を表す。このようなベクトルを、以降、構成ベクトルと記す。複数のクラスタによって構成されるシステムの場合(例えばWeb3層システム)、構成ベクトルの次元はその分だけ大きくなる(例えば(N1, S1, N2, S2))。
設計パラメータとサービスレベル変数との関係は、図2に示すように閉じた式で表してもよいし、図3に示すようにシミュレーションを前提としたモデルで表してもよい。図2の場合、平均応答時間は近似的な関数で表されている。一方、図3に示すモデルは、ロードバランサやサーバの動作をシミュレーションするモデルで構成され、平均応答時間はシミュレーションによってのみ得ることができる。図2の例は、高速な計算が可能だが、特殊な場合を除いてモデルと実際のシステムの動作の間に乖離が生じる。すなわち、閉じた式は、近似的な式として表すことしかできない。図3の例は、システムを正確にモデル化できるが、解を得るのに時間がかかる。
図2において、λはシステムに対する需要を表す。需要予測501は、現時点からシステムの想定寿命までの間のシステムに対する需要を予測したものである。需要とは、例えば「10トランザクション/秒」のようにシステムに対する需要を表す数値で表される。需要予測501は、例えば、(現時点での需要, 需要増大の年率, 想定寿命)の3つのパラメータで表すことができる。あるいは、経過年数と需要の関係を表す任意の関数として表すことができる。
コスト予測502は、現時点からシステムの想定寿命までの間の、システムの構成要素の調達コストと運用コストを予測したものである。コストは金額で表される。コスト予測502は、例えば(現時点での価格、価格下落の年率)の2つのパラメータで表される。あるいは、コスト予測502は、経過年数とコストの関係を表す任意の関数として表すことができる。
スケーリングポリシー503は、ある構成ベクトルからのスケーリングが可能な構成ベクトルを表すものである。スケーリングポリシー503は、構成ベクトルを入力とし、構成ベクトルの集合を出力とする関数として定義することができる。図4は2種類のスケーリングポリシーの例を示している。図4の例は、矢印の元の構成ベクトルが、矢印の先の構成ベクトルにスケーリング可能であることを表している。図4の左の例は、ある機種のサーバ(例えばs1)を採用した場合、機種変更はできないが、台数は追加していくことができるというポリシーを表す。図4の右の例では、サーバは1台であれば機種変更可能だが、サーバを2台以上含む構成の場合は、機種は変更できず、台数追加のみが可能であるというポリシーを表す。以降、このようなシステム構成の変更をスケーリングポリシー上の「遷移」と記す。また一連の遷移を「スケーリング経路」と記す。
図5中のm1, m2はスケーリング経路の例である。m1は、サーバの台数は1台のままで、機種をs1→s2→s3と変更していくスケーリング経路を表す。m2は、機種をs1に固定し、台数を1→2→3→4 と変更していくスケーリング経路を表す。最適化部102が出力する最適スケーリング方法506は、スケーリングポリシー上の遷移の中で、サービスレベル要件を満たし、且つ最もコストが小さいものである。
次に、設計支援システム10の動作について説明する。図6は、設計支援システム10の動作のフローチャートである。
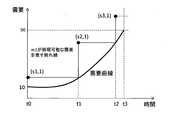
最適化部102は、最大需要時にサービスレベル要件504を満たす構成ベクトルを構成ベクトルの全空間から抽出する(ステップS701)。最大需要は、需要予測501に基づいて容易に算出することができる。例えば図5において、(s3,1)が最大需要時にサービスレベル要件を満たすのであれば、(s3,1)を抽出する。
最適化部102は、最大需要時にサービスレベル要件504を満たす構成ベクトルを構成ベクトルの全空間から抽出する(ステップS701)。最大需要は、需要予測501に基づいて容易に算出することができる。例えば図5において、(s3,1)が最大需要時にサービスレベル要件を満たすのであれば、(s3,1)を抽出する。
次に、コスト算出部101は、抽出された構成ベクトルを終点とする最もコストの低いスケーリング経路とそのコストを、スケーリングポリシー503を参照して検索する(ステップS702)。具体的には、コスト算出部101は、需要予測501から得られる需要曲線と抽出された構成ベクトルが処理可能な需要を比較し、需要曲線を上回る最もコストの低い経路を探索する。コスト算出部101の詳細な処理については後述する。
最適化部102は、ステップS702で得られたコストが今までに得られたコストよりも安ければ(ステップS702;Y)最もコストの低い経路を更新する(ステップS704)。設計支援システム10は、他に探索すべき構成ベクトルが無くなるまでステップS701~S704を繰り返す(ステップS705)。一連の処理により、サービスレベルを満たす最安のスケーリング経路を得ることができる。
ステップS702の処理について詳細に説明する。
図7は、コスト算出部101の動作のフローチャートである。
まず、コスト算出部101は、抽出された構成ベクトルを終点とするスケーリング経路を、スケーリングポリシー503を参照して抽出する(ステップS801)。例えば、(s 3,1)を終点とするスケーリング経路は、[(s3,1)], [(s2,1), (s3,1)], [(s1,1), (s3,1)], [(s1,1), (s2,1), (s3,1)]の4通りが存在する。コスト算出部101は、これらの中から1つを抽出する。
図7は、コスト算出部101の動作のフローチャートである。
まず、コスト算出部101は、抽出された構成ベクトルを終点とするスケーリング経路を、スケーリングポリシー503を参照して抽出する(ステップS801)。例えば、(s 3,1)を終点とするスケーリング経路は、[(s3,1)], [(s2,1), (s3,1)], [(s1,1), (s3,1)], [(s1,1), (s2,1), (s3,1)]の4通りが存在する。コスト算出部101は、これらの中から1つを抽出する。
次に、コスト算出部101は、ステップS801で抽出したスケーリング経路の中で遷移が発生する時間を算出し、それに基づいてコストを算出する(ステップS802)。具体的には、コスト算出部101は、経路中の構成ベクトルが処理可能な需要を算出し、得られた処理可能な需要の折れ線を、需要曲線を上回るように配置した場合の最安値を算出する。一般に、あるスペックのサーバの調達コストは、時間が経つにつれて下がるので、そのサーバの処理可能な需要の折れ線が需要曲線に接するように遷移時間を決定すれば、最安値を得ることができる。
ある構成ベクトルが処理可能な需要は、その構成ベクトルにおいてサービスレベル要件504を満たすリソース最大使用率をシステムモデルに基づいて算出することによって得ることができる。例えば、式(1)、(2)及び図2に示す例では、構成ベクトル(s3,1) が処理可能な需要は、0.04/4×λ/1 ≦ 0.8より、λ=80という値を得ることができる。同様にして、(s2,1)はλ=40、(s1, 1)はλ=20という値を得られる。
その結果、例えば10から50に指数的に上昇する需要が与えられた場合、[(s1,1), (s2,1), (s3,1)]という経路の最安コストを実現する遷移時間は図8のt1, t2のようになる。
図8において、時刻t0におけるサーバs1の調達コストをc1(t0)、時刻t1におけるサーバs2の調達コストをc2(t1)、時刻t2におけるサーバs3の調達コストをc3(t2)とすると、経路[(s1,1), (s2,1), (s3,1)]の最安コストはc1(t0)+c2(t1)+c3(t3)となる。ここでは、機種の切り替えによって不要となった機材の売却益や、運用コストは考慮していないが、売却益や、運用コストをこの計算式に含めてもよい。
一方、スケーリング経路が[(s3,1)]である場合、この場合は最初からサーバs3を1台配置するため、コストはc3(t0)である。もし、サーバs3の価格下落率が大きければ、c3(0) > c1(t0)+c2(t1)+c3(t3)となるため、最初からs3を配置するのではなく、s1→s2→s3というように機種変更していった方がトータルのコストは安く済む。さらに、s3の価格下落率が小さければ、最初からs3を配置した方が安く済む。このように、コスト算出部101は、最安の経路を探索して最安経路を記憶し(ステップS803,S804)、必要なだけ探索を繰り返す(ステップS805)。以上により、抽出された構成ベクトルを終点とする最安のスケーリング経路を得ることができる。
なお、構成ベクトルの抽出(ステップS701)、スケーリング経路の抽出(ステップS801)、他に探索するか否かの判定(ステップS705、S805)の詳細な手順については、問題の規模や性質に応じた、適切な公知の最適化アルゴリズムを用いることができる。
設計パラメータの数がごく少ない場合は、全ての構成ベクトルとスケーリングを列挙し、全てについて探索を行うことが可能である。設計パラメータの数が増えた場合も、ある程度の規模までは分岐限定法などの公知の手法を用いて、全探索空間を調べることなく高速に厳密最適解を得ることが可能である。また、さらに設計パラメータの数が増えた場合は、遺伝的アルゴリズムなどメタヒューリスティクスアルゴリズムを用いて探索するようにしてもよい。
また、上記の例では、図2の閉じた計算式から逆算することによって、構成ベクトルが処理可能な需要を算出しているが、システムモデルが図3のようにシミュレーションモデルで与えられた場合は、そのような計算は一般には不可能である。しかし、このような場合も、次のような方法によって構成ベクトルが処理可能な需要を算出することが可能である。
(方法1)シミュレーションによってある需要における使用率の計算を繰り返し、使用率がサービスレベル要件の上限と等しくなる需要の値を2分法によって算出する。
(方法2)いくつかの需要におけるシミュレーション結果に基づいて、需要と使用率の間の関数を回帰分析・曲線フィッティングによって求め、その逆関数から使用率がサービスレベル要件の上限と等しくなる需要の値を求める。
(方法2)いくつかの需要におけるシミュレーション結果に基づいて、需要と使用率の間の関数を回帰分析・曲線フィッティングによって求め、その逆関数から使用率がサービスレベル要件の上限と等しくなる需要の値を求める。
以上のように、図3のようにシステムモデルがシミュレーションモデルとして与えられている場合も、本実施形態は適用可能である。
また、本実施形態では、コスト計算の際にリソース最大使用率を算出する関数と、リソース最大使用率に関わるサービスレベル要件と、需要曲線のみ基づいて、スケーリング経路上の遷移時刻を決定したが、その他のサービスレベル要件(例えば平均応答時間)も併せて考慮するようにしてもよい。このようにすると、コスト計算処理に要する時間が増大するが、システムの最大負荷時以外でも、その他のサービスレベル要件が満たされていることを保証することができる。
以上のように、本実施形態によれば、最適化部102が、システムについての将来的な需要予測とコスト予測に基づいてコストを算出し、サービスレベル要件を満たしつつ、スケーリングポリシーに合致する最安のスケーリング経路を出力するようにしたため、将来の需要変動・コスト変動を考慮した最適なシステム構成をユーザに提示することができる。
実施の形態2.
図9は、本発明の実施の形態2による設計支援システム20の構成を示すブロック図である。図9に示すように、設計支援システム20は、コスト算出部101への入力がスケーリングポリシーではなくスケーリングポリシー候補603である。スケーリングポリシー候補603は、複数のスケーリングポリシーから構成される。
図9は、本発明の実施の形態2による設計支援システム20の構成を示すブロック図である。図9に示すように、設計支援システム20は、コスト算出部101への入力がスケーリングポリシーではなくスケーリングポリシー候補603である。スケーリングポリシー候補603は、複数のスケーリングポリシーから構成される。
図10は、実施の形態2によるコスト算出部101の動作のフローチャートである。図10に示すように、実施の形態2では、実施の形態1と同様の処理に加え、コスト算出部101はスケーリングポリシー候補603の探索を行う。これにより、コスト算出部101は、複数のスケーリングポリシーの中から、最もコストの小さいスケーリング方法を検索することが可能になる。
以上のように、本実施形態では、将来の需要変動・コスト変動を考慮した最適なシステム構成を提示するだけでなく、予め定められた複数のスケーリングポリシーの中から最適なスケーリングポリシーを判定し、ユーザに提示することができる。
実施の形態3.
図11は、本発明の実施の形態3による設計支援システム30の構成を示すブロック図である。図11に示すように、設計支援システム30は、コスト算出部101に需要予測確度701がさらに入力される。需要予測確度701は、需要予測501の確実性を表す。例えば、需要予測確度701は、需要予測501の確からしさの確率密度分布として表現することができる。
図11は、本発明の実施の形態3による設計支援システム30の構成を示すブロック図である。図11に示すように、設計支援システム30は、コスト算出部101に需要予測確度701がさらに入力される。需要予測確度701は、需要予測501の確実性を表す。例えば、需要予測確度701は、需要予測501の確からしさの確率密度分布として表現することができる。
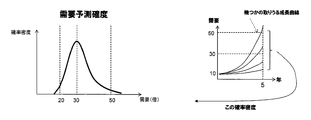
図12は、需要予測確度701の例を示す図である。図12の例では、システムの寿命は5年である。5年後のシステムに対する需要は、最大50程度と予想されるが、最も可能性が高いのは30程度で頭打ちになることであり、可能性は低いものの15程度までしか伸びない可能性もある。
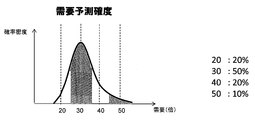
実施の形態3では、コスト算出部101は、まず需要予測確度701を適当に領域分割し、各領域での需要と確率密度の表に変換する。図13はコスト算出部101による需要予測確度701の変換の例を示す図ある。この例では、コスト算出部101は、図12に示された需要予測確度を、需要20、30、40、50の4とおりに分割し、それぞれの需要に達する確率を算出している。なお、図13に示すような表を、需要予測確度701として、直接コスト算出部101に直接提供するようにしてもよい。
次に、コスト算出部101は、各領域での需要値について、図7に示す最安経路探索処理を実施し、領域ごとの最安経路およびコストを計算する。そして、それらの領域ごとのコスト値と領域ごとの確率とを積和することよって、全体のコストを算出する。
図14は、実施の形態3のコスト算出処理を説明する図である。
図14の左上は需要50の領域、右上は需要40の領域、左下は需要30の領域、右下は需要20の領域のコスト算出を示している。需要40では(s2,1)で最大需要が満たされるため、コストはc1(t0)+c2(t1’)となる。また、需要20では(s1,1)で最大需要が満たされるため、コストはc1(t0)となる。図13に示した各領域の確率と積和すると、この構成ベクトルのコストは、0.1×(c1(t0)+c2(t1)+c3(t3))+0.2×(c1(t0)+c2(t1’))+0.5×(c1(t0)+c2(t1”))+ 0.2×c1(t0)となる。
図14の左上は需要50の領域、右上は需要40の領域、左下は需要30の領域、右下は需要20の領域のコスト算出を示している。需要40では(s2,1)で最大需要が満たされるため、コストはc1(t0)+c2(t1’)となる。また、需要20では(s1,1)で最大需要が満たされるため、コストはc1(t0)となる。図13に示した各領域の確率と積和すると、この構成ベクトルのコストは、0.1×(c1(t0)+c2(t1)+c3(t3))+0.2×(c1(t0)+c2(t1’))+0.5×(c1(t0)+c2(t1”))+ 0.2×c1(t0)となる。
以上のように、本実施形態によれば、将来の需要変動だけでなく、その需要変動予測の不確実性も考慮した上で最適なシステム構成を提示することができる。
この出願は、2013年3月4日に出願された日本出願特願2013-42053を基礎とする優先権を主張し、その開示の全てをここに取り込む。
以上、実施形態を参照して本願発明を説明したが、本願発明は上記実施形態に限定されるものではない。本願発明の構成や詳細には、本願発明のスコープ内で当業者が理解し得る様々な変更をすることができる。
上記の実施の形態の一部または全部は、以下の付記のようにも記載されうるが、以下には限られない。
(付記1)現在からシステムの想定寿命までの間に、前記システムに対して要求される処理量の予測値を表す需要予測と、現在から前記システムの想定寿命までの間の、前記システムの構成要素の調達コストと運用コストを含む金額の予測値を表すコスト予測と、前記システムの構成の変更可能な範囲を示すスケーリングポリシーとに基づいて、現在から前記システムの想定寿命までの間に掛かることが予測される、前記システムのコストを算出するコスト算出部と、
前記システムが満たすべき性能要件を含むサービスレベル要件と、前記システムの構成要素を表す設計パラメータと前記システムの性能を表すサービスレベル変数との関係を示すシステムモデルと、前記システムのコストとに基づいて、前記システムの最適な設計パラメータの組み合わせを算出する最適化部と、を備えたことを特徴とする設計支援システム。
(付記1)現在からシステムの想定寿命までの間に、前記システムに対して要求される処理量の予測値を表す需要予測と、現在から前記システムの想定寿命までの間の、前記システムの構成要素の調達コストと運用コストを含む金額の予測値を表すコスト予測と、前記システムの構成の変更可能な範囲を示すスケーリングポリシーとに基づいて、現在から前記システムの想定寿命までの間に掛かることが予測される、前記システムのコストを算出するコスト算出部と、
前記システムが満たすべき性能要件を含むサービスレベル要件と、前記システムの構成要素を表す設計パラメータと前記システムの性能を表すサービスレベル変数との関係を示すシステムモデルと、前記システムのコストとに基づいて、前記システムの最適な設計パラメータの組み合わせを算出する最適化部と、を備えたことを特徴とする設計支援システム。
(付記2)前記コスト算出部は、
複数の前記スケーリングポリシーの候補の中から、最適なスケーリングポリシーを選択した上で、前記システムのコストを算出する、付記1に記載の設計支援システム。
複数の前記スケーリングポリシーの候補の中から、最適なスケーリングポリシーを選択した上で、前記システムのコストを算出する、付記1に記載の設計支援システム。
(付記3)前記コスト算出部は、
前記需要予測の確実性を表す需要予測確度に基づいて、将来の需要予測の不確実さを考慮して前記システムのコストを算出する、付記1または2に記載の設計支援システム。
前記需要予測の確実性を表す需要予測確度に基づいて、将来の需要予測の不確実さを考慮して前記システムのコストを算出する、付記1または2に記載の設計支援システム。
(付記4)現在からシステムの想定寿命までの間に、前記システムに対して要求される処理量の予測値を表す需要予測と、現在から前記システムの想定寿命までの間の、前記システムの構成要素の調達コストと運用コストを含む金額の予測値を表すコスト予測と、前記システムの構成の変更可能な範囲を示すスケーリングポリシーとに基づいて、現在から前記システムの想定寿命までの間に掛かることが予測される、前記システムのコストを算出する工程と、
前記システムが満たすべき性能要件を含むサービスレベル要件と、前記システムの構成要素を表す設計パラメータと前記システムの性能を表すサービスレベル変数との関係を示すシステムモデルと、前記システムのコストとに基づいて、前記システムの最適な設計パラメータの組み合わせを算出する工程と、を備えたことを特徴とする設計支援方法。
前記システムが満たすべき性能要件を含むサービスレベル要件と、前記システムの構成要素を表す設計パラメータと前記システムの性能を表すサービスレベル変数との関係を示すシステムモデルと、前記システムのコストとに基づいて、前記システムの最適な設計パラメータの組み合わせを算出する工程と、を備えたことを特徴とする設計支援方法。
(付記5)コンピュータを、
現在からシステムの想定寿命までの間に、前記システムに対して要求される処理量の予測値を表す需要予測と、現在から前記システムの想定寿命までの間の、前記システムの構成要素の調達コストと運用コストを含む金額の予測値を表すコスト予測と、前記システムの構成の変更可能な範囲を示すスケーリングポリシーとに基づいて、現在から前記システムの想定寿命までの間に掛かることが予測される、前記システムのコストを算出するコスト算出部と、
前記システムが満たすべき性能要件を含むサービスレベル要件と、前記システムの構成要素を表す設計パラメータと前記システムの性能を表すサービスレベル変数との関係を示すシステムモデルと、前記システムのコストとに基づいて、前記システムの最適な設計パラメータの組み合わせを算出する最適化部と、して機能させるためのプログラム。
現在からシステムの想定寿命までの間に、前記システムに対して要求される処理量の予測値を表す需要予測と、現在から前記システムの想定寿命までの間の、前記システムの構成要素の調達コストと運用コストを含む金額の予測値を表すコスト予測と、前記システムの構成の変更可能な範囲を示すスケーリングポリシーとに基づいて、現在から前記システムの想定寿命までの間に掛かることが予測される、前記システムのコストを算出するコスト算出部と、
前記システムが満たすべき性能要件を含むサービスレベル要件と、前記システムの構成要素を表す設計パラメータと前記システムの性能を表すサービスレベル変数との関係を示すシステムモデルと、前記システムのコストとに基づいて、前記システムの最適な設計パラメータの組み合わせを算出する最適化部と、して機能させるためのプログラム。
本発明は、将来のシステムに対する需要の変化と適正なコストを考慮してシステムを設計することに適している。
10,20,30 設計支援システム、101 コスト算出部、102 最適化部、501 需要予測、502 コスト予測、503 スケーリングポリシー、504 サービスレベル要件、505 システムモデル、506,606 最適スケーリング方法、603 スケーリングポリシー候補、701 需要予測確度
Claims (5)
- 現在からシステムの想定寿命までの間に、前記システムに対して要求される処理量の予測値を表す需要予測と、現在から前記システムの想定寿命までの間の、前記システムの構成要素の調達コストと運用コストを含む金額の予測値を表すコスト予測と、前記システムの構成の変更可能な範囲を示すスケーリングポリシーとに基づいて、現在から前記システムの想定寿命までの間に掛かることが予測される、前記システムのコストを算出するコスト算出部と、
前記システムが満たすべき性能要件を含むサービスレベル要件と、前記システムの構成要素を表す設計パラメータと前記システムの性能を表すサービスレベル変数との関係を示すシステムモデルと、前記システムのコストとに基づいて、前記システムの最適な設計パラメータの組み合わせを算出する最適化部と、を備えたことを特徴とする設計支援システム。 - 前記コスト算出部は、
複数の前記スケーリングポリシーの候補の中から、最適なスケーリングポリシーを選択した上で、前記システムのコストを算出する、請求項1に記載の設計支援システム。 - 前記コスト算出部は、
前記需要予測の確実性を表す需要予測確度に基づいて、将来の需要予測の不確実さを考慮して前記システムのコストを算出する、請求項1または2に記載の設計支援システム。 - 現在からシステムの想定寿命までの間に、前記システムに対して要求される処理量の予測値を表す需要予測と、現在から前記システムの想定寿命までの間の、前記システムの構成要素の調達コストと運用コストを含む金額の予測値を表すコスト予測と、前記システムの構成の変更可能な範囲を示すスケーリングポリシーとに基づいて、現在から前記システムの想定寿命までの間に掛かることが予測される、前記システムのコストを算出する工程と、
前記システムが満たすべき性能要件を含むサービスレベル要件と、前記システムの構成要素を表す設計パラメータと前記システムの性能を表すサービスレベル変数との関係を示すシステムモデルと、前記システムのコストとに基づいて、前記システムの最適な設計パラメータの組み合わせを算出する工程と、を備えたことを特徴とする設計支援方法。 - コンピュータを、
現在からシステムの想定寿命までの間に、前記システムに対して要求される処理量の予測値を表す需要予測と、現在から前記システムの想定寿命までの間の、前記システムの構成要素の調達コストと運用コストを含む金額の予測値を表すコスト予測と、前記システムの構成の変更可能な範囲を示すスケーリングポリシーとに基づいて、現在から前記システムの想定寿命までの間に掛かることが予測される、前記システムのコストを算出するコスト算出部と、
前記システムが満たすべき性能要件を含むサービスレベル要件と、前記システムの構成要素を表す設計パラメータと前記システムの性能を表すサービスレベル変数との関係を示すシステムモデルと、前記システムのコストとに基づいて、前記システムの最適な設計パラメータの組み合わせを算出する最適化部と、して機能させるためのプログラム。
Applications Claiming Priority (2)
| Application Number | Priority Date | Filing Date | Title |
|---|---|---|---|
| JP2013-042053 | 2013-03-04 | ||
| JP2013042053 | 2013-03-04 |
Publications (1)
| Publication Number | Publication Date |
|---|---|
| WO2014136299A1 true WO2014136299A1 (ja) | 2014-09-12 |
Family
ID=51490845
Family Applications (1)
| Application Number | Title | Priority Date | Filing Date |
|---|---|---|---|
| PCT/JP2013/075516 Ceased WO2014136299A1 (ja) | 2013-03-04 | 2013-09-20 | 設計支援システム、設計支援方法、およびプログラム |
Country Status (1)
| Country | Link |
|---|---|
| WO (1) | WO2014136299A1 (ja) |
Citations (5)
| Publication number | Priority date | Publication date | Assignee | Title |
|---|---|---|---|---|
| JP2001222579A (ja) * | 2000-02-10 | 2001-08-17 | Toshiba Corp | 営業支援方法、営業支援システム、営業支援サーバ、記録媒体、および情報伝送媒体 |
| JP2004507838A (ja) * | 2000-08-29 | 2004-03-11 | アブ エル アタ・ナビル・エー | 情報システムのモデルベースのアーキテクチャを設計する自動システムおよび方法 |
| JP2005099973A (ja) * | 2003-09-24 | 2005-04-14 | Hitachi Ltd | 運用管理システム |
| JP2008242791A (ja) * | 2007-03-27 | 2008-10-09 | Nomura Research Institute Ltd | リプレース管理システムおよびリプレース管理方法 |
| JP2010092484A (ja) * | 2008-10-08 | 2010-04-22 | Accenture Global Services Gmbh | 統合設計アプリケーション |
-
2013
- 2013-09-20 WO PCT/JP2013/075516 patent/WO2014136299A1/ja not_active Ceased
Patent Citations (5)
| Publication number | Priority date | Publication date | Assignee | Title |
|---|---|---|---|---|
| JP2001222579A (ja) * | 2000-02-10 | 2001-08-17 | Toshiba Corp | 営業支援方法、営業支援システム、営業支援サーバ、記録媒体、および情報伝送媒体 |
| JP2004507838A (ja) * | 2000-08-29 | 2004-03-11 | アブ エル アタ・ナビル・エー | 情報システムのモデルベースのアーキテクチャを設計する自動システムおよび方法 |
| JP2005099973A (ja) * | 2003-09-24 | 2005-04-14 | Hitachi Ltd | 運用管理システム |
| JP2008242791A (ja) * | 2007-03-27 | 2008-10-09 | Nomura Research Institute Ltd | リプレース管理システムおよびリプレース管理方法 |
| JP2010092484A (ja) * | 2008-10-08 | 2010-04-22 | Accenture Global Services Gmbh | 統合設計アプリケーション |
Similar Documents
| Publication | Publication Date | Title |
|---|---|---|
| EP3654610B1 (en) | Graphical structure model-based method for prevention and control of abnormal accounts, and device | |
| JP5786863B2 (ja) | タスク配置最適化システム、タスク配置最適化方法、及びタスク配置最適化プログラム | |
| Li et al. | FLASH: F ast Neura l A rchitecture S earch with H ardware Optimization | |
| US20160239592A1 (en) | Data-driven battery aging model using statistical analysis and artificial intelligence | |
| JP6907664B2 (ja) | 非定常時系列データの予測に用いる方法及び装置 | |
| Dong et al. | QoS-oriented monitoring model of cloud computing resources availability | |
| JP6171938B2 (ja) | タスク配置最適化システム、タスク配置最適化方法、及びタスク配置最適化プログラム | |
| Suribabu | Resilience-based optimal design of water distribution network | |
| US20210026853A1 (en) | Combination search system, information processing device, method, and program | |
| Wang et al. | Analysis of priority multi-server retrial queueing inventory systems with MAP arrivals and exponential services | |
| CN119862360A (zh) | 数据处理方法、装置、电子设备和存储介质 | |
| Zhang et al. | Model selection procedure for high‐dimensional data | |
| Ponmalar et al. | Machine learning based network traffic predictive analysis | |
| JP6672203B2 (ja) | 電力供給経路評価装置、電力供給経路評価方法、およびプログラム | |
| JP2019109682A (ja) | 生産配分決定装置及び生産配分決定方法 | |
| WO2014136299A1 (ja) | 設計支援システム、設計支援方法、およびプログラム | |
| JP6828830B2 (ja) | 評価システム、評価方法および評価用プログラム | |
| Maythaisong et al. | Mutation‐Based Harmony Search Algorithm for Hybrid Testing of Web Service Composition | |
| Dong et al. | A day-ahead electricity price forecasting algorithm considered with multidimensional factors | |
| CN117937619A (zh) | 一种源网荷储系统规划方法及装置 | |
| Al Jufout et al. | MATLAB-Based Lightweight Workload Prediction via Machine Learning Models in Distributed Systems | |
| KR102923856B1 (ko) | 실측 데이터 기반 전력 계통의 가상 모델 제공 방법, 장치 및 컴퓨터 프로그램 | |
| CN119231765B (zh) | 新能源电站智能监控方法、系统、电子设备及存储介质 | |
| WO2014097599A1 (ja) | 最適設計支援装置、方法及びプログラム | |
| CN117150288B (zh) | 容器功耗确定模型训练、确定方法、装置、设备及介质 |
Legal Events
| Date | Code | Title | Description |
|---|---|---|---|
| 121 | Ep: the epo has been informed by wipo that ep was designated in this application |
Ref document number: 13876872 Country of ref document: EP Kind code of ref document: A1 |
|
| NENP | Non-entry into the national phase |
Ref country code: DE |
|
| 122 | Ep: pct application non-entry in european phase |
Ref document number: 13876872 Country of ref document: EP Kind code of ref document: A1 |
|
| NENP | Non-entry into the national phase |
Ref country code: JP |