WO2014038441A1 - 磁気共鳴イメージング装置および磁気共鳴イメージング方法 - Google Patents
磁気共鳴イメージング装置および磁気共鳴イメージング方法 Download PDFInfo
- Publication number
- WO2014038441A1 WO2014038441A1 PCT/JP2013/072966 JP2013072966W WO2014038441A1 WO 2014038441 A1 WO2014038441 A1 WO 2014038441A1 JP 2013072966 W JP2013072966 W JP 2013072966W WO 2014038441 A1 WO2014038441 A1 WO 2014038441A1
- Authority
- WO
- WIPO (PCT)
- Prior art keywords
- magnetic resonance
- frequency
- phase
- magnetic field
- imaging
- Prior art date
- Legal status (The legal status is an assumption and is not a legal conclusion. Google has not performed a legal analysis and makes no representation as to the accuracy of the status listed.)
- Ceased
Links
Images



Classifications
-
- G—PHYSICS
- G01—MEASURING; TESTING
- G01R—MEASURING ELECTRIC VARIABLES; MEASURING MAGNETIC VARIABLES
- G01R33/00—Arrangements or instruments for measuring magnetic variables
- G01R33/20—Arrangements or instruments for measuring magnetic variables involving magnetic resonance
- G01R33/44—Arrangements or instruments for measuring magnetic variables involving magnetic resonance using nuclear magnetic resonance [NMR]
- G01R33/48—NMR imaging systems
- G01R33/54—Signal processing systems, e.g. using pulse sequences ; Generation or control of pulse sequences; Operator console
- G01R33/56—Image enhancement or correction, e.g. subtraction or averaging techniques, e.g. improvement of signal-to-noise ratio and resolution
- G01R33/565—Correction of image distortions, e.g. due to magnetic field inhomogeneities
-
- A—HUMAN NECESSITIES
- A61—MEDICAL OR VETERINARY SCIENCE; HYGIENE
- A61B—DIAGNOSIS; SURGERY; IDENTIFICATION
- A61B5/00—Measuring for diagnostic purposes; Identification of persons
- A61B5/0033—Features or image-related aspects of imaging apparatus, e.g. for MRI, optical tomography or impedance tomography apparatus; Arrangements of imaging apparatus in a room
- A61B5/0037—Performing a preliminary scan, e.g. a prescan for identifying a region of interest
-
- A—HUMAN NECESSITIES
- A61—MEDICAL OR VETERINARY SCIENCE; HYGIENE
- A61B—DIAGNOSIS; SURGERY; IDENTIFICATION
- A61B5/00—Measuring for diagnostic purposes; Identification of persons
- A61B5/05—Detecting, measuring or recording for diagnosis by means of electric currents or magnetic fields; Measuring using microwaves or radio waves
- A61B5/055—Detecting, measuring or recording for diagnosis by means of electric currents or magnetic fields; Measuring using microwaves or radio waves involving electronic [EMR] or nuclear [NMR] magnetic resonance, e.g. magnetic resonance imaging
-
- A—HUMAN NECESSITIES
- A61—MEDICAL OR VETERINARY SCIENCE; HYGIENE
- A61B—DIAGNOSIS; SURGERY; IDENTIFICATION
- A61B5/00—Measuring for diagnostic purposes; Identification of persons
- A61B5/72—Signal processing specially adapted for physiological signals or for diagnostic purposes
- A61B5/7203—Signal processing specially adapted for physiological signals or for diagnostic purposes for noise prevention, reduction or removal
-
- G—PHYSICS
- G01—MEASURING; TESTING
- G01R—MEASURING ELECTRIC VARIABLES; MEASURING MAGNETIC VARIABLES
- G01R33/00—Arrangements or instruments for measuring magnetic variables
- G01R33/20—Arrangements or instruments for measuring magnetic variables involving magnetic resonance
- G01R33/28—Details of apparatus provided for in groups G01R33/44 - G01R33/64
- G01R33/38—Systems for generation, homogenisation or stabilisation of the main or gradient magnetic field
- G01R33/385—Systems for generation, homogenisation or stabilisation of the main or gradient magnetic field using gradient magnetic field coils
-
- G—PHYSICS
- G01—MEASURING; TESTING
- G01R—MEASURING ELECTRIC VARIABLES; MEASURING MAGNETIC VARIABLES
- G01R33/00—Arrangements or instruments for measuring magnetic variables
- G01R33/20—Arrangements or instruments for measuring magnetic variables involving magnetic resonance
- G01R33/28—Details of apparatus provided for in groups G01R33/44 - G01R33/64
- G01R33/38—Systems for generation, homogenisation or stabilisation of the main or gradient magnetic field
- G01R33/387—Compensation of inhomogeneities
-
- G—PHYSICS
- G01—MEASURING; TESTING
- G01R—MEASURING ELECTRIC VARIABLES; MEASURING MAGNETIC VARIABLES
- G01R33/00—Arrangements or instruments for measuring magnetic variables
- G01R33/20—Arrangements or instruments for measuring magnetic variables involving magnetic resonance
- G01R33/44—Arrangements or instruments for measuring magnetic variables involving magnetic resonance using nuclear magnetic resonance [NMR]
- G01R33/48—NMR imaging systems
- G01R33/54—Signal processing systems, e.g. using pulse sequences ; Generation or control of pulse sequences; Operator console
- G01R33/543—Control of the operation of the MR system, e.g. setting of acquisition parameters prior to or during MR data acquisition, dynamic shimming, use of one or more scout images for scan plane prescription
-
- G—PHYSICS
- G01—MEASURING; TESTING
- G01R—MEASURING ELECTRIC VARIABLES; MEASURING MAGNETIC VARIABLES
- G01R33/00—Arrangements or instruments for measuring magnetic variables
- G01R33/20—Arrangements or instruments for measuring magnetic variables involving magnetic resonance
- G01R33/44—Arrangements or instruments for measuring magnetic variables involving magnetic resonance using nuclear magnetic resonance [NMR]
- G01R33/48—NMR imaging systems
- G01R33/54—Signal processing systems, e.g. using pulse sequences ; Generation or control of pulse sequences; Operator console
- G01R33/56—Image enhancement or correction, e.g. subtraction or averaging techniques, e.g. improvement of signal-to-noise ratio and resolution
- G01R33/565—Correction of image distortions, e.g. due to magnetic field inhomogeneities
- G01R33/56563—Correction of image distortions, e.g. due to magnetic field inhomogeneities caused by a distortion of the main magnetic field B0, e.g. temporal variation of the magnitude or spatial inhomogeneity of B0
-
- G—PHYSICS
- G06—COMPUTING OR CALCULATING; COUNTING
- G06T—IMAGE DATA PROCESSING OR GENERATION, IN GENERAL
- G06T12/00—Tomographic reconstruction from projections
- G06T12/10—Image preprocessing, e.g. calibration, positioning of sources or scatter correction
-
- G—PHYSICS
- G01—MEASURING; TESTING
- G01R—MEASURING ELECTRIC VARIABLES; MEASURING MAGNETIC VARIABLES
- G01R33/00—Arrangements or instruments for measuring magnetic variables
- G01R33/20—Arrangements or instruments for measuring magnetic variables involving magnetic resonance
- G01R33/44—Arrangements or instruments for measuring magnetic variables involving magnetic resonance using nuclear magnetic resonance [NMR]
- G01R33/48—NMR imaging systems
- G01R33/54—Signal processing systems, e.g. using pulse sequences ; Generation or control of pulse sequences; Operator console
- G01R33/56—Image enhancement or correction, e.g. subtraction or averaging techniques, e.g. improvement of signal-to-noise ratio and resolution
- G01R33/5608—Data processing and visualization specially adapted for MR, e.g. for feature analysis and pattern recognition on the basis of measured MR data, segmentation of measured MR data, edge contour detection on the basis of measured MR data, for enhancing measured MR data in terms of signal-to-noise ratio by means of noise filtering or apodization, for enhancing measured MR data in terms of resolution by means for deblurring, windowing, zero filling, or generation of gray-scaled images, colour-coded images or images displaying vectors instead of pixels
Definitions
- the present invention relates to a magnetic resonance imaging (hereinafter referred to as MRI) apparatus, and more particularly to an MRI apparatus provided with means for correcting artifacts caused by static magnetic field inhomogeneity.
- MRI magnetic resonance imaging
- the MRI apparatus is a medical diagnostic imaging apparatus that applies a high-frequency magnetic field and a gradient magnetic field to a subject placed in a static magnetic field, measures a signal generated from the subject by nuclear magnetic resonance, and forms an image.
- a nuclear magnetic field is generally generated when an excitation pulse (a high-frequency magnetic field pulse) that excites the magnetization in the surface is applied at the same time as applying a slice gradient magnetic field that specifies the imaging surface, and the excited magnetization converges by this.
- Resonance signal echo
- a phase encoding gradient magnetic field and a readout gradient magnetic field in directions perpendicular to each other in the imaging surface are applied between the excitation and the echo acquisition.
- the measured echoes are arranged in a k-space where the horizontal axis is kx and the vertical axis is ky, and image reconstruction is performed by performing inverse Fourier transform on the echoes in the k-space.
- the pixel value of the reconstructed image is a complex number including absolute value information and phase information.
- the absolute value and phase are determined by imaging parameters including the type of imaging sequence, pixel size, repetition time, etc., magnetization density and relaxation time in the subject, and spatial distribution of resonance frequencies.
- a grayscale image having an absolute value as a pixel value is often used.
- a method of generating one image by combining an absolute value and a phase is also known.
- a phase image is generated by converting the phase of each pixel of a reconstructed image into a value having a threshold value [ ⁇ , ⁇ ], and the phase image threshold value is set to [0, 1].
- Create a converted phase mask find the product of the value of the phase of each pixel in the phase mask raised to the qth power (q ⁇ 1) and the absolute value of the pixel, and generate an image with the calculated product as the pixel value It is disclosed.
- the value of q is determined so that the contrast-noise ratio is maximized.
- Patent Document 2 discloses that the static magnetic field strength distribution is obtained from two phase distribution images in which the echo time is shifted by ⁇ t using the fact that the information on the static magnetic field strength is reflected in the phase value of the echo. Yes. Shimming is performed using this static magnetic field strength distribution.
- Non-Patent Document 1 discloses that the phase correction of the k-space echo signal is performed using the echo signal acquired by zero encoding. There is also known a process for removing phase information caused by static magnetic field inhomogeneity by performing high-pass filter processing or low-pass filter processing on echoes in the k space.
- Non-Patent Document 1 the method of correcting the phase of the k-space echo using the zero-encoded echo disclosed in Non-Patent Document 1 cannot correct only the phase information due to the static magnetic field inhomogeneity.
- phase information caused by static magnetic field inhomogeneity by applying high-pass filtering or low-pass filtering to echoes in k-space is also known, but artifacts may remain on the image, Even important phase information other than phase information due to magnetic field inhomogeneity may be removed.
- the present invention has been made in view of the above problems, and an object of the present invention is to provide a technique for removing a global phase change caused by static magnetic field inhomogeneity included in a nuclear magnetic resonance signal.
- the present invention pays attention to the fact that the phase component generated in the nuclear magnetic resonance signal due to the static magnetic field inhomogeneity is in a predetermined frequency band, and the phase component in the frequency band due to the static magnetic field inhomogeneity is Remove from image generated from nuclear magnetic resonance signal.
- the predetermined frequency band of the phase component caused by the static magnetic field inhomogeneity is obtained from the nuclear magnetic resonance signal acquired by the preliminary imaging.
- the frequency range of the phase component resulting from the static magnetic field inhomogeneity can be obtained from the nuclear magnetic resonance signal obtained by the preliminary imaging
- the signal processing on the nuclear magnetic resonance signal obtained by the main imaging can be performed. It is possible to remove a phase component caused by magnetic field inhomogeneity. Therefore, regardless of factors such as static magnetic field strength, imaging sequence, imaging parameters, magnetization density and relaxation time in the subject, and imaging methods of the main imaging, artifacts due to static magnetic field inhomogeneity can be reduced.
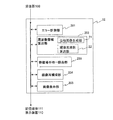
- FIG. shows schematic structure of the MRI apparatus of embodiment of this invention Block diagram showing detailed configuration of image processing unit
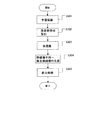
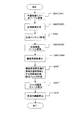
- movement of imaging and image generation of embodiment of this invention Flowchart showing the detailed operation of step 302 in FIG.
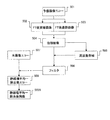
- Explanatory drawing showing images and signals obtained by the flow processing of FIG.
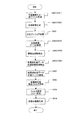
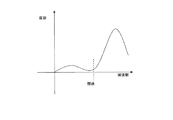
- Flowchart showing the processing procedure of the first embodiment Graph showing frequency distribution histogram and threshold frequency of phase data in Example 1
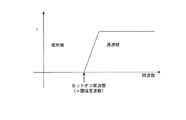
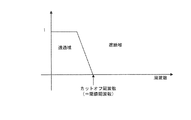
- Flowchart showing the processing procedure of the second embodiment Flowchart showing the processing procedure of the third embodiment Graph showing the high frequency band transmission filter of Example 3
- a signal component (phase component) due to phase rotation of magnetization caused by non-uniform magnetic field included in a nuclear magnetic resonance signal appears as a predetermined frequency band (specifically, a low frequency band). Attention is paid to removing the phase component caused by the static magnetic field inhomogeneity from at least one of the nuclear magnetic resonance signal acquired by the main imaging and the image reconstructed from the nuclear magnetic resonance signal acquired by the main imaging. Phase information generated by the static magnetic field inhomogeneity is acquired from the nuclear magnetic resonance signal acquired by the preliminary imaging, and a range of a predetermined frequency band (low frequency band) caused by the static magnetic field inhomogeneity is determined. This realizes reduction of artifacts due to phase components caused by non-uniform static magnetic fields in an image obtained by desired actual imaging.
- a predetermined frequency band specifically, a predetermined frequency band
- the MRI apparatus applies a high-frequency magnetic field and a gradient magnetic field to a subject 103 placed in a static magnetic field, and detects an nuclear magnetic resonance signal generated from the subject 103;
- a control unit 11 that controls the operation of the imaging unit 10 and an image processing unit 12 that performs an operation on the nuclear magnetic resonance signal and generates an image are provided.
- the control unit 11 causes the imaging unit 10 to execute predetermined preliminary imaging and main imaging. As shown in FIG.
- the image processing unit 12 obtains the frequency band calculation unit 202 that obtains the frequency band of the phase component due to the non-uniformity of the static magnetic field from the nuclear magnetic resonance signal obtained by the preliminary imaging, and obtains the main imaging.
- a static magnetic field non-uniformity removing unit 203 for removing a phase component in a low frequency band from the image generated from the nuclear magnetic resonance signal. This will be further described below.
- the imaging unit 10 includes a magnet 101 that generates a uniform static magnetic field in the imaging space in which the subject 103 is disposed, a gradient magnetic field coil 102 that generates a gradient magnetic field in the imaging space, and a high frequency in the imaging space.
- a probe 107 that irradiates a magnetic field and detects a nuclear magnetic resonance signal (hereinafter referred to as an echo), a gradient magnetic field power source 105 that supplies a current to the gradient coil 102, and a high-frequency generator 106 that supplies a high-frequency voltage to the probe 107
- a receiver 108 for detecting an echo detected by the probe 107, and a sequencer 104 A subject (for example, a living body) 103 is placed on a bed (table) or the like and placed in an imaging space.
- the operation of the sequencer 104 is controlled by the control unit 11 and executes imaging according to a predetermined imaging method and imaging conditions. Specifically, the sequencer 104 sends commands to the gradient magnetic field power source 105 and the high frequency generator 106 at timings for realizing a predetermined imaging method to generate current / voltage signals, and the gradient magnetic field coil 102 and the probe 107 are transmitted. To supply each.
- the gradient coil 102 generates a gradient magnetic field
- the probe 107 generates a high-frequency magnetic field and applies it to the subject 103.
- the echo generated from the subject 103 is received by the probe 107 and detected by the receiver 108.
- the sequencer 104 sets the nuclear magnetic resonance frequency (detection reference frequency f 0) that serves as a reference for detection by the receiver 108.
- the detected signal is sent to the computer 109.
- the sequencer 104 performs control so that each unit operates at a timing and intensity programmed in advance.
- a program that describes the high-frequency magnetic field, the gradient magnetic field, and the timing and intensity of signal reception is called a pulse sequence.
- Various pulse sequences are known depending on the purpose of imaging.
- the control unit 11 instructs the sequencer 104 to select the type of pulse sequence, and sets the timing and intensity. Thereby, it controls so that imaging is performed with a predetermined imaging method.
- the control unit 11 and the image processing unit 12 are arranged in the computer 109.
- the functions of the control unit 11 and the image processing unit 12 are realized by reading and executing a program stored in a memory (not shown) in which the CPU in the computer 109 is built.
- an echo measurement unit 201 that arranges the echo detected by the receiver 108 in the k space.
- an image reconstruction unit 204 for reconstructing an image from data arranged in the k space, and an image display unit 205 for displaying the obtained image on the display device 110.
- Each of these units is also realized by the CPU in the computer 109 reading and executing a prestored program.
- the computer 109 is connected to a display device 110 and a storage medium 111, and displays an image obtained by image processing.
- the detected signal and measurement conditions may be stored in the storage medium 111 as necessary.
- the control unit 11 causes the imaging unit 10 to execute a predetermined preliminary imaging sequence (S301).
- a predetermined preliminary imaging sequence two sets of nuclear magnetic resonance signals (echoes) for imaging a predetermined part are acquired by shifting the echo time (TE) by a predetermined time ( ⁇ t). For example, while setting the echo time to T0 and changing the phase encoding amount, measurement for acquiring a predetermined number of echoes necessary for image generation and setting the echo time to T0 + ⁇ t ( ⁇ t ⁇ 0)
- a preliminary imaging sequence for performing measurement to acquire a number of echoes is performed.
- the imaging conditions for the two measurements are preferably the same except for the echo time. Further, it is desirable that the preliminary imaging is performed with the subject 103 placed in the imaging space.
- the preliminary imaging sequence is performed in the same manner as a normal imaging sequence (spin echo sequence, gradient echo sequence, etc.) except that the echo time is shifted by ⁇ t. It is also possible to use a known imaging sequence for calculating the static magnetic field strength distribution (for example, the sequence disclosed in Japanese Patent Laid-Open No. 2001-238866 (FIG. 1)).
- the two echoes obtained by the receiver 108 detected by the two measurements of the preliminary imaging sequence are arranged in the k space in the echo measurement unit 201 of the image processing unit 12 and are located at the same position in the k space.
- the difference between the signal values can be obtained. Since the two sets of echoes are given phase information proportional to the time at which the inhomogeneity of the static magnetic field intensity was sensed and phase information based on other conditions, the difference between the two echoes can be obtained to obtain a value other than the static magnetic field inhomogeneity. An echo with reduced phase information due to the element can be obtained.
- the echo obtained by the difference is hereinafter referred to as a preliminary imaging echo 501.
- the preliminary imaging echo is a complex number.
- the frequency band calculation unit 202 of the image processing unit 12 obtains the frequency band of the phase component due to the non-uniformity of the static magnetic field from the preliminary imaging echo 501 (S302 in FIG. 3).
- the processing of S302 will be described in detail with reference to the flowchart of FIG. 4 and the explanatory diagram showing the data flow of FIG.
- the phase image generation unit 21 in the frequency band calculation unit 202 performs inverse Fourier transform (FT) on the preliminary imaging echo 501 arranged in the k space (S401 in FIG. 4). As a result, as shown in FIG. 5, a real part image 502 and an imaginary part image 503 are obtained from the preliminary imaging echo 501.
- FT inverse Fourier transform
- the phase image generation unit 21 calculates the phase value of each pixel from the real part image 502 and the imaginary part image 503, and generates a phase image 504 (S402).
- This phase image shows the distribution of the phase difference between the two echoes obtained in the preliminary imaging in real space, and reflects the non-uniformity of the static magnetic field strength.
- the threshold frequency calculation unit 22 of the frequency band calculation unit 202 obtains the frequency band 505 of the phase component due to the non-uniformity of the static magnetic field from the phase image 504 (FIG. 5). First, the threshold frequency calculation unit 22 performs Fourier transform on the phase image 504 to obtain data (phase data) after Fourier transform (S403 in FIG. 4). Using the fact that the phase component caused by the static magnetic field inhomogeneity appears at a low frequency, the frequency band of the phase data caused by the static magnetic field inhomogeneity is calculated from the frequency distribution of the phase data. Specifically, a threshold frequency that is separated into high-frequency phase data and low-frequency phase data is obtained based on the frequency distribution of the phase data.
- the frequency band equal to or lower than the threshold frequency of the phase data is set as the frequency band of the phase component caused by the static magnetic field inhomogeneity (S404, 405).
- Various methods can be used as processing for obtaining the threshold frequency based on the frequency distribution.
- the histogram of the frequency distribution of the phase data is subjected to at least one of a discriminant analysis method, a weighted average, an addition average, a p-tile (P tile) method, etc. And this can be used as a threshold frequency.
- control unit 11 causes the imaging unit 10 to execute a desired main imaging sequence set by the operator, and acquires a nuclear magnetic resonance signal (main imaging echo 507) by the main imaging (S303 in FIG. 3).
- main imaging echo 507 a nuclear magnetic resonance signal
- the control unit 11 causes the imaging unit 10 to execute a desired main imaging sequence set by the operator, and acquires a nuclear magnetic resonance signal (main imaging echo 507) by the main imaging (S303 in FIG. 3).
- main imaging echo 507 by the main imaging (S303 in FIG. 3).
- the execution of the main imaging sequence may not be performed at this timing, the main imaging is performed at an earlier timing, the acquired main imaging echo 507 is stored in the storage medium 111, and this is stored from the storage medium 111. You may read and use.
- the static magnetic field nonuniformity removing unit 203 and the image reconstruction unit 204 use the frequency band of the phase component resulting from the nonuniformity of the static magnetic field obtained in S302 and the main imaging echo 507 obtained in S303 to generate a static magnetic field.
- a reconstructed image from which the phase component due to nonuniformity has been removed is generated (S304).
- the removal method is to remove the frequency band of the phase component due to the static magnetic field inhomogeneity from the imaging echo 507 to obtain the echo 508 after the static magnetic field inhomogeneous removal, and after removing the static magnetic field inhomogeneity from the echo 508
- There is a method for reconstructing the image 509 (processing on k-space).
- a method for obtaining an image 509 after removing the static magnetic field inhomogeneity by reconstructing an image from the imaging echo 507 and removing the phase component due to the static magnetic field inhomogeneity from the reconstructed image (processing in the image space). ) Can also be used. In any case, it is possible to use a method of generating a filter 506 that removes the phase component of the frequency band and applying the filter to remove the phase component of the frequency band from an echo or a reconstructed image. A specific example of processing will be described in a later embodiment.
- the reconstructed image from which the phase component due to the static magnetic field inhomogeneity has been removed is displayed on the display device 110 by the image display unit 205 of the image processing unit 12 (S305 in FIG. 3).
- the frequency band of the static magnetic field inhomogeneity of the imaging space in which the main imaging is performed is set. Can be sought.
- the phase component caused by the static magnetic field inhomogeneity can be removed by the signal processing for the nuclear magnetic resonance processing acquired by the main imaging, so that the local high-frequency phase component in which important phase information appears in the image diagnosis appears. Therefore, it is possible to separate the low-frequency phase component caused by the static magnetic field inhomogeneity.
- the frequency band of the phase component due to static magnetic field inhomogeneity by preliminary imaging, factors such as static magnetic field strength, imaging sequence, imaging parameters, magnetization density and relaxation time in the subject, Regardless of the influence of the imaging method, it is possible to remove artifacts due to non-uniform static magnetic fields. For this reason, compared with the case where the phase component resulting from static magnetic field inhomogeneity is removed by filtering processing in a fixed frequency band, the low frequency phase hardly remains, and the artifacts can be further reduced on the image.
- the static magnetic field nonuniformity removal unit 203 performs inverse Fourier transform on low frequency phase data below the threshold frequency to generate a low frequency phase image, and generates a filter from the low frequency phase image. By applying this filter to the nuclear magnetic resonance signal obtained by the main imaging, the phase component of the frequency band is removed.
- the static magnetic field nonuniformity removing unit 203 uses, as a filter, data obtained by Fourier transforming an image obtained by reversing the pixel value of the low frequency phase image. By multiplying this filter by the nuclear magnetic resonance signal obtained by the main imaging, the phase component of the frequency band is removed.
- Step S601 The phase image generation unit 21 of the frequency band calculation unit 202 performs an inverse Fourier transform IFT (x) on the real part Epr and the imaginary part Epi of the complex number of preliminary imaging echoes 501 obtained in S301 of FIG.
- the real part image (Spr) 502 and the imaginary part image (Spi) 503 are calculated (formula (1), formula (2)) (FIG. 6S601 (corresponding to S401)).
- Step S602 The pixel value of the real part image (Spr) 502 and the imaginary part image (Spi) 503, regarded as complex numbers for each pixel, to calculate the phase value Sp p in the pixel by the following equation (3), the phase value Sp p A phase image (Sp p ) 504 as a pixel value is generated (S602 (corresponding to S402)).
- the phase unwrapping process may be performed on the calculated phase image (Sp p ) 504 (S603).
- the phase unwrapping process for example, when the phase value of the pixel (x, y) is ⁇ and the phase value of the adjacent pixel (x + 1, y) is ⁇ , that is, the phase value of the adjacent pixel is steep.
- This is a process of correcting the phase value of the pixels after the pixel (x + 1, y) when there is a slight change, and correcting so as to have a gradual change (continuous phase value) as a whole.
- phase unwrap processing is expressed as Unwrap (A) like a function
- the phase image Sp pu after phase unwrap converted to the range of (- ⁇ , ⁇ ) uses the phase image Sp p before phase amp wrap processing. Is expressed as shown in Equation (4).
- the threshold frequency calculation unit 22 treats the data in which the pixel values of the phase image Sp pu after the phase unwrap processing are arranged as periodic data with a finite length of one row, and performs a Fourier transform FT (x) ( S604 (corresponding to S403)).
- the data after the Fourier transform becomes phase data Dp p (Equation 5).
- Step S605 From the frequency distribution of the phase data Dp p, it is possible to know which frequency components are contained degree. Since the frequency component of the phase data resulting from the static magnetic field inhomogeneity is a low frequency, the threshold frequency calculation unit 22 obtains a threshold frequency that separates the low frequency phase data and the high frequency phase data (S605 (corresponding to S404) ). For example, as shown in FIG. 7, a histogram of the frequency distribution of the phase data Dp p, find the center of the histogram by using the average weighted average or sum, it is possible to use a method for its center to a threshold frequency. It can also be separated by a method such as discriminant analysis or p-tile method. Specifically, when the separation is performed by the discriminant analysis method, the threshold frequency to be separated into the high frequency and the low frequency is obtained by the following procedure.
- the threshold frequency calculation unit 22 obtains a band of phase data (low frequency phase data Dp l ) having a frequency equal to or lower than the phase threshold threshold calculated from the phase data Dp p , and phase data (high frequency phase data Dp) having a frequency higher than the phase threshold threshold. h ) (S606 (corresponding to S405)).
- the low frequency phase data Dp l is the frequency band of the phase data resulting from the static magnetic field inhomogeneity.
- Phase data having a frequency larger than the phase threshold threshold (high-frequency phase data Dp h ) is phase data resulting from conditions other than static magnetic field inhomogeneity.
- the static magnetic field nonuniformity removal unit 203 creates a filter in order to remove the phase component of the frequency band obtained in S405 from the main imaging echo 507.
- the static magnetic field inhomogeneity removing unit 203 an inverse Fourier transform of the low-frequency phase data Dp l obtained in S606, and calculates the low-frequency phase image Sp l (formula ( 6)).
- Step S608 Using the calculated low frequency phase image Sp l , the static magnetic field nonuniformity removal unit 203 creates a low frequency phase removal filter Fp l .
- data obtained by arranging the reciprocals of the respective pixel values of the low-frequency phase image Sp l is Fourier-transformed to generate a low-frequency phase removal filter Fp l (Expression (7)).
- Step S609 Static magnetic field inhomogeneity removing section 203, the low frequency phase removal filter Fp l, multiplying each of the real part Emr and the imaginary part Emi of the imaging echo 507, filter application echoes (static magnetic field inhomogeneity removed after echo 508) Real part Fmr and imaginary part Fmi are calculated (Equation (8), Equation (9)).
- Step S610 The real part Fmr and the imaginary part Fmi of the echo 508 after the static magnetic field inhomogeneous removal are respectively inverse Fourier transformed to calculate the real part image Smr and the imaginary part image Smi (equations (10) and (11)).
- the amplitude image is generated by the equation (12) from the pixel values of the real part image Smr and the imaginary part image Smi. It is of course possible to generate a phase image by obtaining arctan (Smr / Smi).
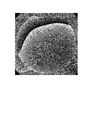
- FIG. 8 shows a phase image generated without applying the present embodiment generated from the imaging echo 507
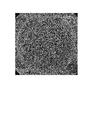
- FIG. 9 shows a phase image generated by applying the processing of FIG. 6 of the first embodiment.
- the phase image of FIG. 9 to which the present embodiment is applied is an image having no phase discontinuity and no global artifact caused by the static magnetic field inhomogeneity.
- a filter is applied to the main imaging echo 507 to remove the phase component of the frequency band due to the static magnetic field inhomogeneity on the k space.
- the reconstruction of the main imaging echo 507 is performed.
- a filter is applied to the image to obtain an image from which the phase component caused by the static magnetic field inhomogeneity is removed in the image space. This process will be described with reference to FIG.
- the static magnetic field non-uniformity removing unit 203 generates a low-frequency phase image by performing an inverse Fourier transform on the low-frequency phase data below the threshold frequency, generates a filter from the low-frequency phase image, and uses this filter for the main imaging.
- the phase component of the frequency band is removed.
- the static magnetic field non-uniformity removing unit 203 uses the low-frequency phase image as a filter, and divides the pixel value of the image generated from the nuclear magnetic resonance signal obtained by the main imaging by the pixel value of the low-frequency phase image to obtain a frequency. Remove the phase component of the band.
- Steps S601 to S607 Since each step from S601 to S606 is the same as that in the first embodiment, the description thereof is omitted.
- S607 in the same manner as in Example 1, and the inverse Fourier transform low-frequency phase data Dp l obtained in S606, and calculates the low-frequency phase image Sp l (Equation (6)).
- Step S608 ' Next, using the pixel value (phase value) of the low-frequency phase image Sp l , a complex number Cp having a phase angle Sp l and a magnitude of 1 is generated, and the real frequency component is used as the pixel value. A partial image Cpr and a low-frequency imaginary part image Cpi each having an imaginary part component as a pixel value are generated. In the second embodiment, the low-frequency real part image Cpr and the low-frequency imaginary part image Cpi are used as filters for removing phase components caused by static magnetic field inhomogeneity.
- Step S609 ' the filter generated in step 608 ′ is applied to the image reconstructed from the main imaging echo 507 to generate an image from which the phase component in the frequency band caused by the static magnetic field inhomogeneity is removed.
- the real part Emr and the imaginary part Emi of the main imaging echo 507 are inverse Fourier transformed to calculate the post-FT real part image Smr and the post-FT imaginary part image Smi (formulas (13) and (14)).
- the pixel values of the obtained post-FT real part image Smr and post-FT imaginary part image Smi are the pixel values of the low-frequency image real part Cpr and the low-frequency image imaginary part Cpi, which are filters.
- the division is performed as in 16) to generate a filter application real part image Fmr and a filter application imaginary part image Fmi each having the obtained values Fmr and Fmi as pixel values.
- Step S610 ' If the final desired to generate an amplitude image Sm m calculates filter applying real image Fmr, from the pixel value of the filter application imaginary part image FMI, the pixel value of the amplitude image Sm m by the equation (17), the amplitude image Generate Sm m . It is of course possible to generate a phase image by obtaining arctan (Fmr / Fmi).
- Example 3 a low-frequency phase removal filter is created from the threshold frequency obtained in Step 605 of Example 1, and a phase component in a frequency band due to static magnetic field inhomogeneity is removed from the imaging echo 507 using this filter. Processing will be described with reference to FIG.
- the static magnetic field nonuniformity removing unit 203 generates a high-frequency transmission filter that transmits a frequency band greater than the threshold frequency, and applies it to the nuclear magnetic resonance signal obtained in the main imaging, thereby eliminating the static magnetic field inefficiency.
- the phase component of the frequency band caused by the uniformity is removed.
- the static magnetic field nonuniformity removal unit 203 removes the phase component of the frequency band by applying a low frequency phase removal filter obtained by Fourier transform of the high frequency transmission filter to the nuclear magnetic resonance signal obtained by the main imaging.
- Steps S601 to S605 are the same as those in the first embodiment, and the threshold frequency is obtained in step 605.
- the calculation of the frequency band in steps 606 and 607 of the first embodiment and the inverse Fourier transform of the low frequency phase data are not performed.
- a high-frequency band transmission filter DF hp is created.
- the high-frequency transmission filter DF hp creates a high-frequency transmission filter DF hp whose cutoff frequency is the threshold frequency threshold, the high-frequency band above the threshold frequency is the transmission band, and the low-frequency band lower than the threshold frequency is the cutoff band .
- the vertical axis represents the coefficient
- the horizontal axis represents the frequency.
- the high frequency transmission filter DF hp is Fourier transformed to create a low frequency phase removal filter SF hp (Equation (18)).
- Step S609 The real part Emr and the imaginary part Emi of the imaging echo 507 are respectively multiplied by the low-frequency phase removal filter SF hp to calculate the real part Fmr and the imaginary part Fmi of the filter applied echo (echo 508 after static magnetic field inhomogeneous removal) ( Equation (19), Equation (20)).
- Step S610 From the real part Fmr and the imaginary part Fmi of the echo 508 after non-uniform removal of the static magnetic field, the desired amplitude image Sm m and phase can be obtained using Equation 10, Equation 11, Equation 12, etc., as in Step 610 of Example 1. Generate an image.
- Example 4 the phase component (low frequency phase component) of the frequency band caused by the static magnetic field inhomogeneity is removed while preventing the signal intensity of the high frequency phase component of the imaging echo 507 from being reduced.
- a high-frequency phase removal filter is applied to the main imaging echo 507 to remove a phase component having a frequency higher than the threshold frequency, and an echo in which only the low-frequency phase component remains is used to detect only the low-frequency phase component. Remove from 507. Thereby, since the high frequency phase component of the main imaging echo 507 is not subjected to the filter application, the high frequency phase component can be acquired without reducing the signal intensity.
- This processing step will be described with reference to FIG.
- the static magnetic field non-uniformity removing unit 203 generates a low-frequency transmission filter that transmits a frequency band smaller than the threshold frequency, and applies it to the nuclear magnetic resonance signal obtained in the main imaging, thereby By obtaining a nuclear magnetic resonance signal and subtracting it from the nuclear magnetic resonance signal obtained in the main imaging, a signal from which the phase component of the frequency band due to the static magnetic field inhomogeneity is removed is obtained.
- the static magnetic field nonuniformity removal unit 203 obtains a nuclear magnetic resonance signal in the above frequency band by applying a high frequency phase removal filter obtained by Fourier transforming a low frequency transmission filter to the nuclear magnetic resonance signal obtained in the main imaging.
- Steps S601 to S605 are the same as those in the first embodiment, and the threshold frequency is obtained in step 605.
- the calculation of the frequency band in steps 606 and 607 of the first embodiment and the inverse Fourier transform of the low frequency phase data are not performed.
- a low-frequency transmission filter DF lp is created in which the cutoff frequency is the threshold frequency threshold, the transmission frequency is equal to or lower than the threshold frequency, and the cutoff frequency is higher than the threshold frequency.
- the low-frequency transmission filter DF lp is Fourier-transformed to create a high-frequency phase removal filter SF lp (Expression (21)).
- Step S621 This high-frequency phase removal filter SF lp is applied to the real part Emr and the imaginary part Emi of the main imaging echo to calculate filter application echoes Fmr lp and Fmi lp (Equations (22) and (23)).
- the high frequency phase removal filter applied echoes Fmr lp and Fmi lp obtained in S621 are echoes in which only low frequency components equal to or lower than the phase threshold threshold remain. That is, by dividing the real part Emr and imaginary part Emi of the imaging echo by the real part Fmr lp and imaginary part Fmi lp of the echo applied with the high-frequency phase removal filter, the real part Fmr and imaginary part of the echo 508 after static magnetic field inhomogeneity removal is divided.
- the part Fmi can be calculated (formula (24), formula (25)).
- Step S610 From the real part Fmr and the imaginary part Fmi of the echo 508 after non-uniform removal of the static magnetic field, the desired amplitude image Sm m and phase can be obtained using Equation 10, Equation 11, Equation 12, etc., as in Step 610 of Example 1. Generate an image.
- the high-frequency phase component that is the low-frequency phase removal filter application echo is a component that has not been applied with a filter, and therefore has a high signal intensity. Therefore, a large clear image of the contrast ratio can be obtained as an amplitude image Sm m or phase image is generated in S610.
Landscapes
- Health & Medical Sciences (AREA)
- Physics & Mathematics (AREA)
- Life Sciences & Earth Sciences (AREA)
- Engineering & Computer Science (AREA)
- Nuclear Medicine, Radiotherapy & Molecular Imaging (AREA)
- General Health & Medical Sciences (AREA)
- Radiology & Medical Imaging (AREA)
- Signal Processing (AREA)
- Heart & Thoracic Surgery (AREA)
- Public Health (AREA)
- Pathology (AREA)
- Biomedical Technology (AREA)
- Biophysics (AREA)
- Medical Informatics (AREA)
- Molecular Biology (AREA)
- Surgery (AREA)
- Animal Behavior & Ethology (AREA)
- Veterinary Medicine (AREA)
- General Physics & Mathematics (AREA)
- High Energy & Nuclear Physics (AREA)
- Condensed Matter Physics & Semiconductors (AREA)
- Artificial Intelligence (AREA)
- Computer Vision & Pattern Recognition (AREA)
- Physiology (AREA)
- Psychiatry (AREA)
- Theoretical Computer Science (AREA)
- Magnetic Resonance Imaging Apparatus (AREA)
Abstract
Description
予備撮像エコーは、複素数である。
周波数帯域算出部202の位相画像生成部21は、図3のS301で得た複素数の予備撮像エコー501の実部Epr、虚部Epiに対して、それぞれ逆フーリエ変換IFT(x)を実施し、実部画像(Spr)502および虚部画像(Spi)503を算出する(式(1),式(2))(図6S601(S401に相当))。


実部画像(Spr)502および虚部画像(Spi)503の画素値を、画素ごとの複素数としてみなし、下式(3)によりその画素における位相値Sppを算出し、この位相値Sppを画素値とする位相画像(Spp)504を生成する(S602(S402に相当))。

ここで、算出した位相画像(Spp)504に対して位相アンラップ処理を実施してもよい(S603)。位相アンラップ処理は、例えば、画素(x,y)の位相値がπ、隣接する画素(x+1,y)の位相値が-πであるような場合、すなわち、隣接する画素の位相値が、急峻な変化を持つ場合に画素(x+1,y)以降の画素の位相値を補正し、全体として緩やかな変化(連続した位相値)を持つように補正する処理である。位相アンラップ処理の詳細な処理内容には公知の処理方法が種々あり、(0,2π)の範囲に変換する方法や、(-π,π)の範囲に変換する方法があるが、これらに限ったものではない。位相アンラップ処理を関数のようにUnwrap(A)と表すと、(-π,π)の範囲に変換された位相アンラップ後の位相画像Sppuは、位相アンプラップ処理前の位相画像Sppを用いて、式(4)のように表わされる。

次に、閾値周波数算出部22は、位相アンラップ処理後の位相画像Sppuの画素値を並べたデータを1行の有限長で周期的なデータとして扱い、フーリエ変換FT(x)を実施する(S604(S403に相当))。フーリエ変換後のデータは位相データDppとなる(式5)。

この位相データDppの周波数分布から、どの周波数成分がどの程度含まれているかを知ることができる。静磁場不均一に起因する位相データの周波数成分は、低周波であるので、閾値周波数算出部22は、低周波位相データと高周波位相データとを分離する閾値周波数を求める(S605(S404に相当))。例えば、図7に示すように、位相データDppの周波数分布のヒストグラムを求め、加重平均や加算平均を用いてヒストグラムの中心を求め、その中心を閾値周波数とする方法を用いることができる。また、判別分析法やp-tile法などの方法で分離することもできる。具体的には、判別分析法によって分離を行う場合、以下のような手順により、高周波と低周波とに分離する閾値周波数を求める。
(2)ヒストグラムに対し、判別分析法を適用し、図7に破線で示すような閾値周波数thresholdを算出する。
閾値周波数算出部22は、位相データDppから算出した位相閾値threshold以下の周波数の位相データ(低周波位相データDpl)の帯域を求め、位相閾値thresholdより大きい周波数の位相データ(高周波位相データDph)から分離する(S606(S405に相当))。この低周波位相データDplが静磁場不均一に起因する位相データの周波数帯域である。位相閾値thresholdより大きい周波数の位相データ(高周波位相データDph)は、静磁場不均一以外の条件に起因する位相データである。
次に、静磁場不均一除去部203は、本撮像エコー507からS405で求めた周波数帯域の位相成分を除去するために、フィルタを作成する。フィルタを作成するために、本実施例1では、静磁場不均一除去部203は、S606で求めた低周波位相データDplを逆フーリエ変換し、低周波位相画像Splを算出する(式(6))。

算出した低周波位相画像Splを用いて、静磁場不均一除去部203は、低周波位相除去フィルタFplを作成する。本実施例では、最も簡単な方法として、低周波位相画像Splの各画素値の逆数を並べたデータをフーリエ変換し、低周波位相除去フィルタFplを生成する(式(7))。

静磁場不均一除去部203は、この低周波位相除去フィルタFplを、本撮像エコー507の実部Emrおよび虚部Emiにそれぞれ掛け合わせ、フィルタ適用エコー(静磁場不均一除去後エコー508)の実部Fmrおよび虚部Fmiを算出する(式(8),式(9))。


この静磁場不均一除去後エコー508の実部Fmrおよび虚部Fmiをそれぞれ逆フーリエ変換して実部画像Smr、虚部画像Smiを算出する(式(10),式(11))。



S601からS606の各ステップは、実施例1と同様であるので説明を省略する。S607では、実施例1と同様に、S606で求めた低周波位相データDplを逆フーリエ変換し、低周波位相画像Splを算出する(式(6))。
次に、低周波位相画像Splの画素値(位相値)を用いて、偏角が位相値Spl、大きさが1の複素数Cpを生成し、その実部成分を画素値とする低周波実部画像Cpr、虚部成分を画素値とする低周波虚部画像Cpiをそれぞれ生成する。この低周波実部画像Cpr、低周波虚部画像Cpiを、実施例2では、静磁場不均一に起因する位相成分を除去するためのフィルタとして用いる。
次に、本撮像エコー507から再構成した画像に、ステップ608’で生成したフィルタを適用し、静磁場不均一に起因する周波数帯域の位相成分を除去した画像を生成する。


最終的に振幅画像Smmを生成したい場合には、フィルタ適用実部画像Fmr、フィルタ適用虚部画像Fmiの画素値から、式(17)により振幅画像Smmの画素値を算出し、振幅画像Smmを生成する。また、arctan(Fmr/Fmi)を求めることにより、位相画像を生成することももちろん可能である。

S601からS605の各ステップは実施例1と同様であり、ステップ605により閾値周波数を求める。なお、実施例3では、実施例1のステップ606、607の周波数帯域の算出や、低周波位相データの逆フーリエ変換は行わない。
次に、図12のように、高周波域透過フィルタDFhpを作成する。高周波域透過フィルタDFhpは、カットオフ周波数が閾値周波数thresholdであり、閾値周波数以上の高周波帯域を透過帯域とし、閾値周波数より低い低周波帯域を遮断帯域とする高周波域透過フィルタDFhpを作成する。このとき、図12のグラフは、縦軸が係数、横軸が周波数である。この高周波域透過フィルタDFhpをフーリエ変換し、低周波位相除去フィルタSFhpを作成する(式(18))。

低周波位相除去フィルタSFhpを本撮像エコー507の実部Emr,虚部Emiにそれぞれ掛け合わせ、フィルタ適用エコー(静磁場不均一除去後エコー508)の実部Fmr,虚部Fmiを算出する(式(19),式(20))。


この静磁場不均一除去後エコー508の実部Fmr、虚部Fmiから、実施例1のステップ610と同様に、式10、式11、式12等を用いて、所望の振幅画像Smmや位相画像を生成する。
S601からS605の各ステップは実施例1と同様であり、ステップ605により閾値周波数を求める。なお、実施例4では、実施例1のステップ606、607の周波数帯域の算出や、低周波位相データの逆フーリエ変換は行わない。
次に、図14のように、カットオフ周波数が閾値周波数thresholdであり、閾値周波数以下を透過帯域とし、閾値周波数より大きい周波数を遮断帯域とする低周波域透過フィルタDFlpを作成する。この低周波域透過フィルタDFlpをフーリエ変換して、高周波位相除去フィルタSFlpを作成する(式(21))。

この高周波位相除去フィルタSFlpを本撮像エコーの実部Emr,虚部Emiに適用し、フィルタ適用エコーFmrlp、Fmilpを算出する(式(22)、式(23))。


S621で求めた高周波位相除去フィルタ適用エコーFmrlp、Fmilpは、位相閾値threshold以下の低周波成分のみが残ったエコーである。すなわち、本撮像エコーの実部Emr、虚部Emiを高周波位相除去フィルタ適用エコーの実部Fmrlp、虚部Fmilpで除算することにより、静磁場不均一除去後エコー508の実部Fmr、虚部Fmiを算出することができる(式(24)、式(25))。


この静磁場不均一除去後エコー508の実部Fmr、虚部Fmiから、実施例1のステップ610と同様に、式10、式11、式12等を用いて、所望の振幅画像Smmや位相画像を生成する。
Claims (12)
- 静磁場の中に置かれた被検体に高周波磁場および傾斜磁場を印加して、前記被検体から発生する核磁気共鳴信号を検出する撮像部と、
前記撮像部の動作を制御する制御部と、
前記核磁気共鳴信号に対して演算を行い、画像を生成する画像処理部と、
を備え、
前記制御部は、
所定の予備撮像と、本撮像とを前記撮像部に実行させ、
前記画像処理部は、前記予備撮像により取得した核磁気共鳴信号から、前記静磁場の不均一に起因する位相成分の周波数帯域を求める周波数帯域算出部と、
前記本撮像により取得された核磁気共鳴信号、および、前記本撮像により取得された核磁気共鳴信号から再構成した画像、のうちのいずれか一方から前記周波数帯域の位相成分を除去する静磁場不均一除去部と
を含むことを特徴とする磁気共鳴イメージング装置。 - 請求項1に記載の磁気共鳴イメージング装置において、
前記予備撮像は、所定部位を画像化するための核磁気共鳴信号を、エコータイムをずらして2組取得するものであり、
前記周波数帯域算出部は、前記予備撮像により取得した2組の核磁気共鳴信号から、前記所定部位における前記2組の核磁気共鳴信号の位相差の分布を表す位相画像を生成する位相画像生成部と、前記位相画像をフーリエ変換して得た位相データの前記周波数分布を求め、前記周波数分布に基づいて前記位相データを高周波位相データと低周波位相データとに分離する閾値周波数を求め、前記閾値周波数以下の範囲を前記周波数帯域とする閾値周波数算出部と
を含むことを特徴とする磁気共鳴イメージング装置。 - 請求項2に記載の磁気共鳴イメージング装置において、
前記閾値周波数算出部は、前記位相差の周波数分布について、判別分析法、加重平均、加算平均、および、Pタイル法のうち少なくとも一つの処理を用いて、前記閾値周波数を求める
ことを特徴とする磁気共鳴イメージング装置。 - 請求項1に記載の磁気共鳴イメージング装置において、
前記静磁場不均一除去部は、前記周波数帯域の位相成分を除去するフィルタを生成し、前記本撮像で得た核磁気共鳴信号または前記本撮像で得た核磁気共鳴信号から生成した画像、に前記フィルタを適用することにより、前記周波数帯域の位相成分を除去する
ことを特徴とする磁気共鳴イメージング装置。 - 請求項2に記載の磁気共鳴イメージング装置において、
前記静磁場不均一除去部は、前記閾値周波数以下の前記低周波位相データを逆フーリエ変換して低周波位相画像を生成し、前記低周波位相画像からフィルタを生成し、前記フィルタを、前記本撮像で得た核磁気共鳴信号または前記本撮像で得た核磁気共鳴信号から生成した画像に適用することにより、前記周波数帯域の位相成分を除去する
ことを特徴とする磁気共鳴イメージング装置。 - 請求項5に記載の磁気共鳴イメージング装置において、
前記静磁場不均一除去部は、前記低周波位相画像の画素値を逆数にした画像をフーリエ変換したデータを前記フィルタとして用い、前記フィルタを前記本撮像で得た核磁気共鳴信号に掛け合わせることにより、前記周波数帯域の位相成分を除去する
ことを特徴とする磁気共鳴イメージング装置。 - 請求項5に記載の磁気共鳴イメージング装置において、
前記静磁場不均一除去部は、前記低周波位相画像を前記フィルタとし、前記本撮像で得た核磁気共鳴信号から生成した画像の画素値を前記低周波位相画像の画素値で除算することにより、前記周波数帯域の位相成分を除去する
ことを特徴とする磁気共鳴イメージング装置。 - 請求項2に記載の磁気共鳴イメージング装置において、
前記静磁場不均一除去部は、前記閾値周波数より大きい周波数帯域を透過する高周波透過フィルタを生成し、前記本撮像で得た核磁気共鳴信号に適用することにより、前記周波数帯域の位相成分を除去する
ことを特徴とする磁気共鳴イメージング装置。 - 請求項8に記載の磁気共鳴イメージング装置において、
前記静磁場不均一除去部は、前記高周波透過フィルタをフーリエ変換した低周波位相除去フィルタを前記本撮像で得た核磁気共鳴信号に掛けることにより、前記周波数帯域の位相成分を除去する
ことを特徴とする磁気共鳴イメージング装置。 - 請求項2に記載の磁気共鳴イメージング装置において、
前記静磁場不均一除去部は、前記閾値周波数より小さい周波数帯域を透過する低周波透過フィルタを生成し、前記本撮像で得た核磁気共鳴信号に適用することにより、前記周波数帯域の核磁気共鳴信号を得て、これを前記本撮像で得た核磁気共鳴信号から除去することにより、前記周波数帯域の位相成分が除去された信号を得る
ことを特徴とする磁気共鳴イメージング装置。 - 請求項10に記載の磁気共鳴イメージング装置において、
前記静磁場不均一除去部は、前記低周波透過フィルタをフーリエ変換した高周波位相除去フィルタを、前記本撮像で得た核磁気共鳴信号に掛けることにより、前記周波数帯域の核磁気共鳴信号を得る
ことを特徴とする磁気共鳴イメージング装置。 - 静磁場の中に置かれた被検体に所定の予備撮像を実施して得た核磁気共鳴信号から、前記静磁場の不均一に起因する位相成分の周波数帯域を求め、
前記静磁場の中に置かれた前記被検体に所定の本撮像を実施して得た核磁気共鳴信号から生成した画像から、前記周波数帯域の位相成分を除去することを特徴とする磁気共鳴イメージング方法。
Priority Applications (3)
| Application Number | Priority Date | Filing Date | Title |
|---|---|---|---|
| JP2014534317A JPWO2014038441A1 (ja) | 2012-09-06 | 2013-08-28 | 磁気共鳴イメージング装置および磁気共鳴イメージング方法 |
| CN201380040328.XA CN104507387B (zh) | 2012-09-06 | 2013-08-28 | 磁共振成像装置以及磁共振成像方法 |
| US14/398,745 US9746537B2 (en) | 2012-09-06 | 2013-08-28 | Magnetic resonance imaging apparatus and magnetic resonance imaging method |
Applications Claiming Priority (2)
| Application Number | Priority Date | Filing Date | Title |
|---|---|---|---|
| JP2012196068 | 2012-09-06 | ||
| JP2012-196068 | 2012-09-06 |
Publications (1)
| Publication Number | Publication Date |
|---|---|
| WO2014038441A1 true WO2014038441A1 (ja) | 2014-03-13 |
Family
ID=50237053
Family Applications (1)
| Application Number | Title | Priority Date | Filing Date |
|---|---|---|---|
| PCT/JP2013/072966 Ceased WO2014038441A1 (ja) | 2012-09-06 | 2013-08-28 | 磁気共鳴イメージング装置および磁気共鳴イメージング方法 |
Country Status (4)
| Country | Link |
|---|---|
| US (1) | US9746537B2 (ja) |
| JP (2) | JP6013161B2 (ja) |
| CN (1) | CN104507387B (ja) |
| WO (1) | WO2014038441A1 (ja) |
Cited By (1)
| Publication number | Priority date | Publication date | Assignee | Title |
|---|---|---|---|---|
| JP2015198719A (ja) * | 2014-04-07 | 2015-11-12 | 株式会社日立メディコ | 磁気共鳴イメージング装置 |
Families Citing this family (8)
| Publication number | Priority date | Publication date | Assignee | Title |
|---|---|---|---|---|
| KR101652048B1 (ko) * | 2014-12-05 | 2016-08-29 | 삼성전자주식회사 | 자기 공명 영상 장치 및 자기 공명 영상의 생성 방법 |
| US9805662B2 (en) * | 2015-03-23 | 2017-10-31 | Intel Corporation | Content adaptive backlight power saving technology |
| US12452416B2 (en) * | 2016-01-22 | 2025-10-21 | Spike Vision (Beijing) Technology Co., Ltd. | Generating image based on pulse sequences obtained from encoded information |
| JP6595393B2 (ja) * | 2016-04-04 | 2019-10-23 | 株式会社日立製作所 | 磁気共鳴イメージング装置、及び、画像処理方法 |
| US11340323B2 (en) * | 2020-01-06 | 2022-05-24 | General Electric Company | Low acoustic noise magnetic resonance image acquisition |
| JP7557741B2 (ja) * | 2021-02-25 | 2024-09-30 | 富士フイルム株式会社 | 磁気共鳴イメージング装置、画像補正方法、および静磁場不均一補正方法 |
| CN115607133B (zh) * | 2022-09-26 | 2023-11-28 | 中科微影(泰州)医疗科技有限公司 | 一种磁共振图像相位解卷绕方法 |
| JP2025180505A (ja) * | 2024-05-30 | 2025-12-11 | 国立大学法人京都大学 | 磁気共鳴画像の再構成方法、装置およびプログラム |
Citations (2)
| Publication number | Priority date | Publication date | Assignee | Title |
|---|---|---|---|---|
| JP2001238866A (ja) * | 2000-03-01 | 2001-09-04 | Hitachi Ltd | 磁気共鳴イメージング装置 |
| US20090256567A1 (en) * | 2008-04-10 | 2009-10-15 | Pelin Aksit | Three-point method and system for fast and robust field mapping for epi geometric distortion correction |
Family Cites Families (14)
| Publication number | Priority date | Publication date | Assignee | Title |
|---|---|---|---|---|
| US5162737A (en) * | 1989-03-31 | 1992-11-10 | Hitachi, Ltd. | Multi-echo NMR imaging method |
| US5371465A (en) * | 1991-03-13 | 1994-12-06 | Hitachi, Ltd. | Inspection method and apparatus using nuclear magnetic resonance (NMR) |
| JP3544782B2 (ja) * | 1996-04-16 | 2004-07-21 | 株式会社東芝 | 磁気共鳴診断装置 |
| JP3041688B2 (ja) * | 1998-08-07 | 2000-05-15 | 技術研究組合医療福祉機器研究所 | 高空間分解能磁気共鳴撮影装置 |
| WO2000072752A1 (en) * | 1999-05-26 | 2000-12-07 | Hitachi Medical Corporation | Magnetic resonance imaging method and device |
| JP3353826B2 (ja) * | 1999-06-24 | 2002-12-03 | ジーイー横河メディカルシステム株式会社 | 磁場不均一測定装置、位相補正装置および磁気共鳴撮像装置 |
| JP4619674B2 (ja) * | 2004-03-24 | 2011-01-26 | 株式会社東芝 | 磁気共鳴イメージング装置 |
| JP4991704B2 (ja) * | 2006-03-31 | 2012-08-01 | 株式会社日立メディコ | 磁気共鳴イメージング装置及び方法 |
| US7592812B2 (en) * | 2006-04-13 | 2009-09-22 | Kabushiki Kaisha Toshiba | Magnetic resonance imaging apparatus and static magnetic field correction method |
| EP2143036A4 (en) * | 2007-04-02 | 2012-01-18 | Univ Pennsylvania | MISCELLANEOUS IMAGE RECORDING OF A CHARACTERIZED ENSEMBLE |
| US7911208B2 (en) * | 2007-10-15 | 2011-03-22 | Siemens Aktiengesellschaft | Methods for rectification of B0 inhomogeneity effects in magnetic resonance images |
| EP2572210A1 (en) * | 2010-05-21 | 2013-03-27 | Commissariat à l'Énergie Atomique et aux Énergies Alternatives | Method and apparatus for correcting bl - inhomogeneity in slice - selective mri using composite rf pulses |
| DE102014205888B3 (de) * | 2014-03-28 | 2015-05-28 | Siemens Aktiengesellschaft | Frequenzüberwachung von Gradientenpulsen bei der Magnetresonanz-Bildgebung |
| DE102014206311B3 (de) * | 2014-04-02 | 2015-10-08 | Siemens Aktiengesellschaft | Empfangssystem für Lokalspulen eines Magnetresonanztomographiesystems |
-
2012
- 2012-12-06 JP JP2012266944A patent/JP6013161B2/ja active Active
-
2013
- 2013-08-28 JP JP2014534317A patent/JPWO2014038441A1/ja active Pending
- 2013-08-28 CN CN201380040328.XA patent/CN104507387B/zh not_active Expired - Fee Related
- 2013-08-28 WO PCT/JP2013/072966 patent/WO2014038441A1/ja not_active Ceased
- 2013-08-28 US US14/398,745 patent/US9746537B2/en not_active Expired - Fee Related
Patent Citations (2)
| Publication number | Priority date | Publication date | Assignee | Title |
|---|---|---|---|---|
| JP2001238866A (ja) * | 2000-03-01 | 2001-09-04 | Hitachi Ltd | 磁気共鳴イメージング装置 |
| US20090256567A1 (en) * | 2008-04-10 | 2009-10-15 | Pelin Aksit | Three-point method and system for fast and robust field mapping for epi geometric distortion correction |
Non-Patent Citations (1)
| Title |
|---|
| PEI-HSIN WU ET AL.: "Accurate BO mapping with an adaptive algorithm integrating KESA, PRELUDE, and time-domain phase unwrapping", PROC. INTL. SOC. MAG. RESON. MED., vol. 20, May 2012 (2012-05-01) * |
Cited By (1)
| Publication number | Priority date | Publication date | Assignee | Title |
|---|---|---|---|---|
| JP2015198719A (ja) * | 2014-04-07 | 2015-11-12 | 株式会社日立メディコ | 磁気共鳴イメージング装置 |
Also Published As
| Publication number | Publication date |
|---|---|
| US9746537B2 (en) | 2017-08-29 |
| JPWO2014038441A1 (ja) | 2016-08-08 |
| CN104507387A (zh) | 2015-04-08 |
| JP2014064880A (ja) | 2014-04-17 |
| CN104507387B (zh) | 2017-03-08 |
| JP6013161B2 (ja) | 2016-10-25 |
| US20150276905A1 (en) | 2015-10-01 |
Similar Documents
| Publication | Publication Date | Title |
|---|---|---|
| WO2014038441A1 (ja) | 磁気共鳴イメージング装置および磁気共鳴イメージング方法 | |
| JP6374065B2 (ja) | 磁気共鳴イメージング装置 | |
| CN104067137B (zh) | 具有对流动伪影的抑制的mr成像 | |
| US20190365230A1 (en) | Functional Magnetic Resonance Imaging (fMRI) Methodology Using Transverse Relaxation Preparation and Non-Echo-Planar Imaging (EPI) Pulse Sequences | |
| AU2012317518B2 (en) | Image analysis device, image analysis method, and image analysis programme | |
| CN108778116B (zh) | 磁共振成像装置以及图像处理方法 | |
| WO2010120829A2 (en) | Method for reducing artifacts in magnetic resonance imaging | |
| US20160012569A1 (en) | Image processing device, magnetic resonance imaging apparatus and image processing method | |
| WO2015019449A1 (ja) | 磁気共鳴撮影装置および水脂肪分離方法 | |
| WO2016021603A1 (ja) | 磁気共鳴イメージング装置および磁気共鳴イメージング方法 | |
| WO2014125876A1 (ja) | 磁気共鳴イメージング装置及びその処理方法 | |
| JPWO2011132715A1 (ja) | 磁気共鳴イメージング装置 | |
| JP5959888B2 (ja) | 磁気共鳴イメージング装置及び位相補正方法 | |
| KR101418170B1 (ko) | 자기공명영상 획득 장치 및 방법 | |
| US20240331225A1 (en) | Methods, apparatuses, systems, and computer-readable mediums for biomarker quantification using free-breathing stack-of-radial imaging | |
| EP4369021A2 (en) | Velocimetry magnetic resonance imaging apparatus and control method of the same | |
| JP6401930B2 (ja) | 磁気共鳴イメージング装置 | |
| Kaaouana et al. | Phase contrast MRI for discriminating brain microbleed in a multicentre clinical study |
Legal Events
| Date | Code | Title | Description |
|---|---|---|---|
| 121 | Ep: the epo has been informed by wipo that ep was designated in this application |
Ref document number: 13835869 Country of ref document: EP Kind code of ref document: A1 |
|
| WWE | Wipo information: entry into national phase |
Ref document number: 14398745 Country of ref document: US |
|
| ENP | Entry into the national phase |
Ref document number: 2014534317 Country of ref document: JP Kind code of ref document: A |
|
| NENP | Non-entry into the national phase |
Ref country code: DE |
|
| 122 | Ep: pct application non-entry in european phase |
Ref document number: 13835869 Country of ref document: EP Kind code of ref document: A1 |