WO2014034273A1 - 設備状態監視方法及び設備状態監視装置 - Google Patents
設備状態監視方法及び設備状態監視装置 Download PDFInfo
- Publication number
- WO2014034273A1 WO2014034273A1 PCT/JP2013/068531 JP2013068531W WO2014034273A1 WO 2014034273 A1 WO2014034273 A1 WO 2014034273A1 JP 2013068531 W JP2013068531 W JP 2013068531W WO 2014034273 A1 WO2014034273 A1 WO 2014034273A1
- Authority
- WO
- WIPO (PCT)
- Prior art keywords
- sensor data
- time
- sensor
- data
- unit
- Prior art date
Links
Images


Classifications
-
- G—PHYSICS
- G08—SIGNALLING
- G08B—SIGNALLING OR CALLING SYSTEMS; ORDER TELEGRAPHS; ALARM SYSTEMS
- G08B21/00—Alarms responsive to a single specified undesired or abnormal condition and not otherwise provided for
- G08B21/18—Status alarms
- G08B21/185—Electrical failure alarms
-
- G—PHYSICS
- G05—CONTROLLING; REGULATING
- G05B—CONTROL OR REGULATING SYSTEMS IN GENERAL; FUNCTIONAL ELEMENTS OF SUCH SYSTEMS; MONITORING OR TESTING ARRANGEMENTS FOR SUCH SYSTEMS OR ELEMENTS
- G05B23/00—Testing or monitoring of control systems or parts thereof
- G05B23/02—Electric testing or monitoring
- G05B23/0205—Electric testing or monitoring by means of a monitoring system capable of detecting and responding to faults
- G05B23/0218—Electric testing or monitoring by means of a monitoring system capable of detecting and responding to faults characterised by the fault detection method dealing with either existing or incipient faults
- G05B23/0221—Preprocessing measurements, e.g. data collection rate adjustment; Standardization of measurements; Time series or signal analysis, e.g. frequency analysis or wavelets; Trustworthiness of measurements; Indexes therefor; Measurements using easily measured parameters to estimate parameters difficult to measure; Virtual sensor creation; De-noising; Sensor fusion; Unconventional preprocessing inherently present in specific fault detection methods like PCA-based methods
-
- G—PHYSICS
- G08—SIGNALLING
- G08B—SIGNALLING OR CALLING SYSTEMS; ORDER TELEGRAPHS; ALARM SYSTEMS
- G08B21/00—Alarms responsive to a single specified undesired or abnormal condition and not otherwise provided for
- G08B21/18—Status alarms
- G08B21/182—Level alarms, e.g. alarms responsive to variables exceeding a threshold
Definitions
- the present invention based on multi-dimensional time series data output from a plant or equipment, etc., detects malfunctions or signs of equipment at the time of drastic changes in startup or stop sequence, and for cost reduction,
- the present invention relates to a facility state monitoring method and a facility state monitoring apparatus for restoring a severe change that cannot be obtained at a long sampling interval and monitoring the statistical probability characteristics of the change.
- Electric power companies use waste heat from gas turbines to supply hot water for district heating and supply high-pressure steam and low-pressure steam to factories.
- Petrochemical companies operate gas turbines and other power sources.
- preventive maintenance for detecting malfunctions or signs of facilities is extremely important for minimizing damage to society.
- failures are likely to occur frequently, so it is important to detect an abnormality during that period early.
- a plurality of sensors are attached to the target equipment or plant, and whether the sensor is normal or abnormal is automatically determined according to the monitoring standard for each sensor.
- Patent Document 1 Japanese Patent Application Laid-Open No. 2011-070635.
- the newly input sensor data is an abnormal measure of the projection distance to the normal model.
- the abnormality detection is performed depending on whether or not a predetermined threshold of the abnormality measure is exceeded.
- Non-patent document 1 and non-patent document 2 disclose typical techniques for detecting anomalies while calculating parameters representing statistical probability characteristics that can simultaneously monitor the statistical probability characteristics of time-series sensor data. There is a way. In this method, a normal model is created using statistically probabilistic parameters calculated directly from the sensor waveform at each time, and an abnormality is detected using the degree of separation from the model.
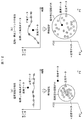
- FIG. 12 shows changes in the local space by the method described in Patent Document 1 on the feature space due to the difference in operation mode.
- the normal local space created from the normal sensor data is on the feature space.
- the abnormal data is greatly separated from the normal local space and easily identified.
- the degree of abnormality is calculated at each time, so that the abnormality of the sequence when the change is severe can be detected.
- the drastic change cannot be sufficiently caught.
- the sensor sampling time is not synchronized with the start of the sequence, a time lag occurs in the sensor data of the same sequence acquired at different times.
- a time lag also occurs in sensor data between sensors. For this reason, the techniques disclosed in Non-Patent Document 1 and Non-Patent Document 2 described above cannot calculate statistical probabilistic parameters for each time, and cannot perform abnormality detection.
- the present invention solves the above-mentioned problems of the prior art, and can detect an abnormality while monitoring the drastic change and the statistical probability characteristics of the change even for a start-up and stop sequence having a drastic change.
- An equipment state monitoring method and an equipment state monitoring apparatus provided with a detection method are provided.
- the present invention provides a method for detecting an abnormality of a plant or equipment, a sensor signal intermittently output from a sensor attached to the plant or equipment, and the plant or equipment in the same period as the sensor signal.
- An event signal corresponding to the start and end of the equipment start sequence or stop sequence is input, and the input sensor signal corresponds to a section between the start event signal and the end event signal of the start sequence or end sequence.
- a sensor signal to be extracted, a signal value at a certain time of the extracted sensor signal and a probability distribution thereof are estimated, a feature amount is extracted based on the estimated probability distribution, and the plant or the The abnormality of equipment was detected.
- an apparatus for detecting an abnormality in a plant or facility with a sensor signal intermittently output from a sensor attached to the plant or facility and the same period as the sensor signal.
- An event signal corresponding to the start and end of the start sequence or stop sequence of the plant or equipment is input, and a section between the start event signal and the end event signal of the start sequence or end sequence of the input sensor signals
- a data pre-processing unit that performs a process of matching the cut-out sensor signal to a time starting from the start event signal of the start sequence or the end sequence, and a sensor processed by the data pre-processing unit
- a probability distribution estimator for estimating a signal value and its probability distribution at a certain time of the signal;
- a feature amount extraction unit that extracts a feature amount based on the probability distribution estimated by the probability distribution estimation unit; and an abnormality detection unit that detects an abnormality of the plant or facility based on the feature amount extracted by the feature amount extraction unit;
- an input / output unit that has a screen that
- a time lag between sensor data of the same sequence acquired at different times that occurs when the sensor sampling time is not synchronized with the start of the sequence is not synchronized with the start of the sequence.
- the statistical probability of the sensor waveform at any time during the sequence period because it was possible to eliminate the time lag between the sensor data of different sensors that occurred when the data could not be acquired synchronously The characteristics can be monitored.
- the present invention relates to a facility state monitoring method and a facility state monitoring device for detecting a failure or sign of a facility that occurs when a start-up or stop sequence that undergoes drastic changes is being executed in a facility such as a plant.
- Anomaly detection based on probability distribution for each time considering time series transition by determining the estimated time of sensor data output intermittently by matching the start time of the sequence and estimating the sensor data at that time Is to do.
- FIG. 1A shows a configuration example of a system that realizes the equipment state monitoring method in the present embodiment.
- This system receives the sampling sensor data 1002 and the event data 1001 output from the equipment 101 or the database 111 and the user instruction 1003 from the user, and detects an abnormality, the intermediate result and the abnormality detection result.
- a storage medium 11 for storage and a display device 12 for displaying intermediate results and abnormality detection results are provided.
- the abnormality detection system 10 processes the data preprocessing unit 102 that processes data, the sensor data 1002 from the database 111, and the event data 1001 in the data preprocessing unit 102, and then estimates the sensor data estimated time.
- Sensor data that estimates sensor data at the time determined by the sensor data estimation time determination unit 112 after the data preprocessing unit 102 processes the sensor data 1002 and event data 1001 from the determination unit 112 and the equipment 101
- the estimation unit 103, the statistical probability distribution estimation unit 104 that performs statistical probability distribution estimation at that time, the feature amount extraction unit 105 that extracts the feature amount using the statistical probability distribution, and the feature amount extracted by the feature amount extraction unit 105
- the learning unit 113 that learns using, and the learning unit 113 after learning Configured with an abnormality detection unit 106 to detect an abnormality with normal space or decision boundary 1004.
- the data preprocessing unit 102 searches the event data analysis unit 1021 for searching for the start time of the sequence designated by the user from the event data 1001, and sensor sampling data from the sensor data 1002 received using the information on the start time of the designated sequence.
- a sensor data extraction unit 1022 that calculates start / end times for extraction and extracts sensor data 1002 and a sensor data time adjustment unit 1023 that adjusts the time of the extracted sensor data are provided.
- the learning unit 113, the identification boundary 1004, and the abnormality detection unit 106 constitute an identification unit 107 (107 ′).
- the operation of this system includes an “estimated time determination” phase in which sensor data estimated time is determined using data stored in the database 111, and a normal space or identification boundary 1004 used for abnormality detection is determined using the stored data.
- the previous two phases “estimated time determination” phase and “learning” phase are offline processing, and the final third phase “abnormality detection” is online processing.
- “abnormality detection” can be performed offline. In the following description, they are distinguished by the words “when estimated time is determined”, “learning”, and “when abnormality is detected”.
- a solid line arrow 100 indicates an “abnormality detection” path indicating a data flow in the “abnormality detection” phase
- a dotted line arrow 100 ′ indicates a “learning” path indicating a data flow in the “learning” phase
- An arrow 100 ′′ is an “estimated time determination” path indicating a data flow in the “estimated time determination” phase.
- the equipment 101 subject to state monitoring is equipment or a plant such as a gas turbine or a steam turbine.
- the facility 101 outputs sensor data 1002 and event data 1001 representing the state.
- the “estimated time determination” phase process is first performed offline, and then the “learning” phase process is performed offline using the result of the “estimated time determination” phase process. Then, using the result of the “estimated time determination” phase process and the result of the “learning” phase, an “abnormality detection” phase by online processing is executed.
- Sensor data 1002 is multidimensional time series data acquired from a plurality of sensors attached to the equipment 101 at regular intervals. Depending on the size of the equipment and plant, the sensor type may be several hundred to several thousand. For example, the temperature of cylinders, oil, cooling water, etc., the pressure of oil or cooling water, These include shaft rotation speed, room temperature, and operation time. In addition to representing the output and state, there may be control data for controlling something to a certain value.
- the event data analysis unit 1021 of the data preprocessing unit 102 inputs the event data 1001 and the user instruction 1003 output from the database 111 (S131), and the start time of the sequence specified by the user instruction 1003 Is searched from the event data 1001 inputted (S132).
- the sensor data extraction unit 1022 inputs the sensor data 1002 output from the database 111 (S134), and calculates sensor data extraction start / end times corresponding to the sequence start time obtained from the event data analysis unit 1021. Then, the sensor data is cut out from the sensor data 1002 input from the database 111 (S135).
- the cut out sensor data is sent to the sensor data time adjustment unit 1023, the time is adjusted in the sensor data time adjustment unit 1023 (S 136), and sent to the estimated time determination unit 112, so that the estimated sensor data time is obtained.
- the determined estimated time is stored or output (S138).
- This process is performed using event data 1001 and sensor data 1002 extracted from the database 111 along the “estimated time determination” path 100 ′.
- FIG. 1B shows learning when using the one-class classifier 107
- FIG. 1C shows learning when using the multi-class classifier 107 ′.
- the event data analysis unit 1021 inputs the event data 1001 and the user instruction 1003 output from the database 111 (S101), and inputs the start time of the sequence specified by the user instruction 1003. Search from the event data 1001 (S102).
- the sensor data extraction unit 1022 receives the sensor data 1002 output from the database 111 (S104), and calculates sensor data extraction start / end times corresponding to the sequence start time obtained from the event data analysis unit 1021. Then, the sensor data is cut out from the sensor data 1002 input from the database 111 (S105). The extracted sensor data is time-adjusted by the sensor data time adjustment unit 1023 (S106).
- the sensor data estimation time output from the estimated time determination unit 112 is input to the sensor data estimation unit 103 (S103), and the sensor data time is estimated based on the sensor data estimation time information input by the sensor data estimation unit 103. (S107).
- the statistical probability distribution estimation unit 104 estimates the statistical probability distribution of the sensor data whose time is estimated (S108), and the sensor data estimated by the feature amount extraction unit 105 based on the estimated statistical probability distribution is calculated. A feature amount is extracted (S109).
- the learning unit 113 of the classifier 107 uses the feature amount of the sensor data extracted by the feature amount extraction unit 105 to perform learning.
- a normal space is created (S110), and the created normal space is output (S111).
- the multi-class discriminator 107 ′ of FIG. 1C when using the multi-class discriminator 107 ′ of FIG. 1C, whether or not the sensor data is normal or abnormal by inputting a file with an index indicating whether the sensor data read from the database 111 is normal or abnormal by the user instruction 1003 (S112), and then, using the feature amount extracted by the feature amount extraction unit 105, learning is performed by the learning unit 113 of the discriminator 107 ', thereby determining an identification boundary 1004 for identifying normal or abnormal ( S110 '), the determined identification boundary 1004 is output (S111').
- the event data analysis unit 1021 inputs the event data 1001 output from the equipment 101 and the user instruction 1003 (S121), and searches for the start time of the sequence specified by the user (S122).
- the sensor data extraction unit 1022 inputs the sensor data 1002 output from the equipment 101 (S124), calculates the sensor data extraction start end time corresponding to the sequence start time obtained from the event data analysis unit 1021, The sensor data is cut out (S125), and the time is adjusted by the sensor data time adjustment unit 1023 (S126).
- the sensor data estimated time determined and stored in advance by the estimated time determining unit 112 during learning is input to the sensor data estimating unit 103 (S123), and the sensor data estimating unit 103 estimates the estimated time determining unit 112.
- the sensor data estimation is performed on the sensor data time-adjusted sensor data input from the sensor data time adjustment unit 1023 at the sensor data estimation time input from (S127), and the statistical probability distribution of the sensor data estimated by the statistical probability distribution estimation unit 104 is estimated.
- the feature amount extraction unit 105 extracts the feature amount based on the estimated statistical probability distribution (S129).
- the anomaly detection unit 106 uses the feature amount extracted by the feature amount extraction unit 105 to perform abnormality identification using the normal space or the identification boundary 1004 created by the learning unit 113 in the classifier 107 (107 ′). ) And output and display the detection result (S131).
- each unit shown in FIG. 1A will be described in detail in order. That is, determination of extraction start / end time in the sensor data extraction unit 1022, time adjustment of sensor data in the sensor data time adjustment unit 1023, determination of sensor data estimation time in the estimation time determination unit 112, sensor data in the sensor data estimation unit 103 , Estimation of probability distribution in the statistical probability distribution estimation unit 104, and feature amount extraction in the feature amount extraction unit 105 will be described in detail with reference to FIGS. 2A to 8C.
- the sensor data cutout unit 1022 first calculates sensor data cutout start / end times, and cuts out sensor data between them using the cutout start / end times.
- FIG. 2A is a diagram showing an image at the start and end of cutting out in the acquired sensor waveform.
- the example of (a) and (b) in FIG. 2A includes both rising and falling of the sensor waveform from the start to the end of cutting, and the sensor data values at the start and end are the same level. It will be.
- the sensor waveform changes smoothly between rising and falling, whereas in the example of (b), the waveform is jagged between rising and falling.
- the sensor data values at the start and end of cutting are at different levels.
- FIG. 2B is a diagram showing a flow of sensor data extraction start / end determination.
- the sensor data cutout unit 1022 first inputs a user instruction 1003 (S201), and determines whether the mode (start or end) calculation is automatic or non-automatic according to the user instruction (S202).
- the start time of the designated sequence obtained from the event data analysis unit 1021 is input (S203).
- the sensor data 1002 output from the equipment 101 or the database 111 is input (S204).
- calculation of the cutout start time is started (S205).
- the start time of the designated sequence is set as the sensor data extraction start time (S210), and the sensor data extraction start time is output (S211).
- the sensor data extraction end time is calculated by receiving the extraction start time from S211 and the determination result of whether the end mode is automatic or non-automatic from S202, and starting calculation of the extraction end time (S212).
- the sensor data extraction end time is set to the time of the predetermined number of sensor data after the sensor data extraction start time (S217), and the sensor data extraction end time is output (S218).
- FIG. 2C An example of the start / end determination index is shown in FIG. 2C.
- two sensor data before and after are connected by a straight line, and the inclination of the straight line is used as a start / end determination index.
- the time when the index becomes larger than the predetermined threshold is set as the sensor data extraction start time. Further, the time when the index becomes smaller than the predetermined threshold is set as the sensor data extraction end time.
- the event data 1001 is a signal representing operation / failure / warning of equipment that is output irregularly, and includes a time, a unique code representing operation / failure / warning, and a message character string.
- the message character strings corresponding to the start of the start sequence and the start of the stop sequence are “Request ⁇ module ⁇ on” and “Request module off”, respectively.
- the event data 1001 since the same specified sequence is performed at different times, there are a plurality of start times.
- FIG. 3B shows a first example of the time adjustment process of the sensor data 1002 using the event data 1001 executed by the sensor data time adjustment unit 1023.
- the figure shows (a) sensor data before time adjustment and (b) sensor data after time adjustment.
- the elapsed time is calculated at each extraction start time obtained by calculating the sensor data of the specified sequence acquired at different times, and extraction is performed so that the zero time is aligned as shown in (b).
- the sensor data is set on the same time axis.
- the time interval of the elapsed time from the start time may not be a fixed interval. Or you may make it a fixed interval according to the shortest time interval.
- the numbers displayed in the list of sensor data after the time adjustment are the acquired sensor data, and the blank is the sensor data that cannot be acquired.
- FIG. 3C shows a second example of sensor data time adjustment processing using event data 1001 executed by the sensor data time adjustment unit 1023.
- the cutting start time ts, correct and cutting end time te, correct of the correction sensor data sequence (b) are set as the cutting start time ts , ref of the reference sensor data sequence (a).
- the time interval ⁇ t ′ correct of the corrected sensor data string of (b) is set so that the cut end time t e and ref are matched.
- the flow of the sensor data estimated time determination process performed by the estimated time determination unit (112) will be described with reference to FIG.
- the sensor data string after time adjustment obtained by processing the normal sensor data for learning from the database 111 by the data preprocessing unit 102 is input to the sensor data estimated time determination unit 112 (S401), and a window (window) ) (S402), the intensity evaluation index is calculated (S403), and the sampling interval is calculated from the intensity evaluation index using the relational expression between the intensity evaluation index and the sampling interval (S405). Then, it is determined whether or not to end (S406).
- the window moves in the increasing direction (S407), and the process of calculating the sampling interval from the calculation of the intensity of the sensor data (S402 to S405) is repeated. If “Yes” is determined, the estimated time in the window is calculated using the sampling interval (S408), and the estimated time is stored and output (S409).
- the severity evaluation index of the time series data is defined as one that is quantified by the level of the frequency of the time series waveform and the magnitude of the rise and fall of the time series waveform. That is, when the frequency of the time-series waveform is high or the rise / fall of the time-series waveform is large, the intensity is large, and conversely, the frequency of the time-series waveform is low or the rise / fall of the time-series waveform is high If the head is small, the intensity is small.
- the frequency value of the maximum power spectrum is set as the frequency of the data string, and normalized at a certain maximum frequency.
- the frequency of the data string is defined as the frequency intensity I freq (freq).
- the maximum value of the difference between the preceding and succeeding data is normalized with the difference of a certain maximum data, and the intensities due to the data difference are set as I
- a maximum value obtained by statistically calculating all the sensor data may be used. Not limited to this.
- the intensity of this data string is calculated by the following equation.
- a relational expression between the severity evaluation index and the sampling interval is separately obtained in advance through experiments and simulations (S404). As illustrated, the maximum value of the sampling interval is the sampling interval for data acquisition, and the minimum value is 1 second. There is an inverse relationship between the severity evaluation index and the sampling interval.
- the determination of the sensor data estimation time may be a predetermined interval, or may be determined at equal intervals so as to estimate the specified number.
- Sensor data estimation (calculation of estimated sensor data) in the sensor data estimation unit will be described with reference to FIGS. 5A, 5B, and 5C.
- the estimated sensor data is calculated in the form of weighted addition from acquired sensor data in the same acquired sensor data string and other acquired sensor data acquired at different times in the same designated sequence in the vicinity of the estimated sensor data.
- FIG. 5A shows a first example of sensor data estimation.
- the sensor data estimated value between the acquired sensor data is linearly calculated from the acquired sensor data on both sides thereof.
- y (x) is the estimated value of data that cannot be acquired
- y x is the acquired sensor data value
- the estimated sensor data is calculated nonlinearly using all the acquired sensor data in the same acquired sensor data string as the estimated sensor data.
- the estimated value y (x) of the sensor data is
- ⁇ is a weighting coefficient
- ⁇ is obtained from x that is high-dimensionally mapped as follows.
- the high-dimensional mapping function is a
- ⁇ is a coefficient determined by experience.
- ⁇ 1i and ⁇ 2i are weighting factors, and these are calculated from the variance of the peripheral acquisition sensor data.
- Sensor data estimation includes spline method and bicubic method. Either one of several methods may be used or switched. For example, a severity index is used for switching.
- FIG. 5C shows an example of correcting the step at the sampling point.
- the estimated line1 with respect stepped at a point x j of estimated line2, back and forth is provided a correction space 2l (sampling interval during 1 ⁇ data acquisition) of the sampling points, at x j + a l from the correction space x jl
- the two sensor data are linearly connected as in the correction curve y ′ (x). That is, by changing the vertical step generated at the boundary (joint) between the two estimated sensor data to an oblique step, the discontinuous connection such as the step is changed to a smooth connection.
- the example shown in FIG. 6A is a probability distribution G when the sensor data at each estimated time normally follows a normal distribution.
- the probability distribution G is represented by a Gaussian function, and is expressed by the following equation using the average ⁇ and standard deviation ⁇ of the sensor data at that time.
- the example shown in FIG. 6B is an example of the probability distribution G when the sensor data at each estimated time does not follow the normal distribution.
- approximation by a multi-Gaussian function may be performed. You may approximate with other functions.
- approximating with a multi-Gaussian function the following equation is obtained.
- FIG. 7B shows a likelihood histogram which is the extracted feature quantity.
- the sequence convergence time input in step S703 of FIG. 7A is targeted for sensor data that has been cut out to a default predetermined number when selecting “Do not perform automatic calculation” by user instruction when cutting out sensor data. This is obtained by determining the convergence of the sensor waveform.
- FIG. 8A shows a flow of processing for obtaining the convergence time.
- the extracted normal sampling sensor data is input (S801).
- partial sensor data is cut out by a window (S802), a convergence determination index is calculated (S803), and a convergence determination is performed (S804). If “No” is determined, the window is moved in the increasing direction (S805), and the convergence determination (S802 to S804) is repeated. If “Yes” is determined, the sensor data convergence time is output (S806). ).
- the time at which the sequence converges is the time when the sensor data of the sequence starts to converge to a constant value after the sequence starts, or the time when the sequence starts to oscillate around the constant value.
- An image showing the former convergence determination index is shown in FIG. 8B, and an image showing the latter convergence determination index is shown in FIG. 8C.
- FIG. 8B shows a convergence determination index in the case of convergence to a constant value.
- the convergence determination index is the slope of the first principal axis obtained by principal component analysis for sampling sensor data cut out by the window or the regression line obtained by linear regression.
- a constraint condition that the difference between the maximum value and the minimum value is less than or equal to a predetermined threshold is added and the convergence determination index is less than the predetermined threshold.
- the first time is the sequence convergence time.
- Fig. 8C shows the convergence judgment index of the case that vibrates around a certain value.
- the convergence determination index in this case is also the inclination of the first principal axis obtained by principal component analysis for sampling sensor data cut out by the window (the angle formed by the first principal axis with respect to the horizontal axis as shown in FIG. 8C). It is.
- the similarity is calculated, the fact that the similarity reaches a predetermined threshold or more is further added to the constraint condition, and the convergence determination index is smaller than the predetermined threshold
- the first time among the several times that have become is the sequence convergence time.
- GUI Next, a GUI used for performing each process will be described with reference to FIGS. 9A to 11B.
- FIGS. 9A and 9B show processing steps S101 (S121) for inputting event data and user instructions in the flowcharts shown in FIGS. 1B to 1D, processing steps S104 (S124) for inputting learning sensor data, and normal /
- the processing step S112 for inputting an abnormality instruction the processing step S111 (S111 ′) for outputting the normal space or the normal / abnormal identification boundary which is the output processing step of FIG. 1B or 1C, and the estimated time in the flowchart shown in FIG. 1E
- Processing step S138 for outputting, processing steps S211 and S218 for outputting the cut start / end time in the flowchart shown in FIG. 2B, processing step S409 for outputting the estimated time in the flowchart shown in FIG. 4, and FIG.
- FIG. 7A Processing step S705 for outputting the feature quantity in the flowchart, FIG. 8A GUI for processing step S806 for outputting the sensor data convergence time in the flow chart shown, processing step S131 for outputting the abnormality detection result in the flow chart shown in FIG. 1D, and display of abnormality detection test results and abnormality detection results. It is a related GUI.
- This GUI includes a panel 900 for displaying feature values, a sensor data, an index indicating normality / abnormality of sensor data, event data, a folder for storing a set of files for storing parameters, a reference button 9012, “Input folder” box 9011 for displaying the selected folder, normal space received from the S111 (S111 ′) processing step (normal / abnormal identification boundary), the estimated estimated time received from the S138 and S409 processing steps, S211 The cut start / end time received from the S218 processing step, the likelihood histogram which is the feature quantity received from the S705 processing step, the convergence time of the sensor waveform received from the S806 processing step, and although not shown, S107 (S127) Sensor data after estimation received from the processing step, S1 8 (S128) A “reference” button 9022 for selecting a folder for storing a set of files of the intermediate results such as the extracted statistical probability distribution received from the processing step and the abnormality detection result received from the S131 processing step, and the selected folder An “output
- a folder is selected in an “input folder” box 9011 and an “output folder” box 9021, a data period is registered in a “data period registration” box 908, an anomaly detection technique is selected in an “abnormality detection technique” selection box 904,
- the learning process shown in FIG. 1B or FIG. 1C and the data from the database 111 are pressed by pressing the “learning and abnormality detection test execution” button 906.
- the abnormality detection test process along the abnormality detection flow shown in FIG. 1D is executed. Once the button 906 is pressed, the “abnormality detection execution” button 907, the “abnormality detection result display” button 911, and the “intermediate result display” button 912 cannot be pressed until the abnormality detection test process is completed.
- the state is switched to a state where an “abnormality detection execution” button 907 can be pressed.
- the “abnormality detection result display” button 911 and the “intermediate result display” button 912 are switched to a state where they can be pressed.
- the period of the learning data or the abnormality detection test data is registered in the “display period” box 908, the “display item” box 909 and the “display format” box 910 are selected, and the “abnormality detection result display” button is selected.
- a button 912 or a “display intermediate result” button 912 an intermediate result in the display period or an abnormality detection result is displayed on the “display” panel 900.
- the “abnormality detection execution” button 907 is pressed.
- the data of the period registered in the “data period registration” box 903 is read from the storage medium for temporary data storage connected to the equipment 101 (not shown), and the abnormality is detected.
- the abnormality detection execution is completed, the period of the abnormality detection data is registered in the “display period” box 908, the “display item” box 909 and the “display format” box 910 are selected, the “abnormality detection result display” button 911, “ When an “intermediate result display” button 912 is pressed, an intermediate result of abnormality detection data in the display period or an abnormality detection result is displayed on the “display” panel 900.
- the execution progress is displayed in the “display” panel 900. For example, “Please set” is displayed first. As soon as the setting starts, it switches to “Setting in progress”.
- “learning and abnormality detection test execution” button 906 is pressed, “learning and abnormality detection test in progress” is displayed.
- FIG. 9A shows an example of GUI display according to the present embodiment.
- a feature amount 9001, an abnormal bar 9002, and display related items 9003 related to display are displayed on the display panel 900.
- the display related item 9003 includes the type of display data (whether it is an abnormality detection test result using data in a database or an abnormality detection result using data from equipment), a display period, and a result for obtaining this result.
- the learning period and evaluation period are displayed.
- An abnormal bar 9002 displays the position of an abnormal feature value in black.
- FIG. 9A is an example showing an abnormality detection test result using data from the database 111. Although not shown, it is also possible to show an abnormality detection result using data from the facility 101. If 3D is selected as the “display format”, the 3D feature quantity 9001 ′ shown in the “display” panel 900 of FIG. 9B is displayed.
- FIG. 10 relates to detailed settings for abnormality detection, and is a GUI that is called by pressing the “other setting” button 905 shown in FIG.
- This GUI calculates sensor data extraction start / end times in FIGS. 1B to 1D, and also relates to the setting of sensor data extraction processing step S105 (S125) and sensor data estimation step S107 (S127).
- the GUI includes a “sequence setting” area 1001, a “sensor data estimation setting” area 1002, a “data setting” area 1003, a “discriminator setting” area 1004, a “setting status list” display panel 1005, and a “save” button 1006. It is configured with.
- All items can be edited by pressing an “edit” button 10016 in the “sequence setting” area 1001.
- the edit items include “sequence type” and “sequence cutout”.
- “Sequence type” includes a box 10011 for selecting a sequence type
- “Sequence extraction” includes check boxes 100121 and 100123 for displaying “Yes” in the sequence extraction start / end time automatic calculation items
- the “sequence type” selection box 10011 the type of sequence to be detected for abnormality such as start and stop can be selected.
- “Sequence cutout” it is possible to decide whether to automatically calculate the start / end time.
- the respective “Yes” check boxes 100121 and 100123 are checked, and the usage indicators are selected in the indicator boxes 100122 and 100124.
- the use indicator selection box is left blank without checking the “Yes” check box. In this case, the default sequence extraction start / end times are used.
- FIG. 10 shows an example in which the activation sequence is input in the box 10011 for selecting the sequence type.
- the sequence extraction start / end times are not automatically calculated, each “Yes” is not checked, and the index selection box is left blank.
- the contents set in the “sequence setting” area 1001 are registered.
- all items can be edited by pressing the “edit” button 10026.
- the edit items include “estimation method”, “parameter”, and “estimation interval”.
- estimate boxes 100211, 100213, and 100215 for selecting a linear method, a nonlinear method, and a mixed method, and boxes 100212, 100214 for selecting further detailed methods corresponding to the respective classification methods, There is 100216.
- check one of the check boxes 100211, 100213, and 100215 for selecting a linear method, a nonlinear method, and a mixing method of the “estimation method”, and a method selection box 100212 corresponding to the check box. , 100214, 100216 can determine the estimation method.
- “Parameter” includes a selection box 100221 for selecting a parameter type, a box 100222 for inputting a specific number of the selected parameter, and the selection of one parameter type and numerical input, and then the next.
- the “estimated interval” includes a check box 100022 displayed when “specified” and a box 100233 for inputting an estimated interval when “specified” is checked. If you do not specify the estimated interval, do not check the “Specify” check box and do not enter the number of seconds after that. In this case, the estimated time is automatically determined based on the intensity of each sensor waveform using normal learning data. To specify, check the “Specify” checkbox and enter the number of seconds after that. Thereby, the estimated time is set at the designated number of seconds interval.
- the nonlinear method check box 100213 is checked, and the estimation method using the kernel is selected in the corresponding method selection box 100214.
- parameter 1 / parameter 2 is selected by “type” selection box 100221 of “parameter”, and numerical values of 5.0 and 10.0 are entered.
- the estimation interval is designated and the estimation interval is set to 1 second.
- the edit items include “learning / evaluation data separation designation” and “exclusion data”. Furthermore, in “learning / evaluation data separation designation”, a check box 100311 of “present”, and in the case of designation “present”, a box 100312 for inputting a learning data period, a box 100313 for inputting an evaluation data period, and designation In the case of “None”, there is a “None” check box 100321 and a box 100322 for inputting the number of folds of an evaluation method related to automatically dividing learning data / evaluation data. “Excluded data” includes a check box 10031 for “present” and a “data registration” box 10032 for registering data when “exist”.
- a check box 100311 for specifying learning / evaluation data separation is checked, and a specified period is entered in the learning data box and evaluation data boxes 100312 and 100313, respectively. Further, since there is no exclusion data, the “excluded data” “present” check box 10031 is not checked, and the “data registration” box 10032 is also blank. By pressing a “decision” button 10037, the contents set in the “data setting” area 1003 are registered.
- the edit items include “identifier type” and “detail item”. For each content, there is a “discriminator type” box 10041 and a “detail item” box 10042.
- the type of classifier can be selected. For example, there are support vector machines, Bayes classifiers, k-neighbor classifiers, neural networks, and the like.
- a detailed item corresponding to the classifier selected in the “classifier type” box 10041 can be selected. For example, one class or multiple classes can be selected for the class number of the classifier. When one class is selected, learning is performed along the processing flow of FIG. 1B during learning, and a normal space is obtained. On the other hand, when multiple classes are selected, learning is performed according to the processing flow of FIG. 1C during learning, and a normal / abnormal identification boundary is obtained.
- the classifier 1 is selected in the “classifier type” box 10041 and multi-class is selected in the “detailed item” box 10042. By pressing the “OK” button 10047, the contents set in the “identifier setting” area 1004 are registered.
- FIG. 11A and FIG. 11A and FIG. 11B show a GUI related to checking a statistical probability distribution at a certain time in a sensor model, a post-estimation measurement curve, a sensor model, and a sensor model, which are intermediate results obtained after learning, an abnormality detection test, and abnormality detection. 11B is used for explanation.
- the GUI shown in FIGS. 11A and 11B includes a “sensor setting” area 1101, a “display setting” area 1102, a “display” button 1103 for executing display, and a “display panel” area 1104. .
- the “sensor setting” 1101 has a “sensor type” item, and the type selection is performed by a selection box 11011.
- “Display setting” 1102 includes “display data date”, “display content”, and “probability distribution display”.
- the display data date is entered in the “display data date” box 11021.
- the table character content is selected by a “display content” selection box 110221. Further, a property of contents to be displayed is selected by “setting property” 110222 below the selection box.
- the “probability distribution display” includes a check box 110231 to be checked when “present” and a “setting property” 110232 for setting when “present”.
- FIG. 11A shows an example of displaying the pre- and post-estimation measurement curves.
- “pre-estimation & post-estimation measurement curve” is selected in the “display content” selection box 110221, and appropriate options are selected for other items, and the “display” button 1103 is pressed.
- a graph 1105 indicating the relationship between time and sensor value is displayed in the “display panel” area 1104.
- the data string 11051 before estimation is discrete, and the sensor waveform 11052 after estimation is continuous.
- setting items related to this graph are displayed in an area 11053.
- the display item contents include the contents set on the GUI described in FIG. 10, and include the sensor number of the multidimensional sensor, measurement contents, data acquisition time, data type (learning data or evaluation data, and whether from the database) From the equipment), convergence time, sensor data estimation method, parameter values used during estimation, estimated time interval type, estimated time interval, pre-estimated marker type, post-estimated curve type, etc. There is.
- the display of the area 11053 may be selected so that it is not displayed by right-clicking the mouse.
- FIG. 11A when “sensor model & post-estimation measurement curve” is selected in the “display content” selection box 110222, and an appropriate option is selected for other items, and the “display” button 1103 is pressed, an area 1104 is displayed.
- a graph 1106 indicating an estimated measurement curve for each sensor model as shown in 11B is displayed.
- an alternate long and short dash line 11061 is the average value curve ( ⁇ ) of the sensor model
- dotted lines 11062 and 11063 are the average value curve of the sensor model plus or minus three times the standard deviation ( ⁇ ⁇ 3 ⁇ )
- the solid line 11064 is the measurement curve after estimation. Represents.
- setting items related to this graphic are displayed in an area 11065.
- the display item contents indicate what kind of curve each line is.
- the display of the area 11065 may be selected so that it is not displayed by right-clicking the mouse.
- a statistical probability distribution 1107 at a specified time is displayed.
- the statistical probability distribution 1107 at a certain time displays a Gaussian curve 11071, observation data 11072, and items related to the statistical probability distribution in a region 11073.
- the display item content displayed in the area 11073 includes a sensor number, measurement content, elapsed time of the statistical probability distribution, a numerical value of an average value, a numerical value of a standard deviation, a probability value of the estimated value of observation data in the statistical probability distribution, and There is an abnormality.
- the display of the area 11073 may be selected so that it is not displayed by right-clicking the mouse.
Abstract
プラントなどの設備において、変化の激しいところにおけるセンサデータがそのところにおける統計確率的特性に基づいた特徴量を用いることで、異常検知が可能であるが、コストダウンのため長いサンプリング間隔のセンサデータしか取得していない場合、その激しい変化を十分キャッチできない、また、センサのサンプリング時刻が、シーケンスの開始と同期していない場合、異なる時間で取得した同じシーケンスのセンサデータに時間のずれが発生するため、激しいところにおける統計確率的特性を求めることができない。そこで、本発明では、取得できないセンサデータを推定することにより、監視したい時刻における統計確率的特性を算出し、その統計確率的特性に基づき、変化の激しいシーケンスの異常検知を行うようにした。これにより、変化の激しいシーケンスの異常検知が実現できるようになった。
Description
本発明は、プラントや設備などから出力される多次元時系列データをもとに、変化の激しい起動や停止シーケンス時の設備の不具合あるいはその兆候を早期に検知する、また、コストダウンのため、長くしたサンプリング間隔で取得できない激しい変化を復元してその変化の統計確率的特性を監視する設備状態監視方法及び設備状態監視装置に関する。
電力会社では、ガスタービンの廃熱などを利用して地域暖房用温水を供給したり、工場向けに高圧蒸気や低圧蒸気を供給したりしている。石油化学会社では、ガスタービンなどを電源設備として運転している。このようにガスタービンなどを用いた各種プラントや設備において、設備の不具合あるいはその兆候を検知する予防保全は、社会へのダメージを最小限に抑えるためにも極めて重要である。特に、起動や停止のような変化の激しいシーケンスにおいては、故障が多発し易いため、その期間中の異常を早期に検知することが重要である。
ガスタービンや蒸気タービンのみならず、水力発電所での水車、原子力発電所の原子炉、風力発電所の風車、航空機や重機のエンジン、鉄道車両や軌道、エスカレータ、エレベータ、また、切削、穴開けなどの加工装置は、不良発生を防ぐため、そのパフォーマンスに異常があれば、ただちに検知することが要求されている。
このため、対象設備やプラントに複数のセンサを取り付け、センサ毎の監視基準に従って正常か異常かの自動判別が行われている。
設備あるいは製造装置や計測装置を対象とした通常運転時の異常検知に有効である一例は特許文献1(特開2011-070635号)に開示されている。特許文献1の開示例においては、設備の多次元センサデータを特徴空間へ写像し、特徴空間で正常モデルを作成してから、新たに入力されたセンサデータが正常モデルへの投影距離を異常測度とし、その異常測度の所定閾値を越えたかどうかによって異常検知を行っている。
また、時系列センサデータの統計確率的特性を同時に監視可能な統計確率的特性を表すパラメータを算出しながら、異常検知する代表的な手法として、非特許文献1および非特許文献2に開示されている方法がある。この方法では、直接にセンサ波形から時刻毎に算出した統計確率的なパラメータを用い、正常モデルを作成し、そのモデルからの離れ度合いを用いて異常を検知する。
センサモデルと投票に基づく発電機の異常検知の検討、情報科学技術フォーラム講演論文集8(3)、139-142、2009
尤度ヒストグラムに基づく異常検出、パターン認識・メディア理解研究会(PRMU)、2011
特許文献1に開示されている技術は、変化の激しい起動や停止シーケンス時、あるいは、負荷変動の大きい加工装置に発生する異常を予兆検知するのが困難である。図12に運転モードの違いによる特徴空間上における特許文献1に記載の方法による局所空間の変化を示す。図からわかるように、(a)の定常運転時の場合、取得した正常センサデータのデータ値は同じレベルであるため、特徴空間上においては、正常なセンサデータから作られた正常な局所空間が小さく、異常が発生する場合に、異常データが正常局所空間から大きく離れ、識別されやすい。
一方、変化の激しいシーケンス、例えば、(b)起動シーケンスの場合に、取得した正常センサデータのデータ値の変化は大きいため、特徴空間上において、正常なセンサデータから作られた正常な局所空間が定常運転時より大きく広がっており、シーケンス期間中、異常が発生する場合に、特徴空間上において異常データが正常な局所空間にあり、異常として検知されることは困難である。
また、非特許文献1および非特許文献2に開示された方法によれば、時刻毎に異常度を算出するため、変化が激しい場合のシーケンスの異常を検知できる。しかし、プラントなどの設備において、コストダウンのため、長いサンプリング間隔のセンサデータしか取得していない場合に、その激しい変化を十分にキャッチできない。また、センサのサンプリング時刻が、シーケンスの開始と同期していない場合、異なる時間で取得した同じシーケンスのセンサデータに時間ずれが発生する。また、多次元センサを同期してデータを取得できない場合に、センサ間のセンサデータにも時間ずれが発生する。このため、上記に示した非特許文献1および非特許文献2に開示されている技術は、時刻毎での統計確率的なパラメータを算出できず、異常検知を行うことができない。
そこで、本発明では、上記した従来技術の課題を解決し、変化の激しい起動や停止シーケンスに対しても、その激しい変化およびその変化の統計確率的特性を監視しながら、異常を検知可能な異常検知方法を備えた設備状態監視方法および設備状態監視装置を提供するものである。
上記課題を解決するために、本発明は、プラント又は設備の異常を検知する方法を、プラント又は設備に取り付けたセンサから間欠的に出力されたセンサ信号及び該センサ信号と同じ期間における前記プラント又は設備の起動シーケンス又は停止シーケンスの開始および終了に対応するイベント信号を入力し、該入力したセンサ信号のうち前記起動シーケンス又は終了シーケンスの開始のイベント信号と終了のイベント信号との間の区間に対応するセンサ信号を切り出し、該切り出したセンサ信号のある時刻における信号値とその確率分布を推定し、該推定した確率分布に基づいて特徴量を抽出し、該抽出した特徴量に基づいて前記プラント又は設備の異常を検知するようにした。
又、上記課題を解決するために、本発明では、プラント又は設備の異常を検知する装置を、プラント又は設備に取り付けたセンサから間欠的に出力されたセンサ信号及び該センサ信号と同じ期間における前記プラント又は設備の起動シーケンス又は停止シーケンスの開始および終了に対応するイベント信号を入力し、該入力したセンサ信号のうち前記起動シーケンス又は終了シーケンスの開始のイベント信号と終了のイベント信号との間の区間に対応するセンサ信号を切り出し、該切り出したセンサ信号を前記起動シーケンス又は終了シーケンスの開始のイベント信号を起点とした時間に合わせる処理を行うデータ前処理部と、該データ前処理部で処理したセンサ信号のある時刻における信号値とその確率分布を推定する確率分布推定部と、該確率分布推定部で推定した確率分布に基づいて特徴量を抽出する特徴量抽出部と、該特徴量抽出部で抽出した特徴量に基づいて前記プラント又は設備の異常を検出する異常検出部と、入出力する情報を表示する画面を有して前記異常検出部で検出した前記プラント又は設備の異常に関する情報を前記画面上に表示する入出力部とを備えて構成した。
本発明によれば、変化の激しいところで機器制限のため取得できないセンサデータを密に推定することによって、そこに発生する異常を捕らえることを可能にしたため、変化の激しいシーケンス時に発生する異常を検知できるようになった。
さらに本発明によれば、取得できないセンサデータを推定することにより、センサのサンプリング時刻が、シーケンスの開始と同期していない場合に発生する異なる時間で取得した同じシーケンスのセンサデータ間にある時間ずれ、および多次元センサを同期してデータを取得できない場合に発生する異なるセンサのセンサデータ間にある時間ずれを解消することを可能にしたため、シーケンス期間中の任意の時刻におけるセンサ波形の統計確率的特性を監視することができるようになった。
以上により、ガスタービンや蒸気タービンなどの設備のみならず、水力発電所での水車、原子力発電所の原子炉、風力発電所の風車、航空機や重機のエンジン、鉄道車両や軌道、エスカレータ、エレベータ、そして機器・部品レベルでは、搭載電池の劣化・寿命など、種々の設備・部品において高感度な異常検知および容易な異常説明を両立するシステムが実現できるようになった。
本発明では、プラントなどの設備において、変化の激しい起動時や停止時のシーケンスを実行しているときに発生する設備の不具合或いはその兆候を検知する設備状態監視方法及び設備状態監視装置に関するもので、シーケンスの開始時刻を合わせ、間欠的に出力されたセンサデータの推定時刻を決定し、その時刻におけるセンサデータを推定することにより、時系列推移を考慮した時刻ごとの確率分布に基づいて異常検知を行うものである。
以下に、本発明の実施例を、図を用いて説明する。
以下に、本発明の実施例を、図を用いて説明する。
図1Aに、本実施例における設備状態監視方法を実現するシステムの一構成例を示す。
本システムは、設備101から、または、データベース111から出力されるサンプリングセンサデータ1002とイベントデータ1001およびユーザからのユーザ指示1003を受けて異常を検知する異常検知システム10、途中結果や異常検知結果を記憶する記憶媒体11、および途中結果や異常検知結果を表示する表示装置12を備えて構成される。
本システムは、設備101から、または、データベース111から出力されるサンプリングセンサデータ1002とイベントデータ1001およびユーザからのユーザ指示1003を受けて異常を検知する異常検知システム10、途中結果や異常検知結果を記憶する記憶媒体11、および途中結果や異常検知結果を表示する表示装置12を備えて構成される。
また、異常検知システム10は、データを処理するデータ前処理部102、データベース111からのセンサデータ1002およびイベントデータ1001をデータ前処理部102にて処理した後、センサデータ推定時刻を決定する推定時刻決定部112、そして、設備101からのセンサデータ1002およびイベントデータ1001をデータ前処理部102にて処理した後、センサデータ推定時刻決定部112にて決定された時刻におけるセンサデータを推定するセンサデータ推定部103、さらにその時刻において統計確率分布推定を行う統計確率分布推定部104、統計確率分布を用いて特徴量を抽出する特徴量抽出部105、特徴量抽出部105で抽出された特徴量を用いて学習する学習部113、学習後に学習部113から出力される正常空間あるいは識別境界1004を用いて異常を検知する異常検知部106を備えて構成される。
さらに、データ前処理部102は、イベントデータ1001からユーザが指定したシーケンスの開始時刻を探索するイベントデータ解析部1021、指定シーケンスの開始時刻の情報を用いて受け取ったセンサデータ1002からセンササンプリングデータを切出すための開始・終了時刻を算出してセンサデータ1002の切出しを行うセンサデータ切出し部1022、切出したセンサデータの時刻を合わせるセンサデータ時刻合わせ部1023を備えている。
また、学習部113、識別境界1004、及び異常検知部106で、識別部107(107´)を構成している。
本システムの動作には、データベース111に蓄積されたデータを用いてセンサデータ推定時刻を決定する「推定時刻決定」フェーズ、蓄積されたデータを用いて異常検知に用いる正常空間あるいは識別境界1004を決定する「学習」フェーズ、推定時刻において補正を実施した後の入力センサデータと正常空間あるいは識別境界に基づき実際に異常検知を行う「異常検知」フェーズの三つのフェーズがある。基本的に、前の二つのフェーズ「推定時刻決定」フェーズと「学習」フェーズとはオフラインの処理、最後の三つ目のフェーズ「異常検知」はオンラインの処理である。ただし、「異常検知」をオフラインの処理とすることも可能である。以下の説明では、それらを「推定時刻決定時」、「学習時」、「異常検知時」という言葉で区別する。
また、図1Aにおける実線の矢印100は「異常検知」フェーズにおけるデータの流れを示す「異常検知」パス、点線の矢印100’は「学習」フェーズにおけるデータの流れを示す「学習」パス、破線の矢印100”は「推定時刻決定」フェーズにおけるデータの流れを示す「推定時刻決定」パスである。
状態監視の対象とする設備101は、ガスタービンや蒸気タービンなどの設備やプラントである。設備101は、その状態を表すセンサデータ1002とイベントデータ1001を出力する。
本実施例においては、先ずオフラインで「推定時刻決定」フェーズの処理を行い、次に、「推定時刻決定」フェーズの処理の結果を用いてオフラインで「学習」フェーズの処理を行う。そして、「推定時刻決定」フェーズの処理の結果と「学習」フェーズの結果を用いて、オンライン処理による「異常検知」フェーズを実行する。
センサデータ1002は、設備101に取り付けられた複数のセンサから、一定間隔毎に取得される多次元時系列データである。センサの種類は、設備やプラントの大きさにもよるが、数百から数千と言った数になる場合もあり、例えば、シリンダ、オイル、冷却水などの温度、オイルや冷却水の圧力、軸の回転速度、室温、運転時間などである。出力や状態を表すのみならず、何かをある値に制御するための制御データの場合もある。
「推定時刻決定時」における処理の流れについて、図1Eを用いて説明する。本処理は、「推定時刻決定」パス100”に沿ってデータベース111から抽出されたイベントデータ1001とセンサデータ1002とを用いて実施する。
具体的には、データ前処理部102のイベントデータ解析部1021にて、データベース111から出力されたイベントデータ1001およびユーザ指示1003を入力し(S131)、ユーザ指示1003により指定されたシーケンスの開始時刻を入力したイベントデータ1001の中から探索する(S132)。
一方、センサデータ切出し部1022にて、データベース111から出力されたセンサデータ1002を入力し(S134)、イベントデータ解析部1021から得られたシーケンス開始時刻に対応するセンサデータ切出し開始・終了時刻を算出し、データベース111から入力したセンサデータ1002からセンサデータを切出す(S135)。
次に、切り出されたセンサデータは、センサデータ時刻合わせ部1023に送られ、センサデータ時刻合わせ部1023において時刻合わせが行われ(S136)、推定時刻決定部112に送られてセンサデータ推定時刻が決定され(S137)、この決定された推定時刻が保存または出力される(S138)。
「学習時」の処理の流れについて、図1Bと図1Cを用いて説明する。本処理は「推定時刻決定」パス100’に沿ってデータベース111から抽出されたイベントデータ1001とセンサデータ1002とを用いて実施する。
図1Bに示しているのは1クラス識別器107を利用する場合の学習、図1Cに示しているのは多クラス識別器107´を利用する場合の学習である。
図1Bまたは図1Cにおいて、まず、イベントデータ解析部1021は、データベース111から出力されたイベントデータ1001およびユーザ指示1003を入力し(S101)、ユーザ指示1003により指定されたシーケンスの開始時刻を入力したイベントデータ1001の中から探索する(S102)。
一方、センサデータ切出し部1022は、データベース111から出力されたセンサデータ1002を入力し(S104)、イベントデータ解析部1021から得られたシーケンス開始時刻に対応するセンサデータ切出し開始・終了時刻を算出し、データベース111から入力したセンサデータ1002からセンサデータを切出す(S105)。この切り出されたセンサデータは、センサデータ時刻合わせ部1023にて、時刻合わせが行われる(S106)。
次に、得られた時刻合わせ後のセンサデータを用いて学習を行う。推定時刻決定部112から出力されたセンサデータ推定時刻をセンサデータ推定部103へ入力し(S103)、センサデータ推定部103にて入力したセンサデータ推定時刻の情報に基づいてセンサデータの時刻を推定する(S107)。次に、統計確率分布推定部104にて、時刻が推定されたセンサデータの統計確率分布を推定し(S108)、推定された統計確率分布に基づき特徴量抽出部105にて推定したセンサデータの特徴量を抽出する(S109)。
流れの最後に、図1Bの1クラスの識別器107を利用する場合には、特徴量抽出部105で抽出したセンサデータの特徴量を用い、識別器107の学習部113で学習をすることにより正常空間を作り(S110)、この作った正常空間を出力する(S111)。
一方、図1Cの多クラスの識別器107´を利用する場合、ユーザ指示1003によってデータベース111から読み込んだセンサデータの正常か異常かのインディックスがあるファイルを入力してセンサデータが正常か異常かを教示し(S112)、その後、特徴量抽出部105で抽出した特徴量を用い、識別器107´の学習部113で学習をすることにより正常か異常かを識別する識別境界1004を決定し(S110’)、この決定した識別境界1004を出力する(S111’)。
次に、新たに観測されたセンサデータの「異常検知時」の処理の流れについて、図1Dを用いて説明する。本処理は「異常検知」パス100に沿って設備101から抽出されたイベントデータ1001とセンサデータ1002とを用いて実施する。まず初めに、イベントデータ解析部1021は、設備101から出力されたイベントデータ1001およびユーザ指示1003を入力し(S121)、ユーザにより指定されたシーケンスの開始時刻を探索する(S122)。
一方、センサデータ切出し部1022は、設備101から出力されたセンサデータ1002を入力し(S124)、イベントデータ解析部1021から得られたシーケンス開始時刻に対応するセンサデータ切出し開始終了時刻を算出し、センサデータを切出し(S125)、センサデータ時刻合わせ部1023にて、時刻合わせを行う(S126)。
次に、学習時予め推定時刻決定部112にて決定して保存しておいたセンサデータ推定時刻をセンサデータ推定部103に入力し(S123)、センサデータ推定部103にて推定時刻決定部112から入力したセンサデータ推定時刻においてセンサデータ時刻合わせ部1023から入力した時刻合わせしたセンサデータについてセンサデータ推定を行い(S127)、統計確率分布推定部104にて推定したセンサデータの統計確率分布を推定し(S128)、推定された統計確率分布に基づき特徴量抽出部105にて特徴量を抽出する(S129)。
最後に、特徴量抽出部105で抽出した特徴量を用い、識別器107(107´)において学習部113で作成した正常空間又は識別境界1004を用いて異常検知部106で異常識別を行い (S130)、検知結果を出力・表示する(S131)。
次に、図1Aに示した各部の動作について順に詳細に説明する。すなわち、センサデータ切出し部1022における切出し開始・終了時刻の決定、センサデータ時刻合わせ部1023におけるセンサデータの時刻合わせ、推定時刻決定部112におけるセンサデータ推定時刻の決定、センサデータ推定部103におけるセンサデータの推定、統計確率分布推定部104における確率分布の推定、特徴量抽出部105における特徴量抽出について、図2Aないし図8Cを用いて、詳しく説明する。
[切出し開始・終了時刻の決定]
センサデータ切出し部1022において、まず、センサデータ切出し開始・終了時刻を算出し、そして、その切出し開始・終了時刻を用いて、その間にあるセンサデータを切出す。
センサデータ切出し部1022において、まず、センサデータ切出し開始・終了時刻を算出し、そして、その切出し開始・終了時刻を用いて、その間にあるセンサデータを切出す。
図2Aは取得したセンサ波形における切出し開始・終了時のイメージを示す図である。図2Aの(a)と(b)の例は、切出しを開始してから終了するまでの間にセンサ波形の立ち上がりと下がりとの両方を含み、開始・終了時におけるセンサデータ値は同じレベルとなるものである。(a)の例では、立ち上がりと下がりの間でセンサ波形は滑らかに変化しているのに対し、(b)の例では、立ち上がりと下がりの間で波形がギザギザとなっている。また(c)の起動シーケンスのみがある例、あるいる(d)の停止シーケンスのみがある例は、切出し開始・終了時のセンサデータ値が別々のレベルになるものである。
次に、図2Bおよび図2Cを用いてセンサデータ切出しを行うため切出し開始・終了時刻を算出する処理の流れおよび切出し開始・終了判定指標について説明する。
図2Bはセンサデータ切出し開始・終了判定の流れを示す図である。センサデータ切出し部1022は、まず、ユーザ指示1003を入力し(S201)、ユーザ指示により、モード(開始or終了)の算出は自動か非自動かを決定する(S202)。次に、イベントデータ解析部1021から得られた指定シーケンスの開始時刻を入力する(S203)。また、設備101、あるいは、データベース111から出力されたセンサデータ1002を入力する(S204)。S203からの指定シーケンスの開始時刻、S204からのセンサデータ、S202からの開始モードの自動か非自動かの決定結果を受け、切出し開始時刻の計算を開始する(S205)。
切出し開始時刻の計算は自動的に実施する場合に、窓で一部センサデータを切出し(S206)、開始判定指標を算出し(S207)、開始判定を行い(S208)、「No」と判定された場合、時刻が増大方向へ窓を移動し(S209)、開始判定(S206~S208)を繰り返す。「Yes」と判定された場合、センサデータ切出し開始時刻を出力・保存する(S211)。
一方、自動算出を実施しない場合には、指定シーケンスの開始時刻をセンサデータ切出し開始時刻とし(S210)、センサデータ切出し開始時刻を出力する(S211)。
センサデータ切出し開始時刻を算出した後、センサデータ切出し終了時刻の計算を実施する。センサデータ切出し終了時刻の計算は、S211からの切出し開始時刻、S202から終了モードの自動か非自動かの決定結果を受け、切出し終了時刻の計算を開始する(S212)。
切出し終了時刻の計算を自動的に実施する場合には、切出し開始時刻以後のセンサデータを対象とし、窓で一部切出し(S213)、終了判定指標を算出し(S214)、終了判定を行い(S215)、「No」と判定された場合、時刻が増大方向へ窓を移動し(S216)、終了判定(S213~S215)を繰り返す。「Yes」と判定された場合、センサデータ切出し終了時刻を出力・保存する(S218)。
一方、自動算出を実施しない場合には、センサデータ切出し開始時刻以降の所定センサデータ数の時刻をセンサデータ切出し終了時刻とし(S217)、センサデータ切出し終了時刻を出力する(S218)。
開始・終了判定指標について、図2Cに一例を示す。この例では、前後の2個のセンサデータを直線で繋ぎ、その直線の傾きを開始・終了判定指標とする。指標が所定閾値より大きくなったところの時刻をセンサデータ切出し開始時刻とする。また、指標が所定閾値より小さくなったところの時刻をセンサデータ切出し終了時刻とする。
[センサデータの時刻合わせ]
センサデータの時刻合わせ部1023での処理は、センサデータ切出し部1022から得られた切出し開始時刻を用いて行われる。
センサデータの時刻合わせ部1023での処理は、センサデータ切出し部1022から得られた切出し開始時刻を用いて行われる。
イベントデータ1001の例を図3Aに示す。イベントデータ1001は、不定期に出力される設備の操作・故障・警告を表す信号であり、時刻と操作・故障・警告を表すユニークなコードとメッセージ文字列からなる。例えば、起動シーケンスの開始時および停止シーケンスの開始時に対応しているメッセージ文字列はそれぞれ「Request module on」および「Request module off」である。また、イベントデータ1001において、同じ指定シーケンスが異なる時間で行われるため、その開始時刻は複数個ある。
センサデータ時刻合わせ部1023で実行するイベントデータ1001を用いてセンサデータ1002の時刻合わせ処理の第一の例を図3Bに示す。図には、(a)時刻合わせ前のセンサデータと(b)時刻合わせ後のセンサデータを示す。図示の(a)のように、異なる時間で取得した同指定シーケンスのセンサデータを算出したそれぞれの切出し開始時刻で経過時刻を算出し、(b)に示すように、ゼロ時刻を合わせるように切出したセンサデータを同一時間軸上に時刻を合わせる。開始時刻からの経過時間の時間間隔は一定間隔ではなくてもよい。または、一番短い時間間隔に合わせて一定間隔にしてもよい。(b)の表において、時刻合わせ後のセンサデータの一覧に、表示されている数字は取得したセンサデータ、空白となっているのは取得できないセンサデータである。
センサデータ時刻合わせ部1023で実行するイベントデータ1001を用いたセンサデータの時刻合わせ処理の第二の例を図3Cに示す。本例では、図示のように、(b)の修正センサデータ列の切出し開始時刻ts、correctと切出し終了時刻te、correctを(a)の参照センサデータ列の切出し開始時刻ts、refと切出し終了時刻te、ref合わせるように、参照センサデータ列の時間間隔Δtrefから、(b)の修正センサデータ列の時間間隔Δt’correctを

により変更して、(c)の時刻合わせ後の修正センサデータ列を得る。
[センサデータ推定時刻の決定]
推定時刻決定部(112)で行われるセンサデータ推定時刻の決定処理の流れを、図4を用いて説明する。データベース111からの学習用正常なセンサデータをデータ前処理部102で処理して得られた時刻合わせた後のセンサデータ列をセンサデータの推定時刻決定部112に入力し(S401)、窓(ウィンドウ)で一部センサデータを切出し(S402)、激しさ評価指標を算出し(S403)、激しさ評価指標とサンプリング間隔との関係式を用いて激しさ評価指標からサンプリング間隔を算出し(S405)、終了するかとの判定を行う(S406)。「No」と判定された場合、時刻が増大方向へ窓を移動し(S407)、センサデータの激しさ算出からサンプリング間隔を算出する処理 (S402~S405)を繰り返す。「Yes」と判定された場合、サンプリング間隔を用いて窓内の推定時刻を算出し(S408)、推定時刻を保存・出力する(S409)。
推定時刻決定部(112)で行われるセンサデータ推定時刻の決定処理の流れを、図4を用いて説明する。データベース111からの学習用正常なセンサデータをデータ前処理部102で処理して得られた時刻合わせた後のセンサデータ列をセンサデータの推定時刻決定部112に入力し(S401)、窓(ウィンドウ)で一部センサデータを切出し(S402)、激しさ評価指標を算出し(S403)、激しさ評価指標とサンプリング間隔との関係式を用いて激しさ評価指標からサンプリング間隔を算出し(S405)、終了するかとの判定を行う(S406)。「No」と判定された場合、時刻が増大方向へ窓を移動し(S407)、センサデータの激しさ算出からサンプリング間隔を算出する処理 (S402~S405)を繰り返す。「Yes」と判定された場合、サンプリング間隔を用いて窓内の推定時刻を算出し(S408)、推定時刻を保存・出力する(S409)。
本発明では、時系列データの激しさ評価指標は、時系列波形の周波数の高低、および、時系列波形の上昇・降下の落差の大きさにより定量化されるものとして定義する。すなわち、時系列波形の周波数が高い、または、時系列波形の上昇・降下の落差が大きい場合、激しさが大きい、逆に、時系列波形の周波数が低い、または、時系列波形の上昇・降下の落差が小さい場合、激しさが小さい。
具体的に、例えば、窓で切出した一部のデータに対し、フーリエ解析を行い、パワースペクトルを計算し、最大パワースペクトルの周波数値をそのデータ列の周波数とし、ある最大周波数で正規化されたデータ列の周波数を周波数による激しさIfreq(freq)とする。同じデータに対し、前後データの差分の最大値に対し、ある最大データの差分で正規化してデータの差分による激しI|Δy|(|Δy|)とする。ある周波数やあるデータの差分は、例えば、すべてのセンサデータに対して統計的に計算して得られた最大値を利用しても良い。これに限らない。また、次に、このデータ列の激しさは、下式で計算される。
激しさ評価指標はその他の定義を使っても良い。
激しさ評価指標とサンプリング間隔との関係式は別途に予め実験やシミュレーションを通して求めておく(S404)。図示のように、サンプリング間隔の最大値はデータ取得のサンプリング間隔であり、最小値は1秒である。激しさ評価指標とサンプリング間隔との間には反比例の関係を持つ。
激しさ評価指標とサンプリング間隔との関係式は別途に予め実験やシミュレーションを通して求めておく(S404)。図示のように、サンプリング間隔の最大値はデータ取得のサンプリング間隔であり、最小値は1秒である。激しさ評価指標とサンプリング間隔との間には反比例の関係を持つ。
センサデータ推定時刻の決定は予め決められた一定間隔でも良く、指定した個数推定するよう等間隔に決めても良い。
以上のように、センサデータ推定時刻の決定を行うことにより、処理コストをダウンし、高効率に処理を実施することが可能となる。
[センサデータの推定]
センサデータ推定部でのセンサデータの推定(推定センサデータの算出)について、図5A、図5Bと図5Cを用いて説明する。推定センサデータは同じ取得センサデータ列の取得センサデータおよび推定センサデータの近傍における同指定シーケンスの異なる時間で取得した他の取得センサデータから重み付き加算の形で算出される。
センサデータ推定部でのセンサデータの推定(推定センサデータの算出)について、図5A、図5Bと図5Cを用いて説明する。推定センサデータは同じ取得センサデータ列の取得センサデータおよび推定センサデータの近傍における同指定シーケンスの異なる時間で取得した他の取得センサデータから重み付き加算の形で算出される。
図5Aはセンサデータ推定の第一の例を示す。第一の例では、各取得センサデータ間のセンサデータ推定値はその両側にある取得センサデータから線形的に算出される。y(x)は取得できないデータの推定値、yxは取得したセンサデータ値、jは時刻合わせた後データが0秒から取得時のサンプリング間隔でカウントしたサンプリング番号(j=1~n)、iは異なる時間で取得した同じ指定シーケンスの番号(i=1~m)とすると、y(x)は

により算出される。
また、図5Bで示す第二の例では、推定センサデータと同じ取得センサデータ列のすべての取得センサデータを用いて非線形的に推定センサデータを算出する。センサデータの推定値y(x)は、

と表わされる。ここで、αは重み係数であり、αは下記のように高次元写像されたxにより求められる。

高次元写像関数は下式

を用いる。λは経験により決めた係数である。
また、β1iとβ2iは重み係数であり、これらは周辺取得センサデータの分散から計算される。
センサデータの推定には、スプライン法やバイキュービック法等もある。いくつかの手法のどちらか一方を使っても良いし、切り替えても良い。切り替えには、例えば激しさ指標を使う。
取得センサデータで区切られたそれぞれの区間におけるセンサデータを推定する際に、用いられる手法が異なる場合に、手法の切り替わるところにおいて、垂直な段差のようなデータのずれが発生する。
図5Cはサンプリング点における段差を補正する一例を示す。この例では、推定line1と推定line2の点xj における段差に対し、サンプリング点の前後に補正スペース2l (1≦データ取得時のサンプリング間隔)を設け、補正スペースxj-l からxj+l 内で、補正曲線y´(x)ように二つのセンサデータを線形的につなげる。すなわち、推定した二つのセンサデータの境界(繋ぎ目)に発生する垂直な段差を斜めの段差に変更することによって、段差のような不連続な繋がりから、滑らかな繋がりにすることである。
このように、補正スペース内での補正センサデータy’ (x) は下式で求められる。
重み係数w(x) は

により計算される。
以上のように、センサデータ推定を行うことにより、機器制限のために取得できないデータを推定し、特に、実際にデータを取得できないシーケンスの激しい変化を再現することが可能となる。
[統計確率分布の推定]
統計確率分布推定部104における統計確率分布の推定について、各推定時刻において、複数の同指定シーケンスの異なる時間で取得したセンサデータの推定後の値を用い、各推定時刻における確率分布の推定方法について、図6Aと図6Bを用いて説明する。
統計確率分布推定部104における統計確率分布の推定について、各推定時刻において、複数の同指定シーケンスの異なる時間で取得したセンサデータの推定後の値を用い、各推定時刻における確率分布の推定方法について、図6Aと図6Bを用いて説明する。
図6Aに示している例は、通常に各推定時刻におけるセンサデータが正規分布に従う場合の確率分布Gである。この場合に、確率分布Gはガウス関数で表され、その時刻におけるセンサデータの平均μと標準偏差σを用いて下式のようになる。

一方、図6Bに示した例は、各推定時刻におけるセンサデータが正規分布に従わない場合の確率分布Gの一例である。この場合に、例えば、マルチガウス関数で近似しても良い。その他の関数で近似しても良い。マルチガウス関数で近似する場合には、下式のようになる。

以上の統計確率分布Gの推定により、各時刻におけるセンサデータの分布状況を把握することが可能となる。また、各時刻における新たに観測されたセンサデータについて、正常・異常の割合がどのぐらいあるかを見て確認することが可能となる。
[特徴量抽出]
特徴量抽出部105で実施する特徴量抽出処理の流れを図7Aを用いて説明する。まず、統計確率分布推定部104からの各推定時刻における統計確率分布Gを入力する(S701)。
特徴量抽出部105で実施する特徴量抽出処理の流れを図7Aを用いて説明する。まず、統計確率分布推定部104からの各推定時刻における統計確率分布Gを入力する(S701)。
次に、各推定時刻における統計確率分布Gを用いてその時刻の異常度v(t)を(数10)を用いて算出する(S702)。

そして、後で説明する特徴量抽出部105において実施するセンサ波形の収束判定から得られたシーケンス収束時刻を入力し(S703)、センサデータの開始時刻からシーケンスの収束時刻まで(数11)で累積することで特徴量である尤度を算出する(S704)。

すべてのセンサに対し、S701~S703を実施し、最後に、すべてのセンサの尤度を統合すれば、(数12)で表す尤度ヒストグラムが得られる。添字s1~snはセンサ番号である。

図7Bには抽出した特徴量である尤度ヒストグラムを示す。
図7Aの処理S703にて入力したシーケンス収束時刻は、センサデータを切出す時に、ユーザ指示により「自動算出を実施しない」ことを選択した際、デフォルトの所定数まで切出したセンサデータを対象として、センサ波形の収束判定を行うことにより求めたものである。
図7Aの処理S703にて入力したシーケンス収束時刻は、センサデータを切出す時に、ユーザ指示により「自動算出を実施しない」ことを選択した際、デフォルトの所定数まで切出したセンサデータを対象として、センサ波形の収束判定を行うことにより求めたものである。
図8Aには、その収束時刻を求める処理の流れを示す。まず、切出した正常サンプリングセンサデータを入力する(S801)。次に、窓で一部センサデータを切出し(S802)、収束判定指標を算出し(S803)、収束判定を行う(S804)。「No」と判定された場合、時刻が増大方向へ窓を移動し(S805)、収束判定(S802~S804)を繰り返し、「Yes」と判定された場合、センサデータ収束時刻を出力する(S806)。
シーケンス収束時とは、シーケンスが開始してから、該シーケンスのセンサデータが一定値に収束し始める時刻、あるいは、一定値を中心に振動し始める時刻のことである。前者の収束判定指標を示すイメージは図8Bとなり、後者の収束判定指標を示すイメージは図8Cとなる。
図8Bに一定値に収束するケースの収束判定指標を示す。収束判定指標は窓で切出したサンプリングセンサデータを対象とする主成分分析により得られた第一主軸、あるいは線形回帰により得られた回帰直線の傾きである。また、最後の一部のサンプリングデータの[最小値、最大値]範囲内に到達し、最大値と最小値との差分が所定閾値以下との制約条件を加え、収束判定指標が所定の閾値より小さいいくつかの時刻のうち、最初の時刻はシーケンス収束時刻とする。
図8Cに一定値を中心に振動するケースの収束判定指標を示す。この場合の収束判定指標も窓で切出したサンプリングセンサデータを対象とする主成分分析により得られた第一主軸の傾き(図8Cに示したように、第一主軸が水平軸とのなす角度)である。また、最後の一部のサンプリングデータの頂点に余弦波で合わせた後、類似度を算出し、類似度が所定閾値以上に達することを制約条件にさらに加え、収束判定指標が所定の閾値より小さくなったいくつかの時刻のうち、最初の時刻をシーケンス収束時刻とする。
[GUI]
次に、各処理をすることにあたって使用するGUIについて、図9Aないし図11Bを用いて説明する。
次に、各処理をすることにあたって使用するGUIについて、図9Aないし図11Bを用いて説明する。
図9A及び図9Bは、図1B~Dに示したフロー図におけるイベントデータおよびユーザ指示を入力する処理ステップS101(S121)、学習センサデータを入力する処理ステップS104(S124)、図1Cにおける正常・異常指示を入力する処理ステップS112、図1B又は図1Cの出力処理ステップである正常空間あるいは正常・異常識別境界を出力する処理ステップS111(S111’)、図1Eに示したフロー図における推定時刻を出力する処理ステップS138、図2Bに示したフロー図における切出し開始・終了時刻を出力する処理ステップS211、S218、図4に示したフロー図における推定時刻を出力する処理ステップS409、図7Aに示したフロー図における特徴量を出力する処理ステップS705、図8Aに示したフロー図におけるセンサデータ収束時刻を出力する処理ステップS806、図1Dに示したフロー図における異常検知結果を出力する処理ステップS131に係わるGUI、また、異常検知テスト結果や異常検知結果の表示に係わるGUIである。
本GUIは、特徴量を表示するパネル900、センサデータ、センサデータの正常異常を示すインディクス、イベントデータ、パラメータ等を保存するファイル一式を格納するフォルダを選択するための「参照」ボタン9012、選択したフォルダを表示するための「入力フォルダ」ボックス9011、S111(S111’)処理ステップから受けた正常空間(正常・異常識別境界)、S138とS409処理ステップから受けた決定した推定時刻、S211とS218処理ステップから受けた切出し開始・終了時刻、S705処理ステップから受けた特徴量である尤度ヒストグラム、S806処理ステップから受けたセンサ波形の収束時刻、また、図示していないが、S107(S127)処理ステップから受けた推定後のセンサデータ、S108(S128)処理ステップから受けた抽出した統計確率分布等の途中結果およびS131処理ステップから受けた異常検知結果のファイル一式を格納するフォルダを選択するための「参照」ボタン9022、選択したフォルダを表示するための「出力フォルダ」ボックス9021、今回の学習および異常検知テストに係わるデータを登録するための「データ期間登録」登録ボックス903、検知手法を選択するための「異常検知手法」選択ボックス904、異常検知のための詳細な設定に係わる「その他の設定」ボタン905、データベース111からのデータを用いて学習および異常検知テストを実行する「学習および異常検知テスト実行」ボタン906、設備101からのデータを対象として異常検知をする「異常検知実行」ボタン907、異常検知結果を表示するデータの「表示期間」ボックス908、特徴量や異常結果の表示等の表示項目を選択する「表示項目」ボックス909、2次元表示をするか3次元表示をするかを選択するための「表示形式」ボックス910、以上の表示の設定に基づき異常検知を実施し、センサデータを推定処理ステップS107(S127)から受けた異常検知結果を表示する「異常検知結果表示」ボタン911、および、統計確率分布ステップS108(S128)から受けた途中結果である推定後センサデータおよび統計確率分布を受け、表示するための「途中結果表示」ボタン912を備えて構成される。
「入力フォルダ」ボックス9011、「出力フォルダ」ボックス9021でそれぞれフォルダを選択し、「データ期間登録」ボックス908でデータ期間を登録し、「異常検知手法」選択ボックス904で異常検知手法を選択し、「その他の設定」ボタン905でその他の設定が終わった後、「学習および異常検知テスト実行」ボタン906を押すことにより、図1B、あるいは、図1Cに示した学習処理、およびデータベース111からのデータを用いて図1Dに示した異常検知流れに沿った異常検知テスト処理が実行される。ボタン906が一旦押されると、異常検知テスト処理が完了するまでは、「異常検知実行」ボタン907、「異常検知結果表示」ボタン911、「途中結果表示」ボタン912が押せない状態になる。
学習処理および異常検知テスト処理が完了したら、「異常検知実行」ボタン907が押せる状態に切り替わる。また、「異常検知結果表示」ボタン911、「途中結果表示」ボタン912も押せる状態に切り替わる。この場合に、「表示期間」ボックス908に学習データ、あるいは、異常検知テストデータの期間を登録し、「表示項目」ボックス909および「表示形式」ボックス910を選択して「異常検知結果表示」ボタン911、あるいは「途中結果表示」ボタン912を押すと、表示期間にある途中結果、あるいは異常検知結果が「表示」パネル900に表示される。
次に、「異常検知実行」ボタン907を押す。これにより、図示していない設備101に繋がっている一時データ保存用の記憶媒体から「データ期間登録」ボックス903に登録されている期間のデータを読み込んで異常検知を行う。異常検知実行が完了したら、「表示期間」ボックス908に異常検知データの期間を登録し、「表示項目」ボックス909および「表示形式」ボックス910を選択して「異常検知結果表示」ボタン911、「途中結果表示」ボタン912を押すと、表示期間にある異常検知データの途中結果、あるいは異常検知結果が「表示」パネル900に表示される。
表示に関連するボタンを押す前には、「表示」パネル900には実行の進捗が表示されている。たとえば、最初に、“設定してください”と表示する。設定がいったん始まったら、すぐに、“設定実施中”と切り替わる。そして、入力フォルダ、出力フォルダ、データ期間登録、異常検知手法の設定が完了し、「学習および異常検知テスト実行」ボタン906を押すと、“学習および異常検知テスト実行中”と表示する。
「学習および異常検知テスト実行」が完了したら、“学習および異常検知テスト実行が済み、「異常検知実行」ボタン907を押して異常検知を実施するか、表示設定をし、表示ボタンを押して、表示してください”と表示する。「異常検知実行」ボタン907を押さず、「表示期間」、「表示項目」、「表示形式」のいずれかの表示設定をいったん開始したら、“表示設定中”と切り替える。表示設定が完了したら、“表示設定が完了し、表示ボタンを押して、表示してください”と表示する。
「異常検知結果表示」ボタン911か「途中結果表示」ボタン912を押したら、設定に従った学習および異常検知テストの結果が表示される。一方、「異常検知実行」ボタン907を押したら、“異常検知テスト実行中”と表示し、「異常検知テスト実行」が完了したら、“異常検知テスト実行が済み、表示設定をしてください”と表示する。表示設定をいったん開始したら、“表示設定中”と切り替える。表示設定が完了したら、“表示設定が完了し、表示ボタンを押して、表示してください”と表示し、「異常検知結果表示」ボタン911か「途中結果表示」ボタン912を押したら、設定に従った異常検知の結果が表示される。
図9Aに本実施例によるGUI表示の一例を示す。この例では、表示パネル900において、特徴量9001、異常バー9002、および表示に係わる表示関連項目9003が表示されている。表示関連項目9003には、表示データの種類(データベースのデータを利用した異常検知テスト結果か、設備からのデータを利用した異常検知の結果かのこと)、表示期間、本結果が得られるための学習期間、評価期間を表示する。異常バー9002は、異常のある特徴量の位置を黒く表示する。
図9Aに示した例では、データベース111からのデータを利用した異常検知テスト結果を示す一例である。また、図示をしていないが、設備101からのデータを利用した異常検知結果を示すことも可能である。また、「表示形式」に3Dと選択すれば、図9Bの「表示」パネル900に示される3Dの特徴量9001’が表示される。
図9A又は図9Bに示したようなGUIを表示することにより、特徴量である尤度ヒストグラムの状況、異常検知の結果を視覚的に確認することができるため、ユーザにとって判断しやすくなる。
図10は、異常検知のための詳細な設定に係わり、図9にある「その他の設定」ボタン905を押すことで呼び出されるGUIである。本GUIは、図1B~図1Dにおける、センサデータ切出し開始・終了時刻算出し、センサデータを切出し処理ステップS105 (S125)、センサデータ推定ステップS107(S127)の設定にも係わる。
本GUIは、「シーケンス設定」領域1001、「センサデータ推定設定」領域1002、「データ設定」領域1003、「識別器設定」領域1004、「設定状況一覧」表示パネル1005、および「保存」ボタン1006を備えて構成される。
「シーケンス設定」領域1001において、「編集」ボタン10016を押すことで、すべての項目を編集することが可能となる。編集項目には、「シーケンス種類」と「シーケンス切出し」がある。それぞれ、「シーケンス種類」にはシーケンス種類を選択するためのボックス10011、「シーケンス切出し」には、シーケンス切出し開始・終了時刻自動算出項目に、「あり」を表示するチェックボックス100121と100123、およびそれぞれの「あり」の後ろに自動算出時使用する指標を選択するためのボックス100122と100124がある。「シーケンス種類」選択ボックス10011にて、起動や停止等異常検知したいシーケンスの種類を選択することができる。「シーケンス切出し」にて、開始・終了時刻を自動算出するかを決めることができる。
自動算出を実施する場合に、それぞれの「あり」チェックボックス100121と100123をチェックし、指標ボックス100122と100124にて、使用指標を選択する。自動算出を実施しない場合に、「あり」チェックボックスをチェックせずに、使用指標選択ボックスを空白にする。この場合には、デフォルトのシーケンス切出し開始・終了時刻を利用する。
図10に示した例では、シーケンス種類を選択するためのボックス10011に起動シーケンスを入力した例を示している。また、この例では、シーケンス切出し開始・終了時刻の自動算出を行わないため、それぞれの「あり」をチェックせず、指標選択用ボックスを空白にしている。「決定」ボタン10017を押すことにより、「シーケンス設定」領域1001で設定された内容が登録される。
「センサデータ推定設定」領域1002において、「編集」ボタン10026を押すことで、すべての項目を編集することが可能となる。編集項目には、「推定手法」、「パラメータ」、「推定間隔」がある。それぞれ、「推定手法」には線形法・非線形法・混合法を選択するためのチェックボックス100211、100213、100215、各分類方法に対応する更なる詳細な方法を選択するためのボックス100212、100214、100216がある。
推定手法を選択する際に、「推定手法」の線形法・非線形法・混合法を選択するためのチェックボックス100211、100213、100215の何れかをチェックし、その後ろに対応する手法選択のボックス100212、100214、100216によって推定手法を決めることができる。「パラメータ」にはパラメータの種類を選択するための選択ボックス100221、選択されたパラメータの具体的な数字を入力するためのボックス100222、および1つのパラメータの種類選択と数値入力が終わった後、次のパラメータの種類選択と数値入力を実施するための「追加」ボタン100223がある。
「推定間隔」には、「指定あり」の場合に表示するチェックボックス100232、および「指定あり」がチェックされたら推定間隔を入力するためのボックス100233がある。推定間隔を指定しない場合に、「指定あり」チェックボックをチェックせず、その後ろの秒数も入力しない。この場合に、自動的に正常な学習データを用いてそれぞれのセンサ波形の激しさによって推定時刻の決定が行われる。指定する場合には、「指定あり」チェックボックスをチェックし、その後ろの秒数も入力する。これにより、指定された秒数間隔に推定時刻が設定される。
図10に示した例では、非線形法のチェックボックス100213がチェックされ、対応する手法選択ボックス100214にカーネルを用いた推定法が選択される。また、「パラメータ」の「種類」選択ボックス100221によってパラメータ1/パラメータ2が選択され、数値が5.0と10.0と入力されている。推定間隔は指定ありで、推定間隔は1秒と設定される。「決定」ボタン10027を押すことにより、「センサデータ推定設定」領域1002で設定された内容が登録される。
「データ設定」領域1003において、「編集」ボタン10036を押すことで、すべての項目を編集することが可能となる。編集項目には、「学習/評価データ切わけ指定」および「除外データ」がある。さらに、「学習/評価データ切わけ指定」には、「あり」のチェックボックス100311、指定「あり」の場合に、それぞれ学習データ期間を入力するボックス100312、評価データ期間を入力するボックス100313、指定「なし」の場合に、「なし」のチェックボックス100321、自動的に学習データ・評価データを分けることに係わる評価手法のfold数を入力するボックス100322がある。「除外データ」には、「あり」のチェックボックス100331、と「あり」の場合に、データ登録するための「データ登録」ボックス100332がある。
図10に示した例では、学習/評価データ切わけ指定の「あり」のチェックボックス100311がチェックされ、それぞれ学習データボックスと評価データボックス100312と100313に指定期間を入力している。また、除外データがないため、「除外データ」の「あり」のチェックボックス100331をチェックせず、「データ登録」ボックス100332にも空白している。「決定」ボタン10037を押すことにより、「データ設定」領域1003で設定された内容が登録される。
「識別器設定」領域1004において、「編集」ボタン10046を押すことで、すべての項目を編集することが可能となる。編集項目には、「識別器種類」および「詳細項目」がある。それぞれの内容に対し、「識別器種類」ボックス10041、および「詳細項目」ボックス10042がある。「識別器種類」ボックス10041では、識別器の種類選択ができる。例えば、サポートベクターマシン、ベイズ識別器、k近傍識別器、ニューラルネットワーク等がある。
「詳細項目」ボックス10042では、「識別器種類」ボックス10041にて選んだ識別器に対応する詳細な項目の選択ができる。例えば、識別器のクラス数について、1クラスや多クラスを選択できる。1クラスを選択した場合、学習時図1Bの処理流れに沿って学習を行い、正常空間を求める。一方、多クラスを選択した場合、学習時図1Cの処理流れに沿って学習を行い、正常・異常識別境界を求める。本実施例では、「識別器種類」ボックス10041には識別器1と選択し、「詳細項目」ボックス10042に多クラスと選択している。「決定」ボタン10047を押すことにより、「識別器設定」領域1004で設定された内容が登録される。
上記入力した内容が入力された時点で、自動的に「設定状況一覧」1005に表示される。それぞれの設定項目を編集している場合に、それぞれの項目名の後ろに「編集中」と表示される。決定が終わった時点、それぞれの「決定」ボタン10016、10026、10036、10046を押したら、それぞれの項目名の後ろに「編集中」が「決定済」と変更される。また修正したい項目があったら、修正したい設定項目がある領域の「編集」ボタンを押して、編集を行い、編集をし終わった後、再度該当する領域の「決定」ボタン10017、10027、10037、10047の何れかを押すことにより修正を完了する。
「設定状況一覧」1005に表示された内容を確認し終わった後、「保存」ボタン1006を押すと、図10で設定した内容が保存され、図10のGUIが消える。
図10のGUIを用いてセンサデータ推定等を行う詳細な設定を実施した後、図9A又は図9Bの「学習&異常検知テスト実行」ボタン906を押して、学習および異常検知テストを実施した後、「異常検知実行」ボタン907を押し、異常検知を実施する。異常検知を実施する際に用いられる正常空間あるいは識別境界は「学習時」求められたものを利用する。
学習、異常検知テスト、異常検知を行った後、得られた途中結果である推定後計測曲線、センサモデル、センサモデルにおけるある時刻の統計確率分布をチェックすることに係わるGUIについて、図11A及び図11Bを用いて説明する。
図11A及び図11Bに示したGUIは、「センサ設定」領域」1101、「表示設定」領域1102、および表示実行のための「表示」ボタン1103、「表示パネル」領域1104を備えて構成される。「センサ設定」1101には「センサ種類」項目があり、種類選択は選択ボックス11011によって実施される。「表示設定」1102には「表示データ日付」、「表示内容」、「確率分布表示」がある。
表示データ日付は、「表示データ日付」ボックス11021によって入力される。表字内容は「表示内容」の選択ボックス110221によって選択される。また選択ボックス下にある「設定プロパティ」110222によって、表示する内容のプロパティを選択する。「確率分布表示」には、「あり」の場合にチェックするチェックボックス110231、および「あり」の場合に、設定用の「設定プロパティ」110232がある。
図11Aは、推定前後計測曲線を表示する一例を示す。図11Aに示した例では、「表示内容」の選択ボックス110221に「推定前&推定後計測曲線」と選択し、またその他の項目に適切な選択肢を選び、「表示」ボタン1103を押すと、「表示パネル」領域1104に時間とセンサ値との関係を示すグラフ1105が表示される。推定前のデータ列11051は離散的であり、推定後のセンサ波形11052は連続的である。
また、本グラフに係わる設定項目は領域11053に表示される。表示項目内容には、図10で説明したGUI上で設定された内容も含み、多次元センサのセンサ番号、計測内容、データ取得時間、データ種類(学習データか評価データか、および、データベースからか設備からか、との内容を含む)、収束時刻、センサデータの推定手法、推定時に用いたパラメータの値、推定時間間隔種類、推定時間間隔、推定前のマーカーの種類、推定後曲線の種類等がある。領域11053の表示はマウスの右クリックにて表示されないように選択できるようにしても良い。
図11Aで、「表示内容」選択ボックス110222で「センサモデル&推定後計測曲線」を選択し、またその他の項目に適切な選択肢を選び、「表示」ボタン1103を押すと、領域1104には図11Bに示すような、センサモデル毎の推定計測曲線を示すグラフ1106が表示される。グラフ1106において、一点鎖線11061はセンサモデルの平均値曲線(μ)、点線11062、11063はセンサモデルの平均値曲線プラスマイナス標準偏差の3倍(μ±3σ)、実線11064は推定後の計測曲線を表す。また、本図形に係わる設定項目は領域11065に表示される。表示項目内容には、それぞれの線形はどんな曲線であるかを示す。領域11065の表示はマウスの右クリックにて表示されないように選択しても良い。
さらに、統計確率分布を見たい時刻にマウスを合わせ(グラフ1106の矢印で示した個所)、右クリックにて表示するように選択すれば、領域1104においてグラフ1106の下に、図11Bに示すように、ある指定時刻における統計確率分布1107が表示される。ある時刻における統計確率分布1107にはガウス曲線11071、観測データ11072、および領域11073に本統計確率分布に関連する項目が表示される。領域11073に表示される表示項目内容には、センサ番号、計測内容、本統計確率分布の経過時刻、平均値の数値、標準偏差の数値、観測データの推定値の該統計確率分布における確率値と異常度がある。領域11073の表示はマウスの右クリックにて表示されないように選択しても良い。
図11A又は図11Bで説明したようなGUIにより、センサデータ推定手法の選択やパラメータの設定等を簡便に入力することが可能である。また、センサデータ推定前後の結果を確認することが可能であるため、選択した手法や設定したパラメータの妥当性を確認することが可能である。さらに、確率分布および新たに観測されたデータの所在位置や異常度を観察し、シーケンスの進行状況を確認することが可能である。
以上、本発明者によってなされた発明を実施例に基づき具体的に説明したが、本発明は前記実施例に限定されるものではなく、その要旨を逸脱しない範囲で種々変更可能であることは言うまでもない。
101・・・設備 100・・・異常検知パス 100’・・・学習パス 100”・・・推定時刻決定パス 1001・・・イベントデータ 1002・・・センサデータ 1003・・・ユーザ指示 1004・・・識別境界or正常空間 102・・・データ前処理部 1021・・・イベントデータ解析部 1022・・・センサデータ切出し部 1023・・・センサデータ時刻合わせ部 103・・・センサデータ推定部 104・・・統計確率分布推定部 105・・・特徴量抽出部 106・・・異常検知部 111・・・データベース 112・・・推定時刻決定部 113・・・学習部。
Claims (10)
- プラント又は設備の異常を検知する方法であって、
プラント又は設備に取り付けたセンサから間欠的に出力されたセンサ信号及び該センサ信号と同じ期間における前記プラント又は設備の起動シーケンス又は停止シーケンスの開始および終了に対応するイベント信号を入力し、
該入力したセンサ信号のうち前記起動シーケンス又は終了シーケンスの開始のイベント信号と終了のイベント信号との間の区間に対応するセンサ信号を切り出し、
該切り出したセンサ信号のある時刻における信号値とその確率分布を推定し、
該推定した確率分布に基づいて特徴量を抽出し、
該抽出した特徴量に基づいて前記プラント又は設備の異常を検知する
ことを特徴とする設備状態監視方法。 - 前記切り出したセンサ信号のある時刻における信号値とその確率分布を推定することを、
前記切り出したセンサ信号を前記起動シーケンス又は終了シーケンスの開始のイベント信号を起点とした時間に合わせ、
該時間を合わせたセンサ信号のデータを推定する時刻を決定し、
該決定した時刻におけるセンサデータを推定し、
該推定したセンサデータの確率分布推定する
ことにより行うことを特徴とする請求項1記載の設備状態監視方法。 - 前記センサデータを推定する手法を画面上に表示された複数の手法の中から選択し、該選択した手法に基づいて前記センサデータを推定することを特徴とする請求項2に記載の設備状態監視方法。
- 前記推定したセンサデータに関する情報を画面上に表示することを特徴とする請求項2記載の設備状態監視方法。
- 前記抽出した特徴量に基づいて前記プラント又は設備の異常を検知することを、前記プラント又は設備が正常に作動しているときの前記センサ信号を用いて前記センサ信号の正常空間或いは識別境界を決定し、前記抽出した特徴量が前記決定した正常空間或いは識別境界の内部にあるか否かを判断して前記プラント又は設備の異常を検知することを特徴とする請求項1記載の設備状態監視方法。
- プラント又は設備の異常を検知する装置であって、
プラント又は設備に取り付けたセンサから間欠的に出力されたセンサ信号及び該センサ信号と同じ期間における前記プラント又は設備の起動シーケンス又は停止シーケンスの開始および終了に対応するイベント信号を入力し、該入力したセンサ信号のうち前記起動シーケンス又は終了シーケンスの開始のイベント信号と終了のイベント信号との間の区間に対応するセンサ信号を切り出し、該切り出したセンサ信号を前記起動シーケンス又は終了シーケンスの開始のイベント信号を起点とした時間に合わせる処理を行うデータ前処理部と、
該データ前処理部で処理したセンサ信号のある時刻における信号値とその確率分布を推定する確率分布推定部と、
該確率分布推定部で推定した確率分布に基づいて特徴量を抽出する特徴量抽出部と、
該特徴量抽出部で抽出した特徴量に基づいて前記プラント又は設備の異常を検出する異常検出部と
入出力する情報を表示する画面を有して前記異常検出部で検出した前記プラント又は設備の異常に関する情報を前記画面上に表示する入出力部と
を備えたことを特徴とする設備状態監視装置。 - 前記確率分布推定部は、
前記切り出したセンサ信号を前記起動シーケンス又は終了シーケンスの開始のイベント信号を起点とした時間に合わせたセンサ信号のデータを推定する時刻を決定する推定時刻決定部と、
該推定時刻決定部で決定した時刻におけるセンサデータを推定するセンサデータ推定部と、
該センサデータ推定部で推定したセンサデータの統計確率分布推定する統計確率分布推定部と、
を備えることを特徴とする請求項6記載の設備状態監視装置。 - 前記入出力部は前記センサデータ推定部でセンサデータを推定するための複数の手法を前記画面上に表示し、前記センサデータ推定部は、前記表示された複数の手法の中から前記画面上で選択された手法に基づいて前記センサデータを推定することを特徴とする請求項7に記載の設備状態監視装置。
- 前記入出力部は、前記センサデータ推定部で推定したセンサデータに関する情報を前記画面上に表示することを特徴とする請求項7記載の設備状態監視装置。
- 前記異常検出部は、前記プラント又は設備が正常に作動しているときの前記センサ信号を用いて前記センサ信号の正常空間或いは識別境界を決定する学習部と、前記特徴量抽出部で抽出した特徴量が前記決定した正常空間或いは識別境界の内部にあるか否かを判断して前記プラント又は設備の異常を検知する異常検知部とを備えていることを特徴とする請求項6記載の設備状態監視装置。
Priority Applications (1)
| Application Number | Priority Date | Filing Date | Title |
|---|---|---|---|
| US14/416,466 US20150213706A1 (en) | 2012-08-29 | 2013-07-05 | Facility status monitoring method and facility status monitoring device |
Applications Claiming Priority (2)
| Application Number | Priority Date | Filing Date | Title |
|---|---|---|---|
| JP2012188649A JP2014048697A (ja) | 2012-08-29 | 2012-08-29 | 設備状態監視方法及び設備状態監視装置 |
| JP2012-188649 | 2012-08-29 |
Publications (1)
| Publication Number | Publication Date |
|---|---|
| WO2014034273A1 true WO2014034273A1 (ja) | 2014-03-06 |
Family
ID=50183095
Family Applications (1)
| Application Number | Title | Priority Date | Filing Date |
|---|---|---|---|
| PCT/JP2013/068531 WO2014034273A1 (ja) | 2012-08-29 | 2013-07-05 | 設備状態監視方法及び設備状態監視装置 |
Country Status (3)
| Country | Link |
|---|---|
| US (1) | US20150213706A1 (ja) |
| JP (1) | JP2014048697A (ja) |
| WO (1) | WO2014034273A1 (ja) |
Cited By (3)
| Publication number | Priority date | Publication date | Assignee | Title |
|---|---|---|---|---|
| CN107958575A (zh) * | 2016-10-18 | 2018-04-24 | 广东惠州天然气发电有限公司 | 一种电厂运行参数实时报警系统 |
| CN108600704A (zh) * | 2018-05-08 | 2018-09-28 | 深圳市智汇牛科技有限公司 | 一种自动厨房领域的监控系统架构 |
| WO2020090770A1 (ja) * | 2018-10-30 | 2020-05-07 | 国立研究開発法人宇宙航空研究開発機構 | 異常検出装置、異常検出方法、およびプログラム |
Families Citing this family (21)
| Publication number | Priority date | Publication date | Assignee | Title |
|---|---|---|---|---|
| JPWO2015025380A1 (ja) * | 2013-08-21 | 2017-03-02 | 三菱電機株式会社 | プラント監視装置 |
| JP2016177676A (ja) * | 2015-03-20 | 2016-10-06 | 株式会社東芝 | 診断装置、診断方法、診断システムおよび診断プログラム |
| US10151215B2 (en) * | 2015-06-01 | 2018-12-11 | Solar Turbines Incorporated | High speed recorder for a gas turbine engine |
| JP6710913B2 (ja) * | 2015-08-24 | 2020-06-17 | 富士電機株式会社 | 情報提供装置、情報提供方法、及びプログラム |
| JP6562883B2 (ja) * | 2016-09-20 | 2019-08-21 | 株式会社東芝 | 特性値推定装置および特性値推定方法 |
| JP6654119B2 (ja) * | 2016-09-20 | 2020-02-26 | 株式会社日立製作所 | プラントデータ表示処理装置及びプラント制御システム |
| GB2554685A (en) * | 2016-10-03 | 2018-04-11 | Airbus Operations Ltd | Component monitoring |
| JP6616791B2 (ja) * | 2017-01-04 | 2019-12-04 | 株式会社東芝 | 情報処理装置、情報処理方法およびコンピュータプログラム |
| US11237222B2 (en) * | 2017-08-14 | 2022-02-01 | Paige Electric Company, L.P. | Safety ground wire monitoring and alarm systems |
| DE102017215341A1 (de) | 2017-09-01 | 2019-03-07 | Siemens Mobility GmbH | Verfahren zur Untersuchung eines Funktionsverhaltens einer Komponente einer technischen Anlage, Computerprogramm und computerlesbares Speichermedium |
| EP3511795A1 (en) * | 2018-01-12 | 2019-07-17 | Siemens Aktiengesellschaft | Industrial process data processing |
| JP6939661B2 (ja) | 2018-03-13 | 2021-09-22 | オムロン株式会社 | 故障予測支援装置、故障予測支援方法及び故障予測支援プログラム |
| JP7031527B2 (ja) * | 2018-08-07 | 2022-03-08 | 日本電信電話株式会社 | 操作列生成装置、操作列生成方法及びプログラム |
| JP7034874B2 (ja) * | 2018-09-26 | 2022-03-14 | 株式会社日立製作所 | プロセス状態解析装置及びプロセス状態表示方法 |
| CN110954852B (zh) * | 2018-09-27 | 2022-05-17 | 迈来芯电子科技有限公司 | 传感器设备、系统以及相关方法 |
| US10956578B2 (en) * | 2018-10-05 | 2021-03-23 | General Electric Company | Framework for determining resilient manifolds |
| JP7275546B2 (ja) * | 2018-11-28 | 2023-05-18 | 日産自動車株式会社 | 異常表示装置及び異常表示方法 |
| JP7029647B2 (ja) * | 2019-03-20 | 2022-03-04 | オムロン株式会社 | コントローラ、システム、方法及びプログラム |
| US11143055B2 (en) | 2019-07-12 | 2021-10-12 | Solar Turbines Incorporated | Method of monitoring a gas turbine engine to detect overspeed events and record related data |
| US20230185289A1 (en) * | 2020-06-05 | 2023-06-15 | Mitsubishi Electric Corporation | Abnormality symptom analyzing device |
| CN112907911A (zh) * | 2021-01-19 | 2021-06-04 | 安徽数分智能科技有限公司 | 一种基于设备工艺数据的智能异常识别与报警算法 |
Citations (3)
| Publication number | Priority date | Publication date | Assignee | Title |
|---|---|---|---|---|
| JP2011070635A (ja) * | 2009-08-28 | 2011-04-07 | Hitachi Ltd | 設備状態監視方法およびその装置 |
| JP2011081697A (ja) * | 2009-10-09 | 2011-04-21 | Hitachi Ltd | 設備状態監視方法、監視システム及び監視プログラム |
| JP2012089057A (ja) * | 2010-10-22 | 2012-05-10 | Hitachi Engineering & Services Co Ltd | 設備状態監視方法およびその装置並びに設備状態監視用プログラム |
Family Cites Families (5)
| Publication number | Priority date | Publication date | Assignee | Title |
|---|---|---|---|---|
| JP2738732B2 (ja) * | 1988-09-16 | 1998-04-08 | 株式会社日立製作所 | 劣化度予測装置および方法 |
| US7010459B2 (en) * | 1999-06-25 | 2006-03-07 | Rosemount Inc. | Process device diagnostics using process variable sensor signal |
| FI113410B (fi) * | 2002-05-31 | 2004-04-15 | Ekahau Oy | Probabilistinen malli paikannustekniikkaa varten |
| US7191096B1 (en) * | 2004-08-13 | 2007-03-13 | Sun Microsystems, Inc. | Multi-dimensional sequential probability ratio test for detecting failure conditions in computer systems |
| WO2013126052A1 (en) * | 2012-02-22 | 2013-08-29 | Hewlett-Packard Development Company, L.P. | Computer infrastructure security management |
-
2012
- 2012-08-29 JP JP2012188649A patent/JP2014048697A/ja active Pending
-
2013
- 2013-07-05 US US14/416,466 patent/US20150213706A1/en not_active Abandoned
- 2013-07-05 WO PCT/JP2013/068531 patent/WO2014034273A1/ja active Application Filing
Patent Citations (3)
| Publication number | Priority date | Publication date | Assignee | Title |
|---|---|---|---|---|
| JP2011070635A (ja) * | 2009-08-28 | 2011-04-07 | Hitachi Ltd | 設備状態監視方法およびその装置 |
| JP2011081697A (ja) * | 2009-10-09 | 2011-04-21 | Hitachi Ltd | 設備状態監視方法、監視システム及び監視プログラム |
| JP2012089057A (ja) * | 2010-10-22 | 2012-05-10 | Hitachi Engineering & Services Co Ltd | 設備状態監視方法およびその装置並びに設備状態監視用プログラム |
Cited By (6)
| Publication number | Priority date | Publication date | Assignee | Title |
|---|---|---|---|---|
| CN107958575A (zh) * | 2016-10-18 | 2018-04-24 | 广东惠州天然气发电有限公司 | 一种电厂运行参数实时报警系统 |
| CN108600704A (zh) * | 2018-05-08 | 2018-09-28 | 深圳市智汇牛科技有限公司 | 一种自动厨房领域的监控系统架构 |
| WO2020090770A1 (ja) * | 2018-10-30 | 2020-05-07 | 国立研究開発法人宇宙航空研究開発機構 | 異常検出装置、異常検出方法、およびプログラム |
| JPWO2020090770A1 (ja) * | 2018-10-30 | 2021-09-24 | 国立研究開発法人宇宙航空研究開発機構 | 異常検出装置、異常検出方法、およびプログラム |
| US11669080B2 (en) | 2018-10-30 | 2023-06-06 | Japan Aerospace Exploration Agency | Abnormality detection device, abnormality detection method, and program |
| JP7340265B2 (ja) | 2018-10-30 | 2023-09-07 | 国立研究開発法人宇宙航空研究開発機構 | 異常検出装置、異常検出方法、およびプログラム |
Also Published As
| Publication number | Publication date |
|---|---|
| US20150213706A1 (en) | 2015-07-30 |
| JP2014048697A (ja) | 2014-03-17 |
Similar Documents
| Publication | Publication Date | Title |
|---|---|---|
| WO2014034273A1 (ja) | 設備状態監視方法及び設備状態監視装置 | |
| JP5301717B1 (ja) | 設備状態監視方法およびその装置 | |
| JP5342708B1 (ja) | 異常検知方法及びその装置 | |
| EP2905665B1 (en) | Information processing apparatus, diagnosis method, and program | |
| JP6216242B2 (ja) | 異常検知方法およびその装置 | |
| JP5364530B2 (ja) | 設備状態監視方法、監視システム及び監視プログラム | |
| JP5501903B2 (ja) | 異常検知方法及びそのシステム | |
| US9779495B2 (en) | Anomaly diagnosis method and apparatus | |
| EP2752722B1 (en) | Facility state monitoring method and device for same | |
| EP3055747B1 (en) | Correlation and annotation of time series data sequences to extracted or existing discrete data | |
| CN102375452B (zh) | 改善故障代码设定和隔离故障的事件驱动的数据挖掘方法 | |
| KR101316486B1 (ko) | 이상 검지 방법 및 시스템 | |
| CN104390657B (zh) | 一种发电机组运行参数测量传感器故障诊断方法及系统 | |
| WO2013011745A1 (ja) | 設備状態監視方法およびその装置 | |
| EP2950177A1 (en) | Asset condition monitoring | |
| JP5778305B2 (ja) | 異常検知方法及びそのシステム | |
| EP3477412B1 (en) | System fault isolation and ambiguity resolution | |
| EP3055746B1 (en) | Correlation and annotation of time series data sequences to extracted or existing discrete data | |
| JP2013143009A (ja) | 設備状態監視方法およびその装置 | |
| JP2014056598A (ja) | 異常検知方法及びそのシステム | |
| US20180087489A1 (en) | Method for windmill farm monitoring | |
| KR102602840B1 (ko) | 학습 데이터셋 생성 시스템 및 이를 이용한 학습 데이터셋 생성 방법 | |
| CN117308274A (zh) | 一种基于贝叶斯的空调外机故障在线检测方法及系统 |
Legal Events
| Date | Code | Title | Description |
|---|---|---|---|
| 121 | Ep: the epo has been informed by wipo that ep was designated in this application |
Ref document number: 13832024 Country of ref document: EP Kind code of ref document: A1 |
|
| WWE | Wipo information: entry into national phase |
Ref document number: 14416466 Country of ref document: US |
|
| NENP | Non-entry into the national phase |
Ref country code: DE |
|
| 122 | Ep: pct application non-entry in european phase |
Ref document number: 13832024 Country of ref document: EP Kind code of ref document: A1 |