WO2014017278A1 - 質量分析方法及び質量分析システム - Google Patents
質量分析方法及び質量分析システム Download PDFInfo
- Publication number
- WO2014017278A1 WO2014017278A1 PCT/JP2013/068585 JP2013068585W WO2014017278A1 WO 2014017278 A1 WO2014017278 A1 WO 2014017278A1 JP 2013068585 W JP2013068585 W JP 2013068585W WO 2014017278 A1 WO2014017278 A1 WO 2014017278A1
- Authority
- WO
- WIPO (PCT)
- Prior art keywords
- detector
- peak
- mass spectrometer
- sub
- detection
- Prior art date
- Legal status (The legal status is an assumption and is not a legal conclusion. Google has not performed a legal analysis and makes no representation as to the accuracy of the status listed.)
- Ceased
Links
Images

Classifications
-
- G—PHYSICS
- G01—MEASURING; TESTING
- G01N—INVESTIGATING OR ANALYSING MATERIALS BY DETERMINING THEIR CHEMICAL OR PHYSICAL PROPERTIES
- G01N30/00—Investigating or analysing materials by separation into components using adsorption, absorption or similar phenomena or using ion-exchange, e.g. chromatography or field flow fractionation
- G01N30/02—Column chromatography
- G01N30/62—Detectors specially adapted therefor
- G01N30/72—Mass spectrometers
- G01N30/7233—Mass spectrometers interfaced to liquid or supercritical fluid chromatograph
-
- G—PHYSICS
- G01—MEASURING; TESTING
- G01N—INVESTIGATING OR ANALYSING MATERIALS BY DETERMINING THEIR CHEMICAL OR PHYSICAL PROPERTIES
- G01N30/00—Investigating or analysing materials by separation into components using adsorption, absorption or similar phenomena or using ion-exchange, e.g. chromatography or field flow fractionation
- G01N30/02—Column chromatography
- G01N30/62—Detectors specially adapted therefor
- G01N30/72—Mass spectrometers
-
- G—PHYSICS
- G01—MEASURING; TESTING
- G01N—INVESTIGATING OR ANALYSING MATERIALS BY DETERMINING THEIR CHEMICAL OR PHYSICAL PROPERTIES
- G01N30/00—Investigating or analysing materials by separation into components using adsorption, absorption or similar phenomena or using ion-exchange, e.g. chromatography or field flow fractionation
- G01N30/02—Column chromatography
- G01N30/86—Signal analysis
- G01N30/8624—Detection of slopes or peaks; baseline correction
- G01N30/8631—Peaks
- G01N30/8634—Peak quality criteria
-
- H—ELECTRICITY
- H01—ELECTRIC ELEMENTS
- H01J—ELECTRIC DISCHARGE TUBES OR DISCHARGE LAMPS
- H01J49/00—Particle spectrometers or separator tubes
- H01J49/0027—Methods for using particle spectrometers
-
- H—ELECTRICITY
- H01—ELECTRIC ELEMENTS
- H01J—ELECTRIC DISCHARGE TUBES OR DISCHARGE LAMPS
- H01J49/00—Particle spectrometers or separator tubes
- H01J49/02—Details
- H01J49/025—Detectors specially adapted to particle spectrometers
Definitions
- the present invention relates to a mass spectrometry method and a mass spectrometry system provided with a sub-detector in the front stage of a mass spectrometer.
- Patent Document 1 includes a “mass spectrometer as a main detector and a sub-detector provided separately from the mass spectrometer, and a sample from a liquid chromatograph section first enters the sub-detector. Further, a “liquid chromatograph mass spectrometer” in which a flow path is configured to enter the mass spectrometer after a predetermined time has been disclosed.
- the detection peak to be analyzed among the detection peaks detected by the sub-detector and the mass spectrometer is determined whether there is an overlapping peak and whether the same peak exists between the sub-detector and the mass spectrometer. Based on the criteria.
- the mass spectrometry method and mass spectrometry system of the present invention can prevent a decrease in quantitative accuracy.
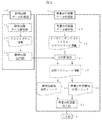
- FIG. 1 shows an apparatus configuration of a mass spectrometry system used in an embodiment of the present invention.
- the mass spectrometry system used in this example was analyzed by a chromatograph 2 for the purpose of separating a sample 1, a sub-detector 3 different from the mass spectrometer, and a sub-detector 3.
- An ion source 4 that ionizes a sample
- a mass analyzer 5 that performs mass analysis of ions introduced from the ion source 4
- a detector 6 that detects ions
- a sub-detector controller 7 that controls the sub-detector 3.
- a mass spectrometer control unit 8 for controlling the mass spectrometer, an input unit 9 for inputting an analysis method to be transmitted to each control unit, and a data processing unit 10 for executing processing of data acquired by the sub-detector 3 And a data processing unit 11 that executes processing of data acquired by the mass spectrometer.
- the mass spectrometer of this embodiment includes an ion source 4, a mass analyzer 5, and a detector 6.
- control function block diagram of the present embodiment is shown in FIG.
- the data processing unit 10 of the sub-detector 3 and the data processing unit 11 of the mass spectrometer shown in FIG. 1 each include the following functions.
- the same reference numerals as those in FIG. 1 denote the same functional components.
- the sub-detector data processing unit 10 of the sub-detector 3 outputs a sub-detector data analysis unit 12 for analyzing the data of the sub-detector 3 and chromatogram information 13 to the data processing unit of the mass spectrometer.
- a sub-detector output unit 14 for displaying data of the sub-detector 3 alone is included.
- the mass spectrometer data processing unit 11 of the mass spectrometer includes a data analyzer 15 of the mass spectrometer, total ion chromatogram / mass spectrum information 16 including mass spectrum information, an analysis planning unit 17 for generating an analysis method, , Analysis schedule information 18 generated by collating data of the sub-detector 3 and the mass spectrometer in the analysis planning unit 17, a sub-detector analysis method 19 generated for sub-detection from the analysis schedule information 18, and mass It includes a mass spectrometer analysis method 20 generated for the analyzer, and a mass spectrometer output unit 21 that displays and outputs the generated analysis method.
- the sub-detector output unit 14 sends the mass analyzer data processing unit 11 of the mass spectrometer. Is sent to the analysis planning department.
- the analysis planning unit 17 of the mass spectrometer collates the chromatogram information 13 with the total ion chromatogram / mass spectrum information 16 to generate a collation result that becomes the analysis schedule information 18.
- an analysis method 19 for the sub-detector and an analysis method 20 for the mass spectrometer are generated for each device, and the analysis method is sent from the mass spectrometer output unit 21 to the input unit 9 that transmits an instruction to the control unit of each device. Send.
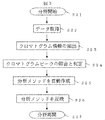
- FIG. 3 shows a flowchart of the present invention. Analysis of the sample is started by the system of the sub-detector 3 and the mass spectrometer connected to the liquid chromatograph (S21), and data is acquired by each of the apparatus having the sub-detector 3 and the mass spectrometer (S22). Thereafter, the data processing units 10 and 11 of each device extract chromatogram information (S23), and based on the chromatogram information, check and determine (S24) chromatogram peaks within each data and between devices. Do. Based on the collation / determination result, the sub-detector analysis method 19 for the sub-detector and the analysis method 20 for the mass spectrometer for the mass spectrometer are automatically created (S25). Then, the analysis methods 19 and 20 are reflected on each apparatus (S26), and the analysis is resumed (S27).
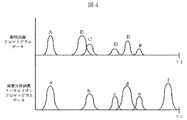
- FIG. 4 shows an example of acquired data for data acquisition (S22) in FIG. 3 showing the flowchart of the present invention.
- the upper part displays the chromatogram data acquired by the sub-detector 3, and the lower part displays the total ion chromatogram acquired by the mass spectrometer.
- the peak top of the peak first detected after the start of measurement is A, and the peaks are B, C, and D in the order of detection thereafter.
- the time from the start of analysis to the end of analysis in the sub-detector 3 is T1.
- a peak top time of a peak first detected after the start of measurement with a peak acquired by a mass spectrometer is a, and peaks detected thereafter are b, c, d.
- T2 be the time from the analysis start time to the analysis end time of the mass spectrometer.
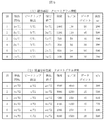
- FIG. 5 illustrates the chromatogram information regarding the extraction of the chromatogram information in FIG.
- (1) on the upper side shows chromatogram information extracted from data acquired by the sub-detector 3.
- the ID, peak detection start time, peak top detection time, peak detection end time, peak intensity, peak S / N ratio, number of peak data points, and peak detection wavelength are extracted.
- the peak detected first after the start of analysis is A
- the ratio of the time As at which detection of A at the analysis time T1 is started is represented by As / T1.
- the peak top detection time ratio is represented as A / T1
- the peak detection end time ratio is represented as Ae / T1.
- the lower part of FIG. 5 shows chromatogram information extracted from data acquired by a mass spectrometer. Similar to the chromatogram information in the sub-detector 3, for one detected chromatogram peak, ID, peak detection start time, peak top detection time, peak detection end time, peak intensity, peak S / N ratio The number of peak data points and the mass-to-charge ratio (m / z) of the peak component are also extracted.
- the sub-detector 3 uses a detector that does not detect the wavelength
- an item for displaying the component detection method that is characteristic of the sub-detector 3 is added to the chromatogram information of FIG.
- ⁇ Define the judgment conditions for each peak based on the chromatogram information in Fig. 5.
- an overlapping peak is determined to be the same within a set range in the detection end time of a certain peak and the detection start time of a peak detected next to that peak in the data extracted from one device. Say that the peak.
- This is described as follows based on the chromatogram of FIG. 4 and the chromatogram information of FIG.
- the peaks B and C of the sub-detector chromatogram in FIG. 4 are such that the detection end time Be / T1 of the peak B and the detection start time Cs / T1 of the peak C adjacent to B are “Be / T1 ⁇ Cs / T1”.
- the same peak in the present invention is a peak for which the peak top detection time (A / T1) is determined to be a peak derived from the same component within the set range between the data of the two apparatuses.
- a / T1 peak top detection time
- peak A and peak a are the same peak.
- each peak exists within the time ratio of the set range.
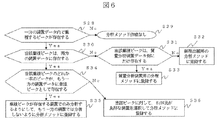
- the peak C among the peaks B and C determined as the overlapping peak by the sub-detector 3 is This is a case where it is determined that the peak is the same as the peak b in the mass spectrometer chromatogram.
- the peak b on the mass spectrometer side which is a single peak, is analyzed only on the mass spectrometer side, and the peak C of the sub-detector 3 is registered in the analysis method so as not to be analyzed on the sub-detector side ( S35).
- a single peak is a peak in which no overlapping peak exists in the data of one device.
- the peak A, peak a, peak b, and peak f are peaks for which the relational expression of overlapping peaks does not hold.
- the sub-detector 3 is an ultraviolet detector (UV detector), a visible detector (VIS detector), a photodiode array detector (PDA detector), a differential refractive index detector (RI detector). Fluorescence detector (FL detector), charged particle detector (CAD detector), etc. are assumed, but any device including a detector that can be connected to a liquid chromatograph and can display chromatogram data Substitution is possible.
- UV detector ultraviolet detector
- VIS detector visible detector
- PDA detector photodiode array detector
- RI detector differential refractive index detector
- FL detector Fluorescence detector
- CAD detector charged particle detector
- overlapping peaks are continuously detected using a plurality of detectors, so that there is little influence on analysis time delay and ion intensity reduction.
- the target component of interest is the same for each sample, such as quantitative analysis of blood components
- the same analysis method will be used repeatedly. It is possible to reduce the user's trouble. This is because the quantitative accuracy and reproducibility are improved, so that the reliability of the data is increased and the complexity of the method creation by the repeated analysis of the data can be reduced.
Landscapes
- Chemical & Material Sciences (AREA)
- Analytical Chemistry (AREA)
- General Health & Medical Sciences (AREA)
- Life Sciences & Earth Sciences (AREA)
- Health & Medical Sciences (AREA)
- Biochemistry (AREA)
- Physics & Mathematics (AREA)
- General Physics & Mathematics (AREA)
- Immunology (AREA)
- Pathology (AREA)
- Engineering & Computer Science (AREA)
- Quality & Reliability (AREA)
- Other Investigation Or Analysis Of Materials By Electrical Means (AREA)
Abstract
Description
液体クロマトグラフと接続した副検出器3と質量分析装置のシステムで試料の分析を開始し(S21)、副検出器3を有する装置と質量分析装置のそれぞれでデータを取得(S22)する。その後、各装置のデータ処理部10、11でクロマトグラム情報の抽出(S23)を行ない、そのクロマトグラム情報をもとに各データ内、および装置間でクロマトグラムピークの照合と判定(S24)を行なう。その照合・判定結果をもとに、副検出器用の副検出器分析メソッド19と質量分析装置用の質量分析装置用分析メソッド20を自動作成(S25)する。そして、各装置に分析メソッド19、20を反映して(S26)、分析を再開する(S27)。
2 液体クロマトグラフ
3 副検出器
4 イオン源
5 質量分析部
6 検出器
7 副検出器制御部
8 質量分析装置制御部
9 入力部
10 副検出器データ処理部
11 質量分析装置データ処理部
12 副検出器データ解析部
13 クロマトグラム情報
14 副検出器出力部
15 質量分析装置データ解析部
16 トータルイオンクロマトグラム・マススペクトル情報
17 分析計画部
18 分析スケジュール情報
19 副検出器分析メソッド
20 質量分析装置用分析メソッド
21 質量分析装置出力部
Claims (12)
- 質量分析装置と、該質量分析装置の前段に、試料成分の強度と検出時間をクロマトグラムデータとして表示する副検出器を接続した分析システムを用いた質量分析方法であって、
a)試料注入後、前記副検出器を有する分析装置で試料を分析し、その検出器を通過した試料を、前記質量分析装置へ注入し、
b)前記副検出器と前記質量分析装置の両方でデータを取得し、
c)前記副検出器と前記質量分析装置で検出した検出ピークのうち、どの検出ピークを分析するかを、重複するピークの有無及び前記副検出器及び前記質量分析装置間で同一ピークが存在するかどうかを基準に判断することを特徴とする質量分析方法。 - 請求項1において、
前記副検出器と前記質量分析装置で、各クロマトグラムピークトップの検出時間、及び、全分析時間に対する各クロマトグラムピークトップの検出時間の比を算出することを特徴とする、質量分析方法。 - 請求項1において、
前記副検出器と前記質量分析装置のそれぞれで、各クロマトグラムの検出開始時間、検出終了時間、全分析時間に対する検出開始時間の比、及び全分析時間に対する検出終了時間の比を算出することを特徴とする質量分析方法。 - 請求項1において、
前記副検出器と前記質量分析装置では、各データのクロマトグラムピークのデータポイント数、シグナル/ノイズ比(S/N比)を抽出することを特徴とする質量分析方法。 - 請求項1において、
前記副検出器と前記質量分析装置とで検出された各クロマトグラムピークを照合し、同一成分由来のピークかどうかを判定することを特徴とする質量分析方法。 - 請求項2において、
全分析時間に対する各クロマトグラムピークトップの検出時間の比を基に、前記副検出器及び前記質量分析装置間で同一ピークが存在するかどうかを判断することを特徴とする質量分析方法。 - 請求項3において、
隣り合うクロマトグラムピークのうち、先のクロマトグラムの検出終了時間と、後のクロマトグラムの検出開始時間とを比較し、検出終了時間の方が遅い場合に、ピークが重複すると判定することを特徴とする質量分析方法。 - 請求項1から7のいずれかにおいて、
前記副検出器または前記質量分析装置のいずれかにおいて、重複するピークが存在する場合、
他方において、該重複するピークが単独ピークとして存在するかどうかを判定し、単独ピークとして存在する場合には、該ピークに対しては他方のデータを用いて分析を行うことを特徴とする質量分析方法。 - 請求項1から7のいずれかにおいて、
前記副検出器または前記質量分析装置のいずれかにおいて、重複するピークが存在する場合、
他方の装置において、該重複するピークが単独ピークとして存在するかどうかを判定し、単独ピークとして存在しない場合には、該ピークに対してはシグナル/ノイズ比(S/N比)が良好な方のデータを用いて分析を行うことを特徴とする質量分析方法。 - イオンのm/z、強度、および検出時間をクロマトグラムデータとして表示する質量分析装置と、
該質量分析装置の前段に、試料成分の強度と検出時間をクロマトグラムデータとして表示する副検出器を接続した質量分析システムにおいて、
a)試料注入後、前記副検出器を有する分析装置で試料を分析し、その検出器を通過した試料を、前記質量分析装置へ注入し、
b)前記副検出器と前記質量分析装置の両方でデータを取得し、
c)前記副検出器と前記質量分析装置で検出した検出ピークのうち、どの検出ピークを分析するかを、重複するピークの有無及び前記副検出器及び前記質量分析装置間で同一ピークが存在するかどうかを基準に判断することを特徴とする質量分析システム。 - 請求項9において、
前記副検出器または前記質量分析装置のいずれかにおいて、重複するピークが存在する場合、
他方において、該重複するピークが単独ピークとして存在するかどうかを判定し、単独ピークとして存在する場合には、該ピークに対しては他方のデータを用いて分析を行うことを特徴とする質量分析システム。 - 請求項9において、
前記副検出器または前記質量分析装置のいずれかにおいて、重複するピークが存在する場合、
他方の装置において、該重複するピークが単独ピークとして存在するかどうかを判定し、単独ピークとして存在しない場合には、該ピークに対してはシグナル/ノイズ比(S/N比)が良好な方のデータを用いて分析を行うことを特徴とする質量分析システム。
Priority Applications (3)
| Application Number | Priority Date | Filing Date | Title |
|---|---|---|---|
| US14/413,603 US20150198569A1 (en) | 2012-07-24 | 2013-07-08 | Mass analysis method and mass analysis system |
| CN201380038972.3A CN104508474A (zh) | 2012-07-24 | 2013-07-08 | 质量分析方法以及质量分析系统 |
| DE201311003346 DE112013003346T5 (de) | 2012-07-24 | 2013-07-08 | Massenanalyseverfahren und Massenanalysesystem |
Applications Claiming Priority (2)
| Application Number | Priority Date | Filing Date | Title |
|---|---|---|---|
| JP2012163220A JP2014021083A (ja) | 2012-07-24 | 2012-07-24 | 質量分析方法及び質量分析システム |
| JP2012-163220 | 2012-07-24 |
Publications (1)
| Publication Number | Publication Date |
|---|---|
| WO2014017278A1 true WO2014017278A1 (ja) | 2014-01-30 |
Family
ID=49997094
Family Applications (1)
| Application Number | Title | Priority Date | Filing Date |
|---|---|---|---|
| PCT/JP2013/068585 Ceased WO2014017278A1 (ja) | 2012-07-24 | 2013-07-08 | 質量分析方法及び質量分析システム |
Country Status (5)
| Country | Link |
|---|---|
| US (1) | US20150198569A1 (ja) |
| JP (1) | JP2014021083A (ja) |
| CN (1) | CN104508474A (ja) |
| DE (1) | DE112013003346T5 (ja) |
| WO (1) | WO2014017278A1 (ja) |
Cited By (1)
| Publication number | Priority date | Publication date | Assignee | Title |
|---|---|---|---|---|
| JP2023012485A (ja) * | 2019-03-27 | 2023-01-25 | 株式会社島津製作所 | クロマトグラム表示装置及びクロマトグラム表示方法 |
Families Citing this family (6)
| Publication number | Priority date | Publication date | Assignee | Title |
|---|---|---|---|---|
| US11543395B2 (en) * | 2016-06-22 | 2023-01-03 | Shimadzu Corporation | Information processing device, information processing method, and information processing program |
| EP3540425B1 (en) * | 2016-11-09 | 2023-12-27 | Shimadzu Corporation | Data analyzer for chromatography mass spectrometry |
| US10444206B2 (en) * | 2017-05-04 | 2019-10-15 | Shimadzu Corporation | Chromatography/mass spectrometry data processing device |
| JP7012998B2 (ja) * | 2017-09-21 | 2022-01-31 | 株式会社日立ハイテクサイエンス | クロマトグラフのデータ処理装置 |
| JP6505268B1 (ja) * | 2018-01-11 | 2019-04-24 | 株式会社日立ハイテクサイエンス | 質量分析装置及び質量分析方法 |
| CN113383237B (zh) * | 2018-09-20 | 2025-02-07 | 沃特世科技爱尔兰有限公司 | 用于生成并执行分析方法的技术 |
Citations (2)
| Publication number | Priority date | Publication date | Assignee | Title |
|---|---|---|---|---|
| JPH1019868A (ja) * | 1996-07-09 | 1998-01-23 | Hitachi Ltd | 液体クロマトグラフ直結質量分析方法及び装置 |
| JP2002181784A (ja) * | 2000-12-19 | 2002-06-26 | Shimadzu Corp | 液体クロマトグラフ質量分析計 |
Family Cites Families (5)
| Publication number | Priority date | Publication date | Assignee | Title |
|---|---|---|---|---|
| JP2872375B2 (ja) * | 1990-09-21 | 1999-03-17 | 株式会社日立製作所 | 質量分析計 |
| CA2593184A1 (en) * | 2005-01-06 | 2006-07-13 | Eastern Virginia Medical School | Apolipoprotein a-ii isoform as a biomarker for prostate cancer |
| US8067731B2 (en) * | 2008-03-08 | 2011-11-29 | Scott Technologies, Inc. | Chemical detection method and system |
| US8304719B2 (en) * | 2009-02-22 | 2012-11-06 | Xin Wang | Precise and thorough background subtraction |
| CN102495127B (zh) * | 2011-11-11 | 2013-09-04 | 暨南大学 | 一种基于概率统计模型的蛋白质二级质谱鉴定方法 |
-
2012
- 2012-07-24 JP JP2012163220A patent/JP2014021083A/ja active Pending
-
2013
- 2013-07-08 WO PCT/JP2013/068585 patent/WO2014017278A1/ja not_active Ceased
- 2013-07-08 DE DE201311003346 patent/DE112013003346T5/de not_active Withdrawn
- 2013-07-08 US US14/413,603 patent/US20150198569A1/en not_active Abandoned
- 2013-07-08 CN CN201380038972.3A patent/CN104508474A/zh active Pending
Patent Citations (2)
| Publication number | Priority date | Publication date | Assignee | Title |
|---|---|---|---|---|
| JPH1019868A (ja) * | 1996-07-09 | 1998-01-23 | Hitachi Ltd | 液体クロマトグラフ直結質量分析方法及び装置 |
| JP2002181784A (ja) * | 2000-12-19 | 2002-06-26 | Shimadzu Corp | 液体クロマトグラフ質量分析計 |
Non-Patent Citations (1)
| Title |
|---|
| HIROMICHI YAMASHITA: "Fundamental Knowledge of Chemical Analysis-LC/MS and GC/MS Data Treatment", BUNSEKI, no. 12, 5 December 2008 (2008-12-05), pages 634 - 640 * |
Cited By (3)
| Publication number | Priority date | Publication date | Assignee | Title |
|---|---|---|---|---|
| JP2023012485A (ja) * | 2019-03-27 | 2023-01-25 | 株式会社島津製作所 | クロマトグラム表示装置及びクロマトグラム表示方法 |
| JP7409462B2 (ja) | 2019-03-27 | 2024-01-09 | 株式会社島津製作所 | クロマトグラム表示装置 |
| US11940426B2 (en) | 2019-03-27 | 2024-03-26 | Shimadzu Corporation | Chromatograph mass spectrometer |
Also Published As
| Publication number | Publication date |
|---|---|
| DE112013003346T5 (de) | 2015-03-26 |
| US20150198569A1 (en) | 2015-07-16 |
| CN104508474A (zh) | 2015-04-08 |
| JP2014021083A (ja) | 2014-02-03 |
Similar Documents
| Publication | Publication Date | Title |
|---|---|---|
| WO2014017278A1 (ja) | 質量分析方法及び質量分析システム | |
| US10607722B2 (en) | Data-processing for chromatographic mass spectrometry | |
| JP6245387B2 (ja) | 3次元スペクトルデータ処理装置及び処理方法 | |
| JP7108136B2 (ja) | 分析装置 | |
| US10381207B2 (en) | Data processing system for chromatographic mass spectrometry | |
| EP3540425B1 (en) | Data analyzer for chromatography mass spectrometry | |
| JP6813033B2 (ja) | 分析データ解析方法および分析データ解析装置 | |
| JP7173293B2 (ja) | クロマトグラフ質量分析装置 | |
| JP6048590B2 (ja) | 包括的2次元クロマトグラフ用データ処理装置 | |
| JP5962775B2 (ja) | クロマトグラフ質量分析用データ処理装置 | |
| US20240345046A1 (en) | Waveform-analyzing method, waveform-analyzing device, and analyzing system | |
| JP7334788B2 (ja) | 波形解析方法及び波形解析装置 | |
| JP6901376B2 (ja) | 質量分析用データ処理装置及び質量分析用データ処理方法 | |
| JP6132073B2 (ja) | 包括的2次元クロマトグラフ用データ処理装置 | |
| JP2017161442A (ja) | クロマトグラフ質量分析データ処理装置 | |
| US9823228B2 (en) | Chromatograph mass spectrometer and control method therefor | |
| JP5786703B2 (ja) | クロマトグラフ質量分析装置用データ処理装置 | |
| WO2018158801A1 (ja) | スペクトルデータの特徴抽出装置および方法 | |
| US20240175850A1 (en) | Data processing system | |
| GB2633188A (en) | Selection of peak detection parameters for isotope-ratio mass spectrometry |
Legal Events
| Date | Code | Title | Description |
|---|---|---|---|
| 121 | Ep: the epo has been informed by wipo that ep was designated in this application |
Ref document number: 13823738 Country of ref document: EP Kind code of ref document: A1 |
|
| WWE | Wipo information: entry into national phase |
Ref document number: 14413603 Country of ref document: US |
|
| WWE | Wipo information: entry into national phase |
Ref document number: 1120130033461 Country of ref document: DE Ref document number: 112013003346 Country of ref document: DE |
|
| 122 | Ep: pct application non-entry in european phase |
Ref document number: 13823738 Country of ref document: EP Kind code of ref document: A1 |