WO2014016914A1 - 異常音検出システム - Google Patents
異常音検出システム Download PDFInfo
- Publication number
- WO2014016914A1 WO2014016914A1 PCT/JP2012/068755 JP2012068755W WO2014016914A1 WO 2014016914 A1 WO2014016914 A1 WO 2014016914A1 JP 2012068755 W JP2012068755 W JP 2012068755W WO 2014016914 A1 WO2014016914 A1 WO 2014016914A1
- Authority
- WO
- WIPO (PCT)
- Prior art keywords
- zero
- density distribution
- abnormal
- zero point
- normal
- Prior art date
- Legal status (The legal status is an assumption and is not a legal conclusion. Google has not performed a legal analysis and makes no representation as to the accuracy of the status listed.)
- Ceased
Links
Images




Classifications
-
- G—PHYSICS
- G01—MEASURING; TESTING
- G01H—MEASUREMENT OF MECHANICAL VIBRATIONS OR ULTRASONIC, SONIC OR INFRASONIC WAVES
- G01H3/00—Measuring characteristics of vibrations by using a detector in a fluid
-
- G—PHYSICS
- G01—MEASURING; TESTING
- G01M—TESTING STATIC OR DYNAMIC BALANCE OF MACHINES OR STRUCTURES; TESTING OF STRUCTURES OR APPARATUS, NOT OTHERWISE PROVIDED FOR
- G01M7/00—Vibration-testing of structures; Shock-testing of structures
Definitions
- the present invention relates to an abnormal sound detection system.
- Patent Document 1 discloses an “acoustic diagnosis support apparatus that supports diagnosis of a sound source that generates abnormal noise at a predetermined period when an abnormality occurs”, and “makes it easy to grasp the abnormality”. It is described.
- the sound collector records measurement data obtained by sampling the sound generated from the rotating machine at a predetermined frequency for a predetermined time longer than the rotation period.
- the diagnosis support apparatus acquires measurement data from the sound collector.
- the support apparatus extracts a reference data sequence for one cycle from the beginning of the first measurement data, extracts a comparison data sequence for one cycle while shifting the extraction position in the nth measurement data, The correlation degree of the comparison data series is calculated, the second measurement data is shifted using the extraction position with the largest correlation degree as the shift amount, and then added to the first measurement data ".
- Patent Document 2 discloses that “a method for diagnosing an abnormality occurring in the diagnostic object based on an acoustic signal generated from the diagnostic object, and the acoustic signal when the diagnostic object is in a normal state”. Based on the relationship between the sound pressure and the frequency or frequency band obtained by frequency analysis of the sound pressure of each of the frequencies or the frequency band and one or more other frequencies around the frequency or frequency band “Abnormality diagnosis method for obtaining a relative difference from a sound pressure corresponding to a frequency band as a relative sound pressure difference”.
- Patent Document 3 relates to a signal detection method for searching for and detecting a predetermined signal from a stored signal series or a signal similar to a part thereof, and can be applied to, for example, acoustic signal detection.
- the signal detection method there is known a signal search method for the purpose of detecting a location similar to the target signal in the accumulated signal, but because only local pruning is used.
- a disadvantage that it takes a long time to search.Based on the L1 distance, global grouping and local grouping are performed to make the search space efficient. By narrowing down to, there is an advantage that effective partial signal detection can be performed at high speed while maintaining the search system.
- the abnormal sound detection method, the feature amount, and the search for similar information emitted from the device have been worked on from the past.
- Patent Document 1 is an invention that, when an abnormality occurs, acquires a plurality of periodic data of acoustic data, synchronizes them, and then superimposes them to grasp the abnormality of the sound source that occurs periodically. For this reason, it is impossible to grasp an abnormality of a sound source that does not occur periodically, for example, an abnormal sound in which a phase change occurs. For this reason, it is impossible to detect an abnormality such as a small amplitude change, an air inlet clogging, or an initial abnormality.
- Patent Document 2 defines an abnormality determination level difference upper limit threshold and an abnormality determination level difference lower limit threshold based on the relationship between the sound pressure and the frequency or frequency band that can be obtained by frequency analysis of an acoustic signal, and diagnoses In some cases, diagnosis is performed using a frequency component or its sound pressure. Therefore, it is not possible to detect an abnormality in which abnormal sound does not appear in the frequency band and sound pressure value (size).
- Patent Document 3 is an invention for performing a search by making a histogram of feature amounts in order to perform a high-speed search using the L1 distance. Also, the color of the video is used as a feature amount.
- the L1 distance is defined as a distance based on a difference in distance based on the first power.
- An object of the present invention is to detect an abnormal sound in which an amplitude intensity (sound pressure) does not change or is small among abnormal sounds emitted from a device and a phase change occurs.
- a diagnosis focusing on a zero point is performed as a feature quantity used for abnormality diagnosis.
- the zero point is a zero crossing in the waveform in the time domain, and is a point where the energy becomes zero on the frequency domain.
- the density distribution of the size of the zeros is a distribution corresponding to the phase change. This is because the interval of zero crossings in the time domain appears on the complex plane as the size of the zero, and on the complex plane, the number of zeros can be counted for each size. That is, when the phase change does not occur, the distribution is uniquely determined, and when the phase change occurs, the zero point density distribution changes.
- the present invention calculates, for example, the size of a zero point of sound data for one cycle of the input signal in an abnormal sound detection system that performs abnormality diagnosis of the device using sound data collected from the device to be diagnosed as an input signal.
- the diagnosis by comparing the zero point size calculation unit, the zero point density distribution calculation unit for calculating the zero point density distribution from the zero point size, the zero point density distribution of the input signal, and the zero point density distribution of normal sound data And a normal / abnormal diagnosis unit that determines whether the target device is normal or abnormal.
- FIG. 1 is an example of a configuration diagram of an abnormal sound detection system.
- FIG. 2 is an example of a hardware configuration.
- the abnormal sound detection system 1 includes a one-cycle calculation unit 101, a zero point calculation unit 102, a zero point size calculation unit 103, a zero point density distribution calculation unit 104, an accumulated signal collation unit 105, and a normal / abnormal diagnosis unit. 106 and a zero point density database 107.
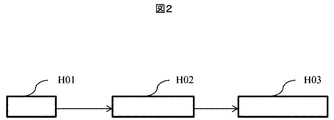
- the abnormal sound detection system 1 shown in FIG. 1 corresponds to the data processing unit H02 shown in FIG. 2, and the processing is realized by, for example, a computer or a microcomputer.
- the display 108 for displaying the result such as the density distribution shown in FIG. 1 corresponds to the output result display unit H03 in FIG.
- the abnormal sound detection system 1 uses the input signal I1 as an input to the one-cycle calculation unit 101, and the one-cycle calculation unit 101 cuts out one cycle of the input signal I1 as a signal for one cycle of the input signal. Output to the zero point calculation unit 102.
- the input signal I1 is sound data collected from the device to be diagnosed.
- the input means for the input signal I1 is directly input from the microphone H01 shown in FIG. 2 to the data processing unit H02, and the data logger from the microphone H01. A case where the data is input to the data processing unit H02 via, for example, can be considered.
- the zero point calculation unit 102 calculates a zero point from the signal corresponding to one cycle of the input signal calculated by the one period calculation unit 101, and outputs the calculated zero point to the zero point size calculation unit 103.
- the zero point is calculated by performing n-order polynomial approximation and solving the n-th order approximation.
- a method of numerical calculation reference document: numerical calculation method, written by Hideyo Nagashima
- a method using Lagrange interpolation is known.
- the zero point size calculation unit 103 calculates the size of the zero point from the zero point calculated by the zero point calculation unit 102. Zeros are defined as complex numbers. Therefore, the magnitude is calculated by taking the absolute value of the complex number.
- the zero size calculated by the zero size calculator 103 is input to the zero density distribution calculator 104.
- the zero density distribution calculation unit 104 calculates the zero density distribution from the input zero size data. Specifically, the ratio of the number of zeros having a specific zero point size to the total number of zeros is calculated. Zeros are calculated for the number of approximate orders. For example, when approximated to a sixth-order function, a maximum of six zeros are calculated. In addition, there are six periods of waveforms, and when approximated to a sixth-order function, the total number of zeros is 36.
- the zero point density distribution of the input signal I1 calculated by the zero point density distribution calculation unit 104 is output to the accumulated signal collation unit 105.
- the abnormal sound detection system 1 performs the same calculation in the one cycle calculation unit 101, the zero point calculation unit 102, the zero point size calculation unit 103, and the zero point density distribution calculation unit 104 even for the accumulated signal I2.
- the accumulation signal I2 is a normal sound collected when the device is in a normal state.
- the zero point density distribution of the accumulated signal I2 calculated by the accumulated signal I2 is recorded in the zero point density database 107.
- the accumulated signal collating unit 105 compares an accumulated signal for comparison with the zero density distribution of the input signal I1 calculated from the input signal I1 from the zero density distribution database of the accumulated signal I2 constructed in the zero density database 107.
- the zero density distribution of I2 is read, and the zero density distribution of the input signal I1 and the zero density distribution of the accumulated signal I2 are output to the normal / abnormal diagnosis unit 106.
- the zero density distribution of the accumulation signal I2 is accumulated as normal data.
- the normal / abnormal diagnosis unit 106 compares the zero point density distribution of the input signal I1 with the zero point density distribution of the accumulated signal I2, performs normal or abnormal diagnosis, and outputs a diagnosis result.
- a comparison method of the zero density distribution of the input signal I1 and the zero density distribution of the accumulated signal I2 a method of comparing by calculating a correlation coefficient between the zero density distribution of the input signal I1 and the zero density distribution of the accumulated signal I2. Etc. are considered.
- a correlation coefficient of 1.0 indicates that the correlation is strong, and that the accumulated signal I2 and the input signal I1 are the same, and the correlation coefficient When 0.0 is 0.0, it indicates that there is no correlation, and that the accumulated signal I2 and the input signal I1 are different.
- the correlation coefficient is already known as a method for statistically evaluating the degree of similarity between random variables.
- the threshold value for distinguishing between normal and abnormal using the correlation coefficient needs to be determined according to the device to be diagnosed, the device to be detected, the progress of failure, and the like. For example, the normal / abnormal determination threshold is set to 0.8. If the correlation coefficient is equal to or higher than the normal / abnormal determination threshold, it is determined to be normal, and if the correlation coefficient is less than the normal / abnormal determination threshold, it is determined to be abnormal.
- the display 108 displays a normal or abnormal determination result determined by the normal / abnormal diagnosis unit 106.
- the abnormal sound detection system 1 has a display control unit (not shown), and controls display on the display 108.
- the display 108 may also display other information together, as will be described later with reference to FIG.
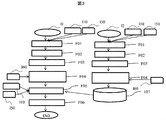
- FIG. 3 is an example of a system flowchart.
- the input signal I1 or the accumulated signal I2 the rotation speed I10 of the diagnosis target device, and the device name I50 of the diagnosis target device are input to the one cycle calculation unit 101.
- the input method of the rotation speed I10 and the device name I50 may be a keyboard, online, or the like, and the input method is not limited.
- the one-cycle calculation unit 101 calculates and outputs a signal for one cycle of the input signal (or one cycle of the accumulated signal).
- the zero point calculation unit 102 calculates and outputs the zero point in the zero point calculation step F02.
- the zero size calculation unit 103 calculates the size of the zero.
- the zero point density distribution calculation unit 104 calculates the zero point density distribution.
- the zero density distribution calculation unit 104 also receives a density distribution interval I60.
- the input method of the interval I60 may be input directly from the keyboard, online, or the like.
- the interval I60 is an interval for calculating the number of zero points for each density distribution calculation. For example, the interval I60 being 10 means that the size of the zero point is calculated in increments of 10.
- the accumulated signal collation unit 105 sends the zero point density distribution of the input signal I1 calculated in the zero point density distribution calculation step F04, the rotation speed I10 of the diagnosis target device corresponding to the input signal I1, and the input signal.
- the diagnosis target device name I50 corresponding to I1 is input, the rotation speed I10 of the diagnosis target device corresponding to the input signal I1, and the zero point density of the accumulated signal I2 corresponding to the diagnosis target device name I50 corresponding to the input signal I1
- the distribution is read from the zero density database 107.
- the normal / abnormal diagnosis unit 106 determines normal / abnormal.
- FIG. 4 is an example of processing of the one-cycle calculation unit.
- the one-cycle calculation unit 101 calculates one cycle of the input signal I1 from the rotation speed I10 of the input signal I1, the recording time I20, and the sampling frequency I30, cuts out one cycle, and outputs I40 for one cycle of the input signal. .
- the rotational speed is 60 (Hz)
- the recording time is 20 (seconds)
- the sampling frequency is 50000 (Hz)
- the rotational speed I10 is 60 (Hz)
- the recording time I20 is 20 (seconds)
- the sampling frequency I30 is 50000 (Hz) is input.
- the input means may be data such as a keyboard and online data.
- FIG. 4 the process in the case of the input signal I1 is shown as an example, but the process in the case of the accumulated signal I2 is the same.
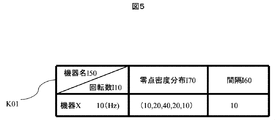
- FIG. 5 shows an example of the zero point density distribution data structure.
- the data configuration K01 of the zero point density database 107 shown in FIG. 5 includes a device name I50, a rotation speed I10, a zero point density distribution I70, and an interval I60.
- the rotational speed I10 either rpm, which is the rotational speed per minute, or Hz, which is the rotational speed per second, can be considered.
- rpm which is the number of revolutions per minute
- Hz which is the rotational speed per second
- the device X, the rotation speed 10 (Hz), and the zero point density distribution indicate that the interval of the zero point size is 10%, 20%, 40%, 20%, and 10% for every 10 respectively. ing.
- FIG. 6 is an example of a zero point density distribution.
- the horizontal axis indicates the size of the zero and the vertical axis indicates the zero density (%).
- the zero point density (%) is the ratio of the number of zeros having a specific zero size to the number of all zeros. For example, in FIG. 6, when the number of all zeros is 600, the number of zeros is 0 or more and less than 10 and 60, and similarly, the number of 10 or less and less than 20 is 120, 20 or more and 30.
- the density of zeros is less than 10 but less than 10 is 10 (%), less than 10 and less than 20
- the density is 20 (%), the density 20 to 30 is 40 (%), the density 30 to 40 is 20 (%), and the density 40 to 50 is 10 (%).
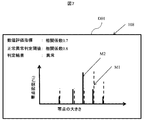
- FIG. 7 is an example of a zero density distribution display.
- a zero density distribution display D01 shown in FIG. 7 is an example of a screen displayed on the display 108.
- the zero point density distribution M1 of the input signal I1 is indicated by a dotted line
- the zero point density distribution M2 of the accumulated signal I2 corresponding to the input signal I1 is indicated by a solid line.
- the horizontal axis indicates the size of the zeros and the vertical axis indicates the zero point density (%). It is.
- FIG. 7 shows an example in which the index calculated by the normal / abnormal diagnosis unit 106 is also displayed.
- FIG. 8 shows an example of diagnosis of motor noise.
- FIG. 8 shows a case where the device to be diagnosed is a motor J01.
- a power source J02 for driving the motor is connected to the motor J01.
- the microphone H01 is installed near the motor J01.
- the sound (sound data) recorded from the microphone H01 is input to the data logger J03.
- the recorded sound input to the data logger J03 is input as an input signal I1 to the data processing unit H02, diagnostic processing is performed, and the diagnostic result is displayed on the output result display unit H03.
- a normal sound is recorded in advance as the accumulated signal I2, the zero density distribution of the accumulated signal I2 is calculated by the data processing unit H02, and recorded as zero point density distribution data in the zero density database 107.
- a method for collecting the accumulation signal I2 for example, there are a method of recording in a plurality of times every 60 seconds, and a method of continuously operating the device and accumulating signals.
- a method of inputting a plurality of times or a method of performing a diagnosis by inputting a signal while continuously operating can be considered.
- the abnormal sound that cannot be detected by the conventional method and does not cause the amplitude intensity (sound pressure) change is accompanied by a phase change. Abnormal sound can be detected.
Landscapes
- Physics & Mathematics (AREA)
- General Physics & Mathematics (AREA)
- Measurement Of Mechanical Vibrations Or Ultrasonic Waves (AREA)
- Testing Of Devices, Machine Parts, Or Other Structures Thereof (AREA)
Description
101 1周期計算部
102 零点計算部
103 零点大きさ計算部
104 零点密度分布計算部
105 蓄積信号照合部
106 正常/異常診断部
107 零点密度データベース
108 ディスプレイ
H01 マイク
H02 データ処理部
H03 出力結果表示部
F01 1周期計算ステップ
F02 零点計算ステップ
F03 零点大きさ計算ステップ
F04 零点密度分布計算ステップ
F05 蓄積信号照合ステップ
F06 正常/異常診断ステップ
I1 入力信号
I2 蓄積信号
I10 回転数
I20 収録時間
I30 サンプリング周波数
I40 入力信号1周期分
I50 機器名
I60 間隔
I70 零点密度分布
K01 零点密度分布データ構成
M01 零点密度分布
M1 入力信号の零点密度分布
M2 蓄積信号の零点密度分布
D01 零点密度分布表示
J01 モーター
J02 電源
J03 データロガー
Claims (4)
- 診断対象の機器から採取した音データを入力信号として前記機器の異常診断を行う異常音検出システムにおいて、
前記入力信号の1周期分の音データの零点の大きさを計算する零点大きさ計算部と、
前記零点の大きさから零点密度分布を計算する零点密度分布計算部と、
前記入力信号の零点密度分布と、正常な音データの零点密度分布とを比較して前記診断対象の機器が正常か異常かを判定する正常/異常診断部とを有することを特徴とする異常音検出システム。 - 前記正常/異常診断部は、前記入力信号の零点密度分布と前記正常な音データの零点密度分布との相関係数を計算し、前記相関係数と正常異常判定閾値とを比較することにより前記診断対象の機器が正常か異常かを判定することを特徴とする請求項1に記載の異常音検出システム。
- 前記診断対象の機器が正常か異常かの判定結果を表示させる表示制御部を有することを特徴とする請求項1または2に記載の異常音検出システム。
- 前記表示制御部は、前記入力信号の零点密度分布と、前記正常な音データの零点密度分布とを表示させることを特徴とする請求項3に記載の異常音検出システム。
Priority Applications (4)
| Application Number | Priority Date | Filing Date | Title |
|---|---|---|---|
| PCT/JP2012/068755 WO2014016914A1 (ja) | 2012-07-25 | 2012-07-25 | 異常音検出システム |
| GB1419256.1A GB2520628B (en) | 2012-07-25 | 2012-07-25 | Abnormal sound detection system |
| CN201280074211.9A CN104380063B (zh) | 2012-07-25 | 2012-07-25 | 异常音检测系统 |
| JP2014526650A JP5948418B2 (ja) | 2012-07-25 | 2012-07-25 | 異常音検出システム |
Applications Claiming Priority (1)
| Application Number | Priority Date | Filing Date | Title |
|---|---|---|---|
| PCT/JP2012/068755 WO2014016914A1 (ja) | 2012-07-25 | 2012-07-25 | 異常音検出システム |
Publications (1)
| Publication Number | Publication Date |
|---|---|
| WO2014016914A1 true WO2014016914A1 (ja) | 2014-01-30 |
Family
ID=49996750
Family Applications (1)
| Application Number | Title | Priority Date | Filing Date |
|---|---|---|---|
| PCT/JP2012/068755 Ceased WO2014016914A1 (ja) | 2012-07-25 | 2012-07-25 | 異常音検出システム |
Country Status (4)
| Country | Link |
|---|---|
| JP (1) | JP5948418B2 (ja) |
| CN (1) | CN104380063B (ja) |
| GB (1) | GB2520628B (ja) |
| WO (1) | WO2014016914A1 (ja) |
Cited By (3)
| Publication number | Priority date | Publication date | Assignee | Title |
|---|---|---|---|---|
| CN106531193A (zh) * | 2016-10-31 | 2017-03-22 | 济南中维世纪科技有限公司 | 一种背景噪声自适应的异常声音检测方法及系统 |
| CN112233692A (zh) * | 2020-09-28 | 2021-01-15 | 东莞市东纳通信有限公司 | 异音检测方法、装置、电子设备及存储介质 |
| CN115035913A (zh) * | 2022-08-11 | 2022-09-09 | 合肥中科类脑智能技术有限公司 | 一种声音异常检测方法 |
Families Citing this family (5)
| Publication number | Priority date | Publication date | Assignee | Title |
|---|---|---|---|---|
| CN104907132B (zh) * | 2015-06-01 | 2017-10-03 | 遵义市立新机械有限责任公司 | 一种锤式破碎机音频监测系统 |
| CN106023499B (zh) * | 2016-04-28 | 2018-05-22 | 北京北邮国安技术股份有限公司 | 一种光纤安防信号双重识别方法及系统 |
| JP2019164107A (ja) * | 2018-03-20 | 2019-09-26 | 本田技研工業株式会社 | 異音判定装置および判定方法 |
| GB2576309A (en) * | 2018-08-10 | 2020-02-19 | Green Running Ltd | Systems and methods for condition monitoring |
| CN109556818A (zh) * | 2018-12-03 | 2019-04-02 | 济南大学 | 一种基于声音标定的测定物料碰撞阻尼系数的方法及系统 |
Citations (2)
| Publication number | Priority date | Publication date | Assignee | Title |
|---|---|---|---|---|
| JPH10504107A (ja) * | 1994-08-15 | 1998-04-14 | モニタリング テクノロジー コーポレイション | 回転機械の共振を検出するためのエンコーダ信号のディジタル信号処理 |
| JP2012510585A (ja) * | 2008-11-28 | 2012-05-10 | スネクマ | 航空機エンジンの異常検出 |
Family Cites Families (4)
| Publication number | Priority date | Publication date | Assignee | Title |
|---|---|---|---|---|
| JP4247195B2 (ja) * | 2005-03-23 | 2009-04-02 | 株式会社東芝 | 音響信号処理装置、音響信号処理方法、音響信号処理プログラム、及び音響信号処理プログラムを記録した記録媒体 |
| JP2010030356A (ja) * | 2008-07-25 | 2010-02-12 | Fujitsu Ltd | ドア開放検出装置、マイクロフォン装置、ドア開放検出プログラムおよびドア開放検出方法 |
| CN100595548C (zh) * | 2008-09-05 | 2010-03-24 | 华南理工大学 | 基于稀疏表示的汽车发动机故障诊断系统和方法 |
| JP5452158B2 (ja) * | 2009-10-07 | 2014-03-26 | 株式会社日立製作所 | 音響監視システム、及び音声集音システム |
-
2012
- 2012-07-25 GB GB1419256.1A patent/GB2520628B/en not_active Expired - Fee Related
- 2012-07-25 WO PCT/JP2012/068755 patent/WO2014016914A1/ja not_active Ceased
- 2012-07-25 JP JP2014526650A patent/JP5948418B2/ja not_active Expired - Fee Related
- 2012-07-25 CN CN201280074211.9A patent/CN104380063B/zh not_active Expired - Fee Related
Patent Citations (2)
| Publication number | Priority date | Publication date | Assignee | Title |
|---|---|---|---|---|
| JPH10504107A (ja) * | 1994-08-15 | 1998-04-14 | モニタリング テクノロジー コーポレイション | 回転機械の共振を検出するためのエンコーダ信号のディジタル信号処理 |
| JP2012510585A (ja) * | 2008-11-28 | 2012-05-10 | スネクマ | 航空機エンジンの異常検出 |
Non-Patent Citations (2)
| Title |
|---|
| KESAAKI MINEMURA ET AL.: "Spectral Signal Representation of Vowels Using Power Series Expansion and Its Zeros", THE TRANSACTIONS OF THE INSTITUTE OF ELECTRONICS, INFORMATION AND COMMUNICATION ENGINEERS A, vol. J93-A, no. 12, 1 December 2010 (2010-12-01), pages 833 - 834 * |
| TAKASHI MANABE ET AL.: "Reverberation phase and zeros in a 1-D and 2-D sound fields", IEICE TECHNICAL REPORT. EA, ENGINEERING ACOUSTICS, vol. 95, no. 433, 15 December 1995 (1995-12-15), pages 23 - 28 * |
Cited By (4)
| Publication number | Priority date | Publication date | Assignee | Title |
|---|---|---|---|---|
| CN106531193A (zh) * | 2016-10-31 | 2017-03-22 | 济南中维世纪科技有限公司 | 一种背景噪声自适应的异常声音检测方法及系统 |
| CN112233692A (zh) * | 2020-09-28 | 2021-01-15 | 东莞市东纳通信有限公司 | 异音检测方法、装置、电子设备及存储介质 |
| CN115035913A (zh) * | 2022-08-11 | 2022-09-09 | 合肥中科类脑智能技术有限公司 | 一种声音异常检测方法 |
| CN115035913B (zh) * | 2022-08-11 | 2022-11-11 | 合肥中科类脑智能技术有限公司 | 一种声音异常检测方法 |
Also Published As
| Publication number | Publication date |
|---|---|
| JP5948418B2 (ja) | 2016-07-06 |
| GB2520628A (en) | 2015-05-27 |
| CN104380063B (zh) | 2017-04-12 |
| GB2520628B (en) | 2020-03-11 |
| CN104380063A (zh) | 2015-02-25 |
| JPWO2014016914A1 (ja) | 2016-07-07 |
| GB201419256D0 (en) | 2014-12-10 |
Similar Documents
| Publication | Publication Date | Title |
|---|---|---|
| JP5948418B2 (ja) | 異常音検出システム | |
| Zhao et al. | Health assessment of rotating machinery using a rotary encoder | |
| Liang et al. | A novel indicator to improve fast kurtogram for the health monitoring of rolling bearing | |
| US9791856B2 (en) | Fault frequency set detection system and method | |
| US8988238B2 (en) | Change detection system using frequency analysis and method | |
| JP6922708B2 (ja) | 異常検出用コンピュータプログラム、異常検出装置及び異常検出方法 | |
| CN104655380B (zh) | 一种旋转机械设备故障特征提取方法 | |
| JP5669933B2 (ja) | 機械振動の監視 | |
| JP2019100756A (ja) | 異常検出装置、異常検出方法及び異常検出用コンピュータプログラム | |
| CN114813124B (zh) | 一种轴承故障的监测方法及装置 | |
| US20140058615A1 (en) | Fleet anomaly detection system and method | |
| CN104008294B (zh) | 轴承异常检测系统及其方法 | |
| Bo et al. | Bearing multifault impulse detection using spike period volatility factor spectrogram | |
| EP3936849B1 (en) | Rolling bearing status monitoring system and status monitoring method | |
| Dong et al. | An early fault warning and diagnosis model based on a two-step analysis strategy for wind turbine bearings | |
| CN119574087B (zh) | 一种基于投影法的单传感转子叶片频率辨识方法 | |
| Abdelrhman et al. | Vibration analysis of multi stages rotor for blade faults diagnosis | |
| CN113960541A (zh) | 一种基于海量频域数据和移动平均法的雷达故障预警方法 | |
| JP2004361286A (ja) | 回転機械の劣化診断方法 | |
| US10066971B2 (en) | Rotation angle detection apparatus having function of detecting entry of foreign substance based on frequency characteristic of signals | |
| CN110191785B (zh) | 用于监测工业机器人的方法、装置和系统 | |
| Zhu et al. | Fault diagnosis of wind turbine rolling bearings based on DCS-EEMD-SSA | |
| CN111310298B (zh) | 合并离散时间信号 | |
| Zhang | Lock-in spectrum: a tool for representing long-term evolution of bearing fault in the time–frequency domain using vibration signal | |
| CN111695391B (zh) | 一种基于近似序列熵的滚珠轴承故障实时检测方法 |
Legal Events
| Date | Code | Title | Description |
|---|---|---|---|
| 121 | Ep: the epo has been informed by wipo that ep was designated in this application |
Ref document number: 12881796 Country of ref document: EP Kind code of ref document: A1 |
|
| ENP | Entry into the national phase |
Ref document number: 2014526650 Country of ref document: JP Kind code of ref document: A |
|
| ENP | Entry into the national phase |
Ref document number: 1419256 Country of ref document: GB Kind code of ref document: A Free format text: PCT FILING DATE = 20120725 |
|
| WWE | Wipo information: entry into national phase |
Ref document number: 1419256.1 Country of ref document: GB |
|
| NENP | Non-entry into the national phase |
Ref country code: DE |
|
| 122 | Ep: pct application non-entry in european phase |
Ref document number: 12881796 Country of ref document: EP Kind code of ref document: A1 |