WO2013069215A1 - 画像処理装置、画像処理方法、および画像ファイルのデータ構造 - Google Patents
画像処理装置、画像処理方法、および画像ファイルのデータ構造 Download PDFInfo
- Publication number
- WO2013069215A1 WO2013069215A1 PCT/JP2012/006767 JP2012006767W WO2013069215A1 WO 2013069215 A1 WO2013069215 A1 WO 2013069215A1 JP 2012006767 W JP2012006767 W JP 2012006767W WO 2013069215 A1 WO2013069215 A1 WO 2013069215A1
- Authority
- WO
- WIPO (PCT)
- Prior art keywords
- image
- slice
- axis
- unit
- slice image
- Prior art date
Links
Images


Classifications
-
- G—PHYSICS
- G06—COMPUTING; CALCULATING OR COUNTING
- G06T—IMAGE DATA PROCESSING OR GENERATION, IN GENERAL
- G06T15/00—3D [Three Dimensional] image rendering
- G06T15/10—Geometric effects
-
- A—HUMAN NECESSITIES
- A61—MEDICAL OR VETERINARY SCIENCE; HYGIENE
- A61B—DIAGNOSIS; SURGERY; IDENTIFICATION
- A61B5/00—Measuring for diagnostic purposes; Identification of persons
-
- G—PHYSICS
- G06—COMPUTING; CALCULATING OR COUNTING
- G06T—IMAGE DATA PROCESSING OR GENERATION, IN GENERAL
- G06T11/00—2D [Two Dimensional] image generation
- G06T11/20—Drawing from basic elements, e.g. lines or circles
-
- G—PHYSICS
- G06—COMPUTING; CALCULATING OR COUNTING
- G06T—IMAGE DATA PROCESSING OR GENERATION, IN GENERAL
- G06T15/00—3D [Three Dimensional] image rendering
- G06T15/08—Volume rendering
-
- A—HUMAN NECESSITIES
- A61—MEDICAL OR VETERINARY SCIENCE; HYGIENE
- A61B—DIAGNOSIS; SURGERY; IDENTIFICATION
- A61B2562/00—Details of sensors; Constructional details of sensor housings or probes; Accessories for sensors
- A61B2562/04—Arrangements of multiple sensors of the same type
- A61B2562/043—Arrangements of multiple sensors of the same type in a linear array
-
- A—HUMAN NECESSITIES
- A61—MEDICAL OR VETERINARY SCIENCE; HYGIENE
- A61B—DIAGNOSIS; SURGERY; IDENTIFICATION
- A61B2576/00—Medical imaging apparatus involving image processing or analysis
-
- A—HUMAN NECESSITIES
- A61—MEDICAL OR VETERINARY SCIENCE; HYGIENE
- A61B—DIAGNOSIS; SURGERY; IDENTIFICATION
- A61B5/00—Measuring for diagnostic purposes; Identification of persons
- A61B5/0059—Measuring for diagnostic purposes; Identification of persons using light, e.g. diagnosis by transillumination, diascopy, fluorescence
- A61B5/0073—Measuring for diagnostic purposes; Identification of persons using light, e.g. diagnosis by transillumination, diascopy, fluorescence by tomography, i.e. reconstruction of 3D images from 2D projections
-
- A—HUMAN NECESSITIES
- A61—MEDICAL OR VETERINARY SCIENCE; HYGIENE
- A61B—DIAGNOSIS; SURGERY; IDENTIFICATION
- A61B5/00—Measuring for diagnostic purposes; Identification of persons
- A61B5/01—Measuring temperature of body parts ; Diagnostic temperature sensing, e.g. for malignant or inflamed tissue
- A61B5/015—By temperature mapping of body part
-
- A—HUMAN NECESSITIES
- A61—MEDICAL OR VETERINARY SCIENCE; HYGIENE
- A61B—DIAGNOSIS; SURGERY; IDENTIFICATION
- A61B5/00—Measuring for diagnostic purposes; Identification of persons
- A61B5/05—Detecting, measuring or recording for diagnosis by means of electric currents or magnetic fields; Measuring using microwaves or radio waves
-
- A—HUMAN NECESSITIES
- A61—MEDICAL OR VETERINARY SCIENCE; HYGIENE
- A61B—DIAGNOSIS; SURGERY; IDENTIFICATION
- A61B5/00—Measuring for diagnostic purposes; Identification of persons
- A61B5/103—Detecting, measuring or recording devices for testing the shape, pattern, colour, size or movement of the body or parts thereof, for diagnostic purposes
- A61B5/1032—Determining colour for diagnostic purposes
-
- G—PHYSICS
- G16—INFORMATION AND COMMUNICATION TECHNOLOGY [ICT] SPECIALLY ADAPTED FOR SPECIFIC APPLICATION FIELDS
- G16H—HEALTHCARE INFORMATICS, i.e. INFORMATION AND COMMUNICATION TECHNOLOGY [ICT] SPECIALLY ADAPTED FOR THE HANDLING OR PROCESSING OF MEDICAL OR HEALTHCARE DATA
- G16H30/00—ICT specially adapted for the handling or processing of medical images
- G16H30/40—ICT specially adapted for the handling or processing of medical images for processing medical images, e.g. editing
Definitions
- the present invention relates to an image processing apparatus that visualizes information related to an object as an image, and an image processing method used in the apparatus.
- the laminated image information is not limited to information obtained by a relatively large-scale apparatus as described above, but can also be obtained by a cross-sectional shape measuring apparatus using visible light, laser, or the like.
- Information obtained in the above-mentioned technology becomes information in a three-dimensional space consisting of a two-dimensional plane composing a cross section and an axis perpendicular to it, so that it can be easily understood as a general two-dimensional image. It is difficult to visualize as much as possible.
- the simplest way is to display the two-dimensional information of the cross section while changing the position in the axial direction. In this case, it is difficult to grasp the size and position of the object in the axial direction.
- a method of acquiring data for each voxel and performing volume rendering has been put into practical use, but the resources and processing load required for data acquisition, storage, and image rendering increase, and the degree of freedom for data processing and manipulation There is a problem that is low.
- the present invention has been made in view of such problems, and an object thereof is to provide an image processing technique for easily visualizing layered image information.
- An aspect of the present invention relates to an image processing apparatus.
- the image processing apparatus includes a data acquisition unit that acquires distribution information of values obtained on a plurality of slice planes that intersect at the same angle at different positions on a predetermined axis, and a value at each position on the slice plane.
- a slice image generation unit that generates a slice image that represents distribution information as an image by determining a pixel value including an alpha value for each slice plane, and the slice image is arranged at a corresponding position on the axis.
- an image drawing unit that displays a three-dimensional space constituted by a plurality of slice planes as a three-dimensional object by performing alpha blending drawing according to the position.
- the “value obtained on the slice plane” may be a value actually measured by a sensor or the like, a value obtained by performing some calculation on the measured value, or calculated by CAD (Computer Aided Design) or a game. It may be a calculated value. Therefore, the “slice plane” may be either a plane or curved surface in real space, or a plane or curved line in virtual space.
- Another aspect of the present invention also relates to an image processing apparatus.
- This image processing apparatus uses a pixel value including an alpha value based on a value at each position on a slice plane for distribution information of values obtained on a plurality of slice planes intersecting at the same angle at different positions on a predetermined axis.
- a slice image storage unit that stores slice image data representing distribution information as an image generated by determining the slice image data from the slice image storage unit according to the input viewpoint position, and a drawing memory
- a plurality of slice images are arranged at corresponding positions on the axis in the order loaded in the drawing memory, and alpha blending drawing is performed.
- An image drawing unit for displaying a three-dimensional space constituted by slice planes as a three-dimensional object. And wherein the door.
- Still another aspect of the present invention relates to an image processing method.
- This image processing method includes a step of obtaining distribution information of values obtained on a plurality of slice planes intersecting at the same angle at different positions on a predetermined axis in an image processing apparatus, and values at each position on the slice plane Generating slice image data representing distribution information as an image by determining a pixel value including an alpha value based on each slice plane, arranging each slice image at a corresponding position on the axis, and And a step of displaying a three-dimensional space constituted by a plurality of slice planes as a three-dimensional object on a display device by performing alpha blending drawing according to the input viewpoint position.
- Still another aspect of the present invention relates to the data structure of an image file.
- the data structure of this image file includes an alpha value based on the values at each position on the slice plane for distribution information of values obtained on a plurality of slice planes that intersect at the same angle at different positions on a predetermined axis.
- a data structure of an image file in which data of a slice image representing distribution information as an image generated by determining a pixel value is associated with a direction of an axis and a position on the axis.
- a slice image is arranged at a corresponding position on the axis, and alpha blending is drawn according to the input viewpoint position, thereby displaying a three-dimensional space composed of a plurality of slice planes as a three-dimensional object on a display device. In order to do so, it is loaded into a memory.
- the laminated image information can be easily visualized in a form desired by the user at low resource cost.
- FIG. 1 shows another example of the method of determining the alpha value of a slice image in S12 of FIG. It is a figure for demonstrating the method of suppressing generation
- It is a flowchart which shows the process sequence in which a display process part performs the display process of a three-dimensional object in this Embodiment. It is a figure which shows typically a mode that an image drawing part performs alpha blending drawing in S40 of FIG. It is a flowchart which shows the process sequence which calculates
- FIG. 10 is a diagram for describing processing in which a slice image management unit determines necessary slice image data according to a viewpoint in S34 of FIG. 9. It is a figure for demonstrating the example of the method of determining the angle of the boundary line which switches a slice image in this Embodiment. It is a figure for demonstrating another method of drawing a three-dimensional object in this Embodiment. It is a figure which shows typically the process sequence which draws a three-dimensional object after drawing an additional object previously in this Embodiment. It is a figure which shows typically the process sequence of another method which draws an additional object in this Embodiment.
- FIG. 1 shows a configuration example of an image processing system to which the image processing technology of this embodiment can be applied.
- the image processing system 10 includes N sensor groups 12 each including predetermined sensors 12_1, 12_2,... 12_N, an image processing device 20 that acquires and visualizes measurement results from each sensor, and a user performs image processing.
- An input device 15 for inputting instructions to the device 20 and a display device 14 for displaying an image generated by the image processing device 20 are included.
- the image processing device 20, the sensor group 12, and the display device 14 may be connected by a wired cable, or may be wirelessly connected by a wireless LAN (Local Area Network) or the like. Any two or all of the sensor group 12, the image processing device 20, and the display device 14 may be combined and integrally provided.
- a wireless LAN Local Area Network
- the processing performed by the image processing apparatus 20 includes a step of generating basic two-dimensional image data from the measurement result and a step of generating a display image from the two-dimensional image data, which can be performed independently. Therefore, all of the image processing device 20, the sensor group 12, and the display device 14 may not be connected at the same time.
- the display device 14 may be a device that displays an image alone, such as a liquid crystal display or a plasma display, or may be a combination of a projector that projects an image and a screen.
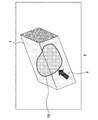
- the N sensors 12_1, 12_2,..., 12_N each acquire a predetermined physical quantity as a distribution in a plurality of planes at a predetermined position and orientation, such as the plane 18 that crosses the object 16.
- the predetermined physical quantity is information such as color, temperature, moisture content, hardness, etc. that can be obtained by using general sensing technology using visible light, X-rays, magnetism, electricity, ultrasonic waves, etc. It is not limited.
- the arrangement and shape of the sensors 12_1, 12_2,..., 12_N are merely examples, and it is understood by those skilled in the art that various modes are conceivable depending on the sensing technology used.
- the image processing apparatus 20 integrates physical quantity distributions on a plurality of planes measured by the sensor group 12 and visualizes a measurement space in which the planes are stacked as a three-dimensional object.
- the object can be viewed from an arbitrary direction in response to a viewpoint movement request received from the user via the input device 15.
- the image processing apparatus 20 comprehensively controls the entire image processing system 10 such as controlling a plane from which the sensor group 12 obtains a physical quantity and controlling display on the display device 14.
- a sensing device including the sensor group 12 and having a mechanism for controlling the measurement processing by the sensors and the output of the laminated image information may be introduced separately from the image processing device 20.
- the sensing device may image the physical quantity distribution measured by the sensor, and the image processing device 20 may acquire the image data.
- a distribution of pixel values such as RGB is obtained.
- such a pixel value is similarly treated as a “physical quantity”.
- the display device 14 displays an image including a three-dimensional object generated as a result of visualizing the physical quantity distribution by the image processing device 20.
- the input device 15 includes a viewpoint movement request for the three-dimensional object displayed on the display device 14, a physical quantity measurement start by the sensor group 12, a measurement result acquisition start, an image and data processing, and a display device.
- a request for starting object display by 14 is received from the user and notified to the image processing apparatus 20.
- the input device 15 may be any of general input devices such as a keyboard, a controller, and a joystick in addition to the illustrated mouse, and may be a touch panel mounted on the screen of the display device 14.
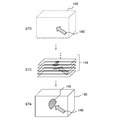
- FIG. 2 schematically shows a form of information acquired by the image processing apparatus 20 as a result of measurement by the sensor group 12.
- Each sensor included in the sensor group 12 acquires a distribution of a predetermined physical quantity with respect to a plurality of planes 19a, 19b,..., 19n perpendicular to a predetermined axis (z axis) as shown in FIG. It is assumed that the planes 19a, 19b,..., 19n are at different positions with respect to the z axis and in the same range with respect to the xy plane perpendicular thereto.
- the direction in which the plane for acquiring the physical quantity distribution by the sensor group 12 is moved as the z-axis in the figure is referred to as “sensor axis”, and the plane is referred to as “slice plane”.
- the sensor group 12 may be provided so that a plurality of sensor axes can be set.
- a plurality of slice plane groups are set for each sensor axis, and a physical quantity distribution is obtained for each plane.
- the slice plane is perpendicular to the sensor axis.
- the slice plane is not necessarily perpendicular depending on the physical quantity to be measured and the structure of the sensor.
- the “distribution” is obtained as a value for such a position coordinate on each slice plane
- the sensor group 12 includes N sensors 12_1, 12_2,..., 12_N as shown in FIG. N values for a certain position on the plane are obtained.
- the information acquired by the image processing apparatus 20 includes position coordinates (x, y) for each of a plurality of positions P1, P2,... Set for each slice plane 19a, 19b,.
- N-valued vector values (V_1, V_2,..., V_N) are associated with each other.
- the positions P1, P2,... May actually be set at intervals of about a general pixel, and depending on the resolution of the sensor, etc., the positions P1, P2,.
- Vector values of the same number of dimensions are obtained for P2,.
- the sensor group 12 may repeat measurement at predetermined time intervals, and the image processing apparatus 20 may acquire the information shown in FIG. 2 at each time.
- the finally displayed three-dimensional object is a moving image that changes over time.
- FIG. 3 shows an example of an image generated by the image processing device 20 and displayed on the display device 14.
- Image example 4 is a visualization of the measurement information shown in FIG. 2, and is displayed in a state in which the object 16 is present inside the three-dimensional object 6 indicating the measurement space. Since the user can move the virtual viewpoint by rotating the input device 15 and rotate the three-dimensional object 6 to a desired angle, the user can check the back side and the side surface of the object.
- the transmittance of a desired area such as the area other than the object 16 and the area of the object 16 in the three-dimensional object 6 can be changed by a user operation to be transparent or translucent. Thereby, even when there are a plurality of objects, the positional relationship and size thereof can be observed from a desired direction.
- a region other than the target object of the three-dimensional object is displayed so as to be transparent, the three-dimensional object cannot be viewed, and only the target object can be viewed. In the following description, it is referred to as “three-dimensional object” including such a transparent region.
- the three-dimensional object 6 is a moving image, the movement of the target object and the generation of a new target object can be observed.
- an object different from the measurement result such as an arrow-shaped cursor 8 can be displayed in a state of entering the inside of the three-dimensional object 6.
- FIG. 4 shows the configuration of the image processing apparatus 20 in detail.
- each element described as a functional block for performing various processes can be configured by a CPU (Central Processing Unit), a GPU (Graphics Processing Unit), a memory, and other LSIs.
- CPU Central Processing Unit
- GPU Graphics Processing Unit
- memory and other LSIs.
- program for performing image processing it is realized by a program for performing image processing.
- the image processing apparatus 20 performs transmission / reception control of data with other apparatuses in the image processing system 10. However, since general techniques can be applied to such processing, illustration is omitted here. ing.
- the image processing apparatus 20 acquires output information from the sensor, generates an image data generation unit 30 that generates 2D image data used for display, and a display processing unit 32 that draws a 3D object using the 2D image data. including.
- an image data generation unit 30 that generates 2D image data used for display
- a display processing unit 32 that draws a 3D object using the 2D image data. including.
- the image data generation unit 30 is different from a sensor output data acquisition unit 42 that acquires output data from the sensor group 12, a slice image generation unit 44 that generates data of a two-dimensional image for each slice plane from which a distribution is acquired, and a sensor axis.
- An image axis conversion unit 50 that generates similar two-dimensional image data for a plurality of planes having a predetermined angle with the axis, a vector value information storage unit 46 that stores data generated by the sensor output data acquisition unit 42, and a slice image A slice image storage unit 48 that stores data generated by the generation unit 44 and the image axis conversion unit 50 is included.
- the sensor output data acquisition unit 42 acquires physical quantity distribution information for each slice plane from the sensor group 12, and generates vector value information in which position coordinates and vector values are associated as shown in FIG.
- the vector value information is temporarily stored in the vector value information storage unit 46 in association with the slice plane identification information, and the fact is notified to the slice image generation unit 44 and the image axis conversion unit 50.
- the identification information of the slice plane is constituted by the orientation of the sensor axis and the position on the sensor axis.
- the slice image generation unit 44 generates two-dimensional image data that is the basis of the three-dimensional object for each slice plane based on the vector value information stored in the vector value information storage unit 46.
- a two-dimensional image is referred to as a “slice image”.
- the slice image holds an alpha value representing the transmittance in addition to the color space information for each pixel.
- slice images are arranged in the sensor axis direction, and alpha blending drawing is performed so that the inside of the three-dimensional object can be seen through.
- the color space information and alpha value setting method will be described in detail later.
- the generated slice image data is stored in the slice image storage unit 48 in association with the slice plane identification information. There is also a method of calculating the alpha value from the pixel value of the slice image. In this case, if the alpha value is calculated in the drawing unit and used for blending, it is not necessary to store the alpha value in the slice image storage unit.
- the image axis conversion unit 50 has a predetermined angle with respect to each of an x axis and a y axis orthogonal to a predetermined axis different from the sensor axis, for example, when the z axis is a sensor axis as shown in FIG.
- a plurality of planes are generated, and vector value information similar to that shown in FIG. 2 is generated for each plane. That is, data is reconstructed as a distribution for the plane by picking up values corresponding to positions on planes with different orientations from physical values on the slice plane measured by the sensor group 12.
- two-dimensional image data corresponding to each plane is generated by the same processing as the slice image generation unit 44.
- this two-dimensional image is also referred to as a “slice image”, but the axis relative to the plane at this time is referred to as an “image axis” and is distinguished from a “sensor axis”.
- the slice image data generated by the image axis conversion unit 50 is also stored in the slice image storage unit 48 in association with the orientation of the image axis and the position on the axis.
- the display processing unit 32 additionally displays a slice image management unit 52 that manages slice images used for drawing according to the position of the viewpoint, a drawing memory 56 that sequentially stores image data necessary for drawing, a cursor, and the like.
- An additional object image storage unit 58 that stores object image data and an image drawing unit 54 that draws a three-dimensional object using slice image data are included.
- the slice image management unit 52 switches the axis of the slice image used for drawing by moving the viewpoint, and reads necessary slice image data from the slice image storage unit 48 to the drawing memory 56.
- the slice image storage unit 48 may also serve as the drawing memory 56.
- the drawing process is performed while loading the data gradually.
- the slice image management unit 52 further performs interpolation between slice images in accordance with a decrease in the distance between the viewpoint and the three-dimensional object.
- Slice images are generated at discrete positions on the sensor axis or the image axis, and when the viewpoint approaches the object, the discontinuity becomes easy to be visually recognized. Therefore, a new slice image having a pixel value for interpolating the pixel values of adjacent slice images with respect to the position on the axis is generated.
- the generated slice images are inserted between the original slice images, and the discontinuity is made inconspicuous by narrowing the interval between the slice images.
- the number of slice images to be inserted may be gradually increased so as to be inversely proportional to the distance to the viewpoint, or may be increased stepwise by comparing the distance with a threshold value.
- the image drawing unit 54 draws a notification that the necessary slice image data has been loaded into the drawing memory 56 from the slice image management unit 52, and draws a three-dimensional object using the data.
- each slice image is arranged at each position on the axis, and superposition is performed by sequentially projecting the slice image far from the viewpoint onto the screen coordinates.
- the three-dimensional object in the measurement space represented in this way becomes transparent or semi-transparent, for example, in a space without an object, depending on the setting of the alpha value. Therefore, the image drawing unit 54 further draws an additional object such as a cursor in such a space.
- the additional object can be moved by the user via the input device 15, or moved or generated following the target object. Therefore, the image drawing unit 54 calculates the display position of the additional object according to these modes, reads out the image data to the drawing memory 56, and draws it. Furthermore, the image drawing unit 54 may realize a stereoscopic view by performing the same three-dimensional object drawing process for a plurality of viewpoints. The relative position of the viewpoint in this case can be determined as appropriate according to the stereoscopic method to be introduced.
- FIG. 5 is a flowchart illustrating a processing procedure in which the image data generation unit 30 generates slice image data.
- the sensor output data acquisition unit 42 acquires, from the sensor group 12, distributions of N physical quantities for a plurality of slice planes of the sensor axis in accordance with a user instruction or the like via the input device 15, and positions on each plane.
- vector value information that associates a vector value composed of a set of physical quantities with each other (S10).
- the vector value included in the vector value information may not be the N physical quantities transmitted from the sensor group 12.
- unnecessary physical quantities may be excluded from the elements in view of the information to be displayed in the end, or values obtained as a result of operations performed on different physical quantities may be added as new elements of vector values.
- masking by threshold determination may be performed, for example, when a certain physical quantity exceeds a threshold value, another physical quantity is set to 0. For example, this method is effective when displaying only an object below a certain temperature.
- the slice image generation unit 44 determines an alpha value based on the vector value for each pixel of the two-dimensional array set on each slice plane (S12). A specific method for determining the alpha value will be described later. Furthermore, the slice image generation unit 44 determines color information for each pixel based on the vector value, thereby generating slice image data that holds the color information and the alpha value as the pixel value, and stores the data in the slice image storage unit 48. (S14).
- the color information color system such as RGB and YCbCr is not limited. Further, as described above, when the alpha value is generated from the slice image at the time of drawing in the image drawing unit 54, the slice image generating unit 44 does not need to set the alpha value, so the slice image storage unit 48 does not store the alpha value. .
- Color information is determined according to rules set in advance according to the type of physical quantity and display purpose.
- the values measured by the three sensors 12_1, 12_2, and 12_3 may be expressed as RGB as red luminance, green luminance, and blue luminance, respectively.
- the substance whose physical quantity measured by the sensor 12_1 increases is red
- the substance whose physical quantity measured by 12_2 increases is green
- the substance whose physical quantity measured by 12_3 increases is blue. Appears strongly and can be color-coded by substance.
- a single value measured by a certain sensor 12_1 may be substituted for all of R, G, and B, and the physical quantity may be represented by white luminance.
- the rules for determining the alpha value and the color information are appropriately determined by the user according to the display contents and display purpose, and stored in a memory (not shown). Alternatively, it may be set on the spot via the input device 15 while confirming the actual display.
- the processing in S12 and S14 is repeated until all slice images for the sensor axis are generated (N in S16, S12, S14).
- the image axis conversion unit 50 prepares a plurality of slice planes with respect to a predetermined image axis at positions where physical quantities are obtained, and a vector composed of a position on each plane and a set of physical quantities Vector value information in which values are associated is generated for each image axis (Y in S16, N in S18, S20, S10).
- the process of determining the alpha value and color information for the pixels set on each plane and generating and storing slice images is repeated until all slice images for each axis are generated (S12, S14, N of S16).
- slice images When all slice images have been generated for all image axes (Y in S18), the processing from S10 to S20 is repeated (N in S22) if the physical quantity can be acquired by another sensor axis. If slice images are generated for all sensor axes, the process is terminated (Y in S22). In order to suitably draw a three-dimensional object to be finally displayed in the present embodiment, it is desirable to prepare slice images for three axes. Most simply, slice images are generated with respect to the x-axis, y-axis, and z-axis that are orthogonal to each other. Any of these three axes may be used as the image axis, or the image axis may not be included.
- the image axis conversion unit 50 does not need to perform processing as long as the three axes in the direction can be measured as sensor axes.
- the image axis conversion unit 50 when the sensor axis is only in one direction, the image axis conversion unit 50 generates slice images for the other image axes, and the branch of S22 is eliminated.
- the image axis conversion unit 50 When the sensor axis is two directions, the image axis conversion unit 50 generates a slice image using the remaining one direction as an image axis. For example, the setting of the image axis is appropriately changed according to the direction that can be set as the sensor axis and the number thereof. Good.
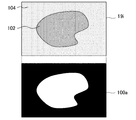
- FIG. 6 shows an example of a method for determining the alpha value of the slice image in S12 of FIG.
- the upper side of the drawing schematically represents vector value information in a certain slice plane 19i, and the lower side schematically represents an alpha value set in the corresponding slice image 100a.
- the slice plane 19i for example, at least one of the vector values greatly changes in the region 102 where the object exists and the other region 104.
- the difference is represented by two types of shading.
- Th is a predetermined threshold value
- A is an alpha value given to each pixel. That is, the alpha value is 0 if the maximum value of the vector values (V_1, V_2,..., V_N) is smaller than the threshold value Th, and the alpha value is 1 if it is greater than or equal to the threshold value Th.
- the region 102 has an alpha value of 1 and the region 104 has an alpha value of 0 in white and black, respectively.
- the position where the vector value is held in the slice plane of the vector value information may be different from the position where the pixel is defined in the slice image. In this case, the alpha value is determined at the former position and is interpolated accordingly. The value for each pixel is determined.
- conditional branching may be performed after a physical quantity to be subjected to branch determination is selected.
- a physical quantity that increases in the range of the object is included in the vector value and an alpha value is given by such conditional branching, the area without the object becomes transparent and the area with the object becomes opaque.
- ⁇ blending is drawn, only the area without the object can be viewed from the other side.
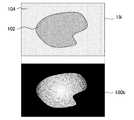
- FIG. 7 shows another example of a technique for determining the alpha value of a slice image.
- the way of representing the figure is the same as in FIG.
- the alpha value is 0 as in FIG. When this occurs, this maximum value itself is taken as the alpha value.
- each physical quantity constituting the vector value is normalized.
- the fact that the alpha value of the region 102 changes in the range of Th ⁇ A ⁇ 1 is represented by gradation.
- a change in physical quantity inside the object can be represented by a color transmittance.
- the alpha value near the contour of the object can be changed gently, so that even if jaggy or noise occurs in the contour, it is less noticeable.
- the alpha value can be changed according to the magnitude of the physical quantity constituting the vector value in an area where there is no object.
- the ambient temperature and ambient humidity of the object can be represented by color transmittance.
- conditional branches are the same as those shown in FIG. 6 and FIG. 7 except that one physical quantity V_i is subject to branch determination.
- one physical quantity V_i is subject to branch determination.
- the substance to be displayed as the object can be switched by switching the target physical quantity V_i.
- Th1 and Th2 may be provided, and the following conditional branch may be set. if max (V_1, V_2, ..., V_N) ⁇ Th2
- the vector value is predetermined.
- it falls within the intermediate range, it is made transparent with an alpha value of 0.
- the physical quantity acquired by one sensor is small and the physical quantity acquired by another sensor is large in the area of the target object, if either sensor reacts, they are all displayed as the target object. Applicable when you want to
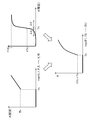
- FIG. 8 is a diagram for explaining a technique for suppressing the generation of such noise in setting the alpha value.
- the upper left graph shows the maximum value of vector values on the horizontal axis and the alpha value A determined by the conditional branch shown with reference to FIG. 7 on the vertical axis.
- the final alpha value A is determined by converting the alpha value determined in the conditional branch according to a predetermined rule. Therefore, the alpha value of the graph is a provisional value as shown in the figure.
- the provisional value of the alpha value A is zero.
- the provisional value of the alpha value A becomes the maximum value Th.
- a final alpha value A is calculated by applying a function f (A) as shown in the upper right of the figure.
- the function f (A) for example, rises gently from 0 at a provisional value of an alpha value that is smaller than the threshold Th by a predetermined width ⁇ A, and further 1 while the provisional value becomes larger than the threshold Th by a predetermined width ⁇ A. It is a function that reaches When the value obtained from such a function is multiplied by the provisional value of the alpha value A, a graph shown in the lower part of the figure is obtained.
- the alpha value A when the maximum vector value shown on the horizontal axis is smaller than the threshold value Th, the alpha value A is 0 like the provisional value.
- the alpha value A is kept smaller than the provisional value as a result of multiplying the provisional value Th by f (Th).
- the function f (A) is optimized according to the noise generation rate in the actual display image. Note that the alpha value A may be a value output by substituting the provisional value of the alpha value A into the function f.
- the previous alpha value setting method has been relatively simple based on conditional branching.
- an alpha value may be prepared in advance for the position coordinates in the N-dimensional space composed of N physical quantities constituting the vector value.
- the conditional branch may be complicated.
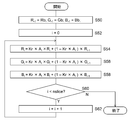
- FIG. 9 is a flowchart showing a processing procedure in which the display processing unit 32 performs display processing of a three-dimensional object.
- the slice image management unit 52 sets a predetermined viewpoint coordinate to display an initial image of the three-dimensional object as an initial viewpoint
- the slice image data necessary for drawing the three-dimensional object from the viewpoint is loaded into the drawing memory 56 (S32, S34).
- the drawing memory 56 S32, S34
- the slice image management unit 52 adjusts the amount of the slice image according to the distance between the viewpoint and the three-dimensional object (S36).
- a new slice image for interpolation is generated, it is stored in the drawing memory 56.
- the image data itself is inserted between the data of the preceding and succeeding slice images or is associated with the position on the axis so that the position of the insertion destination can be identified.
- the image drawing unit 54 draws an additional object to be displayed inside the three-dimensional object in response to an instruction input from the user via the input device 15 (S38).
- the additional object is a cursor that is moved by the user's operation, a marker that is displayed in contact with the object, a line that represents the trajectory of the object, and the like, which can be selected by the user.
- the image drawing unit 54 determines the position for displaying the additional object based on the designation by the user, the outline of the target obtained by the edge extraction process, and the like, and uses the image data loaded in the drawing memory 56 to use the additional object. Draw.
- the image drawing unit 54 draws a three-dimensional object representing the measurement space by superimposing the slice images loaded in the drawing memory 56 by alpha blending in order from the viewpoint (S40).
- the drawing process of the additional object in S38 may be performed simultaneously with the alpha blending drawing in S40.
- FIG. 10 schematically shows how the image drawing unit 54 performs alpha blending drawing in S40 of FIG. From the side closer to the viewpoint 114, the screen 116, slice images 110a, 110b,. At this time, the image projected on the point 115 on the screen 116 is an intersection 112a, 112b,... Of the line of sight 119 passing through the viewpoint 114 and the point 115 and the slice images 110a, 110b,. , 112n, 117 are superimposed from the viewpoint 114. In the case of the figure, the intersections 117, 112n,..., 112b, 112a are in this order.
- FIG. 11 is a flowchart showing a processing procedure for obtaining RGB values at the point 115 on the screen shown in FIG.
- variables Ri, Gi, Bi i is an integer equal to or greater than ⁇ 1
- the RGB values Rb, Gb, Bb at the intersection 117 of the background 118 are substituted for R ⁇ 1 , G ⁇ 1 , B ⁇ 1 , respectively.
- S50 When the RGB value and the alpha value of the intersection 112n on the slice image 110n farthest from the viewpoint are (R 0 , G 0 , B 0 , A 0 ), the intersection 117 of the background 118 and the intersection 112n on the slice image 110n are overlapped.
- the RGB values are as follows (S52, S54, S56, S58).
- Kr, Kg, and Kb are coefficients of alpha values for red, green, and blue, respectively, when the alpha value held in the slice image is adjusted by color, and in the range of 0 ⁇ K ⁇ 1, as necessary.
- R ′ k Kr ⁇ A k ⁇ R k + (1 ⁇ Kr ⁇ A k ) ⁇ R ′ k ⁇ 1
- G ′ k Kg ⁇ A k ⁇ G k + (1 ⁇ Kg ⁇ A k ) ⁇ G ′ k ⁇ 1
- B ′ k Kb ⁇ A k ⁇ B k + (1 ⁇ Kb ⁇ A k ) ⁇ B ′ k ⁇ 1 ...
- the RGB values after superposition are set as (R ′ k , G ′ k , B ′ k ), and are distinguished from the RGB values (R k , G k , B k ) of only the k + 1-th slice image.
- the final RGB value (R ' nslice-1 , G' nslice-1 , B ' nslice-1 ) can be expressed by a linear combination of RGB values for each slice image as follows.
- (Br i , Bg i , Bb i ) are coefficients of the RGB values (R i , G i , B i ) of the i + 1-th slice image, and are calculated from the alpha values of the slice image.
- a final factor used (Br i, Bg i, Bb i) Equation 3 in terms of the previously obtained according to the viewpoint RGB values may be calculated.
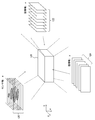
- FIG. 12 is a diagram for explaining processing in which the slice image management unit 52 determines necessary slice image data in accordance with the viewpoint in S34 of FIG.
- the slice image is an image of the distribution of physical quantities at discrete positions with respect to a predetermined axis.
- the slice image that is basically generated is a plurality of parallel planes that form the xy plane like the slice image group 120.
- a slice image is generated for an image axis different from the sensor axis, or a physical quantity is measured for a plurality of sensor axes to generate a slice image group for the plurality of axes.
- the slice image group used by movement is switched.
- a slice image group 122 having the x axis as the image axis and a slice image group 124 having the y axis as the image axis are prepared.
- the three-dimensional space around the three-dimensional object 126 to be displayed is divided, and the slice image group used for drawing is switched depending on in which division the viewpoint is located. For example, as indicated by the dotted lines in the figure, from each vertex of the three-dimensional object 126, a boundary line that makes a predetermined angle with the three sides of the three-dimensional object 126 forming the vertex is set. An approximately trapezoidal space having these boundary lines as side edges and each surface of the three-dimensional object as an upper surface is defined as one section.
- the slice image group 120 having the z axis as an axis is used for drawing.
- the slice image group 122 having the x axis as an axis is used for drawing.
- the slice image group 124 with the y axis as an axis is used for drawing.
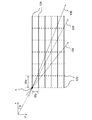
- FIG. 13 is a diagram for explaining an example of a method for determining the angle of the boundary line.
- the x-axis and the y-axis are axes.
- This figure shows a state in which a slice image group 122 (dotted line) with the x axis as an axis and a slice image group 124 (solid line) with the y axis as an axis are arranged on the same xy plane and viewed from the z-axis direction.
- the line of sight passing through the vertex v changes as indicated by arrows 128, 129, and 130 depending on the position of the viewpoint.
- the number of slice image groups having an intersection with each line of sight is as follows in the order of the slice image group 122 having the x axis as the axis and the slice image group 124 having the y axis as the axis.
- Line of sight of arrow 128 4/6 sheets
- Line of sight of arrow 129 6/6 sheets
- Line of sight of arrow 130 7/6 sheets
- the same display image is obtained because the same number of alpha blending processes are performed regardless of which slice image group data is used. Therefore, the display image before and after switching is continuously connected by setting the direction of the arrow 129 as a boundary line.
- the angle ⁇ of the arrow 129 is
- Wy / Wx. In order to satisfy, the slice image group is switched under the following conditions.
- the line-of-sight vector serving as the boundary of the above conditions corresponds to the boundary line indicated by the dotted line in FIG.
- the sensor axis or the image axis is perpendicular to the slice image.
- the present embodiment is not limited thereto.
- the slice image generated by the image axis conversion unit 50 by reconstructing the measurement value may not be perpendicular to the image axis.
- the sensor axis and the image axis may not be orthogonal.
- the boundary line can be set based on the same theory as described above, and the slice image switching and the alpha blending drawing process according to the viewpoint are the same.
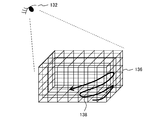
- FIG. 14 is a diagram for explaining another method of drawing a three-dimensional object.
- slice image groups for the x-axis, y-axis, and z-axis are simultaneously used as texture images in three directions.
- a general computer graphics drawing process can be applied to the method of drawing the three-dimensional object 136 with the texture pasted on each surface in accordance with the position of the viewpoint 132.
- the slice image in each direction has an alpha channel as described above, superposition from pixels far from the viewpoint 132 is necessary.
- the three-dimensional object 136 is divided into a lattice shape by a slice image group in three directions.
- straight lines intersecting each other represented in the three-dimensional object 136 represent the edge of each slice image. If the target is a three-dimensional array of small rectangular parallelepipeds obtained by such division, the order far from the viewpoint 132 can be easily specified.
- the three-dimensional object 136 can be expressed in a transparent and translucent state by superimposing it on the screen using the pixel values of slice images constituting the surfaces of the rectangular parallelepipeds in the order of the arrows 138.
- the slice image management unit 52 loads data of slice image groups in three directions regardless of the position of the viewpoint.
- FIG. 15 schematically shows a processing procedure for drawing a three-dimensional object after drawing an additional object first as one method.
- a virtual rectangular parallelepiped 142 in which a three-dimensional object is finally drawn is prepared according to the position of the viewpoint, and the additional object 140 is drawn at a required position inside the rectangular parallelepiped 142 by a general method (S70). .
- the additional object 140 is an arrow-shaped cursor figure.
- a three-dimensional object is drawn using the slice image by the above method (S72). By drawing the additional object 140 first, the additional object 140 remains as it is in an area where the alpha value is close to 0 and the transmittance is high.
- the state where the cursor is floated as the additional object 140 in the three-dimensional object 146 can be drawn (S74).
- a presentation using display can be suitably performed.
- the moving object is displayed as a moving image with time, the locus of the object may be displayed.
- another target product
- the calculation of the position of the product may be performed separately, and the user may input as an input value.
- FIG. 16 schematically shows a processing procedure of another method for drawing an additional object.
- the drawing of the three-dimensional object using the slice image and the drawing of the additional object are advanced in parallel.
- alpha blending drawing using a slice image is advanced to a position where an additional object is drawn (S80).
- the additional object portion 152a that should be in the space from the uppermost slice image 150a to the next slice image is drawn (S82).
- the slice image 150b positioned next to the slice image 150a is overlaid (S84). Then, the additional object portion 152b that should be in the space from the slice image 150b to the next slice image is drawn (S86). In the case of the figure, the entire additional object is drawn at this stage. After that, by superimposing the remaining slice images, the state where the cursor is floated as the additional object 140 in the three-dimensional object 146 can be drawn as in FIG. 15 (S88).
- FIG. 17 schematically shows a procedure for reading slice image data when the sensor group 12 displays the measurement result at a predetermined rate as a moving image of a three-dimensional object.
- a slice image group in three directions is generated for each time, but the illustration is omitted here.
- the slice image management unit 52 loads the slice images necessary for drawing into the drawing memory 56 in order. For example, a slice image farthest from the viewpoint position is specified, and the slice image data is loaded in order. At this time, a load unit composed of a plurality of slice images may be formed according to the bandwidth of the bus serving as a transfer path, and the load may be loaded in the load unit. In the example of the figure, data of three slice images indicated by thick frames are loaded simultaneously as a load unit.
- the image drawing unit 54 sequentially reads the slice image data from the drawing memory 56 and executes alpha blending drawing.
- the slice image management unit 52 loads the subsequent slice image data in units of load.
- a slice image having an alpha channel is created from layered image information obtained by acquiring cross-sectional information of an object on a plurality of parallel planes, and alpha blending is performed, so that the measurement space is 3 Expressed as a dimensional object.
- the alpha value and color information decision rules can be changed variously, so that the user who creates the image can easily perform processing suitable for the display contents and display purpose.
- the first layer image information acquired is for one axis
- slice images for a plurality of axes are generated in advance, and the slice image to be used is switched according to the position of the viewpoint when displaying a three-dimensional object.
- the amount of slice images is adjusted according to the proximity of the viewpoint.
- a transparent and translucent space can be generated in the 3D object, additional objects such as a cursor can be displayed in the 3D object.
- additional objects such as a cursor can be displayed in the 3D object.
- the order of slice images to be used can be determined according to the position of the viewpoint. Therefore, if data is loaded from the secondary storage device to the memory in that order, the loading process and the drawing process are performed. Can be parallel. Thereby, the latency to display can be suppressed even in a situation where the loading frequency of the slice image data is increased by moving the viewpoint or making the three-dimensional object a moving image. As a result, a smooth display change can be realized without increasing the memory capacity.
- the slice plane of the present embodiment is a plane having a predetermined angle with the sensor axis or the image axis, but is not limited to a plane and may be a curved surface such as a spherical surface or a curved surface with fluctuations.
- FIG. 18 schematically shows the shape of a slice image when measuring a distribution with respect to a partially cylindrical curved surface or a partially spherical surface.
- the sensor group 208 measures the measurement space in which the object 216 exists, and the distribution of the measured values at this time has a sensor axis on the z-axis in the vertical direction in the figure and a plurality of parallel lines centering on the sensor axis.
- the curved surfaces 210a, 210b,..., 210n are indicated by fan-shaped curves in a cross section passing through the sensor axis.
- the slice image generation unit 44 For the slice curved surfaces 210a, 210b,..., 210n, the slice image generation unit 44 generates a slice image as described in the embodiment.
- the curved surface is the same as the curved surface.
- the image axis conversion unit 50 prepares a plurality of planes or curved surfaces that cross the slice curved surfaces 210a, 210b,..., 210n at a predetermined angle, and extracts the measured values on the surfaces to extract the slice curved surfaces 210a, 210b, ..., a slice image group having a different direction from 210n is generated.
- slice image groups are generated for planes 212a, 212b,..., 212n perpendicular to the drawing that cross the slice curved surfaces 210a, 210b,. Furthermore, a slice image group arranged in the depth direction in the figure is also generated.
- the drawing is performed in the same order as shown in FIG. 14 for each small solid divided by the slice image group in each direction.
- a three-dimensional object can be drawn by a general computer graphics technique by treating an image as a texture regardless of the shape of the slice image. Therefore, the measurement result can be visualized similarly and easily if the shape and the intersecting angle are known.
- the present invention can be used for information processing apparatuses such as computers, image processing apparatuses, and measurement apparatuses.
Abstract
画像処理装置20において画像データ生成部30のセンサ出力データ取得部42は、センサ群12から積層画像情報のデータを取得する。スライス画像生成部44は、分布を取得したスライス平面ごとに2次元画像のデータを生成する。画像軸変換部50は、センサ軸と異なる軸と垂直な複数の平面に対し同様の2次元画像のデータを生成する。表示処理部32のスライス画像管理部52は、視点の位置などに応じて描画に用いるスライス画像を管理する。描画用メモリ56は描画に必要な画像のデータを逐次格納する。付加オブジェクト画像記憶部58はカーソルなど付加的に表示するオブジェクトの画像データを格納する。画像描画部54はスライス画像のデータを用いて3次元オブジェクトを描画する。
Description
本発明は、対象物に係る情報を画像として可視化する画像処理装置、および当該装置で用いる画像処理方法に関する。
電子線、X線、磁場などを利用して対象物の断面形状や内容物の情報を取得する技術は、透過電子顕微鏡、CT(Computed Tomography)、MRI(Magnatic Resonance Image)などで実用化されている。この技術では対象物の断面ごとの情報を、断面と垂直な軸方向に取得していくことにより、対象物全体の積層画像情報として保持することができる。積層画像情報は、上記のような比較的大規模な装置によって得られるものに限らず、可視光やレーザーなどを利用した断面形状計測装置などによっても得られる。
上記のような技術において得られる情報は、断面を構成する2次元平面と、それに垂直な軸とからなる3次元空間における情報となるため、それを一般的な2次元の画像として、容易に理解できるように可視化することは難しい。最も単純には、断面の2次元の情報を軸方向の位置を変化させながら表示することが考えられるが、この場合、軸方向における対象物の大きさや位置の把握が困難となる。またボクセルごとにデータを取得しボリュームレンダリングを行う手法も実用化されているが、データの取得、格納、画像描画に必要なリソースや処理の負荷が増大するとともに、データの加工や操作に対する自由度が低い、といった問題がある。
本発明はこのような課題に鑑みてなされたものであり、その目的は、積層画像情報を容易に可視化する画像処理技術を提供することにある。
本発明のある態様は画像処理装置に関する。この画像処理装置は、所定の軸上の異なる位置において同じ角度で交差する複数のスライス面上に得られた値の分布情報を取得するデータ取得部と、スライス面上の各位置における値に基づきアルファ値を含む画素値を決定することにより分布情報を画像として表すスライス画像をスライス面ごとに生成するスライス画像生成部と、スライス画像を軸上の対応する位置に配列させ、入力された視点の位置に応じてアルファブレンディング描画することにより、複数のスライス面によって構成される3次元空間を3次元オブジェクトとして表示する画像描画部と、を備えたことを特徴とする。
ここで「スライス面上に得られた値」はセンサなどによって実際に計測された値や当該計測値に何らかの演算を施した値でもよいし、CAD(Computer Aided Design)やゲームなどによって算出された計算値でもよい。したがって「スライス面」は実空間における平面または曲面、あるいは仮想空間における平面または曲線のいずれでもよい。
本発明の別の態様も画像処理装置に関する。この画像処理装置は、所定の軸上の異なる位置において同じ角度で交差する複数のスライス面上に得られた値の分布情報について、スライス面上の各位置における値に基づきアルファ値を含む画素値を決定することにより生成された、分布情報を画像として表すスライス画像のデータを格納したスライス画像記憶部と、入力された視点の位置に応じてスライス画像のデータをスライス画像記憶部から描画用メモリにロードするスライス画像管理部と、スライス画像管理部によるロード処理と並行して、描画用メモリにロードされた順に、スライス画像を軸上の対応する位置に配列させアルファブレンディング描画することにより、複数のスライス面によって構成される3次元空間を3次元オブジェクトとして表示する画像描画部と、を備えたことを特徴とする。
本発明のさらに別の態様は画像処理方法に関する。この画像処理方法は、画像処理装置において所定の軸上の異なる位置において同じ角度で交差する複数のスライス面上に得られた値の分布情報を取得するステップと、スライス面上の各位置における値に基づきアルファ値を含む画素値を決定することにより分布情報を画像として表すスライス画像のデータをスライス面ごとに生成するステップと、各スライス画像を軸上の対応する位置に配列させ、入力装置から入力された視点の位置に応じてアルファブレンディング描画することにより、複数のスライス面によって構成される3次元空間を3次元オブジェクトとして表示装置に表示するステップと、を含むことを特徴とする。
本発明のさらに別の態様は画像ファイルのデータ構造に関する。この画像ファイルのデータ構造は、所定の軸上の異なる位置において同じ角度で交差する複数のスライス面上に得られた値の分布情報について、スライス面上の各位置における値に基づきアルファ値を含む画素値を決定することにより生成された、分布情報を画像として表すスライス画像のデータと、軸の方向および軸上の位置と、を対応づけた画像ファイルのデータ構造であって、画像処理装置において、スライス画像を軸上の対応する位置に配列させ、入力された視点の位置に応じてアルファブレンディング描画することにより、複数のスライス面によって構成される3次元空間を3次元オブジェクトとして表示装置に表示するためにメモリにロードされることを特徴とする。
なお、以上の構成要素の任意の組合せ、本発明の表現を方法、装置、システム、コンピュータプログラムなどの間で変換したものもまた、本発明の態様として有効である。
本発明によると、積層画像情報を容易かつ低いリソースコストで、ユーザが望む形態に可視化することができる。
図1は本実施の形態の画像処理技術を適用できる画像処理システムの構成例を示す。画像処理システム10は、それぞれが所定の計測を行うセンサ12_1、12_2、・・・12_NからなるN個のセンサ群12、各センサから計測結果を取得し可視化する画像処理装置20、ユーザが画像処理装置20への指示入力を行うための入力装置15、画像処理装置20が生成した画像を表示する表示装置14を含む。
画像処理装置20と、センサ群12、表示装置14とは、有線ケーブルで接続されてよく、また無線LAN(Local Area Network)などにより無線接続されてもよい。センサ群12、画像処理装置20、表示装置14のうちいずれか2つ、または全てが組み合わされて一体的に装備されていてもよい。
また後述するように画像処理装置20が行う処理には、計測結果から基本となる2次元画像データを生成する段階と、2次元画像データから表示画像を生成する段階があり、それぞれを独立に行えるため、画像処理装置20、センサ群12、表示装置14の全てが同時に接続されていなくてもよい。表示装置14は、液晶ディスプレイやプラズマディスプレイなど単体で画像を表示する装置でもよいし、画像を投影するプロジェクターとスクリーンとの組み合わせなどでもよい。
N個のセンサ12_1、12_2、・・・、12_Nはそれぞれ所定の物理量を、対象物16を横切る平面18など、所定の位置および向きの複数の平面における分布として取得する。ここで所定の物理量とは、色、温度、含有水分、硬度など、一般的なセンシング技術により可視光、X線、磁気、電気、超音波などを利用して求められる情報であればその種類は限定されない。また図中、センサ12_1、12_2、・・・、12_Nの配置や形状はあくまで例示であり、用いるセンシング技術によって様々な態様が考えられることは当業者には理解されるところである。
画像処理装置20は、センサ群12が計測した複数の平面における物理量の分布を統合し、当該平面が積層した計測空間を3次元のオブジェクトとして可視化する。当該オブジェクトは、入力装置15を介して受け付けたユーザからの視点移動要求に応じて任意の方向から見ることを可能にする。画像処理装置20はその他、センサ群12が物理量を取得する対象となる平面を制御したり、表示装置14における表示を制御したりするなど、画像処理システム10全体を統括的に制御する。
なおセンサ群12を含み、センサによる計測処理や積層画像情報の出力を制御する機構を有するセンシング装置を、画像処理装置20とは個別に導入してもよい。そしてセンサが計測した物理量の分布を当該センシング装置が内部で画像化し、画像処理装置20はその画像データを取得するようにしてもよい。この場合、センサが計測した物理量に代わり、RGBなどの画素値の分布が得られることになるが、以後の説明ではそのような画素値も「物理量」として同様に扱う。
表示装置14は、画像処理装置20が物理量の分布を可視化した結果として生成した3次元オブジェクトを含む画像を表示する。入力装置15は、上述のように、表示装置14に表示された3次元オブジェクトに対する視点移動要求のほか、センサ群12による物理量の計測開始、計測結果の取得開始、画像やデータの加工、表示装置14によるオブジェクト表示の開始などの要求をユーザより受け付け、画像処理装置20へ通知する。入力装置15は図示するマウスの他、キーボード、コントローラ、ジョイスティックなど一般的な入力装置のいずれかでよく、表示装置14の画面に搭載したタッチパネルなどでもよい。
図2はセンサ群12が計測した結果、画像処理装置20が取得する情報の形態を模式的に示している。センサ群12に含まれる各センサは、同図に示すように所定の軸(z軸)と垂直な複数の平面19a、19b、・・・、19nに対して所定の物理量の分布を取得する。平面19a、19b、・・・、19nはz軸に対し異なる位置にあり、それに垂直なxy平面に対して同じ範囲にあるとする。
以後、同図のz軸のように、センサ群12によって物理量の分布を取得する平面を移動させる方向を「センサ軸」と呼び、当該平面を「スライス平面」と呼ぶ。センサ群12を、センサ軸が複数設定できるように設けてもよい。この場合、複数のスライス平面群が各センサ軸に対し設定され、それぞれの平面に対して物理量の分布が得られる。なお図2においてスライス平面はセンサ軸に垂直であったが、計測する物理量やセンサの構造などによって必ずしも垂直である必要はない。
「分布」はそのような各スライス平面上の位置座標に対する値として得られるため、図1に示すようにセンサ群12がN個のセンサ12_1、12_2、・・・、12_Nからなるとすると、あるスライス平面上のある位置に対する値がN個得られることになる。結果として画像処理装置20が取得する情報は、各スライス平面19a、19b、・・・、19nに対して設定した複数の位置P1、P2、・・・ごとに、その位置座標(x,y)と、N個の値からなるベクトル値(V_1,V_2,・・・,V_N)を対応づけた情報となる。
なお位置P1、P2、・・・は、実際には一般的な画素程度の間隔で設定してよく、センサの分解能などによっては適宜、計測値の補間や間引きを行うことにより、各位置P1、P2、・・・に対して同じ次元数のベクトル値が得られるようにする。センサ群12が所定の時間間隔で計測を繰り返し、画像処理装置20は図2で示した情報を各時刻で取得してもよい。この場合、最終的に表示される3次元オブジェクトは時間経過とともに変化する動画となる。
図3は画像処理装置20が生成し表示装置14に表示される画像の例を示している。画像例4は、図2で示した計測情報を可視化したものであり、計測空間を示す3次元オブジェクト6の内部に対象物16が内在した状態で表示される。ユーザは入力装置15を操作することにより仮想的な視点を移動させ、3次元オブジェクト6を所望の角度に回転させることができるため、対象物の裏側や側面を確認することができる。
また3次元オブジェクト6中、対象物16以外の領域、対象物16の領域、など所望の領域の透過率をユーザの操作により変化させ、透明または半透明とすることができる。これにより対象物が複数ある場合もそれらの位置関係や大きさを所望の方向から観察できる。3次元オブジェクトの対象物以外の領域を透明になるように表示した場合などは、3次元オブジェクトは目視できず、対象物だけが目視できる状態となる。以後の説明ではこのような透明な領域も含め「3次元オブジェクト」としている。3次元オブジェクト6を動画とした場合、対象物の動きや新たな対象物の生成なども観測できる。また、矢印形状のカーソル8など、計測結果とは別のオブジェクトを3次元オブジェクト6の内部に入り込んだ形で表示させることもできる。
図4は画像処理装置20の構成を詳細に示している。図4において、様々な処理を行う機能ブロックとして記載される各要素は、ハードウェア的には、CPU(Central Processing Unit)、GPU(Graphics Porcessing Unit)、メモリ、その他のLSIで構成することができ、ソフトウェア的には、画像処理を行うプログラムなどによって実現される。
したがって、これらの機能ブロックがハードウェアのみ、ソフトウェアのみ、またはそれらの組合せによっていろいろな形で実現できることは当業者には理解されるところであり、いずれかに限定されるものではない。また画像処理装置20は上述のとおり、画像処理システム10内の他の装置とのデータの送受信制御などを行うが、このような処理には一般的な技術を適用できるためここでは図示を省略している。
画像処理装置20はセンサからの出力情報を取得し、表示に用いる2次元画像データを生成する画像データ生成部30、および当該2次元画像データを利用して3次元オブジェクトを描画する表示処理部32を含む。なお上述のとおり、画像データ生成部30が行う処理と表示処理部32が行う処理は独立して実施可能であるため、同じ装置内に双方を設けず、それぞれの機能を有する個別の装置としてもよい。
画像データ生成部30は、センサ群12からの出力データを取得するセンサ出力データ取得部42、分布を取得したスライス平面ごとに2次元画像のデータを生成するスライス画像生成部44、センサ軸と異なる軸と所定の角度を有する複数の平面に対し同様の2次元画像のデータを生成する画像軸変換部50、センサ出力データ取得部42が生成したデータを格納するベクトル値情報記憶部46、スライス画像生成部44および画像軸変換部50が生成したデータを格納するスライス画像記憶部48を含む。
センサ出力データ取得部42は、センサ群12からスライス平面ごとに物理量の分布情報を取得し、図2で示したような、位置座標とベクトル値とを対応づけたベクトル値情報を生成する。ベクトル値情報はスライス平面の識別情報に対応づけてベクトル値情報記憶部46に一旦格納し、その旨をスライス画像生成部44および画像軸変換部50に通知する。ここでスライス平面の識別情報は、センサ軸の向きと当該センサ軸上の位置などによって構成する。
スライス画像生成部44は、ベクトル値情報記憶部46に格納されたベクトル値情報に基づき、スライス平面ごとに、3次元オブジェクトの元となる2次元画像のデータを生成する。以後、このような2次元画像を「スライス画像」と呼ぶ。スライス画像は画素ごとに、色空間の情報のほか、透過率を表すアルファ値を保持する。画像表示段階でスライス画像をセンサ軸方向に配列し、アルファブレンディング描画することにより、3次元オブジェクトの内部が透けて見えるように表現する。色空間情報およびアルファ値の設定手法については後に詳述する。生成したスライス画像のデータは、スライス平面の識別情報に対応づけてスライス画像記憶部48に格納する。また、アルファ値をスライス画像の画素値から計算する方法もあり、この場合、描画部でアルファ値を計算しつつブレンディングに使えばアルファ値をスライス画像記憶部に格納する必要がなくなる。
画像軸変換部50は、センサ軸とは異なる所定の軸、例えば図2のようにz軸をセンサ軸としたとき、それと直交するx軸およびy軸のそれぞれに対し、それと所定の角度を有する複数の平面を発生させ、各平面に対し、図2で示したのと同様のベクトル値情報を生成する。すなわちセンサ群12が計測したスライス平面上の物理値から、向きの異なる平面上の各位置に対応する値を拾っていくことにより、当該平面に対する分布としてデータを再構築する。
そしてスライス画像生成部44と同様の処理によって、各平面に対応する2次元画像のデータを生成する。以後、この2次元画像も「スライス画像」と呼ぶが、このときの平面に対する軸を「画像軸」として「センサ軸」と区別する。画像軸変換部50が生成したスライス画像のデータも、画像軸の向きと当該軸上の位置に対応づけてスライス画像記憶部48に格納する。
表示処理部32は、視点の位置などに応じて描画に用いるスライス画像を管理するスライス画像管理部52、描画に必要な画像のデータを逐次格納する描画用メモリ56、カーソルなど付加的に表示するオブジェクトの画像データを格納する付加オブジェクト画像記憶部58、スライス画像のデータを用いて3次元オブジェクトを描画する画像描画部54を含む。
スライス画像管理部52は、視点の移動によって描画に用いるスライス画像の軸を切り替え、スライス画像記憶部48から必要なスライス画像のデータを描画用メモリ56に読み出す。なお画像データ生成部30が生成したスライス画像から即時にオブジェクトを生成する場合などは、スライス画像記憶部48が描画用メモリ56を兼ねていてもよい。一方、二次記憶装置などで実装されるスライス画像記憶部48にスライス画像のデータを全て格納してしまい、表示段階として別の機会に描画用メモリ56にロードする態様においては、描画に必要な順にデータを徐々にロードしながら描画処理を行う。
3次元オブジェクトを描画する際は基本的に、視点から遠い順にスライス画像をアルファブレンディング処理により重ねていく。従って描画用メモリ56へのスライス画像データのロードも基本的にはその順で行う。これにより視点移動などによって別のスライス画像が必要となっても表示までのレイテンシを抑えることができる。このロード処理は、スライス画像管理部52が制御するメモリコントローラなどによって行ってよい。
スライス画像管理部52はさらに、視点と3次元オブジェクトとの距離の減少に応じて、スライス画像間の補間を行う。スライス画像はセンサ軸または画像軸上の離散的な位置に対して生成されており、視点がオブジェクトに近づくとその不連続性が視認されやすくなる。そこで、隣り合うスライス画像の画素値を軸上の位置に対して補間する画素値を有する新たなスライス画像を生成する。生成したスライス画像を元のスライス画像間に挿入し、スライス画像の間隔を狭くすることにより不連続性を目立たなくさせる。挿入するスライス画像の枚数は、視点までの距離に反比例するように徐々に増加させてもよいし、距離としきい値との比較によって段階的に増加させてもよい。
画像描画部54は、必要なスライス画像のデータが描画用メモリ56にロードされた旨の通知をスライス画像管理部52から取得すると、当該データを用い、3次元オブジェクトを描画する。基本的には、各スライス画像を軸上のそれぞれの位置に配列させ、視点から遠いスライス画像から順にスクリーン座標へ投影することで重ね合わせを行う。このようにして表される計測空間の3次元オブジェクトは、アルファ値の設定によって、例えば対象物のない空間などは透明、あるいは半透明の状態となる。そこで画像描画部54はさらに、このような空間にカーソルなどの付加オブジェクトを描画する。
付加オブジェクトはユーザが入力装置15を介して動かせるようにしたり、対象物に追随して動かしたり発生させたりする。そのため画像描画部54は、それらのモードに応じて付加オブジェクトの表示位置を計算したうえ、画像のデータを描画用メモリ56に読み出し、描画する。さらに画像描画部54は、複数の視点について同様の3次元オブジェクト描画処理を行うことにより立体視を実現してもよい。この場合の視点の相対位置などは導入する立体視の方式に応じて適宜決定できる。
次に、上記のような構成によって実現できる画像処理装置20の動作について説明する。図5は画像データ生成部30がスライス画像のデータを生成する処理手順を示すフローチャートである。まずセンサ出力データ取得部42は、入力装置15を介したユーザの指示などに応じて、センサ軸の複数のスライス平面に対するN個の物理量の分布をセンサ群12から取得し、各平面上の位置と、物理量のセットからなるベクトル値とを対応づけたベクトル値情報を生成する(S10)。
この処理においてベクトル値情報に含まれるベクトル値は、センサ群12から送信されたN個の物理量そのものでなくてもよい。例えば最終的に表示させたい情報などに鑑み必要のない物理量を要素から除外してもよいし、異なる物理量同士で演算を行った結果得られた値をベクトル値の新たな要素として追加してもよい。また、ある物理量がしきい値を超えたら別の物理量を0とするなど、しきい値判定によるマスキングを行ってもよい。例えばある温度以下の対象物のみを表示する場合などはこの手法が有効である。
このように計測値を操作して得られるベクトル値情報を複数パターン生成するようにし、表示時の操作によって表示対象を切り替えてもよい。物理量の具体的な加工規則は、ユーザが決定するなどして付加データとして図示しないメモリなどに記憶させておき、センサ出力データ取得部42がベクトル値情報作成時に参照する。
次にスライス画像生成部44は、各スライス平面に設定した2次元配列の画素ごとに、ベクトル値に基づきアルファ値を決定する(S12)。アルファ値の具体的な決定手法は後述する。さらにスライス画像生成部44は、ベクトル値に基づき当該画素ごとに色情報を決定することで、画素値として色情報およびアルファ値を保持するスライス画像のデータを生成し、スライス画像記憶部48に格納する(S14)。RGB、YCbCrなど、色情報の表色系は限定されない。また上述したように、画像描画部54における描画時にスライス画像からアルファ値を生成する場合、スライス画像生成部44ではアルファ値を設定する必要がないためスライス画像記憶部48にはアルファ値が格納されない。
色情報は、物理量の種類や表示目的などに応じてあらかじめ設定した規則に従い決定する。例えば3つのセンサ12_1、12_2、12_3が計測した値をそれぞれ、赤色の輝度、緑色の輝度、青色の輝度としてRGBを表してもよい。この場合、最終的に表示される3次元オブジェクトにおいて、センサ12_1が計測する物理量が大きくなる物質は赤色、12_2が計測する物理量が大きくなる物質は緑色、12_3が計測する物理量が大きくなる物質は青色が強く表れ、物質によって色分けができる。
あるいは、あるセンサ12_1が計測したひとつの値をR、G、Bの全てに代入し、白色の輝度によって物理量の大小を表すなどでもよい。アルファ値や色情報の決定規則は、ユーザが表示内容や表示目的などに応じて適宜決定し、図示しないモリなどに記憶させておく。または実際の表示を確認しながら、入力装置15を介してその場で設定していくようにしてもよい。
センサ軸に対する全てのスライス画像を生成するまで、S12とS14の処理を繰り返す(S16のN、S12、S14)。全てのスライス画像が生成されたら、画像軸変換部50は、所定の画像軸に対するスライス平面を、物理量が得られている位置で複数準備し、各平面上の位置と、物理量のセットからなるベクトル値とを対応づけたベクトル値情報を、画像軸ごとに生成する(S16のY、S18のN、S20、S10)。あとは上記と同様、各平面上に設定した画素に対しアルファ値と色情報を決定しスライス画像を生成、格納する処理を、各軸に対する全スライス画像が生成されるまで繰り返す(S12、S14、S16のN)。
全ての画像軸に対し全てのスライス画像が生成されたら(S18のY)、別のセンサ軸によって物理量が取得できる環境であればS10からS20の処理を繰り返す(S22のN)。全てのセンサ軸でスライス画像が生成されたら処理を終了する(S22のY)。本実施の形態において最終的に表示する3次元オブジェクトを好適に描画するためには、3つの軸に対するスライス画像を準備することが望ましい。最も単純には互いに直交するx軸、y軸、z軸に対してスライス画像を生成する。これらの3方向の軸のいずれを画像軸としてもよいし、画像軸が含まれなくてもよい。
つまり当該3方向の軸をセンサ軸として計測可能であれば画像軸変換部50は処理を行わなくてもよい。一方、センサ軸が一方向のみの場合、その他の画像軸に対するスライス画像は画像軸変換部50が生成し、S22の分岐はなくなる。センサ軸が2方向のときは残りの1方向を画像軸として画像軸変換部50がスライス画像を生成するなど、センサ軸として設定できる方向やその数に応じて画像軸の設定は適宜変化させてよい。
図6は図5のS12においてスライス画像のアルファ値を決定する手法の例を示している。同図上側が、あるスライス平面19iにおけるベクトル値情報を、下側が、対応するスライス画像100aにおいて設定するアルファ値を、それぞれ模式的に表している。スライス平面19iにおいて、例えば対象物が存在する領域102とそれ以外の領域104とでは、そのベクトル値の少なくともいずれかが大きく変化する。同図ではその差を2種類の網掛けで表している。
この差を反映したアルファ値を設定するため、次のような条件分岐を行う。
if max(V_1, V_2, ・・・, V_N) < Th
A = 0;
else A = 1;
if max(V_1, V_2, ・・・, V_N) < Th
A = 0;
else A = 1;
ここでThはあらかじめ定めたしきい値、Aは各画素に与えるアルファ値である。つまりベクトル値(V_1, V_2, ・・・, V_N)のうち最大値がしきい値Thより小さければアルファ値は0、しきい値Th以上であればアルファ値は1とする。図6のスライス画像100aにおいて、領域102はアルファ値が1、領域104はアルファ値が0であることを、それぞれ白色、黒色で示している。ベクトル値情報のスライス平面においてベクトル値を保持する位置と、スライス画像において画素を定義する位置は異なっていてもよく、その場合は前者の位置においてアルファ値を決定し、それを適宜補間することによって画素ごとの値を決定する。
上記のような条件を用いる場合、ベクトル値を構成する物理量の種類が異なるときは、スケールをそろえるために全ての値を正規化しておく。また分岐判断の対象とする物理量を選択してから条件分岐させてもよい。対象物の範囲で値が高くなる物理量をベクトル値に含めたうえこのような条件分岐によりアルファ値を与えると、対象物のない領域は透明に、対象物のある領域は不透明になる。結果としてαブレンディング描画した際、対象物のない領域のみその向こう側が見渡せるような表示となる。
図7はスライス画像のアルファ値を決定する手法の別の例を示している。図の表し方は図6と同様である。この場合の条件分岐は次のように設定している。
if max(V_1, V_2, ・・・, V_N) < Th
A = 0;
else A = max(V_1, V_2, ・・・, V_N);
if max(V_1, V_2, ・・・, V_N) < Th
A = 0;
else A = max(V_1, V_2, ・・・, V_N);
ベクトル値(V_1, V_2, ・・・, V_N)のうち最大値がしきい値Thより小さければアルファ値を0とする点は図6と同じであるが、最大値がしきい値Th以上のときは、この最大値自身をアルファ値とする。ここでベクトル値を構成する各物理量は正規化されているものとする。同図のスライス画像100bでは、領域102のアルファ値がTh≦A≦1の範囲で変化していることをグラデーションで表している。
このような条件分岐によれば、例えば対象物の内部における物理量の変化を色の透過率によって表すことができる。また図6に示した例に比べ、対象物の輪郭付近でのアルファ値を緩やかに変化させることができるため、輪郭にジャギーやノイズが発生しても目立ちにくい。
ベクトル値からアルファ値を決定するための条件はこの他にも様々考えられる。例えば図7の場合と逆に、次のような条件分岐を設定してもよい。
if max(V_1, V_2, ・・・, V_N) < Th
A = max(V_1, V_2, ・・・, V_N);
else A = 1;
if max(V_1, V_2, ・・・, V_N) < Th
A = max(V_1, V_2, ・・・, V_N);
else A = 1;
この設定によれば、対象物のない領域などにおいて、ベクトル値を構成する物理量の大きさに応じてアルファ値を変化させることができる。例えば対象物の周辺温度や周囲の湿度などを色の透過率によって表すことができる。
さらに、ベクトル値を構成する物理量のうち1つの物理量V_iにのみ着目することにより、次のような条件分岐も考えられる。
if V_i < Th
A = 0;
else A = 1;
または
if V_i < Th
A = 0;
else A = V_i;
if V_i < Th
A = 0;
else A = 1;
または
if V_i < Th
A = 0;
else A = V_i;
上記の2つの条件分岐は1つの物理量V_iを分岐判断の対象とする以外は、図6および図7に示したのと同様である。例えば物質によって異なる物理量が高くなる場合、対象とする物理量V_iを切り替えることにより、対象物として表示する物質を切り替えることができる。
さらにしきい値をTh1、Th2(Th1<Th2)の2つ設け、以下の条件分岐を設定してもよい。
if max(V_1, V_2, ・・・, V_N) < Th2 || min(V_1, V_2, ・・・, V_N) > Th1
A = 0;
else A = 1;
if max(V_1, V_2, ・・・, V_N) < Th2 || min(V_1, V_2, ・・・, V_N) > Th1
A = 0;
else A = 1;
つまりベクトル値(V_1, V_2, ・・・, V_N)のうち最大値が大きい方のしきい値Th2より小さいか、最小値が小さい方のしきい値Th1より大きい場合、すなわちベクトル値が所定の中間的な範囲に収まっている場合に、アルファ値を0として透明化する。この例は、対象物の領域で、あるセンサが取得する物理量は小さくなり、別のセンサが取得する物理量は大きくなるような状況において、どちらかのセンサが反応すればそれらを全て対象物として表示させたい場合に適用できる。
図6、図7に示すようにしきい値Thとベクトル値の最大値との大小関係によってアルファ値の設定を分岐させる場合、対象物の輪郭付近など最大値がしきい値Thの近傍となる部分は、わずかなベクトル値の変化でアルファ値の設定が大きく変化するため、表示時にノイズが生じやすい。図8は、アルファ値の設定においてそのようなノイズの発生を抑える手法を説明するための図である。
まず左上のグラフは、ベクトル値のうち最大値を横軸に、図7を参照して示した条件分岐で決定したアルファ値Aを縦軸に示している。この手法では、条件分岐で決定したアルファ値を所定の規則で変換することにより最終的なアルファ値Aを決定する。したがって同グラフのアルファ値は同図に示すように暫定値とする。グラフに示すように、ベクトル値の最大値がしきい値Thより小さいとき、アルファ値Aの暫定値は0である。当該最大値がしきい値Thと等しくなると、アルファ値Aの暫定値はその最大値Thとなる。
このような急激なアルファ値の変化を抑制するため、同図右上に示すような関数f(A)を作用させて最終的なアルファ値Aを算出する。関数f(A)は例えば、しきい値Thより所定の幅ΔAだけ小さいアルファ値の暫定値において0から緩やかに立ち上がり、さらに暫定値がしきい値Thより所定の幅ΔAだけ大きくなる間に1に達するような関数である。このような関数から得られる値をアルファ値Aの暫定値に乗算すると、同図下に示すグラフのようになる。
すなわち、横軸に示した、ベクトル値の最大値がしきい値Thより小さいときは、暫定値同様、アルファ値Aは0である。当該最大値がしきい値Thと等しくなると、f(Th)を暫定値Thに乗算した結果、アルファ値Aはその暫定値より小さく抑えられる。結果としてベクトル値の最大値のわずかな変化でアルファ値が急激に変化することがなくなる。関数f(A)は実際の表示画像におけるノイズの発生率などに応じて最適化しておく。なおアルファ値Aの暫定値を関数fに代入して出力される値をアルファ値Aとしてもよい。
これまでのアルファ値の設定手法は条件分岐に基づく比較的シンプルなものであった。より複雑なスキームでアルファ値を設定したい場合は、例えばベクトル値を構成するN個の物理量からなるN次元空間における位置座標に対しアルファ値をあらかじめ準備しておいてもよい。例えばベクトル値を構成する物理量ごとに異なるしきい値でアルファ値を設定する場合、条件分岐が複雑になることが考えられる。
そこで、全ての条件に対するアルファ値を、N次元空間における位置座標、すなわちN個の値の組み合わせに対応づけたテーブルを前もって作成しておく。このようにすると条件分岐処理などを経ず、当該テーブルを参照するのみで、ベクトル値から直接アルファ値を引いてくることができる。
またベクトル値を構成する物理量のいずれかまたは組み合わせを変数として所定の関数を計算し、その結果を用いてアルファ値を決定する場合なども同様に、ベクトル値のN個の値の全ての組み合わせに対してアルファ値を先に計算しておき、テーブルとして準備しておく。これにより複雑なスキームでアルファ値を求める場合でも、処理の負荷や決定までの所要時間を抑えることができる。
図9は表示処理部32が3次元オブジェクトの表示処理を行う処理手順を示すフローチャートである。まずユーザが入力装置15を介して表示開始の指示を入力すると(S30)、スライス画像管理部52は、3次元オブジェクトの初期画像を表示させるためにあらかじめ定めた視点座標を初期視点として設定し、当該視点から3次元オブジェクトを描画するために必要なスライス画像のデータを描画用メモリ56にロードする(S32、S34)。実際には上述のとおり必要なスライス画像から順にロードすることで、以後のオブジェクトの描画処理と並行させることができる。
次にスライス画像管理部52は、視点と3次元オブジェクトとの距離に応じて、スライス画像の量を調整する(S36)。新たに補間用のスライス画像を生成した場合は、それを描画用メモリ56に格納する。このとき挿入先の位置が識別できるように、画像データそのものを前後のスライス画像のデータ間に挿入するか、軸上の位置と対応づけておく。
次に画像描画部54は、入力装置15を介したユーザからの指示入力などに応じて、3次元オブジェクトの内部に表すべき付加オブジェクトを描画する(S38)。付加オブジェクトは上述のとおり、ユーザの操作によって移動するカーソル、対象物に接して表示されるマーカ、対象物の軌跡を表す線などであり、ユーザが選択できるようにする。画像描画部54は、ユーザによる指定や、エッジ抽出処理によって求めた対象物の輪郭線などに基づき付加オブジェクトを表示させる位置を決定したうえ、描画用メモリ56にロードした画像データを用いて付加オブジェクトを描画する。
次に画像描画部54は、描画用メモリ56にロードしたスライス画像を視点から遠い順にアルファブレンディングにより重ね合わせていくことにより、計測空間を表す3次元オブジェクトを描画する(S40)。なお後述するように、S38の付加オブジェクトの描画処理は、S40のアルファブレンディング描画と同時に行ってもよい。
ユーザが入力装置15を用いて視点を移動させる操作を行ったら(S44のY)、S34からS40の処理を、視点の変化に対応させて繰り返す。視点移動や表示停止の操作がなされない間はその時点の表示を継続し(S44のN、S46のN)、表示停止の操作がなされたら処理を終了する(S46のY)。
図10は図9のS40において、画像描画部54がアルファブレンディング描画を行う様子を模式的に示している。視点114に近い方から、スクリーン116、オブジェクトに対応するスライス画像110a、110b、・・・、110n、背景118が位置する。このときスクリーン116のある点115に投影される像は、視点114と点115を通る視線119と、スライス画像110a、110b、・・・、110nおよび背景118との交点112a、112b、・・・、112n、117の像を視点114から遠い方から重ね合わせたものとなる。同図の場合、交点117、112n、・・・、112b、112a、の順となる。
図11は、図10で示したスクリーン上の点115におけるRGBの値を求める処理手順を示すフローチャートである。まず変数Ri、Gi、Bi(iは-1以上の整数)を準備し、R-1、G-1、B-1に、背景118の交点117におけるRGB値、Rb、Gb、Bbをそれぞれ代入する(S50)。視点から最も遠いスライス画像110n上の交点112nのRGB値およびアルファ値を(R0,G0,B0,A0)とすると、背景118の交点117とスライス画像110n上の交点112nとを重ね合わせたときRGB値は以下のようになる(S52、S54、S56、S58)。
R=Kr×A0×R0+(1-Kr×A0)×R-1
G=Kg×A0×G0+(1-Kg×A0)×G-1
B=Kb×A0×B0+(1-Kb×A0)×B-1
・・・(式1)
G=Kg×A0×G0+(1-Kg×A0)×G-1
B=Kb×A0×B0+(1-Kb×A0)×B-1
・・・(式1)
ここでKr、Kg、Kbは、スライス画像が保持するアルファ値を色によって調整する場合に、赤、緑、青それぞれにかかるアルファ値の係数であり必要に応じて0<K<1の範囲で設定する。色による調整が必要ない場合はKr=Kg=Kb=1とする。上式のR、G、Bを新たなR0、G0、B0としてiをインクリメントしながら最後のスライス画像(i=nslice-1)の交点まで、視点に近づく方向に順に行うことにより(S60のY、S62)、透明、半透明の状態を許容しながらnslice枚のスライス画像の交点を全て重ね合わせたRGB値が得られる(S60のN)。
ただし描画の処理手順はこれに限定されない。例えば以下のようにしてRGB値を求めることも考えられる。すなわち、式1を、k+1番目のスライス画像(i=k)まで重ね合わせたときのRGB値として一般化すると次のようになる。
R’k=Kr×Ak×Rk+(1-Kr×Ak)×R’k-1
G’k=Kg×Ak×Gk+(1-Kg×Ak)×G’k-1
B’k=Kb×Ak×Bk+(1-Kb×Ak)×B’k-1
・・・(式2)
R’k=Kr×Ak×Rk+(1-Kr×Ak)×R’k-1
G’k=Kg×Ak×Gk+(1-Kg×Ak)×G’k-1
B’k=Kb×Ak×Bk+(1-Kb×Ak)×B’k-1
・・・(式2)
式2において、重ね合わせ後のRGB値を(R’k,G’k,B’k)として、k+1番目のスライス画像のみのRGB値(Rk,Gk,Bk)と区別している。式2の関係を利用し、最後のスライス画像(i=nslice-1)まで重ね合わせたときの最終的なRGB値を背景のRGB値まで遡及させて展開すると、当該最終的なRGB値(R’nslice-1,G’nslice-1,B’nslice-1)は次のようにスライス画像ごとのRGB値の線形結合で表すことができる。

ここで(Bri,Bgi,Bbi)はi+1番目のスライス画像のRGB値(Ri,Gi,Bi)の係数であり、スライス画像のアルファ値から算出される。したがって描画前に全てのスライス画像のアルファ値を決定しておく態様においては、係数(Bri,Bgi,Bbi)を視点に応じて先に求めたうえで式3を用いて最終的なRGB値を算出してもよい。
図12は図9のS34において、スライス画像管理部52が視点に応じて必要なスライス画像のデータを決定する処理を説明するための図である。上述のようにスライス画像は所定の軸に対して離散的な位置における物理量の分布を画像化したものである。センサ軸が同図縦方向のz軸であった場合、基本的に生成されるスライス画像はスライス画像群120のようにxy平面を構成する平行な複数の面となる。このスライス画像群120を用いて同図上側または下側から見た3次元オブジェクト126を表示する場合、図10で説明したような重ね合わせを行うことにより違和感のない画像を描画できる。
一方、同図横方向のx軸や、奥行き方向のy軸に近い位置に視点を置くと、スライス画像の間の空間が見えてしまうことになる。そこで上述のとおり、センサ軸と異なる画像軸に対してスライス画像を生成したり、複数のセンサ軸について物理量を計測したりして複数の軸に対してスライス画像群を生成しておき、視点の移動によって用いるスライス画像群を切り替える。同図の例では、x軸を画像軸としたスライス画像群122とy軸を画像軸としたスライス画像群124を準備している。
そして表示すべき3次元オブジェクト126の周囲の3次元空間を区分けして、どの区分内に視点が位置しているかによって、描画に用いるスライス画像群を切り替える。例えば同図の点線に示すように、3次元オブジェクト126の各頂点から、当該頂点を形成する3次元オブジェクト126の3つの辺と所定の角度をなす境界線を設定する。そしてそれらの境界線を側面の辺とし3次元オブジェクトの各面を上面とするおよそ台形の空間を1つの区分とする。
例えば同図において3次元オブジェクト126の上面または下面にある区分内に視点があるときは、視線がz軸に最も近いため、z軸を軸とするスライス画像群120を描画に用いる。同様に、3次元オブジェクト126の左面または右面にある区分内に視点があるときは、視線がx軸に最も近いため、x軸を軸とするスライス画像群122を描画に用いる。3次元オブジェクト126の手前の面または奥の面にある区分内に視点があるときは、視線がy軸に最も近いため、y軸を軸とするスライス画像群124を描画に用いる。
図13は境界線の角度を決定する手法の例を説明するための図である。まず直交する2方向、図12の例ではx軸、y軸を軸とするスライス画像群を考える。同図は同じxy平面にx軸を軸とするスライス画像群122(点線)とy軸を軸とするスライス画像群124(実線)を配列させ、z軸方向から見た様子を示している。図中、左上から3次元オブジェクトを見た場合、視点の位置によって、頂点vを通る視線は矢印128、129、130のように変化する。
各視線との交点を有するスライス画像群の枚数は、x軸を軸とするスライス画像群122/y軸を軸とするスライス画像群124の順に次のようになる。
矢印128の視線:4枚/6枚
矢印129の視線:6枚/6枚
矢印130の視線:7枚/6枚
矢印128の視線:4枚/6枚
矢印129の視線:6枚/6枚
矢印130の視線:7枚/6枚
すなわち矢印129の視線において、どちらのスライス画像群のデータを用いても同じ回数のアルファブレンディング処理がなされるため、同じ表示画像が得られることになる。したがって矢印129の方向を境界線とすることで、切り替え前後の表示画像が連続的につながる。x軸を軸とするスライス画像群122の画像の間隔をWx、y軸を軸とするスライス画像群124の画像の間隔をWyとすると、矢印129の角度θは|tanθ|=Wy/Wxを満たすため、次の条件でスライス画像群を切り替える。
|tanθ|≧Wy/Wxのときy軸を軸とするスライス画像群
|tanθ|<Wy/Wxのときx軸を軸とするスライス画像群
|tanθ|<Wy/Wxのときx軸を軸とするスライス画像群
上記を3次元に拡張し、視線ベクトルを(X,Y,Z)、z軸、x軸、y軸を軸とするスライス画像群をそれぞれSz、Sx、Syと表記すると、次の切り替え条件となる。
|Z/X|≧Wz/Wxかつ|Z/Y|≧Wz/WyのときSz
|Z/X|<Wz/Wxかつ|X/Y|≧Wx/WyのときSx
|Z/Y|<Wz/Wyかつ|X/Y|<Wx/WyのときSy
|Z/X|≧Wz/Wxかつ|Z/Y|≧Wz/WyのときSz
|Z/X|<Wz/Wxかつ|X/Y|≧Wx/WyのときSx
|Z/Y|<Wz/Wyかつ|X/Y|<Wx/WyのときSy
上記条件の境界となる視線ベクトルが図12の点線で示した境界線に対応する。これにより、視点の変化によって表示に用いるスライス画像群を切り替えても、切り替え前後をシームレスにつなげることができる。なお図12、13の例はセンサ軸または画像軸がスライス画像と垂直であったが、上述のとおり本実施の形態はそれに限定されない。例えばスライス画像がセンサ軸と垂直でない計測系の場合は、当該計測値を再構築して画像軸変換部50が生成するスライス画像もまた、画像軸と垂直でなくてよい。センサ軸と画像軸も直交していなくてよい。これらの場合も上記と同様の理論により境界線を設定することができ、視点に応じたスライス画像の切り替えおよびアルファブレンディング描画の処理も同様となる。
図14は3次元オブジェクトを描画する別の手法を説明するための図である。同図の場合、x軸、y軸、z軸に対するスライス画像群を3方向のテクスチャ画像として同時に使用する。各面にテクスチャを貼り付けた3次元オブジェクト136を視点132の位置に応じて描画する手法は一般的なコンピュータグラフィックスの描画処理を応用できる。一方、本実施の形態の場合は上述のとおり各方向のスライス画像がアルファチャンネルを有するため、視点132から遠い画素からの重ね合わせが必要となる。
しかし3方向のスライス画像を同時に用いる場合、視点から遠い順にスライス画像の組み合わせを特定するのは困難である。そこで同図に示すように、3次元オブジェクト136を、3方向のスライス画像群で格子状に区分けする。図中、3次元オブジェクト136中に表した互いに交差する直線は、各スライス画像の縁を表す。このような区分けによって得られる小さい直方体の3次元配列を対象とすれば、視点132から遠い順番を容易に特定できる。
同図の矢印138はそのような順番を模式的に示している。そしてこの矢印138の順序で、各直方体の面を構成するスライス画像の画素値を用いてスクリーン上に重ね合わせていくことにより、3次元オブジェクト136を透明、半透明の状態を可能として表現できる。この態様の場合、スライス画像管理部52は視点の位置によらず3方向のスライス画像群のデータをロードする。
次に図9のS38において、画像描画部54が付加オブジェクトを描画する手法を説明する。3次元オブジェクトの半透明の空間に浮いたような状態で付加オブジェクトを描画するためには、3次元オブジェクトのアルファブレンディング描画との描画順を考慮する必要がある。図15はその一つの方法として、先に付加オブジェクトを描画してから3次元オブジェクトを描画する処理手順を模式的に示している。
まず視点の位置に応じて、最終的に3次元オブジェクトが描画される仮想の直方体142を準備し、当該直方体142の内部の必要な位置に付加オブジェクト140を一般的な手法で描画する(S70)。同図の例では付加オブジェクト140は矢印状のカーソル図形である。次に上述の方法でスライス画像を用いて3次元オブジェクトを描画していく(S72)。付加オブジェクト140を先に描画しておくことで、アルファ値が0に近い透過率の高い領域では、そのまま付加オブジェクト140が残った状態となる。
そして視点に最も近いスライス画像まで重ね合わせが完了すると、3次元オブジェクト146内に付加オブジェクト140としてカーソルが浮いた状態を描画できる(S74)。例えばカーソルを、3次元オブジェクト146内に存在する対象物148を指すようにすることで、表示を用いたプレゼンテーションなどを好適に行える。対象物が時間とともに移動する様を動画として表示する場合は対象物の軌跡を表示してもよい。また観測されたデータから予測される位置に、人工的に別の対象物(生成物)を表してもよい。この場合、生成物の位置の計算は別途行い、ユーザが入力値として入力するようにしてもよい。
図16は付加オブジェクトを描画する別の手法の処理手順を模式的に示している。この例は、スライス画像を用いた3次元オブジェクトの描画と付加オブジェクトの描画を並行に進める手法である。まず付加オブジェクトを描画する位置までスライス画像を用いたアルファブレンディング描画を進める(S80)。そして、この時点で最も上にあるスライス画像150aから次のスライス画像までの空間にあるべき付加オブジェクトの部分152aを描画する(S82)。
続いてスライス画像150aの次に位置するスライス画像150bを重ね合わせる(S84)。そして当該スライス画像150bから次のスライス画像までの空間にあるべき付加オブジェクトの部分152bを描画する(S86)。同図の場合、この段階で付加オブジェクト全体が描画されている。その後は残りのスライス画像を重ね合わせていくことにより、図15と同様、3次元オブジェクト146内に付加オブジェクト140としてカーソルが浮いた状態を描画できる(S88)。
図17はセンサ群12が所定のレートで計測を行った結果を3次元オブジェクトの動画として表示する際のスライス画像データの読み出し手順を模式的に示している。この場合、スライス画像記憶部48には各計測時刻t=0、1、・・・、Tのそれぞれに対しスライス画像群が生成される。実際には各時刻に対し3方向のスライス画像群が生成されるがここでは図示を省略している。
このようなスライス画像を用いて動画を表示する場合は特に、視点および時間双方のパラメータの変化に追随させて新たなスライス画像データをロードし、描画する必要があるため、各処理の効率化が求められる。動画とせずに視点の移動のみで表示を変化させる場合も同様である。スライス画像記憶部48を2次記憶装置として構成した場合、描画用メモリ56へのデータ転送処理は描画遅延の原因となりやすい。
そこでスライス画像管理部52は、描画に必要なスライス画像の順に描画メモリ56にロードするようにする。例えば視点の位置から最も遠いスライス画像を特定し、当該スライス画像のデータから順にロードしていく。このとき転送経路となるバスの帯域幅などによって複数のスライス画像からなるロード単位を形成し、当該ロード単位でロードしてもよい。同図の例では太枠で示した3枚のスライス画像のデータをロード単位として同時にロードしている。
最初のスライス画像データがロードされた直後から、画像描画部54はスライス画像データを描画用メモリ56から順に読み出し、アルファブレンディング描画を実行していく。この描画処理と並行して、スライス画像管理部52は以降のスライス画像のデータをロード単位でロードしていく。t=0のスライス画像群のロードが完了したら、t=1のスライス画像群を同様にロードしていく。本実施の形態ではスライス画像を順に重ね合わせて3次元オブジェクトを描画するため、このような並行処理が可能であり、ひいては視点移動要求に対する応答性を向上させたり、動画の円滑な表示が実現できる。
以上述べた本実施の形態によれば、対象物の断面情報を平行な複数の平面で取得した積層画像情報からアルファチャンネルを有するスライス画像を作成し、アルファブレンディング描画することで、計測空間を3次元オブジェクトで表現する。これにより一般的な画像処理機能を用い、処理の負荷や必要なリソースを増大させることなく、対象物やその周囲の状態を、直感的に理解可能な形態で可視化することが容易にできる。
スライス画像を生成する段階で、アルファ値や色情報の決定規則を様々変化させることができるため、画像を作成するユーザ自身が、表示内容や表示目的に適した加工を行うことが容易である。また最初に取得した積層画像情報が一つの軸に対するものであっても、あらかじめ複数の軸に対するスライス画像を生成しておき、3次元オブジェクト表示時には視点の位置に応じて用いるスライス画像を切り替える。さらに視点の近さに応じてスライス画像の量を調整する。これらの構成により、ソースデータが離散的な2次元画像であっても、3次元オブジェクトを全方位から違和感なく表示させることができる。また複数の軸に対するスライス画像は描画に必要になったとき生成することもできる。このようにすればスライス画像を格納するメモリの容量を削減できる。
さらに、3次元オブジェクト内に透明、半透明の空間を生成させることができるため、カーソルなどの付加オブジェクトを3次元オブジェクト内に表示できる。結果として、対象物を指し示したり、対象物に追随するマーカーをつけたり軌跡を可視化したり、といったことが容易にでき、プレゼンテーションなどにおいて好適な表示を実現できる。
さらに3次元オブジェクトを表示する際は、視点の位置に応じて用いるスライス画像の順序を確定できるため、二次記憶装置からメモリへのデータのロードをその順で行えば、ロード処理と描画処理を並行させることができる。これにより、視点を移動させたり3次元オブジェクトを動画にしたりして、スライス画像のデータのロード頻度が高くなる状況においても表示までのレイテンシを抑えられる。結果として、メモリ容量を増大させることなく円滑な表示変化を実現できる。
以上、本発明を実施の形態をもとに説明した。上記実施の形態は例示であり、それらの各構成要素や各処理プロセスの組合せにいろいろな変形例が可能なこと、またそうした変形例も本発明の範囲にあることは当業者に理解されるところである。
例えば本実施の形態のスライス平面は、センサ軸や画像軸と所定の角度を有する平面であったが、平面に限らず球面やゆらぎのある曲面などの曲面であってもよい。図18は部分円筒状の曲面あるいは部分球面に対する分布を計測する場合のスライス画像の形状を模式的に示している。同図においてセンサ群208は対象物216の存在する計測空間を測定するが、このときの計測値の分布は、同図縦方向のz軸をセンサ軸とし、それを中心とする平行な複数の曲面210a、210b、・・・、210nに対するものである。同図ではこれらの曲面を、センサ軸を通る断面における扇形の曲線で示している。
このようなスライス曲面210a、210b、・・・、210nに対し、スライス画像生成部44は、実施の形態で述べたのと同様にスライス画像を生成するが、このとき生成されるスライス画像はスライス曲面と同じ曲面状となる。スライス画像をテクスチャとして扱うことにより、その形状が平面か曲面かに関わらず同様の処理が可能となる。また画像軸変換部50は、スライス曲面210a、210b、・・・、210nを所定の角度で横切る平面あるいは曲面を複数準備し、当該面上の計測値を抽出することでスライス曲面210a、210b、・・・、210nとは向きの異なるスライス画像群を生成する。
同図の例では、スライス曲面210a、210b、・・・、210nを垂直に横切る、図面に対し垂直な平面212a、212b、・・・、212nについてスライス画像群を生成している。さらに同図の奥行き方向に並ぶスライス画像群も生成する。このようにして生成した3方向のスライス画像群を用いて描画を行うことにより、部分円筒または部分球形状の3次元オブジェクトを表示できる。この場合は、各方向のスライス画像群で区分けされた小さい立体ごとに、図14で示したのと同様の順序で描画していく。
上述したように本実施の形態では、スライス画像の形状によらず画像をテクスチャとして扱うことにより、一般的なコンピュータグラフィックス技術によって3次元オブジェクトを描画することができる。したがって、その形状や交差する角度がどのようなものであっても、それらが既知であれば同様かつ容易に計測結果を可視化することができる。
10 画像処理システム、 12 センサ群、 14 表示装置、 15 入力装置、 20 画像処理装置、 30 画像データ生成部、 32 表示処理部、 42 センサ出力データ取得部、 44 スライス画像生成部、 46 ベクトル値情報記憶部、 48 スライス画像記憶部、 50 画像軸変換部、 52 スライス画像管理部、 54 画像描画部、 56 描画用メモリ、 58 付加オブジェクト画像記憶部。
以上のように本発明はコンピュータ、画像処理装置、計測装置などの情報処理装置に利用可能である。
Claims (15)
- 所定の軸上の異なる位置において同じ角度で交差する複数のスライス面上に得られた値の分布情報を取得するデータ取得部と、
前記スライス面上の各位置における値に基づきアルファ値を含む画素値を決定することにより前記分布情報を画像として表すスライス画像を前記スライス面ごとに生成するスライス画像生成部と、
前記スライス画像を前記軸上の対応する位置に配列させ、入力された視点の位置に応じてアルファブレンディング描画することにより、前記複数のスライス面によって構成される3次元空間を3次元オブジェクトとして表示する画像描画部と、
を備えたことを特徴とする画像処理装置。 - 前記スライス画像生成部は、前記所定の軸と方向の異なる軸に対し所定の角度をなし位置の異なる複数の面上の各位置における値を前記分布情報から抽出することにより、当該面ごとに前記スライス画像をさらに生成し、
前記画像描画部は、視点の位置に応じて用いるスライス画像の軸を切り替えることを特徴とする請求項1に記載の画像処理装置。 - 前記データ取得部は、複数種類の値の分布情報を取得し、
前記スライス画像生成部は、前記各位置における前記複数種類の値の少なくとも1つと所定のしきい値との大小関係に基づき定められた規則に従い、当該位置におけるアルファ値を決定することを特徴とする請求項1または2に記載の画像処理装置。 - 前記データ取得部は、複数種類の値の分布情報を取得し、
前記スライス画像生成部は、前記各位置における前記複数種類の値の組み合わせに対してあらかじめ設定されたアルファ値を当該位置におけるアルファ値として決定することを特徴とする請求項1または2に記載の画像処理装置。 - 視点と前記3次元オブジェクトとの距離の減少に応じて、前記配列において隣り合う前記スライス画像の対応する画素の画素値を補間し新たなスライス画像を生成することによりスライス画像間を補間するスライス画像管理部をさらに備えたことを特徴とする請求項1から4のいずれかに記載の画像処理装置。
- 前記画像描画部は、所定の角度で交差する3方向の軸に対する前記スライス画像を同時に配列させ、各スライス画像の面によって区切られる立体単位で視点から遠い順にアルファブレンディング描画することにより前記3次元オブジェクトを表示することを特徴とする請求項1および3から5のいずれかに記載の画像処理装置。
- 前記画像描画部は、視点の位置に応じて定まる前記3次元オブジェクト内部の空間に、あらかじめ準備した付加的なオブジェクトを描画した後、アルファブレンディング描画により前記3次元オブジェクトを描画することを特徴とする請求項1から6のいずれかに記載の画像処理装置。
- 前記画像描画部は、あらかじめ準備した付加的なオブジェクトのモデルを、配列させたスライス画像の面によって分割することにより当該付加的なオブジェクトの描画単位を生成し、一つの描画単位を挟むスライス画像のうち一方を描画したあと、当該描画単位を描画してから他方のスライス画像を描画することにより、前記3次元オブジェクトの内部に前記付加的なオブジェクトを描画することを特徴とする請求項1から6のいずれかに記載の画像処理装置。
- 前記画像描画部は、所定の位置関係を有する複数の視点に対する複数の前記3次元オブジェクトを描画し同時または順次に表示することにより当該3次元オブジェクトを立体視させることを特徴とする請求項1から8のいずれかに記載の画像処理装置。
- 前記データ取得部は、複数の軸に対応する複数の前記分布情報を取得し、
前記スライス画像生成部は、当該複数の軸に対する前記複数のスライス面ごとにスライス画像を生成し、
前記画像描画部は、視点の位置に応じて用いるスライス画像の軸を切り替えることを特徴とする請求項1に記載の画像処理装置。 - 所定の軸上の異なる位置において同じ角度で交差する複数のスライス面上に得られた値の分布情報について、前記スライス面上の各位置における値に基づきアルファ値を含む画素値を決定することにより生成された、前記分布情報を画像として表すスライス画像のデータを格納したスライス画像記憶部と、
入力された視点の位置に応じて前記スライス画像のデータを前記スライス画像記憶部から描画用メモリにロードするスライス画像管理部と、
前記スライス画像管理部によるロード処理と並行して、前記描画用メモリにロードされた順に、前記スライス画像を前記軸上の対応する位置に配列させアルファブレンディング描画することにより、前記複数のスライス面によって構成される3次元空間を3次元オブジェクトとして表示する画像描画部と、
を備えたことを特徴とする画像処理装置。 - 画像処理装置において所定の軸上の異なる位置において同じ角度で交差する複数のスライス面上に得られた値の分布情報を取得するステップと、
前記スライス面上の各位置における値に基づきアルファ値を含む画素値を決定することにより前記分布情報を画像として表すスライス画像のデータを前記スライス面ごとに生成するステップと、
各スライス画像を前記軸上の対応する位置に配列させ、入力装置から入力された視点の位置に応じてアルファブレンディング描画することにより、前記複数のスライス面によって構成される3次元空間を3次元オブジェクトとして表示装置に表示するステップと、
を含むことを特徴とする画像処理方法。 - 所定の軸上の異なる位置において同じ角度で交差する複数のスライス面上に得られた値の分布情報を取得する機能と、
前記スライス面上の各位置における値に基づきアルファ値を含む画素値を決定することにより前記分布情報を画像として表すスライス画像を前記スライス面ごとに生成する機能と、
前記スライス画像を前記軸上の対応する位置に配列させ、入力された視点の位置に応じてアルファブレンディング描画することにより、前記複数のスライス面によって構成される3次元空間を3次元オブジェクトとして表示装置に表示する機能と、
をコンピュータに実現させることを特徴とするコンピュータプログラム。 - 所定の軸上の異なる位置において同じ角度で交差する位置の異なる複数のスライス面上に得られた値の分布情報を取得する機能と、
前記スライス面上の各位置における値に基づきアルファ値を含む画素値を決定することにより前記分布情報を画像として表すスライス画像を前記スライス面ごとに生成する機能と、
前記スライス画像を前記軸上の対応する位置に配列させ、入力された視点の位置に応じてアルファブレンディング描画することにより、前記複数のスライス面によって構成される3次元空間を3次元オブジェクトとして表示装置に表示する機能と、
をコンピュータに実現させるコンピュータプログラムを記録したことを特徴とする記録媒体。 - 所定の軸上の異なる位置において同じ角度で交差する複数のスライス面上に得られた値の分布情報について、前記スライス面上の各位置における値に基づきアルファ値を含む画素値を決定することにより生成された、前記分布情報を画像として表すスライス画像のデータと、前記軸の方向および軸上の位置と、を対応づけた画像ファイルのデータ構造であって、
画像処理装置において、前記スライス画像を前記軸上の対応する位置に配列させ、入力された視点の位置に応じてアルファブレンディング描画することにより、前記複数のスライス面によって構成される3次元空間を3次元オブジェクトとして表示装置に表示するためにメモリにロードされることを特徴とする画像ファイルのデータ構造。
Priority Applications (3)
| Application Number | Priority Date | Filing Date | Title |
|---|---|---|---|
| EP12847428.5A EP2779109B1 (en) | 2011-11-10 | 2012-10-23 | Image processing device, image processing method and image file data structure |
| CN201280054856.6A CN103918013B (zh) | 2011-11-10 | 2012-10-23 | 图像处理装置、图像处理方法、及图像文件的数据结构 |
| US14/356,753 US9466146B2 (en) | 2011-11-10 | 2012-10-23 | Image processing apparatus, image processing method and data structure of image file |
Applications Claiming Priority (2)
| Application Number | Priority Date | Filing Date | Title |
|---|---|---|---|
| JP2011246279A JP5866177B2 (ja) | 2011-11-10 | 2011-11-10 | 画像処理装置および画像処理方法 |
| JP2011-246279 | 2011-11-10 |
Publications (1)
| Publication Number | Publication Date |
|---|---|
| WO2013069215A1 true WO2013069215A1 (ja) | 2013-05-16 |
Family
ID=48289080
Family Applications (1)
| Application Number | Title | Priority Date | Filing Date |
|---|---|---|---|
| PCT/JP2012/006767 WO2013069215A1 (ja) | 2011-11-10 | 2012-10-23 | 画像処理装置、画像処理方法、および画像ファイルのデータ構造 |
Country Status (5)
| Country | Link |
|---|---|
| US (1) | US9466146B2 (ja) |
| EP (1) | EP2779109B1 (ja) |
| JP (1) | JP5866177B2 (ja) |
| CN (1) | CN103918013B (ja) |
| WO (1) | WO2013069215A1 (ja) |
Cited By (1)
| Publication number | Priority date | Publication date | Assignee | Title |
|---|---|---|---|---|
| WO2016166858A1 (ja) * | 2015-04-15 | 2016-10-20 | オリンパス株式会社 | 顕微鏡観察システム、顕微鏡観察方法、及び顕微鏡観察プログラム |
Families Citing this family (14)
| Publication number | Priority date | Publication date | Assignee | Title |
|---|---|---|---|---|
| US9132352B1 (en) | 2010-06-24 | 2015-09-15 | Gregory S. Rabin | Interactive system and method for rendering an object |
| US9754169B2 (en) * | 2011-12-16 | 2017-09-05 | Nec Corporation | Information processing system, information processing method, information processing device and control method and control program thereof, and communication terminal and control method and control program thereof |
| JP5988088B2 (ja) * | 2012-06-08 | 2016-09-07 | 富士通株式会社 | 描画プログラム、描画方法、および、描画装置 |
| KR20150033162A (ko) * | 2013-09-23 | 2015-04-01 | 삼성전자주식회사 | 컴포지터, 이를 포함하는 시스템온칩 및 이의 구동 방법 |
| JP5665068B1 (ja) | 2014-09-05 | 2015-02-04 | 株式会社Live2D | プログラム、情報処理装置、制御方法及び記録媒体 |
| JP6738631B2 (ja) * | 2016-03-29 | 2020-08-12 | ザイオソフト株式会社 | 医用画像処理装置、医用画像処理方法、及び医用画像処理プログラム |
| CN106127862B (zh) * | 2016-06-16 | 2019-02-26 | 财付通支付科技有限公司 | 图形的处理方法和装置 |
| CN106210693A (zh) * | 2016-06-29 | 2016-12-07 | 联想(北京)有限公司 | 一种图像显示的方法、电子设备及电子装置 |
| KR101947692B1 (ko) * | 2017-06-23 | 2019-04-29 | 주식회사 맥스로텍 | 3d 모델 슬라이싱 장치 및 방법 |
| US20200388032A1 (en) * | 2019-06-04 | 2020-12-10 | JelloX Biotech Inc. | Three dimensional histopathology imaging method and system thereof |
| CN110505465B (zh) * | 2019-08-30 | 2022-08-23 | 京东方科技集团股份有限公司 | 数据传输方法、三维图像显示方法、装置及电子设备 |
| WO2021150421A1 (en) * | 2020-01-24 | 2021-07-29 | St. Jude Medical, Cardiology Division, Inc. | System and method for generating three dimensional geometric models of anatomical regions |
| CN114489315B (zh) * | 2020-11-12 | 2023-12-19 | 幻景启动股份有限公司 | 图像处理系统以及图像处理装置 |
| KR102353500B1 (ko) * | 2020-11-25 | 2022-01-20 | 한국전자기술연구원 | 공차 오류 문제를 해결하기 위한 3d 프린팅 슬라이싱 방법 |
Citations (2)
| Publication number | Priority date | Publication date | Assignee | Title |
|---|---|---|---|---|
| JPH05266215A (ja) * | 1992-03-18 | 1993-10-15 | Toshiba Corp | 画像表示装置 |
| JP2003263651A (ja) * | 2002-03-12 | 2003-09-19 | Inst Of Physical & Chemical Res | ボリュームレンダリング方法とそのプログラム |
Family Cites Families (10)
| Publication number | Priority date | Publication date | Assignee | Title |
|---|---|---|---|---|
| US6297799B1 (en) * | 1998-11-12 | 2001-10-02 | James Knittel | Three-dimensional cursor for a real-time volume rendering system |
| US7133041B2 (en) * | 2000-02-25 | 2006-11-07 | The Research Foundation Of State University Of New York | Apparatus and method for volume processing and rendering |
| JP3529759B2 (ja) * | 2001-01-26 | 2004-05-24 | 株式会社ソニー・コンピュータエンタテインメント | 画像処理プログラム、画像処理プログラムを記録したコンピュータ読み取り可能な記録媒体、プログラム実行装置、画像処理装置、及び画像処理方法 |
| US7043701B2 (en) * | 2002-01-07 | 2006-05-09 | Xerox Corporation | Opacity desktop with depth perception |
| JP2004141514A (ja) * | 2002-10-28 | 2004-05-20 | Toshiba Corp | 画像処理装置及び超音波診断装置 |
| JP3960382B2 (ja) * | 2003-06-18 | 2007-08-15 | 独立行政法人産業技術総合研究所 | テンソルボリュームデータの実時間可視化方法及び装置 |
| US7154500B2 (en) | 2004-04-20 | 2006-12-26 | The Chinese University Of Hong Kong | Block-based fragment filtration with feasible multi-GPU acceleration for real-time volume rendering on conventional personal computer |
| US8330763B2 (en) * | 2007-11-28 | 2012-12-11 | Siemens Aktiengesellschaft | Apparatus and method for volume rendering on multiple graphics processing units (GPUs) |
| US8044971B2 (en) * | 2008-01-31 | 2011-10-25 | Arm Norway As | Methods of and apparatus for processing computer graphics |
| DE102009042327A1 (de) * | 2009-09-21 | 2011-04-07 | Siemens Aktiengesellschaft | Effiziente Visualisierung von Objekteigenschaften mittels Volume Rendering |
-
2011
- 2011-11-10 JP JP2011246279A patent/JP5866177B2/ja active Active
-
2012
- 2012-10-23 CN CN201280054856.6A patent/CN103918013B/zh active Active
- 2012-10-23 EP EP12847428.5A patent/EP2779109B1/en active Active
- 2012-10-23 US US14/356,753 patent/US9466146B2/en active Active
- 2012-10-23 WO PCT/JP2012/006767 patent/WO2013069215A1/ja active Application Filing
Patent Citations (2)
| Publication number | Priority date | Publication date | Assignee | Title |
|---|---|---|---|---|
| JPH05266215A (ja) * | 1992-03-18 | 1993-10-15 | Toshiba Corp | 画像表示装置 |
| JP2003263651A (ja) * | 2002-03-12 | 2003-09-19 | Inst Of Physical & Chemical Res | ボリュームレンダリング方法とそのプログラム |
Non-Patent Citations (2)
| Title |
|---|
| KOICHI MATSUDA ET AL.: "Interactive Arbitrary Cross-Section Visualization Using 2D-Texture on Standard PC", THE TRANSACTIONS OF THE INSTITUTE OF ELECTRONICS, INFORMATION AND COMMUNICATION ENGINEERS(J85-D-II), 1 August 2002 (2002-08-01), pages 1351 - 1354, XP008173547 * |
| See also references of EP2779109A4 * |
Cited By (2)
| Publication number | Priority date | Publication date | Assignee | Title |
|---|---|---|---|---|
| WO2016166858A1 (ja) * | 2015-04-15 | 2016-10-20 | オリンパス株式会社 | 顕微鏡観察システム、顕微鏡観察方法、及び顕微鏡観察プログラム |
| US10429632B2 (en) | 2015-04-15 | 2019-10-01 | Olympus Corporation | Microscopy system, microscopy method, and computer-readable recording medium |
Also Published As
| Publication number | Publication date |
|---|---|
| US20140306952A1 (en) | 2014-10-16 |
| EP2779109A4 (en) | 2016-06-01 |
| EP2779109A1 (en) | 2014-09-17 |
| JP2013105188A (ja) | 2013-05-30 |
| JP5866177B2 (ja) | 2016-02-17 |
| US9466146B2 (en) | 2016-10-11 |
| CN103918013B (zh) | 2017-10-20 |
| CN103918013A (zh) | 2014-07-09 |
| EP2779109B1 (en) | 2020-04-22 |
Similar Documents
| Publication | Publication Date | Title |
|---|---|---|
| JP5866177B2 (ja) | 画像処理装置および画像処理方法 | |
| JP6563048B2 (ja) | スクリーンの位置によって異なる解像度のターゲットの複数レンダリングのテクスチャ・マッピングの傾き調整 | |
| CN112513712B (zh) | 具有虚拟内容翘曲的混合现实系统和使用该系统生成虚拟内容的方法 | |
| CN104794758B (zh) | 一种三维图像的裁剪方法 | |
| JP6359868B2 (ja) | 3次元データ表示装置、3次元データ表示方法、及び3次元データ表示プログラム | |
| KR20160130433A (ko) | 가변 렌더링 및 래스터화 파라미터 하에서 가변 뷰포트에 대하여 오브젝트를 효율적으로 리렌더링하는 방법 | |
| US10217259B2 (en) | Method of and apparatus for graphics processing | |
| CN106648049A (zh) | 一种基于眼球追踪及眼动点预测的立体渲染方法 | |
| JP4885042B2 (ja) | 画像処理方法および装置ならびにプログラム | |
| JP7038683B2 (ja) | 合成装置、方法及びプログラム | |
| CN110458959B (zh) | 体三维显示仿真方法、装置、设备及计算机可读存储介质 | |
| JP2012190428A (ja) | 立体映像視覚効果処理方法 | |
| US9401044B1 (en) | Method for conformal visualization | |
| JP6719596B2 (ja) | 画像生成装置、及び画像表示制御装置 | |
| US11120614B2 (en) | Image generation apparatus and image generation method | |
| JP2009247502A (ja) | 中間画像生成方法および装置ならびにプログラム | |
| US8203553B2 (en) | Distributed calculation of images of volumetric objects | |
| JP6106293B2 (ja) | 画像処理装置、画像処理システム、および画像処理方法 | |
| JP2008259698A (ja) | 画像処理方法および装置並びにプログラム | |
| Dong et al. | Resolving incorrect visual occlusion in outdoor augmented reality using TOF camera and OpenGL frame buffer | |
| KR20120138185A (ko) | 저해상도 그래픽 영상을 고해상도 그래픽 영상으로 실시간 변환하는 그래픽 영상 처리 장치 및 방법 | |
| US6856325B2 (en) | Information processing method and apparatus | |
| US20140320494A1 (en) | Image processing apparatus, image processing method, computer readable non-transitory recording medium and image processing system | |
| JP7455546B2 (ja) | 画像処理装置、画像処理方法、及びプログラム | |
| US10453247B1 (en) | Vertex shift for rendering 360 stereoscopic content |
Legal Events
| Date | Code | Title | Description |
|---|---|---|---|
| 121 | Ep: the epo has been informed by wipo that ep was designated in this application |
Ref document number: 12847428 Country of ref document: EP Kind code of ref document: A1 |
|
| WWE | Wipo information: entry into national phase |
Ref document number: 14356753 Country of ref document: US |
|
| NENP | Non-entry into the national phase |
Ref country code: DE |
|
| WWE | Wipo information: entry into national phase |
Ref document number: 2012847428 Country of ref document: EP |