WO2012144485A1 - Method for detecting nucleic acid molecule in biosample - Google Patents
Method for detecting nucleic acid molecule in biosample Download PDFInfo
- Publication number
- WO2012144485A1 WO2012144485A1 PCT/JP2012/060334 JP2012060334W WO2012144485A1 WO 2012144485 A1 WO2012144485 A1 WO 2012144485A1 JP 2012060334 W JP2012060334 W JP 2012060334W WO 2012144485 A1 WO2012144485 A1 WO 2012144485A1
- Authority
- WO
- WIPO (PCT)
- Prior art keywords
- nucleic acid
- sample solution
- acid molecule
- detecting
- probe
- Prior art date
Links
- 108020004707 nucleic acids Proteins 0.000 title claims abstract description 233
- 102000039446 nucleic acids Human genes 0.000 title claims abstract description 233
- 150000007523 nucleic acids Chemical class 0.000 title claims abstract description 232
- 238000000034 method Methods 0.000 title claims abstract description 178
- 239000012488 sample solution Substances 0.000 claims abstract description 183
- 108020004711 Nucleic Acid Probes Proteins 0.000 claims abstract description 128
- 239000002853 nucleic acid probe Substances 0.000 claims abstract description 128
- 239000002245 particle Substances 0.000 claims description 212
- 238000001514 detection method Methods 0.000 claims description 139
- 230000003287 optical effect Effects 0.000 claims description 92
- 239000012472 biological sample Substances 0.000 claims description 83
- 239000000126 substance Substances 0.000 claims description 69
- 108090000623 proteins and genes Proteins 0.000 claims description 63
- 102000004169 proteins and genes Human genes 0.000 claims description 63
- 230000033001 locomotion Effects 0.000 claims description 29
- 238000009739 binding Methods 0.000 claims description 23
- 238000009792 diffusion process Methods 0.000 claims description 15
- 238000012546 transfer Methods 0.000 claims description 9
- IAZDPXIOMUYVGZ-UHFFFAOYSA-N Dimethylsulphoxide Chemical compound CS(C)=O IAZDPXIOMUYVGZ-UHFFFAOYSA-N 0.000 claims description 6
- ZHNUHDYFZUAESO-UHFFFAOYSA-N Formamide Chemical compound NC=O ZHNUHDYFZUAESO-UHFFFAOYSA-N 0.000 claims description 6
- 239000004094 surface-active agent Substances 0.000 claims description 6
- 108091005804 Peptidases Proteins 0.000 claims description 5
- 102000035195 Peptidases Human genes 0.000 claims description 5
- XSQUKJJJFZCRTK-UHFFFAOYSA-N Urea Chemical compound NC(N)=O XSQUKJJJFZCRTK-UHFFFAOYSA-N 0.000 claims description 3
- 239000004202 carbamide Substances 0.000 claims description 3
- 238000002372 labelling Methods 0.000 claims description 3
- 230000003247 decreasing effect Effects 0.000 claims 1
- 238000002360 preparation method Methods 0.000 abstract description 13
- 238000004364 calculation method Methods 0.000 abstract description 6
- 239000000523 sample Substances 0.000 description 100
- 238000005259 measurement Methods 0.000 description 56
- 239000000243 solution Substances 0.000 description 35
- 239000000047 product Substances 0.000 description 29
- 230000008569 process Effects 0.000 description 22
- 238000004204 optical analysis method Methods 0.000 description 21
- 238000012545 processing Methods 0.000 description 20
- 230000008859 change Effects 0.000 description 16
- 230000005284 excitation Effects 0.000 description 16
- 238000004458 analytical method Methods 0.000 description 15
- 239000013615 primer Substances 0.000 description 14
- 108091034117 Oligonucleotide Proteins 0.000 description 12
- 108020004414 DNA Proteins 0.000 description 11
- 239000007983 Tris buffer Substances 0.000 description 11
- 210000004369 blood Anatomy 0.000 description 11
- 239000008280 blood Substances 0.000 description 11
- 239000000356 contaminant Substances 0.000 description 11
- 238000009826 distribution Methods 0.000 description 11
- 238000002060 fluorescence correlation spectroscopy Methods 0.000 description 11
- LENZDBCJOHFCAS-UHFFFAOYSA-N tris Chemical compound OCC(N)(CO)CO LENZDBCJOHFCAS-UHFFFAOYSA-N 0.000 description 11
- 241000283073 Equus caballus Species 0.000 description 10
- 238000002866 fluorescence resonance energy transfer Methods 0.000 description 10
- 238000003199 nucleic acid amplification method Methods 0.000 description 9
- 150000003839 salts Chemical class 0.000 description 9
- 230000005653 Brownian motion process Effects 0.000 description 8
- 108010067770 Endopeptidase K Proteins 0.000 description 8
- 230000003321 amplification Effects 0.000 description 8
- 238000005537 brownian motion Methods 0.000 description 8
- 238000009499 grossing Methods 0.000 description 8
- 238000012360 testing method Methods 0.000 description 8
- 210000001519 tissue Anatomy 0.000 description 8
- 108091032973 (ribonucleotides)n+m Proteins 0.000 description 7
- 230000009471 action Effects 0.000 description 7
- 230000000295 complement effect Effects 0.000 description 7
- 150000001875 compounds Chemical class 0.000 description 7
- 238000004925 denaturation Methods 0.000 description 7
- 230000036425 denaturation Effects 0.000 description 7
- 239000002773 nucleotide Substances 0.000 description 7
- 125000003729 nucleotide group Chemical group 0.000 description 7
- FAPWRFPIFSIZLT-UHFFFAOYSA-M Sodium chloride Chemical compound [Na+].[Cl-] FAPWRFPIFSIZLT-UHFFFAOYSA-M 0.000 description 6
- 238000010586 diagram Methods 0.000 description 6
- 238000005516 engineering process Methods 0.000 description 6
- 239000012530 fluid Substances 0.000 description 6
- 230000007246 mechanism Effects 0.000 description 6
- 230000035945 sensitivity Effects 0.000 description 6
- 239000002904 solvent Substances 0.000 description 6
- 239000006228 supernatant Substances 0.000 description 6
- 238000000137 annealing Methods 0.000 description 5
- 238000006243 chemical reaction Methods 0.000 description 5
- 239000003795 chemical substances by application Substances 0.000 description 5
- 230000007423 decrease Effects 0.000 description 5
- 238000002474 experimental method Methods 0.000 description 5
- 239000010419 fine particle Substances 0.000 description 5
- 239000007850 fluorescent dye Substances 0.000 description 5
- 238000002844 melting Methods 0.000 description 5
- 230000008018 melting Effects 0.000 description 5
- 239000012088 reference solution Substances 0.000 description 5
- VYPSYNLAJGMNEJ-UHFFFAOYSA-N Silicium dioxide Chemical compound O=[Si]=O VYPSYNLAJGMNEJ-UHFFFAOYSA-N 0.000 description 4
- 210000003850 cellular structure Anatomy 0.000 description 4
- 238000005119 centrifugation Methods 0.000 description 4
- 238000007796 conventional method Methods 0.000 description 4
- 238000010494 dissociation reaction Methods 0.000 description 4
- 238000001962 electrophoresis Methods 0.000 description 4
- 238000006911 enzymatic reaction Methods 0.000 description 4
- 239000007788 liquid Substances 0.000 description 4
- 239000002953 phosphate buffered saline Substances 0.000 description 4
- 238000004611 spectroscopical analysis Methods 0.000 description 4
- 239000000758 substrate Substances 0.000 description 4
- QKNYBSVHEMOAJP-UHFFFAOYSA-N 2-amino-2-(hydroxymethyl)propane-1,3-diol;hydron;chloride Chemical compound Cl.OCC(N)(CO)CO QKNYBSVHEMOAJP-UHFFFAOYSA-N 0.000 description 3
- KCXVZYZYPLLWCC-UHFFFAOYSA-N EDTA Chemical compound OC(=O)CN(CC(O)=O)CCN(CC(O)=O)CC(O)=O KCXVZYZYPLLWCC-UHFFFAOYSA-N 0.000 description 3
- 102000004190 Enzymes Human genes 0.000 description 3
- 108090000790 Enzymes Proteins 0.000 description 3
- 108091093037 Peptide nucleic acid Proteins 0.000 description 3
- ISWSIDIOOBJBQZ-UHFFFAOYSA-N Phenol Chemical compound OC1=CC=CC=C1 ISWSIDIOOBJBQZ-UHFFFAOYSA-N 0.000 description 3
- JLCPHMBAVCMARE-UHFFFAOYSA-N [3-[[3-[[3-[[3-[[3-[[3-[[3-[[3-[[3-[[3-[[3-[[5-(2-amino-6-oxo-1H-purin-9-yl)-3-[[3-[[3-[[3-[[3-[[3-[[5-(2-amino-6-oxo-1H-purin-9-yl)-3-[[5-(2-amino-6-oxo-1H-purin-9-yl)-3-hydroxyoxolan-2-yl]methoxy-hydroxyphosphoryl]oxyoxolan-2-yl]methoxy-hydroxyphosphoryl]oxy-5-(5-methyl-2,4-dioxopyrimidin-1-yl)oxolan-2-yl]methoxy-hydroxyphosphoryl]oxy-5-(6-aminopurin-9-yl)oxolan-2-yl]methoxy-hydroxyphosphoryl]oxy-5-(6-aminopurin-9-yl)oxolan-2-yl]methoxy-hydroxyphosphoryl]oxy-5-(6-aminopurin-9-yl)oxolan-2-yl]methoxy-hydroxyphosphoryl]oxy-5-(6-aminopurin-9-yl)oxolan-2-yl]methoxy-hydroxyphosphoryl]oxyoxolan-2-yl]methoxy-hydroxyphosphoryl]oxy-5-(5-methyl-2,4-dioxopyrimidin-1-yl)oxolan-2-yl]methoxy-hydroxyphosphoryl]oxy-5-(4-amino-2-oxopyrimidin-1-yl)oxolan-2-yl]methoxy-hydroxyphosphoryl]oxy-5-(5-methyl-2,4-dioxopyrimidin-1-yl)oxolan-2-yl]methoxy-hydroxyphosphoryl]oxy-5-(5-methyl-2,4-dioxopyrimidin-1-yl)oxolan-2-yl]methoxy-hydroxyphosphoryl]oxy-5-(6-aminopurin-9-yl)oxolan-2-yl]methoxy-hydroxyphosphoryl]oxy-5-(6-aminopurin-9-yl)oxolan-2-yl]methoxy-hydroxyphosphoryl]oxy-5-(4-amino-2-oxopyrimidin-1-yl)oxolan-2-yl]methoxy-hydroxyphosphoryl]oxy-5-(4-amino-2-oxopyrimidin-1-yl)oxolan-2-yl]methoxy-hydroxyphosphoryl]oxy-5-(4-amino-2-oxopyrimidin-1-yl)oxolan-2-yl]methoxy-hydroxyphosphoryl]oxy-5-(6-aminopurin-9-yl)oxolan-2-yl]methoxy-hydroxyphosphoryl]oxy-5-(4-amino-2-oxopyrimidin-1-yl)oxolan-2-yl]methyl [5-(6-aminopurin-9-yl)-2-(hydroxymethyl)oxolan-3-yl] hydrogen phosphate Polymers Cc1cn(C2CC(OP(O)(=O)OCC3OC(CC3OP(O)(=O)OCC3OC(CC3O)n3cnc4c3nc(N)[nH]c4=O)n3cnc4c3nc(N)[nH]c4=O)C(COP(O)(=O)OC3CC(OC3COP(O)(=O)OC3CC(OC3COP(O)(=O)OC3CC(OC3COP(O)(=O)OC3CC(OC3COP(O)(=O)OC3CC(OC3COP(O)(=O)OC3CC(OC3COP(O)(=O)OC3CC(OC3COP(O)(=O)OC3CC(OC3COP(O)(=O)OC3CC(OC3COP(O)(=O)OC3CC(OC3COP(O)(=O)OC3CC(OC3COP(O)(=O)OC3CC(OC3COP(O)(=O)OC3CC(OC3COP(O)(=O)OC3CC(OC3COP(O)(=O)OC3CC(OC3COP(O)(=O)OC3CC(OC3COP(O)(=O)OC3CC(OC3CO)n3cnc4c(N)ncnc34)n3ccc(N)nc3=O)n3cnc4c(N)ncnc34)n3ccc(N)nc3=O)n3ccc(N)nc3=O)n3ccc(N)nc3=O)n3cnc4c(N)ncnc34)n3cnc4c(N)ncnc34)n3cc(C)c(=O)[nH]c3=O)n3cc(C)c(=O)[nH]c3=O)n3ccc(N)nc3=O)n3cc(C)c(=O)[nH]c3=O)n3cnc4c3nc(N)[nH]c4=O)n3cnc4c(N)ncnc34)n3cnc4c(N)ncnc34)n3cnc4c(N)ncnc34)n3cnc4c(N)ncnc34)O2)c(=O)[nH]c1=O JLCPHMBAVCMARE-UHFFFAOYSA-N 0.000 description 3
- 230000004888 barrier function Effects 0.000 description 3
- 239000000872 buffer Substances 0.000 description 3
- 230000003196 chaotropic effect Effects 0.000 description 3
- 239000000835 fiber Substances 0.000 description 3
- 238000003505 heat denaturation Methods 0.000 description 3
- 238000009396 hybridization Methods 0.000 description 3
- 238000007689 inspection Methods 0.000 description 3
- 238000000691 measurement method Methods 0.000 description 3
- 238000002156 mixing Methods 0.000 description 3
- 239000003960 organic solvent Substances 0.000 description 3
- 239000012188 paraffin wax Substances 0.000 description 3
- 210000002966 serum Anatomy 0.000 description 3
- 239000011780 sodium chloride Substances 0.000 description 3
- FVAUCKIRQBBSSJ-UHFFFAOYSA-M sodium iodide Chemical compound [Na+].[I-] FVAUCKIRQBBSSJ-UHFFFAOYSA-M 0.000 description 3
- 238000003756 stirring Methods 0.000 description 3
- 238000003860 storage Methods 0.000 description 3
- HEDRZPFGACZZDS-UHFFFAOYSA-N Chloroform Chemical compound ClC(Cl)Cl HEDRZPFGACZZDS-UHFFFAOYSA-N 0.000 description 2
- 102000053602 DNA Human genes 0.000 description 2
- 239000003155 DNA primer Substances 0.000 description 2
- -1 Hexitol Nucleic Acid Chemical class 0.000 description 2
- 238000009004 PCR Kit Methods 0.000 description 2
- 230000002378 acidificating effect Effects 0.000 description 2
- 230000002776 aggregation Effects 0.000 description 2
- 238000004220 aggregation Methods 0.000 description 2
- 230000029918 bioluminescence Effects 0.000 description 2
- 238000005415 bioluminescence Methods 0.000 description 2
- 210000004027 cell Anatomy 0.000 description 2
- 238000004587 chromatography analysis Methods 0.000 description 2
- 238000004140 cleaning Methods 0.000 description 2
- 230000009849 deactivation Effects 0.000 description 2
- 238000013461 design Methods 0.000 description 2
- 230000023077 detection of light stimulus Effects 0.000 description 2
- 230000004069 differentiation Effects 0.000 description 2
- 239000006185 dispersion Substances 0.000 description 2
- 230000005593 dissociations Effects 0.000 description 2
- 208000018459 dissociative disease Diseases 0.000 description 2
- 238000000605 extraction Methods 0.000 description 2
- 239000000499 gel Substances 0.000 description 2
- PCHJSUWPFVWCPO-UHFFFAOYSA-N gold Chemical compound [Au] PCHJSUWPFVWCPO-UHFFFAOYSA-N 0.000 description 2
- 239000010931 gold Substances 0.000 description 2
- 229910052737 gold Inorganic materials 0.000 description 2
- 238000005286 illumination Methods 0.000 description 2
- 239000012535 impurity Substances 0.000 description 2
- 230000002779 inactivation Effects 0.000 description 2
- 239000000138 intercalating agent Substances 0.000 description 2
- 239000012528 membrane Substances 0.000 description 2
- 239000002736 nonionic surfactant Substances 0.000 description 2
- 238000001821 nucleic acid purification Methods 0.000 description 2
- 239000013307 optical fiber Substances 0.000 description 2
- 238000007557 optical granulometry Methods 0.000 description 2
- 239000013612 plasmid Substances 0.000 description 2
- 239000008213 purified water Substances 0.000 description 2
- 238000005406 washing Methods 0.000 description 2
- XLYOFNOQVPJJNP-UHFFFAOYSA-N water Chemical compound O XLYOFNOQVPJJNP-UHFFFAOYSA-N 0.000 description 2
- NWUYHJFMYQTDRP-UHFFFAOYSA-N 1,2-bis(ethenyl)benzene;1-ethenyl-2-ethylbenzene;styrene Chemical compound C=CC1=CC=CC=C1.CCC1=CC=CC=C1C=C.C=CC1=CC=CC=C1C=C NWUYHJFMYQTDRP-UHFFFAOYSA-N 0.000 description 1
- UMCMPZBLKLEWAF-BCTGSCMUSA-N 3-[(3-cholamidopropyl)dimethylammonio]propane-1-sulfonate Chemical compound C([C@H]1C[C@H]2O)[C@H](O)CC[C@]1(C)[C@@H]1[C@@H]2[C@@H]2CC[C@H]([C@@H](CCC(=O)NCCC[N+](C)(C)CCCS([O-])(=O)=O)C)[C@@]2(C)[C@@H](O)C1 UMCMPZBLKLEWAF-BCTGSCMUSA-N 0.000 description 1
- 206010003445 Ascites Diseases 0.000 description 1
- 239000005909 Kieselgur Substances 0.000 description 1
- 239000000020 Nitrocellulose Substances 0.000 description 1
- 239000004677 Nylon Substances 0.000 description 1
- CTQNGGLPUBDAKN-UHFFFAOYSA-N O-Xylene Chemical compound CC1=CC=CC=C1C CTQNGGLPUBDAKN-UHFFFAOYSA-N 0.000 description 1
- 229920001213 Polysorbate 20 Polymers 0.000 description 1
- 206010036790 Productive cough Diseases 0.000 description 1
- 108091028664 Ribonucleotide Proteins 0.000 description 1
- 108020004682 Single-Stranded DNA Proteins 0.000 description 1
- SAQSTQBVENFSKT-UHFFFAOYSA-M TCA-sodium Chemical compound [Na+].[O-]C(=O)C(Cl)(Cl)Cl SAQSTQBVENFSKT-UHFFFAOYSA-M 0.000 description 1
- 239000013504 Triton X-100 Substances 0.000 description 1
- 229920004890 Triton X-100 Polymers 0.000 description 1
- 238000002835 absorbance Methods 0.000 description 1
- 238000010521 absorption reaction Methods 0.000 description 1
- 239000013543 active substance Substances 0.000 description 1
- 125000003277 amino group Chemical group 0.000 description 1
- 210000004381 amniotic fluid Anatomy 0.000 description 1
- 238000000149 argon plasma sintering Methods 0.000 description 1
- 230000002238 attenuated effect Effects 0.000 description 1
- 238000005311 autocorrelation function Methods 0.000 description 1
- 239000011324 bead Substances 0.000 description 1
- 210000000941 bile Anatomy 0.000 description 1
- 239000011230 binding agent Substances 0.000 description 1
- 238000012742 biochemical analysis Methods 0.000 description 1
- 238000002306 biochemical method Methods 0.000 description 1
- 230000005540 biological transmission Effects 0.000 description 1
- 230000015572 biosynthetic process Effects 0.000 description 1
- 210000001124 body fluid Anatomy 0.000 description 1
- 239000010839 body fluid Substances 0.000 description 1
- 210000001185 bone marrow Anatomy 0.000 description 1
- 238000003759 clinical diagnosis Methods 0.000 description 1
- 230000001112 coagulating effect Effects 0.000 description 1
- 239000000084 colloidal system Substances 0.000 description 1
- 239000002299 complementary DNA Substances 0.000 description 1
- 210000002808 connective tissue Anatomy 0.000 description 1
- 230000008878 coupling Effects 0.000 description 1
- 238000010168 coupling process Methods 0.000 description 1
- 238000005859 coupling reaction Methods 0.000 description 1
- 239000003398 denaturant Substances 0.000 description 1
- 230000006866 deterioration Effects 0.000 description 1
- 238000011161 development Methods 0.000 description 1
- 238000010790 dilution Methods 0.000 description 1
- 239000012895 dilution Substances 0.000 description 1
- LOKCTEFSRHRXRJ-UHFFFAOYSA-I dipotassium trisodium dihydrogen phosphate hydrogen phosphate dichloride Chemical compound P(=O)(O)(O)[O-].[K+].P(=O)(O)([O-])[O-].[Na+].[Na+].[Cl-].[K+].[Cl-].[Na+] LOKCTEFSRHRXRJ-UHFFFAOYSA-I 0.000 description 1
- 201000010099 disease Diseases 0.000 description 1
- 208000037265 diseases, disorders, signs and symptoms Diseases 0.000 description 1
- UZUODNWWWUQRIR-UHFFFAOYSA-L disodium;3-aminonaphthalene-1,5-disulfonate Chemical compound [Na+].[Na+].C1=CC=C(S([O-])(=O)=O)C2=CC(N)=CC(S([O-])(=O)=O)=C21 UZUODNWWWUQRIR-UHFFFAOYSA-L 0.000 description 1
- 238000006073 displacement reaction Methods 0.000 description 1
- 239000012156 elution solvent Substances 0.000 description 1
- 210000000416 exudates and transudate Anatomy 0.000 description 1
- 210000003608 fece Anatomy 0.000 description 1
- 239000012634 fragment Substances 0.000 description 1
- 125000000524 functional group Chemical group 0.000 description 1
- 230000007274 generation of a signal involved in cell-cell signaling Effects 0.000 description 1
- 239000011521 glass Substances 0.000 description 1
- 229960000789 guanidine hydrochloride Drugs 0.000 description 1
- YQOKLYTXVFAUCW-UHFFFAOYSA-N guanidine;isothiocyanic acid Chemical compound N=C=S.NC(N)=N YQOKLYTXVFAUCW-UHFFFAOYSA-N 0.000 description 1
- PJJJBBJSCAKJQF-UHFFFAOYSA-N guanidinium chloride Chemical compound [Cl-].NC(N)=[NH2+] PJJJBBJSCAKJQF-UHFFFAOYSA-N 0.000 description 1
- 125000002887 hydroxy group Chemical group [H]O* 0.000 description 1
- 230000002401 inhibitory effect Effects 0.000 description 1
- 230000005764 inhibitory process Effects 0.000 description 1
- 230000009878 intermolecular interaction Effects 0.000 description 1
- 230000000968 intestinal effect Effects 0.000 description 1
- 239000003456 ion exchange resin Substances 0.000 description 1
- 229920003303 ion-exchange polymer Polymers 0.000 description 1
- 210000003734 kidney Anatomy 0.000 description 1
- 210000004185 liver Anatomy 0.000 description 1
- 210000004072 lung Anatomy 0.000 description 1
- 210000004880 lymph fluid Anatomy 0.000 description 1
- 239000006249 magnetic particle Substances 0.000 description 1
- 125000000956 methoxy group Chemical group [H]C([H])([H])O* 0.000 description 1
- 230000007935 neutral effect Effects 0.000 description 1
- 229920001220 nitrocellulos Polymers 0.000 description 1
- 229920001778 nylon Polymers 0.000 description 1
- 125000004430 oxygen atom Chemical group O* 0.000 description 1
- 239000008363 phosphate buffer Substances 0.000 description 1
- 230000000704 physical effect Effects 0.000 description 1
- 229920000058 polyacrylate Polymers 0.000 description 1
- 229920000515 polycarbonate Polymers 0.000 description 1
- 239000004417 polycarbonate Substances 0.000 description 1
- 239000000256 polyoxyethylene sorbitan monolaurate Substances 0.000 description 1
- 235000010486 polyoxyethylene sorbitan monolaurate Nutrition 0.000 description 1
- 235000010482 polyoxyethylene sorbitan monooleate Nutrition 0.000 description 1
- 229920000053 polysorbate 80 Polymers 0.000 description 1
- 239000002987 primer (paints) Substances 0.000 description 1
- 230000000644 propagated effect Effects 0.000 description 1
- 238000000746 purification Methods 0.000 description 1
- 238000010791 quenching Methods 0.000 description 1
- 230000000171 quenching effect Effects 0.000 description 1
- 238000011084 recovery Methods 0.000 description 1
- 230000009467 reduction Effects 0.000 description 1
- 238000012827 research and development Methods 0.000 description 1
- 239000002336 ribonucleotide Substances 0.000 description 1
- 125000002652 ribonucleotide group Chemical group 0.000 description 1
- 210000003296 saliva Anatomy 0.000 description 1
- 239000012266 salt solution Substances 0.000 description 1
- 238000012216 screening Methods 0.000 description 1
- 210000000582 semen Anatomy 0.000 description 1
- 238000000926 separation method Methods 0.000 description 1
- 239000000741 silica gel Substances 0.000 description 1
- 229910002027 silica gel Inorganic materials 0.000 description 1
- 239000000377 silicon dioxide Substances 0.000 description 1
- 150000003384 small molecules Chemical class 0.000 description 1
- 235000009518 sodium iodide Nutrition 0.000 description 1
- BAZAXWOYCMUHIX-UHFFFAOYSA-M sodium perchlorate Chemical compound [Na+].[O-]Cl(=O)(=O)=O BAZAXWOYCMUHIX-UHFFFAOYSA-M 0.000 description 1
- 229910001488 sodium perchlorate Inorganic materials 0.000 description 1
- 238000012306 spectroscopic technique Methods 0.000 description 1
- 210000003802 sputum Anatomy 0.000 description 1
- 208000024794 sputum Diseases 0.000 description 1
- 238000013179 statistical model Methods 0.000 description 1
- 229910052717 sulfur Inorganic materials 0.000 description 1
- 125000004434 sulfur atom Chemical group 0.000 description 1
- ABZLKHKQJHEPAX-UHFFFAOYSA-N tetramethylrhodamine Chemical compound C=12C=CC(N(C)C)=CC2=[O+]C2=CC(N(C)C)=CC=C2C=1C1=CC=CC=C1C([O-])=O ABZLKHKQJHEPAX-UHFFFAOYSA-N 0.000 description 1
- 210000002700 urine Anatomy 0.000 description 1
- 238000003260 vortexing Methods 0.000 description 1
- 239000008096 xylene Substances 0.000 description 1
Images


Classifications
-
- C—CHEMISTRY; METALLURGY
- C12—BIOCHEMISTRY; BEER; SPIRITS; WINE; VINEGAR; MICROBIOLOGY; ENZYMOLOGY; MUTATION OR GENETIC ENGINEERING
- C12Q—MEASURING OR TESTING PROCESSES INVOLVING ENZYMES, NUCLEIC ACIDS OR MICROORGANISMS; COMPOSITIONS OR TEST PAPERS THEREFOR; PROCESSES OF PREPARING SUCH COMPOSITIONS; CONDITION-RESPONSIVE CONTROL IN MICROBIOLOGICAL OR ENZYMOLOGICAL PROCESSES
- C12Q1/00—Measuring or testing processes involving enzymes, nucleic acids or microorganisms; Compositions therefor; Processes of preparing such compositions
- C12Q1/68—Measuring or testing processes involving enzymes, nucleic acids or microorganisms; Compositions therefor; Processes of preparing such compositions involving nucleic acids
- C12Q1/6813—Hybridisation assays
- C12Q1/6816—Hybridisation assays characterised by the detection means
- C12Q1/6818—Hybridisation assays characterised by the detection means involving interaction of two or more labels, e.g. resonant energy transfer
-
- G—PHYSICS
- G01—MEASURING; TESTING
- G01J—MEASUREMENT OF INTENSITY, VELOCITY, SPECTRAL CONTENT, POLARISATION, PHASE OR PULSE CHARACTERISTICS OF INFRARED, VISIBLE OR ULTRAVIOLET LIGHT; COLORIMETRY; RADIATION PYROMETRY
- G01J3/00—Spectrometry; Spectrophotometry; Monochromators; Measuring colours
- G01J3/28—Investigating the spectrum
- G01J3/44—Raman spectrometry; Scattering spectrometry ; Fluorescence spectrometry
- G01J3/4406—Fluorescence spectrometry
-
- G—PHYSICS
- G01—MEASURING; TESTING
- G01N—INVESTIGATING OR ANALYSING MATERIALS BY DETERMINING THEIR CHEMICAL OR PHYSICAL PROPERTIES
- G01N15/00—Investigating characteristics of particles; Investigating permeability, pore-volume, or surface-area of porous materials
- G01N15/10—Investigating individual particles
- G01N15/14—Electro-optical investigation, e.g. flow cytometers
- G01N15/1456—Electro-optical investigation, e.g. flow cytometers without spatial resolution of the texture or inner structure of the particle, e.g. processing of pulse signals
-
- G—PHYSICS
- G01—MEASURING; TESTING
- G01N—INVESTIGATING OR ANALYSING MATERIALS BY DETERMINING THEIR CHEMICAL OR PHYSICAL PROPERTIES
- G01N21/00—Investigating or analysing materials by the use of optical means, i.e. using sub-millimetre waves, infrared, visible or ultraviolet light
- G01N21/62—Systems in which the material investigated is excited whereby it emits light or causes a change in wavelength of the incident light
- G01N21/63—Systems in which the material investigated is excited whereby it emits light or causes a change in wavelength of the incident light optically excited
- G01N21/64—Fluorescence; Phosphorescence
- G01N21/6428—Measuring fluorescence of fluorescent products of reactions or of fluorochrome labelled reactive substances, e.g. measuring quenching effects, using measuring "optrodes"
-
- G—PHYSICS
- G01—MEASURING; TESTING
- G01N—INVESTIGATING OR ANALYSING MATERIALS BY DETERMINING THEIR CHEMICAL OR PHYSICAL PROPERTIES
- G01N21/00—Investigating or analysing materials by the use of optical means, i.e. using sub-millimetre waves, infrared, visible or ultraviolet light
- G01N21/62—Systems in which the material investigated is excited whereby it emits light or causes a change in wavelength of the incident light
- G01N21/63—Systems in which the material investigated is excited whereby it emits light or causes a change in wavelength of the incident light optically excited
- G01N21/64—Fluorescence; Phosphorescence
- G01N21/645—Specially adapted constructive features of fluorimeters
- G01N21/6456—Spatial resolved fluorescence measurements; Imaging
- G01N21/6458—Fluorescence microscopy
-
- G—PHYSICS
- G02—OPTICS
- G02B—OPTICAL ELEMENTS, SYSTEMS OR APPARATUS
- G02B21/00—Microscopes
- G02B21/0004—Microscopes specially adapted for specific applications
- G02B21/002—Scanning microscopes
- G02B21/0024—Confocal scanning microscopes (CSOMs) or confocal "macroscopes"; Accessories which are not restricted to use with CSOMs, e.g. sample holders
- G02B21/0052—Optical details of the image generation
- G02B21/0076—Optical details of the image generation arrangements using fluorescence or luminescence
-
- G—PHYSICS
- G01—MEASURING; TESTING
- G01N—INVESTIGATING OR ANALYSING MATERIALS BY DETERMINING THEIR CHEMICAL OR PHYSICAL PROPERTIES
- G01N15/00—Investigating characteristics of particles; Investigating permeability, pore-volume, or surface-area of porous materials
- G01N2015/0038—Investigating nanoparticles
-
- G—PHYSICS
- G01—MEASURING; TESTING
- G01N—INVESTIGATING OR ANALYSING MATERIALS BY DETERMINING THEIR CHEMICAL OR PHYSICAL PROPERTIES
- G01N15/00—Investigating characteristics of particles; Investigating permeability, pore-volume, or surface-area of porous materials
- G01N15/10—Investigating individual particles
- G01N15/14—Electro-optical investigation, e.g. flow cytometers
- G01N2015/1486—Counting the particles
-
- G—PHYSICS
- G01—MEASURING; TESTING
- G01N—INVESTIGATING OR ANALYSING MATERIALS BY DETERMINING THEIR CHEMICAL OR PHYSICAL PROPERTIES
- G01N21/00—Investigating or analysing materials by the use of optical means, i.e. using sub-millimetre waves, infrared, visible or ultraviolet light
- G01N21/62—Systems in which the material investigated is excited whereby it emits light or causes a change in wavelength of the incident light
- G01N21/63—Systems in which the material investigated is excited whereby it emits light or causes a change in wavelength of the incident light optically excited
- G01N21/64—Fluorescence; Phosphorescence
- G01N2021/6417—Spectrofluorimetric devices
- G01N2021/6419—Excitation at two or more wavelengths
-
- G—PHYSICS
- G01—MEASURING; TESTING
- G01N—INVESTIGATING OR ANALYSING MATERIALS BY DETERMINING THEIR CHEMICAL OR PHYSICAL PROPERTIES
- G01N21/00—Investigating or analysing materials by the use of optical means, i.e. using sub-millimetre waves, infrared, visible or ultraviolet light
- G01N21/62—Systems in which the material investigated is excited whereby it emits light or causes a change in wavelength of the incident light
- G01N21/63—Systems in which the material investigated is excited whereby it emits light or causes a change in wavelength of the incident light optically excited
- G01N21/64—Fluorescence; Phosphorescence
- G01N2021/6417—Spectrofluorimetric devices
- G01N2021/6421—Measuring at two or more wavelengths
Definitions
- the present invention relates to a method for detecting a nucleic acid molecule in a biological sample using an optical system capable of detecting light from a minute region in a solution, such as an optical system of a confocal microscope or a multiphoton microscope.
- an optical system capable of detecting light from a minute region in a solution, such as an optical system of a confocal microscope or a multiphoton microscope.
- the fluorescence correlation spectroscopic analysis is based on the average residence time (translational diffusion time) of fluorescent molecules and the like in the minute region determined from the value of the autocorrelation function of the measured fluorescence intensity and the average value of the number of staying molecules. Information on the speed or magnitude of movement of fluorescent molecules, etc., and concentration is acquired.
- the fluorescence correlation spectroscopic analysis is based on the average residence time and the average number of staying molecules such as the above-described fluorescent molecules, and the like, such as changes in the structure or size of molecules, binding / dissociation reactions or dispersion / aggregation of molecules. Detect various phenomena. Fluorescence-Intensity Distribution Analysis (FIDA, for example, Patent Document 3) and Photon Counting Histogram (PCH, for example, Patent Document 4) are measured in the same manner as FCS. A histogram of fluorescence intensities of fluorescent molecules entering and leaving the volume is generated.
- FIDA Fluorescence-Intensity Distribution Analysis
- PCH Photon Counting Histogram
- Patent Documents 5 and 6 propose a method for detecting a fluorescent substance based on the passage of time of a fluorescence signal of a sample solution measured using an optical system of a confocal microscope.
- Patent Document 7 weak light from fluorescent fine particles circulated in a flow cytometer or fluorescent fine particles fixed on a substrate is measured using a photon counting technique to determine the presence of fluorescent fine particles in the flow or on the substrate.
- a signal arithmetic processing technique for detection is proposed.
- the sample required for measurement has an extremely low concentration compared with the conventional method.
- the amount used may be about several tens of microliters at a time.
- the measurement time is also greatly reduced (measurement of time on the order of seconds is repeated several times in one measurement). Therefore, these technologies are expected to be powerful tools that can be used for experiments or inspections at low cost or quickly compared to conventional biochemical methods, for example, in the following cases. : ⁇ When analyzing rare or expensive samples often used in the field of medical and biological research and development. ⁇ When the number of specimens is large, such as clinical diagnosis of diseases and screening of physiologically active substances.
- a method for detecting a nucleic acid having a specific base sequence a number of methods for examining a nucleic acid base sequence using artificially synthesized short oligonucleotides such as probes and primers have been reported.
- a biological sample is generally a very small amount, such as a specimen in a clinical test. Therefore, when analyzing a nucleic acid in a biological sample, the nucleic acid contained in the biological sample is amplified after using a general molecular biological technique such as PCR, or simultaneously with the amplification. Methods for detecting nucleic acids are widely used.
- Patent Document 8 discloses that a nucleic acid is extracted from a biological sample by a nucleic acid recovery method using magnetic particles, and then the target nucleic acid is extracted from the extracted nucleic acid using a general molecular biological technique such as a nucleic acid amplification method. A method for detecting a nucleic acid is disclosed.
- Patent Document 9 discloses that after coagulating blood, the obtained serum is subjected to nucleic acid amplification treatment to remove an inhibitory substance for nucleic acid amplification reaction contained in the blood, and the target nucleic acid Has been disclosed.
- Patent Document 10 discloses a method for detecting a target nucleic acid by performing a nucleic acid amplification process on a sample after the blood is diluted and heated.
- the magnitude of the temporal fluctuation of the measured fluorescence intensity is calculated by statistical processing, and the sample solution is based on the magnitude of the fluctuation.
- Various characteristics such as fluorescent molecules entering and exiting the minute region are determined. Therefore, in order to obtain a significant result in the optical analysis technique described above, the concentration or number density of the fluorescent molecules or the like to be observed in the sample solution is measured once in the order of seconds in the equilibrium state.
- the number of fluorescent molecules that can be statistically processed is prepared so as to enter and exit the minute region.
- the concentration of the fluorescent molecule or the like is preferably about 1 nM or more.
- the concentration or number density of the particles to be observed in the sample solution is significantly lower than the level capable of statistical processing (for example, significantly lower than 1 nM)
- the observation target is measured in a minute region. A state that rarely enters in time occurs, and in the fluorescence intensity measurement result, a state where the observation target is not present in the minute region is included for a long period of time, and significant fluorescence The amount of intensity observation decreases.
- the optical analysis technique based on the statistical fluctuation of the fluorescence intensity as described above cannot obtain a significant or accurate analysis result.
- Patent Documents 5 and 6 In the method for detecting a fluorescent substance using an optical system of a confocal microscope described in Patent Documents 5 and 6, the frequency of a fluorescent signal having a significant intensity without performing the statistical processing related to the fluctuation of the fluorescent intensity as described above. And the number of particles such as fluorescent molecules in the sample is disclosed. This is because the presence / absence of a fluorescent molecule or the like to be observed in the sample can be specified by the presence / absence of generation of a fluorescent signal having a significant intensity during a measurement time of several seconds. In particular, Patent Document 6 suggests that detection sensitivity is improved by generating a random flow that stirs the sample solution.
- Patent Document 7 is a technique for individually detecting the presence of fluorescent fine particles in a flow cytometer or fluorescent fine particles fixed on a substrate, and in a normal state in a sample solution. It is not a technique for detecting dissolved or dispersed particles such as molecules or colloids.
- Patent Document 7 since the technique described in Patent Document 7 is not a technique for detecting particles moving randomly in a sample solution, the concentration or number density of particles dissolved or dispersed in the sample solution is determined. Quantitative calculation has not been achieved. Moreover, the technique of patent document 7 includes processes, such as the measurement in a flow cytometer, or the fixation process of the fluorescent particle on a board
- the target nucleic acid can be detected directly from a biological sample containing only a very small amount of the target nucleic acid to be detected without performing a nucleic acid amplification reaction in advance. Be expected. However, among the impurities contained in the biological sample together with the nucleic acid, there is a substance having autofluorescence. For this reason, when it is going to detect the nucleic acid in a biological sample directly with an optical analysis technique, there exists a subject that a nonspecific signal generate
- the presence of contaminants that hinder optical measurement is a greater challenge as the detection sensitivity of optical analysis techniques increases. That is, when the target nucleic acid is detected from a sample derived from a living body such as blood or tissue using a highly sensitive optical analysis technique, the concentration of only the measurement target is accurately determined due to impurities other than the measurement target. It is very difficult to measure.
- An object of the present invention is to provide a method for detecting nucleic acid molecules in a biological sample containing a wide variety of substances.
- the method provided by the present invention uses a novel optical analysis technique.
- This new optical analysis technique does not include statistical processing as is done in optical analysis techniques such as FCS, FIDA, PCH. Therefore, it is possible to detect the state or characteristics of the observation target particles in the sample solution whose concentration or number density of the observation target particles is lower than the level handled by those optical analysis techniques.
- the novel optical analysis technique used by the detection method provided by the present invention has the following characteristics. That is, as a method for detecting a nucleic acid, there is a method for detecting a nucleic acid molecule in a biological sample by using a nucleic acid probe that specifically hybridizes with the nucleic acid molecule, based on the presence or absence of an association with the nucleic acid probe. . In this method, the detection of aggregates including nucleic acid probes is performed using a scanning molecule counting method, so that even when the concentration of nucleic acid molecules to be analyzed in a sample is very low, nucleic acid molecules can be detected with high sensitivity. Can be detected.
- the nucleic acid molecule can be detected with high accuracy by removing contaminants derived from the biological sample in advance before detecting the aggregate containing the nucleic acid probe.
- the scanning molecule counting method is a novel optical analysis technique proposed by the applicant of the present application in Japanese Patent Application No. 2010-044714.
- the method for detecting a nucleic acid molecule according to the first aspect of the present invention includes a preparing step, an associating step, and a calculating step.
- the preparing step prepares a sample solution including a nucleic acid probe that specifically hybridizes with a nucleic acid molecule to be analyzed and a biological sample.
- the nucleic acid molecule in the sample solution prepared in the preparing step is associated with the nucleic acid probe.
- the calculating step after the associating step, the number of molecules of the aggregate including the nucleic acid probe in the sample solution prepared in the preparing step is calculated.
- the method for detecting a nucleic acid molecule includes a step of moving the position of the light detection region, a step of detecting fluorescence, a step of individually detecting aggregates, and a step of counting. Removing.
- the step of moving the position of the light detection region moves the position of the light detection region of the optical system of the confocal microscope or multiphoton microscope in the sample solution in the calculating step.
- the fluorescence emitted from the aggregate in the light detection region is detected while moving the position of the light detection region of the optical system in the sample solution.
- the optical signals from the individual aggregates are individually detected from the detected light, and the aggregates are individually detected.
- the counting step counts the number of particles detected during the movement of the position of the light detection region by counting the number of individually detected aggregates.
- the protein is removed from the sample solution before the calculating step.
- the removing step removes the protein from the biological sample before the preparing step.
- the method for detecting a nucleic acid molecule according to the second aspect of the present invention includes a step of removing proteins from the sample solution after the associating step and before the calculating step.
- the removal of the protein from the sample solution or the biological sample is performed by adsorbing the nucleic acid molecule in the sample solution or the biological sample to an inorganic support. Thereafter, the adsorbed nucleic acid is eluted from the inorganic support.
- the biological sample is subjected to proteolytic enzyme treatment after being collected from the living body.
- the nucleic acid probe is labeled with a fluorescent substance.
- the nucleic acid probe is labeled with a fluorescent substance.
- the sample solution further contains a fluorescent double-stranded nucleic acid binding substance.
- One of the fluorescent substance labeling the nucleic acid probe and the fluorescent double-stranded nucleic acid binding substance is a fluorescent substance that serves as an energy donor in the fluorescence energy transfer phenomenon, and the other is in the fluorescence energy transfer phenomenon. It is a substance that becomes an energy acceptor.
- the fluorescence emitted from the aggregate containing the nucleic acid probe is a fluorescence energy transfer phenomenon that occurs between the fluorescent substance labeled with the nucleic acid probe and the fluorescent double-stranded nucleic acid binding substance. Is the fluorescence emitted by.
- the fluorescence energy transfer occurs, and when the nucleic acid probe is associated with another single-stranded nucleic acid molecule, the fluorescence energy transfer occurs.
- a fluorescent substance serving as an energy donor and a substance serving as an energy acceptor are combined.
- the fluorescence emitted from the aggregate containing the nucleic acid probe is the fluorescence emitted from the fluorescent substance serving as the energy donor.
- the position of the light detection region is moved at a predetermined speed.
- the position of the light detection region is moved at a speed higher than the diffusion movement speed of the aggregate.
- the method for detecting a nucleic acid molecule according to the tenth aspect of the present invention includes a step of individually detecting an optical signal from each aggregate from the detected light, and detecting the aggregate individually. Based on the shape of the time-series optical signal, it is detected that one aggregate has entered the light detection region.
- the sample solution contains one or more selected from the group consisting of a surfactant, formamide, dimethyl sulfoxide, and urea.
- the temperature of the sample solution prepared in the preparing step is set to 70 ° C. or higher in the associating step, whereby the nucleic acid in the sample solution is detected.
- the liquid temperature of the sample solution is lowered at a rate of temperature decrease of 0.05 ° C./second or more to associate nucleic acid molecules in the sample solution.
- the nucleic acid probe is configured by binding two or more molecules selected from the group consisting of DNA, RNA, and nucleic acid analogs.
- the scanning molecule counting method used in the above-described nucleic acid molecule detection method does not execute statistical processing such as calculating fluctuations in fluorescence intensity. Therefore, according to the above-described method for detecting a nucleic acid molecule, the nucleic acid molecule to be analyzed can be detected even when only a very small amount is present in the sample.
- the nucleic acid molecule detection method described above further removes the protein derived from the biological sample from the sample solution before detecting the aggregate of the nucleic acid probe and the nucleic acid molecule to be analyzed in the biological sample by the scanning molecule counting method. To do. Therefore, the nucleic acid molecule to be analyzed can be detected with higher accuracy by the scanning molecule counting method.
- FIG. 1A It is a schematic diagram of the internal structure of the optical analyzer for the scanning molecule counting method in the embodiment of the present invention. It is a schematic diagram of the confocal volume (observation area
- FIG. 6 is a model diagram when the observation target particle crosses the light detection region by moving the position of the light detection region in the sample solution at a speed faster than the diffusion movement speed of the observation target particle. It is a figure which shows the example of the time change of the photon count (light intensity) in the case of FIG. 4A. It is a figure showing the processing procedure for counting particles from the time change of photon count (light intensity) measured by the scanning molecule counting method in the form of a flowchart.
- Example 1 of this invention it is the figure which showed the value of the number of peaks counted in each sample solution.
- Example 1 of this invention in each sample solution, it is the figure which showed the relationship between the density
- Example 2 of this invention it is the figure which showed the value of the number of peaks counted in each sample solution.
- the scanning molecule counting method In the scanning molecule counting method, particles that emit light that moves in a sample solution and moves randomly while traversing the sample solution by the minute region (hereinafter referred to as “luminescent particles”) cross the minute region. In addition, the light emitted from the light emitting particles in the minute region is detected. That is, the scanning molecule counting method individually detects each luminescent particle in a sample solution, and makes it possible to obtain information regarding the counting of the luminescent particles and the concentration or number density of the luminescent particles in the sample solution.
- a sample necessary for measurement may be a very small amount (for example, about several tens of ⁇ L) as in the case of an optical analysis technique such as FIDA.
- the scanning molecule counting method has a short measurement time, and quantitatively characterizes the characteristics such as concentration or number density of luminescent particles having a lower concentration or number density than those of optical analysis techniques such as FIDA. Can be detected.
- the luminescent particle means a particle in which a particle to be observed and a luminescent probe are bonded or associated.
- a “luminescent probe” is a substance (usually a molecule or an aggregate thereof) that has a property of binding or associating with a particle to be observed and emits light.
- the luminescent particles are typically fluorescent particles, but may be particles that emit light by phosphorescence, chemiluminescence, bioluminescence, light scattering, or the like.
- the nucleic acid probe used in the nucleic acid molecule detection method of the present embodiment corresponds to a luminescent probe.
- the “light detection region” of the optical system of the confocal microscope or the multiphoton microscope is a minute region in which light is detected in those microscopes.
- illumination light is given from the objective lens, it corresponds to a region where the illumination light is collected. Note that, in the confocal microscope, the above region is determined by the positional relationship between the objective lens and the pinhole.
- the light is sequentially detected while moving the position of the light detection region in the sample solution. That is, light is detected while scanning the sample solution with the light detection region. Then, when the moving light detection region includes a light emitting probe that is bound or associated with a randomly moving particle, light from the light emitting probe is detected. Thereby, the presence of one particle is detected.
- the light-emitting probe may be dissociated from the particles after detecting the light after binding to the particles to be detected.
- the optical signal from a light emission probe is detected separately. As a result, the presence of particles (coupled to the luminescent probe) is individually and sequentially detected, and various information regarding the state of the particles in the solution is acquired.
- the above configuration may be configured to count individually detected particles and count the number of particles detected during the movement of the position of the light detection region (the number of particles). Counting).
- grains in a sample solution is obtained by combining the number of particle
- an arbitrary method for example, a method of specifying the total volume of the movement locus of the position of the light detection region by moving the position of the light detection region at a predetermined speed
- the relative number density or concentration ratio to a plurality of sample solutions or a standard sample solution serving as a reference for the concentration or number density is calculated.
- the scanning molecule counting method is configured to move the position of the light detection region by changing the optical path of the optical system. Therefore, the movement of the light detection region is rapid, and mechanical vibration and hydrodynamic action are not substantially generated in the sample solution, so that the particles to be detected are affected by the mechanical action.
- the light can be measured in a stable state (the physical properties of the particles may change when vibration or flow acts on the sample solution). Further, since a configuration in which the sample solution is circulated is not necessary, measurement and analysis can be performed with a very small amount of sample solution (about 1 to several tens of ⁇ L) as in the case of FCS, FIDA, and the like.
- the “luminescent probe bonded to one particle” includes the following cases: • One luminescent probe is bound to one particle. • When multiple luminescent probes are bound to one particle. -In the case of a luminescent probe dissociated from a particle after binding to one particle according to the experimental mode. In the present embodiment, typically, when an optical signal having an intensity greater than a predetermined threshold is detected, it is configured that a luminescent probe coupled to one particle is detected to have entered the light detection region. May be.
- the moving speed of the position of the light detection region in the sample solution is based on the characteristics of the luminescent probe bound to the particles or the number density or concentration in the sample solution. It may be changed as appropriate. As will be appreciated by those skilled in the art, the manner of light detected from a luminescent probe bound to a particle can vary depending on its properties or number density or concentration in the sample solution. In particular, as the moving speed of the light detection region increases, the amount of light obtained from the luminescent probe bonded to one particle decreases. Therefore, it is preferable that the moving speed of the light detection region is appropriately changed so that light from the light emitting probe bonded to one particle can be measured with high accuracy or sensitivity.
- the moving speed of the position of the light detection region in the sample solution is preferably a light emitting probe coupled to the particles to be detected (that is, the present embodiment).
- the diffusion movement speed of the aggregate including the nucleic acid probe (the average movement speed of the particles due to Brownian motion) is set higher.
- the scanning molecule counting method detects the light emitted from the luminescent probe when the photodetection region passes through the position of the luminescent probe bound to one particle, and detects the luminescent probe. Detect individually.
- the movement speed of the light detection region is set higher than the diffusion movement speed of the luminescent probe bonded to the particles. Specifically, the moving speed is set so that the moving speed is higher than the diffusion moving speed of the aggregate including the nucleic acid probe.
- the luminescent probe coupled to one particle can be made to correspond to one optical signal (an optical signal indicating the presence of particles). Since the diffusion movement speed varies depending on the luminescent probe bonded to the particle, as described above, the movement speed of the light detection region is appropriately changed according to the characteristics (particularly, the diffusion constant) of the luminescent probe bonded to the particle. It is preferable.
- the optical path of the optical system for moving the position of the light detection region may be changed by an arbitrary method.
- the position of the light detection region may be changed by changing the optical path using a galvanometer mirror employed in a laser scanning optical microscope.
- the movement trajectory of the position of the light detection region may be set arbitrarily.
- the movement locus of the position of the light detection region can be selected from a circle, an ellipse, a rectangle, a straight line, and a curve.
- the light detection mechanism of the scanning molecule counting method is configured to detect light from the light detection region of a confocal microscope or a multiphoton microscope, as in the case of an optical analysis technique such as FIDA. For this reason, the amount of the sample solution used in the scanning molecule counting method may be as small as that in the optical analysis technique such as FIDA. However, in the scanning molecule counting method, statistical processing such as calculating fluctuations in fluorescence intensity is not executed. Therefore, the photoanalysis technique of the scanning molecule counting method can be applied to a sample solution in which the number density or concentration of particles is significantly lower than the level required for an optical analysis technique such as FIDA.
- the scanning molecule counting method is configured to individually detect each particle dispersed or dissolved in the solution, the information is used to quantitatively count particles or particles in the sample solution.
- the concentration or number density can be calculated or information on the concentration or number density can be obtained. That is, in the scanning molecule counting method, particles passing through the light detection region and detected light signals are made to correspond one-to-one to detect particles one by one. Therefore, it is possible to count particles that are dispersed in the solution and move randomly, and the concentration or number density of particles in the sample solution can be determined with higher accuracy than before.
- the concentration of these aggregates in the sample solution is The nucleic acid molecule can be identified even at a concentration lower than the concentration that can be determined based on the fluorescence intensity measured by a fluorescence spectrophotometer or a plate reader.
- the mode in which the optical path of the optical system is changed and the sample solution is scanned in the light detection region is uniform in the sample solution without giving mechanical vibration or hydrodynamic action to the sample solution.
- the sample solution is observed in a mechanically stable state. Therefore, for example, the reliability of the quantitative detection result is improved as compared with the case where a flow is generated in the sample. This is because it is difficult to always provide a uniform flow rate when a flow is applied, and the apparatus configuration is complicated.
- the required amount of sample is greatly increased, and particles, luminescent probes or conjugates or other substances in the solution may be altered or denatured due to the hydrodynamic action of the flow. Because there is.
- measurement can be performed in a state where there is no influence or artifact due to a dynamic action on particles (in this embodiment, an aggregate including a nucleic acid probe) to be detected in a sample solution.
- the scanning molecule counting method is configured by combining an optical system of a confocal microscope capable of executing FCS, FIDA, and the like with a photodetector as schematically illustrated in FIG. 1A.
- This can be realized by an optical analyzer.
- the optical analyzer 1 includes optical systems 2 to 17 and a computer 18 for controlling the operation of each part of the optical system and acquiring and analyzing data.
- the optical system of the optical analyzer 1 may be the same as the optical system of a normal confocal microscope.
- the laser light (Ex) emitted from the light source 2 and propagated through the single mode fiber 3 is emitted as light that diverges at an angle determined by a specific NA at the output end of the fiber, and is collimated. It becomes parallel light by the meter 4.
- the parallel light is reflected by the dichroic mirror 5 and the reflection mirrors 6 and 7 and enters the objective lens 8.
- a microplate 9 in which sample containers or wells 10 into which 1 to several tens of microliters of a sample solution is dispensed is arranged.
- the laser light emitted from the objective lens 8 is focused in the sample solution in the sample container or well 10, and a region (excitation region) having a high light intensity is formed.
- particles that are observation objects and luminescent probes that are bonded to the particles are dispersed or dissolved.
- molecules to which a luminescent label such as a fluorescent dye is added are dispersed or dissolved.
- the barrier filter 14 When light (Em) passes through the barrier filter 14, only light components in a specific wavelength band are selected. Then, light in which only a light component in a specific wavelength band is selected is introduced into the multimode fiber 15 and reaches the photodetector 16. The light that has reached the photodetector 16 is converted into a time-series electrical signal and then input to the computer 18 where processing for optical analysis is performed in a manner described later.
- the pinhole 13 is arranged at a position conjugate with the focal position of the objective lens 8. Thereby, only the light emitted from the focal region of the laser light schematically shown in FIG. 1B, that is, the excitation region, passes through the pinhole 13, and the light from other than the excitation region is blocked.
- the focal region of the laser light illustrated in FIG. 1B is a light detection region in the present optical analyzer having an effective volume of about 1 to 10 fL, and is referred to as a confocal volume.
- the focal region of the laser light typically has a Gaussian distribution or a Lorentzian distribution in which the light intensity has a vertex at the center of the region.
- the effective volume of the focal region of the laser beam is a volume of a substantially elliptical sphere having a boundary where the light intensity is 1 / e 2 as a boundary.
- the scanning molecule counting method light from a conjugate of a particle and a luminescent probe or a luminescent probe, for example, weak light from one or several fluorescent dye molecules is detected.
- a stage position changing device 17a for moving the horizontal position of the microplate 9 may be provided on the stage (not shown) of the microscope.
- the stage position changing device 17a is used to change the well 10 for observing particles and the like.
- the operation of the stage position changing device 17a may be controlled by the computer 18.
- the optical system of the above-described optical analyzer is provided with a mechanism for changing the optical path of the optical system and scanning the sample solution with the light detection region. That is, a mechanism for moving the position of the focal region (ie, the light detection region) in the sample solution is provided.
- a mechanism for moving the position of the light detection region for example, a mirror deflector 17 that changes the direction of the reflection mirror 7 may be employed as schematically illustrated in FIG. 1C.
- the mirror deflector 17 may be the same as a galvanometer mirror device equipped in a normal laser scanning microscope. In order to achieve a desired movement pattern of the position of the light detection region, the mirror deflector 17 is driven in cooperation with light detection by the light detector 16 under the control of the computer 18.
- the movement locus of the position of the light detection region may be arbitrarily selected from a circle, an ellipse, a rectangle, a straight line, a curve, or a combination thereof.
- the program in the computer 18 may be configured so that various movement patterns can be selected.
- the position of the light detection region may be moved in the vertical direction by moving the objective lens 8 up and down.
- mechanical vibrations and hydrodynamic actions are generated in the sample solution. No substantial occurrence. Therefore, it is possible to eliminate the influence of the dynamic action on the observation object, and stable measurement is achieved.
- the above optical system is used as a multiphoton microscope. In that case, since there is light emission only in the focal region (light detection region) of the excitation light, the pinhole 13 may be removed.
- the optical systems 2 to 5 for generating the excitation light may be omitted.
- the optical system of the confocal microscope is used as it is.
- a plurality of excitation light sources 2 may be provided as illustrated. Further, the optical analyzer 1 may be configured such that the wavelength of the excitation light can be appropriately selected according to the wavelength of the light that excites the conjugate of the particle and the luminescent probe or the luminescent probe. Similarly, a plurality of photodetectors 16 may be provided. In addition, when the sample includes a combination of a plurality of types of particles having different wavelengths and a combination of luminescent probes or a luminescent probe, the light detector 16 can be configured to separately detect the light depending on the wavelength. May be.
- a spectroscopic analysis technique such as FIDA is superior to a conventional biochemical analysis technique in that it requires an extremely small amount of sample and can perform inspection quickly.
- the concentration and characteristics of the observation target particles are calculated based on fluctuations in fluorescence intensity. Therefore, in order to obtain an accurate measurement result, the concentration or number density of the observation target particles in the sample solution is a level at which about one observation target particle is always present in the light detection region CV during the measurement of the fluorescence intensity. It is required that a significant light intensity (photon count) is always detected during the measurement time.
- the concentration or number density of the observation target particles is lower than that (for example, when the observation target particles are at a level that only occasionally enters the light detection region CV), a significant light intensity (photon count) is obtained. It appears only in a part of the measurement time, and it is difficult to accurately calculate the fluctuation of the light intensity. Also, if the concentration of the observation target particle is much lower than the level at which one observation target particle is always present in the light detection region during measurement, the light intensity fluctuation calculation is affected by the background. The measurement time is long in order to easily obtain significant light intensity data sufficient for calculation. On the other hand, in the scanning molecule counting method, characteristics such as the number density or concentration of the observation target particles can be detected even when the concentration of the observation target particles is lower than a level required by a spectroscopic analysis technique such as FIDA.
- the process executed is, in short, changing the optical path by driving a mechanism (mirror deflector 17) for moving the position of the photodetection region.
- a mechanism mirror deflector 17
- FIG. 2 light detection is performed while moving the position of the light detection region CV in the sample solution, that is, while scanning the sample solution by the light detection region CV.
- one particle a fluorescent dye is bound as a luminescent probe in the figure
- the light detection region CV moves (time t0 to t2 in the figure).
- a significant light intensity (Em) as depicted in FIG. 2B is detected.
- the position of the light detection region CV is moved and the light detection is performed, and the significant light intensity as illustrated in FIG. Particles are detected individually.
- the number of individually detected particles By counting the number of individually detected particles, the number of particles existing in the measured region, or information on the concentration or number density can be acquired.
- statistical calculation processing is not performed as in the calculation of fluctuations in fluorescence intensity, and particles are detected one by one.
- information on the concentration or number density of particles can be obtained even in a sample solution having a concentration of particles to be observed that is so low that it cannot be analyzed.
- the concentration of the fluorescently labeled particles is measured from the fluorescence intensity measured by a fluorescence spectrophotometer or a plate reader. It is possible to measure to a lower concentration than when doing so.
- concentration of a fluorescently labeled particle by a fluorescence spectrophotometer or a plate reader, it is usually assumed that the fluorescence intensity is proportional to the concentration of the fluorescently labeled particle.
- the scanning molecule counting method is a step of detecting a signal corresponding to each particle from the detected optical signal, and a noise signal is excluded from the detection result, and only the signal corresponding to each particle is counted to obtain the concentration. calculate. Therefore, the scanning molecule counting method can detect a concentration lower than that when detecting the concentration on the assumption that the fluorescence intensity is proportional to the concentration of the fluorescently labeled particles.
- the fluorescence intensity is fluorescently labeled according to the method of individually detecting and counting the particles in the sample solution as in the scanning molecule counting method. Therefore, the measurement accuracy of the particle concentration on the higher particle concentration side is improved as compared with the conventional method of determining the concentration under the assumption that the particle concentration is proportional to the particle concentration.
- the scanning molecule counting method is a step of detecting signals corresponding to individual particles from the detected optical signal, and is less affected by the reduction in fluorescence intensity per particle, and calculates the concentration from the number of particles. Therefore, the scanning molecule counting method can detect a higher concentration than when detecting the concentration on the assumption that the fluorescence intensity is proportional to the concentration of the fluorescently labeled particles.
- the measurement of the light intensity in the optical analysis of the scanning molecule counting method is that the mirror deflector 17 is driven during the measurement to move the position of the light detection region in the sample solution (scanning in the sample solution). It may be executed in the same manner as the light intensity measurement step in FCS or FIDA. In the operation process, the following procedure is typically performed. That is, the sample solution is injected into the well 10 of the microplate 9 and placed on the microscope stage. Thereafter, the user inputs an instruction to start measurement to the computer 18.
- the computer 18 to which the instruction is input starts irradiation of excitation light and measurement of light intensity in the light detection region in the sample solution according to a program stored in a storage device (not shown).
- This program includes a procedure for changing the optical path to move the position of the light detection region in the sample solution, and a procedure for detecting light from the light detection region during movement of the position of the light detection region.
- the mirror deflector 17 drives the mirror 7 (galvanomirror) and moves the position of the light detection region in the well 10 under the control of the processing operation according to the program of the computer 18. .
- the photodetector 16 converts the sequentially detected light into an electrical signal and transmits it to the computer 18.
- the computer 18 generates and stores time-series light intensity data from the transmitted optical signal in an arbitrary manner.
- the photodetector 16 is an ultrasensitive photodetector that can detect the arrival of one photon.
- the detection of light is photon counting that is performed sequentially for a predetermined unit time (BINTIME) over a predetermined time. For example, the detection of light is performed in such a manner that the number of photons arriving at the photodetector is measured every 10 ⁇ s.
- the time-series light intensity data may be time-series photon count data.
- the moving speed of the position of the light detection region during the measurement of the light intensity may be a predetermined speed that is arbitrarily set, for example, experimentally or so as to suit the purpose of analysis.
- the size or volume of the region through which the light detection region has passed is required, so that the moving distance is grasped.
- the movement of the position of the light detection region is executed in the manner. Note that it is easier to interpret the measurement result when the elapsed time during measurement and the movement distance of the position of the light detection region are in a proportional relationship. Therefore, the moving speed is basically preferably a constant speed, but is not limited to this.
- the moving speed of the position of the light detection region in order to quantitatively and accurately perform individual detection of the observation target particles from the measured time-series light intensity data or counting of the number of observation target particles.
- the moving speed is preferably set to a value faster than the random movement of the observation target particle, that is, the moving speed due to the Brownian movement.
- the observation target particle is a conjugate of the particle and the luminescent probe or a luminescent probe that has been decomposed and released after binding to the particle. Since the observation target particle of the photoanalysis technique of the scanning molecule counting method is a particle that is dispersed or dissolved in the solution and moves freely at random, the position of the observation target particle moves with time by Brownian motion.
- the particle randomly moves in the region as schematically illustrated in FIG. 3A.
- the light intensity changes randomly as shown in FIG. 3B, and it becomes difficult to specify a significant change in light intensity corresponding to each observation target particle.
- the excitation light intensity in the light detection region decreases outward with the center of the region as the apex. Therefore, preferably, as shown in FIG. 4A, the particles may be set so as to cross the light detection region in a substantially straight line. As a result, in the time-series light intensity data, as illustrated in FIG.
- the profile of the change in light intensity corresponding to each particle becomes substantially uniform, and the correspondence between each observation target particle and the light intensity is easy.
- the moving speed of the position of the light detection region is set faster than the average moving speed (diffusion moving speed) due to the Brownian motion of the particles.
- the profile of the change in light intensity is substantially the same as the excitation light intensity distribution.
- an observation target particle having a diffusion coefficient D (more precisely, a conjugate of a particle and a luminescent probe, or a luminescent probe that is decomposed and released after binding to the particle) has a photodetection region having a radius Wo due to Brownian motion.
- the moving speed of the position of the light detection region may be set to a value sufficiently faster than that with reference to the Vdif.
- Wo is about 0.62 ⁇ m
- Vdif is 1.0 ⁇ Since it is 10 ⁇ 3 m / s
- the moving speed of the position of the light detection region may be set to 15 mm / s, which is approximately 10 times that.
- the profile of the change in the light intensity by setting the moving speed of the position of the light detection region in various ways is expected (typically, the excitation light intensity distribution).
- a preliminary experiment for finding a condition that is substantially the same as that described above may be repeatedly performed to determine a suitable moving speed of the position of the light detection region.
- the computer 18 may execute the following light intensity analysis by the processing according to the program stored in the storage device.
- grain may be detected when time width (DELTA) (tau) in which the light intensity exceeding the said threshold value exists in a predetermined range.
- DELTA time width
- the predetermined range for the threshold value Io and the time width ⁇ for the light intensity is a combination of the observation target particle and the luminescent probe that moves relative to the light detection region at a predetermined speed (or is decomposed after the combination with the particle). It is determined based on the profile assumed as the intensity of light emitted from a free luminescent probe. The specific value of the profile may be arbitrarily set experimentally.
- the specific value of a profile may be selectively determined by the characteristic of the conjugate
- the intensity A and the width a calculated by fitting Equation (4) to a significant light intensity profile are within a predetermined range
- the light intensity profile May correspond to the fact that one observation target particle has passed through the light detection region, and one observation target particle may be detected.
- the intensity A and the width a are outside the predetermined range, the light intensity profile may be ignored in the analysis as noise or foreign matter.
- Counting of observation target particles may be performed by counting the number of particles detected by the above-described detection target particle detection method using an arbitrary method. However, when the number of particles is large, the observation target particles may be counted by, for example, the processing illustrated in FIGS. 5 and 6B.
- time-series optical signal data photon count data
- the time-series optical signal data (FIG. 6B, uppermost stage “detection result (unprocessed) ”) Is subjected to a smoothing process (step 110,“ smoothing ”in the upper part of FIG. 6B).
- the smoothing process may be performed by a moving average method, for example.
- the parameter for executing the smoothing process may be set as appropriate according to the moving speed (scanning speed) of the position of the light detection region at the time of optical signal data acquisition and BIN TIME.
- the parameters described above are, for example, the number of data points averaged at a time in the moving average method, the number of moving averages, and the like.
- a first-order differential value for the time of the time-series optical signal data after the smoothing process is calculated.
- the time differential value of the time-series optical signal data has a large change in value at the time of change of the signal value, as illustrated in the lower “time differentiation” in FIG. 6B.
- the start and end points of a significant signal (peak signal) can be advantageously determined.
- a significant signal is sequentially detected on the time-series optical signal data, and it is determined whether or not the detected peak signal is a signal corresponding to the observation target particle.
- time differential values are sequentially referred to on time-series time differential value data of time-series optical signal data.
- a start point and an end point of one peak signal are searched and determined, and a peak existence region is specified (step 130).
- the bell-shaped function fitting is performed on the smoothed time-series optical signal data in the peak existence area (“bell-shaped function fitting” in the lower part of FIG. 6B).
- Parameters such as the peak intensity Imax of the function, the peak width (full width at half maximum) w, and the correlation coefficient in fitting (correlation coefficient of the least squares method) are calculated (step 140).
- the bell-shaped function to be fitted is typically a Gaussian function.
- the bell-shaped function to be fitted may be a Lorentz-type function.
- the calculated bell-shaped function parameter is assumed as a bell-shaped profile parameter drawn by an optical signal detected when a combination of one particle and the light-emitting probe or the light-emitting probe passes through the light detection region. It is determined whether it is within the range (step 150). That is, in this determination, it is determined whether or not the peak intensity, the peak width, and the correlation coefficient are within a predetermined range.
- the calculated bell-shaped function parameter is within the range assumed in the optical signal corresponding to the combination of one particle and the luminescent probe or the luminescent probe.
- the signal determined to be present is determined to be a signal corresponding to one observation target particle. Thereby, one observation target particle is detected, and one particle is counted (the number of particles is counted up, step 160).
- a peak signal whose calculated bell-shaped function parameter is not within the assumed range is ignored as noise.
- the search and determination of the peak signal in the processing of the above steps 130 to 160 is repeatedly performed over the entire time-series optical signal data, and is counted as a particle every time one observation target particle is detected.
- the particle count value obtained so far is set as the number of observation target particles detected in the time series optical signal data.
- (Iii) Determination of the number density or concentration of the observation target particles
- the total volume of the region through which the light detection region passes during acquisition of time-series optical signal data is used.
- the number density or concentration of the particles is determined.
- the effective volume of the light detection region varies depending on the wavelength of the excitation light or detection light, the numerical aperture of the lens, and the adjustment state of the optical system, it is generally difficult to calculate from the design value. Accordingly, it is not easy to calculate the total volume of the region through which the light detection region passes. Therefore, typically, for a solution (reference solution) with a known particle concentration, the light intensity measurement, particle detection, and counting described above are performed under the same conditions as the measurement of the sample solution to be examined.
- the total volume of the region through which the light detection region has passed is determined from the number of detected particles and the concentration of the reference solution particles. May be.
- information on the relationship between the concentration C of various standard particles and the number N of particles is assumed for the assumed movement pattern of the light detection region.
- the information may be configured to be stored in advance in a storage device of the computer 18 so that the user of the device can use the information of the relationship appropriately stored when performing optical analysis.
- the method for detecting a nucleic acid molecule of the present embodiment uses a nucleic acid probe that specifically binds to the nucleic acid molecule as a target of analysis for the nucleic acid molecule having a specific base sequence.
- the target nucleic acid molecule may be referred to as a target nucleic acid molecule), and the nucleic acid molecule to be analyzed is detected based on the amount of the formed aggregate. Further, in the present embodiment, the detection of the aggregate is measured by the scanning molecule counting method described above.
- the scanning molecule counting method is a measurement method capable of measuring particles having fluorescence for each particle in a state where the molecules are discrete, and therefore, even for a nucleic acid molecule having a relatively low concentration of pM order or less. It can be measured. For this reason, the formed aggregates can be counted with high sensitivity even when the concentration of the target nucleic acid molecule in the sample solution is very low by the nucleic acid molecule detection method of the present embodiment.
- the nucleic acid probe specifically binds to the target nucleic acid molecule means that the nucleic acid probe preferentially hybridizes with the target nucleic acid molecule over other single-stranded nucleic acid molecules.
- the target nucleic acid molecule is a single-stranded nucleic acid molecule, it means preferentially hybridizing with the single-stranded nucleic acid molecule over other single-stranded nucleic acid molecules.
- the target nucleic acid molecule when the target nucleic acid molecule is a double-stranded nucleic acid molecule, it means that the target nucleic acid molecule preferentially hybridizes with one of the two single-stranded nucleic acid molecules constituting the target nucleic acid molecule. Therefore, the nucleic acid probe may have a base sequence that is completely complementary to the base sequence of the target nucleic acid molecule, or may have a base sequence having a mismatch.
- This embodiment uses a nucleic acid probe that specifically hybridizes with a target nucleic acid molecule.
- the target nucleic acid molecule can be detected separately from other nucleic acid molecules contained in the biological sample.
- an aggregate containing the nucleic acid probe is detected from the sample solution in which the biological sample and the nucleic acid probe are mixed.
- the target nucleic acid molecule is not present in the biological sample, the aggregate containing the nucleic acid probe is not detected from the sample solution.
- the nucleic acid probe used in this embodiment may be an oligonucleotide made of DNA.
- the nucleic acid probe may be an oligonucleotide made of RNA.
- the nucleic acid probe may be a chimeric oligonucleotide composed of DNA and RNA.
- the nucleic acid probe may be a substance that partially or entirely contains a nucleic acid-like substance capable of forming a nucleotide chain or base pair in the same manner as a natural nucleobase.
- Nucleic acid-like substances are labeled with a substance in which the side chain of a natural nucleotide (naturally occurring nucleotide) such as DNA or RNA is modified with a functional group such as an amino group, or a protein or a low molecular weight compound. Substances and the like.
- BNA Bridged Nucleic Acid
- HNA Hexitol Nucleic Acid
- PNA peptide nucleic acid
- the nucleic acid to be analyzed may be DNA.
- the nucleic acid to be analyzed may be RNA.
- the nucleic acid to be analyzed may be artificially amplified DNA such as cDNA.
- the nucleic acid probe in the scanning molecule counting method, is different from the state in which the nucleic acid probe is present alone and the state in which the nucleic acid probe is in association with other single-stranded nucleic acid molecules.
- An association formed from a probe and other single-stranded nucleic acid molecules can be distinguished from a nucleic acid probe that does not form an association.
- a molecular beacon probe can also be used as a nucleic acid probe.
- a molecular beacon probe is an oligonucleotide that forms an intramolecular structure in the state of a single-stranded nucleic acid molecule.
- FRET a fluorescent substance that serves as an energy donor and a substance that serves as an energy acceptor (fluorescent substance or quenching substance) are combined such that FRET occurs in the state of a single-stranded nucleic acid molecule and does not occur in the state of an aggregate formed by hybridizing with other single-stranded nucleic acid molecules.
- the fluorescence emitted from the fluorescent substance serving as an energy donor is detected from the nucleic acid probe forming the aggregate.
- the fluorescence emitted from the fluorescent substance serving as an energy donor is not detected or attenuated from the nucleic acid probe present alone. Therefore, by detecting the fluorescence emitted from the fluorescent substance serving as an energy donor, the aggregate including the nucleic acid probe can be detected separately from the nucleic acid probe present alone.
- the molecular beacon probe used as a nucleic acid probe in this embodiment has a base sequence capable of hybridizing with a target nucleic acid molecule, and is complementary to the 3 ′ end region and the 5 ′ end region.
- Examples include oligonucleotides having a base sequence.
- a fluorescent substance serving as an energy donor or a substance serving as an energy acceptor is bound to the 3 ′ end side, and the remaining one is bound to the 5 ′ end side,
- the 3 'end region and the 5' end side have complementary base sequences, and base pairs are formed in these base sequences to form an intramolecular structure (so-called stem-loop structure). To do.
- region which forms the intramolecular base pair of a molecular beacon probe should just exist so that the area
- the region on the 3'-end side and the region on the 5'-end side may include a 3'-end or a 5'-end, respectively.
- the region on the 3 ′ end side and the region on the 5 ′ end side may not include the 3 ′ end or the 5 ′ end, respectively.
- the number of bases and the base sequence of the region forming the base pair are lower in stability of the formed base pair than the stability of the aggregate with the target nucleic acid molecule, and can form a base pair under measurement conditions. Any degree is acceptable.
- the fluorescent substance is not particularly limited as long as it emits light by emitting light of a specific wavelength, and may be appropriately selected from fluorescent dyes used in FCS, FIDA, and the like. it can.
- the nucleic acid probe can be labeled with a fluorescent substance by a conventional method.
- the aggregate containing the nucleic acid probe can be distinguished from the nucleic acid probe present alone. Can be detected. That is, one of the fluorescent double-stranded nucleic acid binding substance and the fluorescent substance that labels the nucleic acid probe serves as an FRET energy donor, and the other serves as the FRET energy acceptor. Fluorescence emitted from a fluorescent substance that labels the nucleic acid probe is detected from a nucleic acid probe such as the first nucleic acid probe that exists alone.
- Examples of the fluorescent double-stranded nucleic acid binding substance that specifically binds to the double-stranded structure include a fluorescent intercalator, a groove binder to which a fluorescent substance is bound, and the like. If the amount of fluorescent intercalator entering between the base pairs of the aggregate is too large, the background when detecting the fluorescence emitted by FRET becomes too high, which may affect the detection accuracy. There is. For this reason, it is preferable to design the nucleic acid probe so that the region forming the double strand in the aggregate is 400 bp or less.
- the target nucleic acid molecule can also be detected using two or more nucleic acid probes.
- two nucleic acid probes are designed to specifically hybridize in a state adjacent to each other with respect to the target nucleic acid molecule.
- two nucleic acid probes that hybridize are labeled with a fluorescent substance in which one nucleic acid probe is labeled with a fluorescent substance and the other nucleic acid probe is FRET between the fluorescent substance labeled with one of the nucleic acid probes. Label with quencher.
- the method for detecting a nucleic acid molecule of the present embodiment includes the following steps (a) to (c), and the step of removing proteins from the following sample solution before the following step (c), or Before the following step (a), there is a step of removing proteins from the following biological sample:
- B A step of associating the nucleic acid molecule in the sample solution prepared in the step (a) with the nucleic acid probe.
- C A step of calculating the number of molecules of the aggregate containing the nucleic acid probe in the sample solution prepared in the step (a) after the step (b).
- a sample solution containing a nucleic acid probe and a biological sample is prepared.
- a sample solution is prepared by adding a nucleic acid probe and a biological sample to an appropriate solvent.
- the solvent is not particularly limited as long as it is the following solvent, and can be appropriately selected from buffers generally used in the technical field. That is, the solvent may not inhibit the formation of the aggregate by the nucleic acid probe and the detection of the aggregate by the scanning molecule counting method.
- the buffer include a phosphate buffer such as PBS (phosphate buffered saline, pH 7.4), a Tris buffer, and the like.
- the fluorescent double-stranded nucleic acid binding substance is similar to a nucleic acid probe or the like. Added to the sample solution.
- the biological sample provided in the present embodiment includes a tissue piece collected from a living body. Specifically, blood, lymph fluid, bone marrow fluid, ascites, exudate, amniotic fluid, sputum, saliva, semen, bile, pancreatic fluid, urine and other body fluids, tissue fragments collected from living bodies, feces, intestinal lavage fluid, lung lavage fluid , Bronchial lavage fluid, or bladder lavage fluid.
- the biological sample may be a cell component obtained by separating and collecting cells.
- the cell components separated and collected by centrifugation, chromatography, etc. the solution of disaggregating the connective tissue of the tissue pieces and disaggregating the cells, disaggregating the tissue pieces
- the cell component include plasma and serum separated and collected from blood.
- the biological sample may be a sample obtained by deparaffinizing a prepared paraffin block or a section thereof after embedding a tissue piece collected from the living body with paraffin. The collection from a living body, centrifugation, chromatography, paraffin embedding, and deparaffinization can be performed by conventional methods.
- the biological sample may be subjected to proteolytic enzyme treatment in advance.
- the proteolytic enzyme include proteinase K.
- the enzyme is inactivated after the enzyme reaction.
- proteinase K is generally subjected to an inactivation treatment at 70 ° C. for 5 to 15 minutes after an enzyme reaction at 50 to 60 ° C. for 30 minutes to several hours.
- the inactivation process can be omitted.
- step (b) the nucleic acid molecules in the sample solution prepared in step (a) are associated.
- the nucleic acid molecule in the sample solution is a double-stranded nucleic acid molecule, it is preferably denatured before associating.
- “denaturing a nucleic acid molecule” means dissociating base pairs.
- a base pair formed by mutually complementary base sequences in a single-stranded nucleic acid molecule is dissociated to release the intramolecular structure into a single-stranded structure, or a double-stranded nucleic acid molecule is converted into a single-stranded nucleic acid.
- the nucleic acid probe is an oligonucleotide containing a nucleic acid-like substance such as PNA, even if the nucleic acid molecule is a double-stranded nucleic acid molecule, the aggregate containing the nucleic acid probe is not subjected to any special denaturation treatment. It may be possible to form.
- heat denaturation can denature nucleic acid molecules in the sample solution by subjecting the sample solution to high temperature treatment.
- DNA can be denatured by incubating at 90 ° C. for several seconds to about 2 minutes.
- RNA can be denatured by incubating at 70 ° C. for several seconds to 2 minutes.
- the temperature at which the nucleic acid molecule is denatured varies widely depending on the length of the base of the target nucleic acid molecule and the like, and is not limited to the above temperature as long as it can be denatured.
- denaturation by low salt concentration treatment can be performed by adjusting the sample solution to have a sufficiently low salt concentration by, for example, dilution with purified water or the like.
- the nucleic acid molecules in the sample solution are associated after being denatured as necessary.
- heat denaturation after the high temperature treatment, the temperature of the sample solution is lowered to a temperature at which the nucleic acid probe and the target nucleic acid molecule can specifically hybridize, thereby reducing the nucleic acid molecule in the sample solution.
- Meetings can be made as appropriate.
- the salt concentration of the sample solution is increased to a concentration at which the nucleic acid probe and the target nucleic acid molecule can specifically hybridize by adding a salt solution or the like.
- the nucleic acid molecules in the sample solution can be appropriately associated.
- the temperature at which the nucleic acid probe and the target nucleic acid molecule can specifically hybridize can be determined from the melting curve of the aggregate consisting of the target nucleic acid molecule and the nucleic acid probe.
- the melting curve can be obtained, for example, by changing the temperature of a solution containing only the nucleic acid probe and the target nucleic acid molecule from a high temperature to a low temperature and measuring the absorbance and fluorescence intensity of the solution. From the obtained melting curve, the temperature between the temperature at which the denatured nucleic acid probe and the target nucleic acid molecule started to form an aggregate to the temperature at which almost all became an aggregate is determined between the nucleic acid probe and the target nucleic acid molecule. It can be set as the temperature which can hybridize specifically.
- the melting curve is determined in the same manner, and the concentration at which the nucleic acid probe and the target nucleic acid molecule can specifically hybridize is obtained. be able to.
- the Tm value (melting temperature) can be substituted for the temperature at which the nucleic acid probe and the target nucleic acid molecule can specifically hybridize.
- the Tm value (50% of the double-stranded DNA is converted into single-stranded DNA) from the nucleotide sequence information of the nucleic acid probe.
- Dissociation temperature can be calculated.
- the temperature of the sample solution is lowered to a temperature of about Tm ⁇ 3 ° C. of a region having a base sequence complementary to the target nucleic acid molecule in the nucleic acid probe.
- the temperature of the sample solution in order to suppress non-specific hybridization, it is preferable to lower the temperature of the sample solution relatively slowly when forming an aggregate. For example, after denaturing nucleic acid molecules by setting the temperature of the sample solution to 70 ° C. or higher, the liquid temperature of the sample solution can be lowered at a temperature decrease rate of 0.05 ° C./second or higher.
- a surfactant in order to suppress non-specific hybridization, it is preferable to add a surfactant, formamide, dimethyl sulfoxide, urea or the like to the sample solution in advance before the step (c).
- These compounds may be added alone or in combination of two or more. By adding these compounds, nonspecific hybridization can be made difficult to occur in a relatively low temperature environment.
- These compounds may be included in the sample solution when preparing the sample solution in step (a). These compounds may be added to the sample solution after step (b) and before step (c).
- Removal of the protein derived from the biological sample may be performed before the measurement by the scanning molecule counting method in the step (c).
- a biological sample that has been subjected to protein removal processing after being collected from the living body may be mixed with a nucleic acid probe to prepare a sample solution.
- this embodiment can reduce the labor and time for sample preparation, it is preferable to perform a protein removal treatment on the sample solution in the following cases, and in the subsequent step (b) of step (a) More preferably, the previous sample solution is subjected to protein removal treatment: -Before the post-process (b) of a process (a). -Before the post-process (c) of a process (b).
- the protein removal treatment can be appropriately selected from methods known in the art. For example, by bringing a biological sample before mixing with a nucleic acid probe, a sample solution prepared in step (a), or a sample solution after step (b) (hereinafter referred to as a biological sample) into contact with an inorganic support. Then, after the nucleic acid molecules contained in the biological sample or the like are adsorbed on the inorganic support, the adsorbed nucleic acid molecules are eluted from the inorganic support to obtain a biological sample or the like from which the protein has been removed.
- the inorganic support a known inorganic support capable of adsorbing nucleic acid molecules can be used. Moreover, the shape of the said inorganic support body is not specifically limited, A particle form may be sufficient and a film
- the inorganic support include silica-containing particles (beads) such as silica gel, siliceous oxide, glass, and diatomaceous earth, and porous membranes such as nylon, polycarbonate, polyacrylate, and nitrocellulose.
- a solvent usually used for eluting nucleic acid molecules from these known inorganic supports can be appropriately used.
- the elution solvent is particularly preferably purified water.
- cleaning buffer it is preferable to elute a nucleic acid molecule from the said inorganic support body.
- the protein contained in the biological sample or the like may be denatured before the protein removal treatment.
- Protein denaturation can be performed by known methods.
- a protein in a biological sample or the like can be denatured by adding a compound usually used as a protein denaturant such as a chaotropic salt, an organic solvent, or a surfactant to the biological sample or the like.
- a compound usually used as a protein denaturant such as a chaotropic salt, an organic solvent, or a surfactant to the biological sample or the like.
- a chaotropic salt, an organic solvent, a surfactant, or the like one type of compound may be added, or two or more types of compounds may be added.
- chaotropic salts examples include guanidine hydrochloride, guanidine isothiocyanate, sodium iodide, sodium perchlorate, and sodium trichloroacetate.
- the surfactant that can be contained in a biological sample or the like is preferably a nonionic surfactant.
- the nonionic surfactant include Tween 80, CHAPS (3- [3-Colamidopropyldimethylammonio] -1-propanesulfonate), Triton X-100, Tween 20, and the like.
- the organic solvent that can be contained in a biological sample or the like is preferably phenol. Phenol may be neutral or acidic. When acidic phenol is used, RNA can be selectively extracted into the aqueous layer rather than DNA.
- the denatured protein can be removed by, for example, centrifuging to precipitate the denatured protein and recovering only the supernatant. In addition, after adding chloroform and thoroughly stirring and mixing by vortexing, etc., centrifugation is performed, and the denatured protein is precipitated and only the supernatant is recovered. Protein can be removed. The obtained supernatant may be further brought into contact with the inorganic support, and further protein removal treatment may be performed.
- the protein when the biological sample is a biological sample with relatively low protein content, such as plasma and serum, the protein is aggregated using a protein remover and then the liquid component is recovered by solid-liquid separation processing. By doing so, the protein can be removed. Specifically, after adding a protein removing agent to a biological sample, the protein is aggregated by stirring or standing, and then a centrifugation treatment is performed, and the supernatant is collected.
- a protein removing agent for example, a substance having high affinity for proteins such as an ion exchange resin can be used.
- the number of molecules of the aggregate including the nucleic acid probe in the sample solution is calculated by a scanning molecule counting method.
- the sample solution after forming the aggregate is placed in an optical analyzer for the scanning molecule counting method, and the fluorescence emitted from the aggregate is detected and analyzed by the above method.
- the number of molecules in the aggregate is calculated.
- the calculated number of molecules of the aggregate is the number of target nucleic acid molecules contained in the measurement sample. That is, the target nucleic acid molecule can be detected by detecting the aggregate.
- Test Example 1 uses artificially synthesized oligonucleotides as single-stranded target nucleic acid molecules and nucleic acid probes, and samples obtained by adding these to horse whole blood or horse plasma are simulated samples of biological samples. ⁇ Target nucleic acid molecules in pseudo biological samples were detected by scanning molecule counting method. Table 1 shows the base sequences of the target nucleic acid molecule A and nucleic acid probe A used for the measurement.
- the nucleic acid probe A is a molecular beacon probe. Underlined bases are regions that hybridize to each other when forming intramolecular structures.
- a target nucleic acid molecule A and a nucleic acid probe A were mixed in Tris buffer (10 mM Tris-HCl, 1 mM EDTA, 100 mM NaCl, pH 8.0) so as to be 50 pM, respectively.
- Tris buffer 10 mM Tris-HCl, 1 mM EDTA, 100 mM NaCl, pH 8.0
- a 5 pM nucleic acid probe solution was prepared by mixing the target nucleic acid molecule A and the nucleic acid probe A in the Tris buffer so that each would be 5 pM.
- the obtained nucleic acid probe solution was annealed at 95 ° C. for 10 minutes, 70 ° C. for 10 minutes, 60 ° C. for 10 minutes, 50 ° C. for 10 minutes, and 20 ° C.
- nucleic acid extract was prepared from 50 ⁇ l of whole horse blood or 50 ⁇ l of horse plasma using a nucleic acid extraction kit (product name: QIAamp DNA Micro kit, manufactured by QIAGEN).
- the nucleic acid extract corresponds to the biological sample after the protein removal treatment in the embodiment of the present invention.
- the whole horse blood or horse plasma before the treatment with the nucleic acid extraction kit corresponds to a biological sample before the protein removal treatment.
- sample preparation (+) 50 ⁇ l each of the annealed 50 pM nucleic acid probe solution or 5 pM nucleic acid probe solution was added to prepare a sample solution (sample preparation (+)).
- Test Example 1 the number of molecules of the aggregate composed of the target nucleic acid molecule A and the nucleic acid probe A in each sample solution was counted by a scanning molecule counting method. Specifically, in the measurement, a single-molecule fluorescence measuring device MF20 (Olympus Corporation) equipped with an optical system of a confocal fluorescence microscope and a photon counting system is used as an optical analysis device. Series photon count data was obtained. At that time, excitation light is irradiated at a rotational speed of 6,000 rpm and 300 ⁇ W using a laser beam of 543 nm. The detection light wavelength was 560 to 620 nm using a band pass filter.
- a single-molecule fluorescence measuring device MF20 (Olympus Corporation) equipped with an optical system of a confocal fluorescence microscope and a photon counting system is used as an optical analysis device. Series photon count data was obtained. At that time, excitation light is irradiated at a rotational speed
- BINTIME was set to 10 ⁇ s, and the measurement time was set to 2 seconds.
- the time series data obtained by the measurement was smoothed by the Savinzky-Golay algorithm, and then a peak was detected by differentiation. Of the regions regarded as peaks, a region that can be approximated to a Gaussian function is extracted as a signal.
- each concentration indicates the concentration of the target nucleic acid molecule A in each sample solution.
- the number of peaks counted in the sample solution (Control) to which the biological sample is not added is a highly reliable counting result that is not affected by contaminants derived from the biological sample.
- sample preparation ( ⁇ ) sample preparation
- the sample solution both in the blood and plasma, regardless of the number of target nucleic acid molecules in the sample solution
- the number of peaks was significantly higher than that of Control). This is presumably because non-specific signals were generated in the measurement by the scanning molecule counting method due to contaminants in the biological sample, and the peak increased.
- sample preparation (+) the number of peaks is the same as that of the sample solution to which no biological sample is added (Control). It was done. From these results, contaminants derived from biological samples that may cause non-specific signal generation in the measurement by the scanning molecule counting method can be removed by performing protein removal treatment in advance, and more accurate It is suggested that measurement is possible.
- Example 1 In Example 1, out of PCR products obtained by PCR using a fluorescently labeled primer and an unlabeled primer, a single-stranded nucleic acid molecule extended from the unlabeled primer was used as the target nucleic acid. A single-stranded nucleic acid molecule extended from a fluorescently labeled primer was used as a nucleic acid probe. These were added to a biological sample obtained by deparaffinization from a paraffin-embedded tissue section as a pseudo biological sample, and target nucleic acid molecules in the pseudo biological sample were detected by a scanning molecule counting method.
- Example 1 ⁇ Preparation of target nucleic acid molecule B and nucleic acid probe B>
- plasmid pUC19 manufactured by Takara Bio Inc.
- TAMRA-labeled oligonucleotide primer, oligonucleotide primer not labeled with a fluorescent substance, and PCR kit (product name: AmpliTaq Gold, Applied Biosystems) ) was used to prepare a PCR product having a chain length of 800 bp.
- PCR was performed by electrophoresis using an electrophoresis apparatus Bioanalyzer (Agilent). The presence and concentration of the product was measured. PCR product solutions were prepared using Tris buffer (10 mM Tris-HCl, 1 mM EDTA, 100 mM NaCl, pH 8.0) so that the concentration of the PCR product was 2 pM, 20 pM, or 200 pM. Of the two single-stranded nucleic acid molecules constituting the PCR product, the fluorescently labeled nucleic acid molecule was designated as nucleic acid probe B. A nucleic acid molecule that was not fluorescently labeled was designated as target nucleic acid molecule B.
- Example 1 4% formalin-fixed paraffin-embedded tissue sections of rat liver and kidney were deparaffinized with xylene, proteinase K was added, and enzyme reaction treatment was performed at 56 ° C. for 10 minutes.
- the solution after the enzyme reaction treatment was a proteinase K-treated biological sample solution.
- a proteinase K-treated biological sample solution and an equal amount of each PCR product solution or Tris buffer were added to prepare sample solutions having PCR product concentrations of 0, 1, 10, and 100 pM (protein removal treatment). None).
- Each sample solution was further annealed by maintaining at 95 ° C. for 10 minutes, 55 ° C. for 10 minutes and then at room temperature.
- the proteinase K-treated biological sample solution was further treated at 70 ° C. for 10 minutes, an equal amount of the PCR product solution or the Tris buffer was added, respectively, and the PCR product concentrations were 0, 1, 10, and 100 pM.
- Each solution was prepared.
- Each sample solution was further subjected to an annealing treatment in the same manner as the sample solution (without protein removal treatment). Thereafter, the sample solution subjected to the annealing treatment was purified using a nucleic acid purification kit (product name: MinElute PCR purification kit, manufactured by QIAGEN), and the obtained nucleic acid extract was used as a measurement sample (with protein removal treatment 1). . Further, without performing the treatment at 70 ° C.
- the proteinase K-treated biological sample solution and the PCR product solution of each concentration or the Tris buffer are added in equal amounts, and the PCR product concentration is 0, 1, 10 , And 100 pM sample solutions were prepared, respectively.
- Each sample solution is further annealed in the same manner as the sample solution (with protein removal treatment 1), and then purified using a nucleic acid purification kit, and the resulting nucleic acid extract is used as a measurement sample.
- With protein removal treatment 2 As a control, equal amounts of the PCR product solution at each concentration and the Tris buffer were added to prepare sample solutions having PCR product concentrations of 0, 1, 10, and 100 pM, respectively (Control).
- Each sample solution was further subjected to an annealing treatment in the same manner as the sample solution (without protein removal treatment).
- Example 1 In Example 1, in the same manner as in Test Example 1, the number of aggregates composed of the target nucleic acid molecule B and the nucleic acid probe B present in each sample solution was counted by the scanning molecule counting method. The counting results are shown in FIG. Furthermore, in FIG. 9, the approximate straight line of the relationship between the density
- the relationship between the concentration of the target nucleic acid molecule in the sample solution and the number of detected peaks was significantly lost in linearity compared to the sample solution (Control).
- the sample solution (with protein removal treatment 1) and the sample solution (with protein removal treatment 2) both have almost the same number of peaks as the sample solution (Control), and both are targets in the measurement sample. It was shown that nucleic acid molecules can be detected quantitatively with high accuracy.
- the sample solution (with protein removal treatment 2) in which the enzyme deactivation treatment after the proteinase K treatment is omitted can detect the target nucleic acid molecule with high accuracy in the same manner as the sample solution (with protein removal treatment 1). It is apparent that measurement by the scanning molecule counting method can be performed even when the enzyme deactivation treatment or the like is omitted by the nucleic acid molecule detection method of the embodiment.
- Example 2 In Example 2, out of PCR products obtained by PCR using a fluorescently labeled primer and an unlabeled primer, a single-stranded nucleic acid molecule extended from the unlabeled primer was used as the target nucleic acid. A single-stranded nucleic acid molecule extended from a fluorescently labeled primer was used as a nucleic acid probe. A sample obtained by adding these to horse plasma was used as a pseudo biological sample, and target nucleic acid molecules in the pseudo biological sample were detected by a scanning molecule counting method.
- Example 2 ⁇ Preparation of target nucleic acid molecule C and nucleic acid probe C>
- plasmid pUC19 manufactured by Takara Bio Inc.
- oligonucleotide primer labeled with ATTO647N oligonucleotide primer not labeled with a fluorescent substance
- PCR kit product name: AmpliTaq Gold, Applied Biosystems
- PCR was performed by electrophoresis using an electrophoresis apparatus Bioanalyzer (Agilent). The presence and concentration of the product was measured. PCR product solutions were prepared using Tris buffer (10 mM Tris-HCl, 1 mM EDTA, 100 mM NaCl, pH 8.0) so that the concentration of the PCR product was 2 pM, 20 pM, or 200 pM. Of the two single-stranded nucleic acid molecules constituting the PCR product, a nucleic acid molecule that was fluorescently labeled was used as a nucleic acid probe C. A nucleic acid molecule that was not fluorescently labeled was designated as target nucleic acid molecule C.
- Example 2 equine plasma and 2 pM, 20 pM, or 200 pM PCR product solution prepared in Example 1 or the Tris buffer were added in equal amounts to a 1.5 ml tube so that the PCR product concentration was 0.
- Two 100 ⁇ l sample solutions of 1, 10, and 100 pM were prepared respectively.
- 200 ⁇ l of a protein removing agent product name: BindPro (registered trademark), manufactured by Biotech Support Group
- 200 ⁇ l of PBS pH 7.2
- Example 2 a scanning molecule counting method was used in the same manner as in Test Example 1 except that 633 nm laser light was used as excitation light and the detection light wavelength was 660 to 710 nm using a bandpass filter. The number of aggregates composed of the target nucleic acid molecule C and the nucleic acid probe C present in each supernatant was counted. The counting results are shown in FIG. In FIG. 10, “no removal” indicates the result of the sample solution to which PBS was added instead of the protein removal agent (no protein removal treatment). In FIG. 10, “with removal” indicates the result of the sample solution to which the protein removing agent is added (with protein removal treatment). In FIG.
- the concentration indicates the concentration of the target nucleic acid molecule in each sample solution.
- the number of peaks was remarkably large regardless of the concentration of the target nucleic acid molecule.
- the concentration of the target nucleic acid molecule is 0 pM, and the number of peaks depending on the concentration of the target nucleic acid molecule is 1 to 100 pM. Increase was confirmed. From these results, it is clear that a non-specific signal disappears and the target nucleic acid molecule can be detected with high accuracy by performing the removal treatment of the protein derived from the biological sample before the measurement by the scanning molecule counting method.
- a nucleic acid molecule derived from a biological sample that exists only in a very low concentration in the sample solution is specifically detected using a nucleic acid probe that specifically hybridizes to the nucleic acid molecule.
- a nucleic acid probe that specifically hybridizes to the nucleic acid molecule.
- Optical analyzer confocal microscope
- Light source 3 Single mode optical fiber
- Collimator lens 5 Dichroic mirror 6, 7, 11 Reflection mirror 8
- Objective lens 9
- Microplate 10 Well (sample solution container)
- DESCRIPTION OF SYMBOLS 12
- Condenser lens 13
- Pinhole 14
- Barrier filter 15
- Multimode optical fiber 16
- Photo detector 17 Mirror deflector 17a
- Stage position change apparatus 18 Computer
Abstract
Description
本願は、2011年4月20日に日本に出願された特願2011-094293号に基づいて優先権を主張し、その内容をここに援用する。 The present invention relates to a method for detecting a nucleic acid molecule in a biological sample using an optical system capable of detecting light from a minute region in a solution, such as an optical system of a confocal microscope or a multiphoton microscope.
This application claims priority based on Japanese Patent Application No. 2011-094293 for which it applied to Japan on April 20, 2011, and uses the content here.
・ 医学・生物学の研究開発の分野でしばしば使用される希少なあるいは高価な試料についての分析を行う場合。
・ 病気の臨床診断や生理活性物質のスクリーニングなど、検体数が多い場合。
In particular, according to a method using a micro area fluorescence measurement technique using an optical system of a confocal microscope such as FCS or FIDA and a photon counting technique, the sample required for measurement has an extremely low concentration compared with the conventional method. The amount used may be about several tens of microliters at a time. In addition, according to the method described above, the measurement time is also greatly reduced (measurement of time on the order of seconds is repeated several times in one measurement). Therefore, these technologies are expected to be powerful tools that can be used for experiments or inspections at low cost or quickly compared to conventional biochemical methods, for example, in the following cases. :
・ When analyzing rare or expensive samples often used in the field of medical and biological research and development.
・ When the number of specimens is large, such as clinical diagnosis of diseases and screening of physiologically active substances.
上記走査分子計数法は、特願2010-044714において、本願出願人により提案されている新規な光分析技術である。 The novel optical analysis technique used by the detection method provided by the present invention has the following characteristics. That is, as a method for detecting a nucleic acid, there is a method for detecting a nucleic acid molecule in a biological sample by using a nucleic acid probe that specifically hybridizes with the nucleic acid molecule, based on the presence or absence of an association with the nucleic acid probe. . In this method, the detection of aggregates including nucleic acid probes is performed using a scanning molecule counting method, so that even when the concentration of nucleic acid molecules to be analyzed in a sample is very low, nucleic acid molecules can be detected with high sensitivity. Can be detected. Furthermore, the nucleic acid molecule can be detected with high accuracy by removing contaminants derived from the biological sample in advance before detecting the aggregate containing the nucleic acid probe.
The scanning molecule counting method is a novel optical analysis technique proposed by the applicant of the present application in Japanese Patent Application No. 2010-044714.
本発明の第一の態様に係る核酸分子の検出方法は、調製する工程と、会合させる工程と、算出する工程と、を有する。
前記調製する工程は、解析対象の核酸分子と特異的にハイブリダイズする核酸プローブと、生体試料とを含む試料溶液を調製する。
前記会合させる工程は、前記調製する工程において調製された試料溶液中の核酸分子と前記核酸プローブとを会合させる。
前記算出する工程は、前記会合させる工程の後、前記調製する工程において調製された試料溶液中の、前記核酸プローブを含む会合体の分子数を算出する。
さらに、本発明の第一の態様に係る核酸分子の検出方法は、光検出領域の位置を移動する工程と、蛍光を検出する工程と、会合体を個別に検出する工程と、計数する工程と除去する工程、を有する。
前記光検出領域の位置を移動する工程は、前記算出する工程における前記試料溶液内の共焦点顕微鏡又は多光子顕微鏡の光学系の光検出領域の位置を移動する。前記蛍光を検出する工程は、前記試料溶液内において前記光学系の光検出領域の位置を移動させながら、当該光検出領域中の前記会合体から放出される蛍光を検出する。
前記会合体を個別に検出する工程は、前記検出された光から、個々の会合体からの光信号を個別に検出して、会合体を個別に検出する。
前記計数する工程は、前記個別に検出された会合体の数を計数して前記光検出領域の位置の移動中に検出された前記粒子の数を計数する。
前記除去する工程は、前記算出する工程の前に、前記試料溶液からタンパク質を除去する。又は、前記除去する工程は、前記調製する工程の前に、前記生体試料からタンパク質を除去する。 本発明の第二の態様に係る核酸分子の検出方法は、前記会合させる工程の後、前記算出する工程の前に、前記試料溶液からタンパク質を除去する工程を有する。
本発明の第三の態様に係る核酸分子の検出方法は、前記試料溶液又は前記生体試料からのタンパク質の除去を、当該試料溶液又は当該生体試料中の核酸分子を、無機支持体に吸着させた後、吸着させた核酸を無機支持体から溶出させることにより行う。
本発明の第四の態様によれば、前記生体試料が、生体から採取された後、タンパク質分解酵素処理がなされる。
本発明の第五の態様によれば、前記核酸プローブが、蛍光物質により標識されている。
本発明の第六の態様によれば、前記核酸プローブが、蛍光物質により標識されている。前記調製する工程において、前記試料溶液中に、蛍光性2本鎖核酸結合物質がさらに含まれている。前記核酸プローブを標識している蛍光物質と前記蛍光性2本鎖核酸結合物質とのいずれか一方が、蛍光エネルギー移動現象におけるエネルギー・ドナーと成る蛍光物質であり、他方が前記蛍光エネルギー移動現象におけるエネルギー・アクセプターと成る物質である。前記算出する工程において、前記核酸プローブを含む会合体から放出される蛍光は、前記核酸プローブを標識している蛍光物質と前記蛍光性2本鎖核酸結合物質との間に起こった蛍光エネルギー移動現象により放出される蛍光である。
本発明の第七の態様によれば、前記核酸プローブは、単独で存在している状態では蛍光エネルギー移動が起こり、かつ他の1本鎖核酸分子と会合体を形成した状態では蛍光エネルギー移動が起こらないように、エネルギー・ドナーと成る蛍光物質とエネルギー・アクセプターと成る物質とが結合されている。当該核酸プローブを含む会合体から放出される蛍光は、前記エネルギー・ドナーと成る蛍光物質から放出される蛍光である。
本発明の第八の態様によれば、前記光検出領域の位置を移動する工程において、前記光検出領域の位置が所定の速度にて移動される。
本発明の第九の態様によれば、前記光検出領域の位置を移動する工程において、前記光検出領域の位置が、前記会合体の拡散移動速度よりも速い速度にて移動される。
本発明の第十の態様に係る核酸分子の検出方法は、前記検出された光から、個々の会合体からの光信号を個別に検出して、会合体を個別に検出する工程において、検出された時系列の光信号の形状に基づいて、1つの会合体が前記光検出領域に入ったことが検出される。 本発明の第十一の態様によれば、前記試料溶液が、界面活性剤、ホルムアミド、ジメチルスルホキシド、及び尿素からなる群より選択される1種以上を含む。
本発明の第十二の態様に係る核酸分子の検出方法は、前記会合させる工程を、前記調製する工程において調製された試料溶液の温度を70℃以上にすることにより、当該試料溶液中の核酸分子を変性させた後、当該試料溶液の液温を0.05℃/秒以上の降温速度で低下させることにより、当該試料溶液中の核酸分子を会合させる。
本発明の第十三の態様によれば、前記核酸プローブが、DNA、RNA、及び核酸類似物質からなる群より選択される2以上の分子が結合して構成されている。
In order to solve the above problems, the present invention proposes the following means.
The method for detecting a nucleic acid molecule according to the first aspect of the present invention includes a preparing step, an associating step, and a calculating step.
The preparing step prepares a sample solution including a nucleic acid probe that specifically hybridizes with a nucleic acid molecule to be analyzed and a biological sample.
In the associating step, the nucleic acid molecule in the sample solution prepared in the preparing step is associated with the nucleic acid probe.
In the calculating step, after the associating step, the number of molecules of the aggregate including the nucleic acid probe in the sample solution prepared in the preparing step is calculated.
Furthermore, the method for detecting a nucleic acid molecule according to the first aspect of the present invention includes a step of moving the position of the light detection region, a step of detecting fluorescence, a step of individually detecting aggregates, and a step of counting. Removing.
The step of moving the position of the light detection region moves the position of the light detection region of the optical system of the confocal microscope or multiphoton microscope in the sample solution in the calculating step. In the step of detecting the fluorescence, the fluorescence emitted from the aggregate in the light detection region is detected while moving the position of the light detection region of the optical system in the sample solution.
In the step of individually detecting the aggregate, the optical signals from the individual aggregates are individually detected from the detected light, and the aggregates are individually detected.
The counting step counts the number of particles detected during the movement of the position of the light detection region by counting the number of individually detected aggregates.
In the removing step, the protein is removed from the sample solution before the calculating step. Alternatively, the removing step removes the protein from the biological sample before the preparing step. The method for detecting a nucleic acid molecule according to the second aspect of the present invention includes a step of removing proteins from the sample solution after the associating step and before the calculating step.
In the method for detecting a nucleic acid molecule according to the third aspect of the present invention, the removal of the protein from the sample solution or the biological sample is performed by adsorbing the nucleic acid molecule in the sample solution or the biological sample to an inorganic support. Thereafter, the adsorbed nucleic acid is eluted from the inorganic support.
According to the fourth aspect of the present invention, the biological sample is subjected to proteolytic enzyme treatment after being collected from the living body.
According to the fifth aspect of the present invention, the nucleic acid probe is labeled with a fluorescent substance.
According to the sixth aspect of the present invention, the nucleic acid probe is labeled with a fluorescent substance. In the preparing step, the sample solution further contains a fluorescent double-stranded nucleic acid binding substance. One of the fluorescent substance labeling the nucleic acid probe and the fluorescent double-stranded nucleic acid binding substance is a fluorescent substance that serves as an energy donor in the fluorescence energy transfer phenomenon, and the other is in the fluorescence energy transfer phenomenon. It is a substance that becomes an energy acceptor. In the step of calculating, the fluorescence emitted from the aggregate containing the nucleic acid probe is a fluorescence energy transfer phenomenon that occurs between the fluorescent substance labeled with the nucleic acid probe and the fluorescent double-stranded nucleic acid binding substance. Is the fluorescence emitted by.
According to the seventh aspect of the present invention, when the nucleic acid probe is present alone, fluorescence energy transfer occurs, and when the nucleic acid probe is associated with another single-stranded nucleic acid molecule, the fluorescence energy transfer occurs. In order not to occur, a fluorescent substance serving as an energy donor and a substance serving as an energy acceptor are combined. The fluorescence emitted from the aggregate containing the nucleic acid probe is the fluorescence emitted from the fluorescent substance serving as the energy donor.
According to the eighth aspect of the present invention, in the step of moving the position of the light detection region, the position of the light detection region is moved at a predetermined speed.
According to the ninth aspect of the present invention, in the step of moving the position of the light detection region, the position of the light detection region is moved at a speed higher than the diffusion movement speed of the aggregate.
The method for detecting a nucleic acid molecule according to the tenth aspect of the present invention includes a step of individually detecting an optical signal from each aggregate from the detected light, and detecting the aggregate individually. Based on the shape of the time-series optical signal, it is detected that one aggregate has entered the light detection region. According to an eleventh aspect of the present invention, the sample solution contains one or more selected from the group consisting of a surfactant, formamide, dimethyl sulfoxide, and urea.
In the method for detecting a nucleic acid molecule according to the twelfth aspect of the present invention, the temperature of the sample solution prepared in the preparing step is set to 70 ° C. or higher in the associating step, whereby the nucleic acid in the sample solution is detected. After denaturing the molecules, the liquid temperature of the sample solution is lowered at a rate of temperature decrease of 0.05 ° C./second or more to associate nucleic acid molecules in the sample solution.
According to the thirteenth aspect of the present invention, the nucleic acid probe is configured by binding two or more molecules selected from the group consisting of DNA, RNA, and nucleic acid analogs.
上述の核酸分子の検出方法は、さらに、核酸プローブと生体試料中の解析対象である核酸分子との会合体の走査分子計数法による検出を行う前に、試料溶液から生体試料由来のタンパク質を除去する。そのため、解析対象の核酸分子を走査分子計数法によってより精度よく検出することができる。 The scanning molecule counting method used in the above-described nucleic acid molecule detection method does not execute statistical processing such as calculating fluctuations in fluorescence intensity. Therefore, according to the above-described method for detecting a nucleic acid molecule, the nucleic acid molecule to be analyzed can be detected even when only a very small amount is present in the sample.
The nucleic acid molecule detection method described above further removes the protein derived from the biological sample from the sample solution before detecting the aggregate of the nucleic acid probe and the nucleic acid molecule to be analyzed in the biological sample by the scanning molecule counting method. To do. Therefore, the nucleic acid molecule to be analyzed can be detected with higher accuracy by the scanning molecule counting method.
・ 1つの発光プローブが1つの粒子に結合している場合。
・ 複数の発光プローブが1つの粒子に結合している場合。
・ 実験態様によって1つの粒子に結合した後粒子から解離した発光プローブである場合。
本実施の形態では、典型的には、所定の閾値より大きい強度を有する光信号が検出されたときに、1つの粒子に結合した発光プローブが光検出領域に入ったと検出されるように構成してもよい。 In the step of individually detecting the particles, it is determined whether or not a light-emitting probe combined with one particle has entered the light detection region from sequentially detected light signals. You may carry out based on the shape of. In the present embodiment, the “luminescent probe bonded to one particle” includes the following cases:
• One luminescent probe is bound to one particle.
• When multiple luminescent probes are bound to one particle.
-In the case of a luminescent probe dissociated from a particle after binding to one particle according to the experimental mode.
In the present embodiment, typically, when an optical signal having an intensity greater than a predetermined threshold is detected, it is configured that a luminescent probe coupled to one particle is detected to have entered the light detection region. May be.
例えば、レーザ走査型光学顕微鏡において採用されているガルバノミラーを用いて光路を変更して光検出領域の位置が変更されるように構成してもよい。光検出領域の位置の移動軌跡は、任意に設定されてよい。例えば、光検出領域の位置の移動軌跡は、円形、楕円形、矩形、直線及び曲線のうちから選択可能である。 The optical path of the optical system for moving the position of the light detection region may be changed by an arbitrary method.
For example, the position of the light detection region may be changed by changing the optical path using a galvanometer mirror employed in a laser scanning optical microscope. The movement trajectory of the position of the light detection region may be set arbitrarily. For example, the movement locus of the position of the light detection region can be selected from a circle, an ellipse, a rectangle, a straight line, and a curve.
走査分子計数法は、基本的な構成において、図1Aに模式的に例示されているように、FCS、FIDA等が実行可能な共焦点顕微鏡の光学系と光検出器とを組み合わせて構成される光分析装置により実現できる。図1Aに示すように、光分析装置1は、光学系2~17と、光学系の各部の作動を制御すると共にデータを取得し解析するためのコンピュータ18とから構成される。光分析装置1の光学系は、通常の共焦点顕微鏡の光学系と同様であってよい。この光学系では、光源2から放射されシングルモードファイバー3内を伝播したレーザ光(Ex)が、ファイバーの出射端において固有のNAにて決まった角度にて発散する光となって放射され、コリメーター4によって平行光となる。この平行光は、ダイクロイックミラー5、反射ミラー6、7にて反射され、対物レンズ8へ入射される。対物レンズ8の上方には、典型的には、1~数十μLの試料溶液が分注される試料容器又はウェル10が配列されたマイクロプレート9が配置されている。対物レンズ8から出射したレーザ光は、試料容器又はウェル10内の試料溶液中で焦点を結び、光強度の強い領域(励起領域)が形成される。試料溶液中には、観測対象物である粒子と、前記粒子と結合する発光プローブが分散又は溶解されている。典型的には、蛍光色素等の発光標識が付加された分子が分散又は溶解されている。発光プローブと結合又は会合した粒子(実験の態様では、粒子と一旦結合した後に粒子から解離した発光プローブ)が励起領域に進入すると、その間、発光プローブが励起され光が放出される。放出された光(Em)は、対物レンズ8、ダイクロイックミラー5を通過し、ミラー11にて反射してコンデンサーレンズ12にて集光され、ピンホール13を通過し、バリアフィルター14を透過する。光(Em)が、バリアフィルター14を透過するとき、特定の波長帯域の光成分のみが選択される。そして、特定の波長帯域の光成分のみが選択された光は、マルチモードファイバー15に導入されて、光検出器16に到達する。光検出器16に到達した光は、時系列の電気信号に変換された後、コンピュータ18へ入力され、後に説明される態様にて光分析のための処理が為される。上記の構成において、ピンホール13は、対物レンズ8の焦点位置と共役の位置に配置されている。これにより、図1Bに模式的に示されているレーザ光の焦点領域、即ち、励起領域内から発せられた光のみがピンホール13を通過し、励起領域以外からの光は遮断される。図1Bに例示されたレーザ光の焦点領域は、通常、1~10fL程度の実効体積を有する本光分析装置における光検出領域であり、コンフォーカル・ボリュームと称される。レーザ光の焦点領域は、典型的には、光強度が領域の中心を頂点とするガウス型分布又はローレンツ型分布となる。さらに、レーザ光の焦点領域の実効体積は、光強度が1/e2 となる面を境界とする略楕円球体の体積である。
また、走査分子計数法では、1つの粒子及び発光プローブの結合体又は発光プローブからの光、例えば、一個又は数個の蛍光色素分子からの微弱光が検出される。そのため、光検出器16としては、好適には、フォトンカウンティングに使用可能な超高感度の光検出器が用いられる。また、顕微鏡のステージ(図示せず)には、マイクロプレート9の水平方向位置を移動するためのステージ位置変更装置17aが設けられていてよい。このステージ位置変更装置17aは、粒子等を観察するためのウェル10を変更するために用いられる。ステージ位置変更装置17aの作動は、コンピュータ18により制御されてよい。上記構成により、検体が複数在る場合にも、迅速な計測が達成できる。 <Configuration of optical analyzer for scanning molecule counting method>
In the basic configuration, the scanning molecule counting method is configured by combining an optical system of a confocal microscope capable of executing FCS, FIDA, and the like with a photodetector as schematically illustrated in FIG. 1A. This can be realized by an optical analyzer. As shown in FIG. 1A, the
In the scanning molecule counting method, light from a conjugate of a particle and a luminescent probe or a luminescent probe, for example, weak light from one or several fluorescent dye molecules is detected. Therefore, as the
FIDA等の分光分析技術は、従前の生化学的な分析技術に比して、必要な試料量が極めて少なく、且つ、迅速に検査が実行できる点で優れている。しかしながら、FIDA等の分光分析技術では、原理的に、観測対象粒子の濃度や特性は、蛍光強度のゆらぎに基づいて算定される。そのため、精度のよい測定結果を得るためには、試料溶液中の観測対象粒子の濃度又は数密度が、蛍光強度の計測中に常に一個程度の観測対象粒子が光検出領域CV内に存在するレベルであり、計測時間中に常に有意な光強度(フォトンカウント)が検出されることが要求される。もし観測対象粒子の濃度又は数密度がそれよりも低い場合(例えば、観測対象粒子がたまにしか光検出領域CV内へ進入しないレベルである場合)には、有意な光強度(フォトンカウント)が、計測時間の一部にしか現れず、精度のよい光強度のゆらぎの算定が困難となる。また、観測対象粒子の濃度が計測中に常に一個程度の観測対象粒子が光検出領域内に存在するレベルよりも大幅に低い場合には、光強度のゆらぎの演算において、バックグラウンドの影響を受けやすく、演算に十分な量の有意な光強度データを得るために計測時間が長くなる。これに対して、走査分子計数法では、観測対象粒子の濃度がFIDA等の分光分析技術にて要求されるレベルよりも低い場合でも、観測対象粒子の数密度又は濃度等の特性が検出できる。 <Principle of optical analysis technology of scanning molecule counting method>
A spectroscopic analysis technique such as FIDA is superior to a conventional biochemical analysis technique in that it requires an extremely small amount of sample and can perform inspection quickly. However, in spectroscopic techniques such as FIDA, in principle, the concentration and characteristics of the observation target particles are calculated based on fluctuations in fluorescence intensity. Therefore, in order to obtain an accurate measurement result, the concentration or number density of the observation target particles in the sample solution is a level at which about one observation target particle is always present in the light detection region CV during the measurement of the fluorescence intensity. It is required that a significant light intensity (photon count) is always detected during the measurement time. If the concentration or number density of the observation target particles is lower than that (for example, when the observation target particles are at a level that only occasionally enters the light detection region CV), a significant light intensity (photon count) is obtained. It appears only in a part of the measurement time, and it is difficult to accurately calculate the fluctuation of the light intensity. Also, if the concentration of the observation target particle is much lower than the level at which one observation target particle is always present in the light detection region during measurement, the light intensity fluctuation calculation is affected by the background. The measurement time is long in order to easily obtain significant light intensity data sufficient for calculation. On the other hand, in the scanning molecule counting method, characteristics such as the number density or concentration of the observation target particles can be detected even when the concentration of the observation target particles is lower than a level required by a spectroscopic analysis technique such as FIDA.
そうすると、例えば、図2Aのように、光検出領域CVが移動する間(図中、時間t0~t2)において1つの粒子(図中、発光プローブとして蛍光色素が結合している。)の存在する領域を通過する際(t1)には、図2Bに描かれているような有意な光強度(Em)が検出される。かくして、上記の光検出領域CVの位置の移動と光検出を実行し、その間に出現する図2Bに例示されているような有意な光強度を一つずつ検出することによって、発光プローブの結合した粒子が個別に検出される。個別に検出した前記粒子の数をカウントすることにより、計測された領域内に存在する粒子の数、あるいは、濃度もしくは数密度に関する情報が取得できる。前記走査分子計数法の光分析技術の原理においては、蛍光強度のゆらぎの算出のように、統計的な演算処理は行われず、粒子が一つずつ検出されるので、FIDA等では十分な精度にて分析ができないほど、観測されるべき粒子の濃度が低い試料溶液であっても、粒子の濃度もしくは数密度に関する情報が取得できる。 In the optical analysis technique of the scanning molecule counting method, the process executed is, in short, changing the optical path by driving a mechanism (mirror deflector 17) for moving the position of the photodetection region. As schematically illustrated in FIG. 2, light detection is performed while moving the position of the light detection region CV in the sample solution, that is, while scanning the sample solution by the light detection region CV. .
Then, for example, as shown in FIG. 2A, one particle (a fluorescent dye is bound as a luminescent probe in the figure) while the light detection region CV moves (time t0 to t2 in the figure). When passing through the region (t1), a significant light intensity (Em) as depicted in FIG. 2B is detected. Thus, the position of the light detection region CV is moved and the light detection is performed, and the significant light intensity as illustrated in FIG. Particles are detected individually. By counting the number of individually detected particles, the number of particles existing in the measured region, or information on the concentration or number density can be acquired. In the principle of the optical analysis technique of the scanning molecule counting method, statistical calculation processing is not performed as in the calculation of fluctuations in fluorescence intensity, and particles are detected one by one. Thus, information on the concentration or number density of particles can be obtained even in a sample solution having a concentration of particles to be observed that is so low that it cannot be analyzed.
走査分子計数法の光分析における光強度の測定は、測定中にミラー偏向器17を駆動して、試料溶液内での光検出領域の位置の移動(試料溶液内の走査)を行う他は、FCS又はFIDAにおける光強度の測定工程と同様の態様にて実行されてよい。操作処理において、典型的には、以下の手順が行われる。すなわち、マイクロプレート9のウェル10に試料溶液を注入して顕微鏡のステージ上に載置する。その後、使用者がコンピュータ18に対して、測定の開始の指示を入力する。指示が入力されたコンピュータ18は、記憶装置(図示せず)に記憶されたプログラムに従って、試料溶液内の光検出領域における励起光の照射及び光強度の計測を開始する。このプログラムは、試料溶液内において光検出領域の位置を移動するべく光路を変更する手順と、光検出領域の位置の移動中に光検出領域からの光を検出する手順とを含む。前記計測中、コンピュータ18のプログラムに従った処理動作の制御のもと、ミラー偏向器17は、ミラー7(ガルバノミラー)を駆動して、ウェル10内において光検出領域の位置の移動を実行する。これと同時に光検出器16は、逐次的に検出された光を電気信号に変換してコンピュータ18へ送信する。コンピュータ18は、任意の態様にて、送信された光信号から時系列の光強度データを生成して保存する。なお、典型的には、光検出器16は、一光子の到来を検出できる超高感度光検出器である。光の検出は、所定時間に亘って、逐次的に、所定の単位時間毎(BINTIME)に、実行されるフォトンカウンティングである。例えば、光の検出は、10μ秒毎に光検出器に到来するフォトンの数を計測する態様にて実行される。また、時系列の光強度のデータは、時系列のフォトンカウントデータであってよい。 <Measurement of light intensity of sample solution by scanning molecule counting method>
The measurement of the light intensity in the optical analysis of the scanning molecule counting method is that the
走査分子計数法の光分析技術の観測対象粒子は、溶液中に分散又は溶解されて自由にランダムに運動する粒子であるので、ブラウン運動によって観測対象粒子の位置が時間と伴に移動する。従って、光検出領域の位置の移動速度が粒子のブラウン運動による移動に比して遅い場合には、図3Aに模式的に描かれているように、粒子が領域内をランダムに移動する。これにより、光強度が図3Bのようにランダムに変化し、個々の観測対象粒子に対応する有意な光強度の変化を特定することが困難となる。なお、前述したように、光検出領域の励起光強度は、領域の中心を頂点として外方に向かって低減する。
そこで、好適には、図4Aに描かれているように、粒子が光検出領域を略直線に横切るように設定されるとよい。これにより、時系列の光強度データにおいて、図4Bに例示のように、個々の粒子に対応する光強度の変化のプロファイルが略一様となり、個々の観測対象粒子と光強度との対応が容易に特定できるように、光検出領域の位置の移動速度は、粒子のブラウン運動による平均の移動速度(拡散移動速度)よりも速く設定される。なお、粒子が略直線的に光検出領域を通過する場合には、光強度の変化のプロファイルは、励起光強度分布と略同様となる。 By the way, with respect to the moving speed of the position of the light detection region, in order to quantitatively and accurately perform individual detection of the observation target particles from the measured time-series light intensity data or counting of the number of observation target particles. The moving speed is preferably set to a value faster than the random movement of the observation target particle, that is, the moving speed due to the Brownian movement. More precisely, the observation target particle is a conjugate of the particle and the luminescent probe or a luminescent probe that has been decomposed and released after binding to the particle.
Since the observation target particle of the photoanalysis technique of the scanning molecule counting method is a particle that is dispersed or dissolved in the solution and moves freely at random, the position of the observation target particle moves with time by Brownian motion. Therefore, when the moving speed of the position of the light detection region is slower than the movement due to the Brownian motion of the particle, the particle randomly moves in the region as schematically illustrated in FIG. 3A. As a result, the light intensity changes randomly as shown in FIG. 3B, and it becomes difficult to specify a significant change in light intensity corresponding to each observation target particle. As described above, the excitation light intensity in the light detection region decreases outward with the center of the region as the apex.
Therefore, preferably, as shown in FIG. 4A, the particles may be set so as to cross the light detection region in a substantially straight line. As a result, in the time-series light intensity data, as illustrated in FIG. 4B, the profile of the change in light intensity corresponding to each particle becomes substantially uniform, and the correspondence between each observation target particle and the light intensity is easy. As described above, the moving speed of the position of the light detection region is set faster than the average moving speed (diffusion moving speed) due to the Brownian motion of the particles. When the particles pass through the light detection region substantially linearly, the profile of the change in light intensity is substantially the same as the excitation light intensity distribution.
(2Wo)2 =6D・Δt …(1)
から、
Δt=(2Wo)2 /6D …(2)
となるので、観測対象粒子がブラウン運動により移動する速度(拡散移動速度)Vdifは、概ね、
Vdif=2Wo/Δt=3D/Wo …(3)
となる。そこで、光検出領域の位置の移動速度は、前記Vdifを参照して、それよりも十分に早い値に設定されてよい。例えば、観測対象粒子の拡散係数が、D=2.0×10⁻¹⁰m2/s程度であると予想される場合には、Woが、0.62μm程度だとすると、Vdifは、1.0×10-3m/sとなるので、光検出領域の位置の移動速度は、その略10倍の15mm/sと設定されてよい。なお、観測対象粒子の拡散係数が未知の場合には、光検出領域の位置の移動速度を種々設定して光強度の変化のプロファイルが、予想されるプロファイル(典型的には、励起光強度分布と略同様)となる条件を見つけるための予備実験を繰り返し実行して、好適な光検出領域の位置の移動速度が決定されてよい。 Specifically, an observation target particle having a diffusion coefficient D (more precisely, a conjugate of a particle and a luminescent probe, or a luminescent probe that is decomposed and released after binding to the particle) has a photodetection region having a radius Wo due to Brownian motion. The time Δt required to pass through the (confocal volume) is the relational expression of the mean square displacement (2Wo) 2 = 6D · Δt (1)
From
Δt = ( 2 Wo) 2 / 6D (2)
Therefore, the speed (diffusion movement speed) Vdif that the observation target particle moves by Brownian motion is approximately:
Vdif = 2Wo / Δt = 3D / Wo (3)
It becomes. Therefore, the moving speed of the position of the light detection region may be set to a value sufficiently faster than that with reference to the Vdif. For example, when the diffusion coefficient of the observation target particle is expected to be about D = 2.0 × 10 −10 m 2 / s, if Wo is about 0.62 μm, Vdif is 1.0 × Since it is 10 −3 m / s, the moving speed of the position of the light detection region may be set to 15 mm / s, which is approximately 10 times that. In addition, when the diffusion coefficient of the observation target particle is unknown, the profile of the change in the light intensity by setting the moving speed of the position of the light detection region in various ways is expected (typically, the excitation light intensity distribution). A preliminary experiment for finding a condition that is substantially the same as that described above may be repeatedly performed to determine a suitable moving speed of the position of the light detection region.
上記の処理により試料溶液の時系列の光強度データが得られると、コンピュータ18において、記憶装置に記憶されたプログラムに従った処理により、下記の如き光強度の分析が実行されてよい。 <Analysis of light intensity by scanning molecule counting method>
When the time-series light intensity data of the sample solution is obtained by the above processing, the
時系列の光強度データにおいて、一つの観測対象粒子の光検出領域を通過する際の軌跡が、図4Aに示されているように略直線状である場合、その粒子に対応する光強度の変化は、図6Aに模式的に描かれているように、光検出領域(光学系により決定される光検出領域)の光強度分布を反映したプロファイル(通常、略釣鐘状)を有する。そこで、観測対象粒子の検出の一つの手法において、光強度に対して閾値Ioが設定される。その閾値を超える光強度が継続する時間幅Δτが所定の範囲にあるとき、その光強度のプロファイルが一つの粒子が光検出領域を通過したことに対応すると判定される。また、前記閾値を超える光強度が継続する時間幅Δτが所定の範囲にあるとき、一つの観測対象粒子が検出されるように構成してもよい。光強度に対する閾値Io及び時間幅Δτに対する所定の範囲は、光検出領域に対して所定の速度にて相対的に移動する観測対象粒子と発光プローブとの結合体(又は粒子との結合後分解され遊離した発光プローブ)から発せられる光の強度として想定されるプロファイルに基づいて定められる。プロファイルの具体的な値は、実験的に任意に設定されてよい。もしくは、プロファイルの具体的な値は、観測対象粒子と発光プローブとの結合体(又は粒子との結合後分解され遊離した発光プローブ)の特性によって選択的に決定されてよい。 (I) Detection of one observation target particle In the time-series light intensity data, when the trajectory of one observation target particle passing through the light detection region is substantially linear as shown in FIG. 4A The change in the light intensity corresponding to the particle is a profile (usually, reflecting the light intensity distribution in the light detection region (the light detection region determined by the optical system) as schematically shown in FIG. 6A. (Substantially bell-shaped). Therefore, in one technique for detecting observation target particles, a threshold Io is set for the light intensity. When the time width Δτ in which the light intensity exceeding the threshold continues is within a predetermined range, it is determined that the light intensity profile corresponds to the passage of one particle through the light detection region. Moreover, you may comprise so that one observation object particle | grain may be detected when time width (DELTA) (tau) in which the light intensity exceeding the said threshold value exists in a predetermined range. The predetermined range for the threshold value Io and the time width Δτ for the light intensity is a combination of the observation target particle and the luminescent probe that moves relative to the light detection region at a predetermined speed (or is decomposed after the combination with the particle). It is determined based on the profile assumed as the intensity of light emitted from a free luminescent probe. The specific value of the profile may be arbitrarily set experimentally. Or the specific value of a profile may be selectively determined by the characteristic of the conjugate | bonded_body of observation object particle | grains and a luminescent probe (or luminescent probe decomposed | disassembled and liberated after the coupling | bonding with particle | grains).
ガウス分布:
I=A・exp(-2t2 /a2 ) …(4)
であると仮定できるときには、以下のような手法が用いられる。有意な光強度のプロファイル(バックグラウンドでないと明らかに判断できるプロファイル)に対して式(4)をフィッティングして算出された強度A及び幅aが所定の範囲内にあるとき、その光強度のプロファイルが一つの観測対象粒子が光検出領域を通過したことに対応すると判定され、一つの観測対象粒子の検出が為されてよい。なお、強度A及び幅aが所定の範囲外にあるときには、その光強度のプロファイルは、ノイズ又は異物として分析において無視されてよい。 As another method for detecting the observation target particles, the light intensity distribution in the light detection region is
Gaussian distribution:
I = A · exp (−2t 2 / a 2 ) (4)
When it can be assumed that, the following method is used. When the intensity A and the width a calculated by fitting Equation (4) to a significant light intensity profile (a profile that can be clearly determined not to be background) are within a predetermined range, the light intensity profile May correspond to the fact that one observation target particle has passed through the light detection region, and one observation target particle may be detected. When the intensity A and the width a are outside the predetermined range, the light intensity profile may be ignored in the analysis as noise or foreign matter.
観測対象粒子のカウンティングは、上記の観測対象粒子の検出の手法により検出された粒子の数を、任意の手法により、計数することにより為されてよい。しかしながら、粒子の数が大きい場合には、例えば、図5及び図6Bに例示された処理により観測対象粒子のカウンティングが為されてよい。 (Ii) Counting of observation target particles Counting of observation target particles may be performed by counting the number of particles detected by the above-described detection target particle detection method using an arbitrary method. However, when the number of particles is large, the observation target particles may be counted by, for example, the processing illustrated in FIGS. 5 and 6B.
具体的には、まず、時系列光信号データの時系列の時間微分値データ上にて、逐次的に時間微分値が参照される。次に、一つのピーク信号の始点と終点とが探索され決定され、ピーク存在領域が特定される(ステップ130)。一つのピーク存在領域が特定されると、そのピーク存在領域におけるスムージングされた時系列光信号データに対して、釣鐘型関数のフィッティングが行われ(図6B下段「釣鐘型関数フィッティング」)、釣鐘型関数のピーク強度Imax、ピーク幅(半値全幅)w、フィッティングにおける相関係数(最小二乗法の相関係数)等のパラメータが算出される(ステップ140)。なお、フィッティングされる釣鐘型関数は、典型的には、ガウス関数である。また、フィッティングされる釣鐘型関数は、ローレンツ型関数であってもよい。そして、算出された釣鐘型関数のパラメータが、一つの粒子及び発光プローブの結合体又は発光プローブが光検出領域を通過したときに検出される光信号が描く釣鐘型のプロファイルのパラメータについて想定される範囲内にあるか否か、判定される(ステップ150)。即ち、この判定では、ピーク強度、ピーク幅、相関係数が、それぞれ、所定範囲内にあるか否か等を判定する。このようにして、図7左に示されているように、算出された釣鐘型関数のパラメータが一つの粒子及び発光プローブの結合体又は発光プローブに対応する光信号おいて想定される範囲内にあると判定された信号は、一つの観測対象粒子に対応する信号であると判定される。これにより、一つの観測対象粒子が検出されたこととなり、一つの粒子がカウントされる(粒子数がカウントアップされる。ステップ160)。一方、図7右に示されているように、算出された釣鐘型関数のパラメータが想定される範囲内になかったピーク信号は、ノイズとして無視される。 Thereafter, a significant signal (peak signal) is sequentially detected on the time-series optical signal data, and it is determined whether or not the detected peak signal is a signal corresponding to the observation target particle.
Specifically, first, time differential values are sequentially referred to on time-series time differential value data of time-series optical signal data. Next, a start point and an end point of one peak signal are searched and determined, and a peak existence region is specified (step 130). When one peak existence area is specified, the bell-shaped function fitting is performed on the smoothed time-series optical signal data in the peak existence area (“bell-shaped function fitting” in the lower part of FIG. 6B). Parameters such as the peak intensity Imax of the function, the peak width (full width at half maximum) w, and the correlation coefficient in fitting (correlation coefficient of the least squares method) are calculated (step 140). The bell-shaped function to be fitted is typically a Gaussian function. The bell-shaped function to be fitted may be a Lorentz-type function. Then, the calculated bell-shaped function parameter is assumed as a bell-shaped profile parameter drawn by an optical signal detected when a combination of one particle and the light-emitting probe or the light-emitting probe passes through the light detection region. It is determined whether it is within the range (step 150). That is, in this determination, it is determined whether or not the peak intensity, the peak width, and the correlation coefficient are within a predetermined range. Thus, as shown in the left side of FIG. 7, the calculated bell-shaped function parameter is within the range assumed in the optical signal corresponding to the combination of one particle and the luminescent probe or the luminescent probe. The signal determined to be present is determined to be a signal corresponding to one observation target particle. Thereby, one observation target particle is detected, and one particle is counted (the number of particles is counted up, step 160). On the other hand, as shown in the right of FIG. 7, a peak signal whose calculated bell-shaped function parameter is not within the assumed range is ignored as noise.
観測対象粒子のカウンティングが為されると、時系列光信号データの取得の間に光検出領域の通過した領域の総体積を用いて、観測対象粒子の数密度又は濃度が決定される。しかしながら、光検出領域の実効体積は、励起光又は検出光の波長、レンズの開口数、光学系の調整状態に依存して変動するため、設計値から算定することは、一般に困難である。従って、光検出領域の通過した領域の総体積を算定することも簡単ではない。そこで、典型的には、粒子の濃度が既知の溶液(参照溶液)について、検査されるべき試料溶液の測定と同様の条件にて、上記に説明した光強度の測定、粒子の検出及びカウンティングを行い、検出された粒子の数と参照溶液の粒子の濃度とから、光検出領域の通過した領域の総体積、即ち、観測対象粒子の検出数と濃度との関係が決定されるように構成されてもよい。
参照溶液の粒子は、好ましくは、観測対象粒子が形成する粒子及び発光プローブ結合体(又は観測対象粒子に結合後遊離した発光プローブ)と同様の発光特性を有する発光標識(蛍光色素等)であってよい。具体的には、例えば、粒子の濃度Cの参照溶液について、その粒子の検出数がNであったとすると、光検出領域の通過した領域の総体積Vtは、
Vt=N/C …(5)
により与えられる。また、参照溶液として、複数の異なる濃度の溶液が準備され、それぞれについて測定が実行されて、算出されたVtの平均値が光検出領域の通過した領域の総体積Vtとして採用されるように構成されてもよい。そして、Vtが与えられると、粒子のカウンティング結果がnの試料溶液の粒子の数密度cは、
c=n/Vt …(6)
により与えられる。なお、光検出領域の体積、光検出領域の通過した領域の総体積は、上記の方法によらず、任意の方法にて与えられる。例えば、FCS、FIDAを利用するなどして、総体積が与えられてもよい。また、本実施形態の光分析装置においては、想定される光検出領域の移動パターンについて、種々の標準的な粒子についての濃度Cと粒子の数Nとの関係(式(5))の情報をコンピュータ18の記憶装置に予め記憶し、装置の使用者が光分析を実施する際に適宜記憶された関係の情報を利用できるように構成されてもよい。 (Iii) Determination of the number density or concentration of the observation target particles When the observation target particles are counted, the total volume of the region through which the light detection region passes during acquisition of time-series optical signal data is used. The number density or concentration of the particles is determined. However, since the effective volume of the light detection region varies depending on the wavelength of the excitation light or detection light, the numerical aperture of the lens, and the adjustment state of the optical system, it is generally difficult to calculate from the design value. Accordingly, it is not easy to calculate the total volume of the region through which the light detection region passes. Therefore, typically, for a solution (reference solution) with a known particle concentration, the light intensity measurement, particle detection, and counting described above are performed under the same conditions as the measurement of the sample solution to be examined. The total volume of the region through which the light detection region has passed, that is, the relationship between the number of detected particles and the concentration, is determined from the number of detected particles and the concentration of the reference solution particles. May be.
The particles of the reference solution are preferably luminescent labels (fluorescent dyes or the like) having the same luminescent properties as the particles formed by the observation target particles and the luminescent probe conjugate (or the luminescent probe released after binding to the observation target particles). It's okay. Specifically, for example, for a reference solution having a particle concentration C, if the number of detected particles is N, the total volume Vt of the region through which the light detection region has passed is
Vt = N / C (5)
Given by. Further, a plurality of solutions having different concentrations are prepared as reference solutions, measurement is performed on each of the solutions, and the calculated average value of Vt is adopted as the total volume Vt of the region through which the light detection region has passed. May be. Then, given Vt, the number density c of the particles of the sample solution whose particle counting result is n is
c = n / Vt (6)
Given by. Note that the volume of the light detection region and the total volume of the region through which the light detection region has passed are given by an arbitrary method regardless of the above method. For example, the total volume may be given by using FCS or FIDA. Further, in the optical analyzer of the present embodiment, information on the relationship between the concentration C of various standard particles and the number N of particles (formula (5)) is assumed for the assumed movement pattern of the light detection region. The information may be configured to be stored in advance in a storage device of the
本実施形態の核酸分子の検出方法は、特定の塩基配列を有する核酸分子を解析対象とし、当該核酸分子と特異的に結合する核酸プローブを用いて、当該核酸プローブと解析対象の核酸分子(以下、標的核酸分子、と称することがある。)とをハイブリダイズさせ、形成された会合体の量に基づいて解析対象の核酸分子を検出する方法である。さらに本実施形態は、会合体の検出を、上記の走査分子計数法により測定する。走査分子計数法は、分子が離散的な状況において、蛍光を有する粒子を一粒子毎に測定することができる測定方法であることから、pMオーダー以下の比較的低濃度の核酸分子に対しても測定できる。このため、本実施形態の核酸分子の検出方法により、試料溶液中の標的核酸分子の濃度が非常に低い場合であっても、形成された会合体を高感度に計数することができる。 <Method of detecting nucleic acid molecule>
The method for detecting a nucleic acid molecule of the present embodiment uses a nucleic acid probe that specifically binds to the nucleic acid molecule as a target of analysis for the nucleic acid molecule having a specific base sequence. The target nucleic acid molecule may be referred to as a target nucleic acid molecule), and the nucleic acid molecule to be analyzed is detected based on the amount of the formed aggregate. Further, in the present embodiment, the detection of the aggregate is measured by the scanning molecule counting method described above. The scanning molecule counting method is a measurement method capable of measuring particles having fluorescence for each particle in a state where the molecules are discrete, and therefore, even for a nucleic acid molecule having a relatively low concentration of pM order or less. It can be measured. For this reason, the formed aggregates can be counted with high sensitivity even when the concentration of the target nucleic acid molecule in the sample solution is very low by the nucleic acid molecule detection method of the present embodiment.
(a)標的核酸分子(解析対象の核酸分子)と特異的にハイブリダイズする核酸プローブと、生体試料とを含む試料溶液を調製する工程。
(b)前記工程(a)において調製された試料溶液中の核酸分子と前記核酸プローブとを会合させる工程。
(c)前記工程(b)の後、前記工程(a)において調製された試料溶液中の、前記核酸プローブを含む会合体の分子数を算出する工程。 Specifically, the method for detecting a nucleic acid molecule of the present embodiment includes the following steps (a) to (c), and the step of removing proteins from the following sample solution before the following step (c), or Before the following step (a), there is a step of removing proteins from the following biological sample:
(A) A step of preparing a sample solution containing a nucleic acid probe that specifically hybridizes with a target nucleic acid molecule (nucleic acid molecule to be analyzed) and a biological sample.
(B) A step of associating the nucleic acid molecule in the sample solution prepared in the step (a) with the nucleic acid probe.
(C) A step of calculating the number of molecules of the aggregate containing the nucleic acid probe in the sample solution prepared in the step (a) after the step (b).
・ 工程(a)の後工程(b)の前の場合。
・ 工程(b)の後工程(c)の前の場合。 Removal of the protein derived from the biological sample may be performed before the measurement by the scanning molecule counting method in the step (c). For example, in this embodiment, in step (a), a biological sample that has been subjected to protein removal processing after being collected from the living body may be mixed with a nucleic acid probe to prepare a sample solution. Moreover, you may perform the removal process of protein with respect to a sample solution before the post process (b) of a process (a). Moreover, you may perform the removal process of protein with respect to a sample solution before the post process (c) of a process (b). Since this embodiment can reduce the labor and time for sample preparation, it is preferable to perform a protein removal treatment on the sample solution in the following cases, and in the subsequent step (b) of step (a) More preferably, the previous sample solution is subjected to protein removal treatment:
-Before the post-process (b) of a process (a).
-Before the post-process (c) of a process (b).
試験例1は、一本鎖の標的核酸分子及び核酸プローブとして、人工的に合成したオリゴヌクレオチドを用い、これらをウマ全血又はウマ血漿に添加した試料を、生体試料の摸擬試料とし、当該摸擬生体試料中の標的核酸分子を走査分子計数法により検出した。
測定に用いた標的核酸分子A及び核酸プローブAの塩基配列を表1に示す。核酸プローブAは分子ビーコンプローブである。下線が付された塩基は、分子内構造体を形成する際に互いにハイブリダイズする領域である。 [Test Example 1]
Test Example 1 uses artificially synthesized oligonucleotides as single-stranded target nucleic acid molecules and nucleic acid probes, and samples obtained by adding these to horse whole blood or horse plasma are simulated samples of biological samples.標的 Target nucleic acid molecules in pseudo biological samples were detected by scanning molecule counting method.
Table 1 shows the base sequences of the target nucleic acid molecule A and nucleic acid probe A used for the measurement. The nucleic acid probe A is a molecular beacon probe. Underlined bases are regions that hybridize to each other when forming intramolecular structures.

試験例1は、標的核酸分子A及び核酸プローブAを、それぞれ50pMとなるようにトリスバッファー(10mM Tris-HCl、1mM EDTA、100mM NaCl、pH8.0)中で混合することにより、50pM核酸プローブ溶液を調製した。また、標的核酸分子A及び核酸プローブAを、それぞれ5pMとなるように前記トリスバッファー中で混合することにより、5pM核酸プローブ溶液を調製した。得られた核酸プローブ溶液を、95℃で10分間、70℃で10分間、60℃で10分間、50℃で10分間、20℃で10分間のアニーリング処理し、標的核酸分子Aと核酸プローブAとからなる会合体を形成した。
一方で、50μlのウマ全血又は50μlのウマ血漿から、核酸抽出キット(製品名:QIAamp DNA Micro kit、QIAGEN社製)を用いて核酸抽出液を調製した。当該核酸抽出液は、本発明の実施形態におけるタンパク質除去処理後の生体試料に相当する。また、核酸抽出キットによる処理前のウマ全血又はウマ血漿は、タンパク質除去処理前の生体試料に相当する。
調製された核酸抽出液に、それぞれ50μlずつ、アニーリング処理後の50pM核酸プローブ溶液又は5pM核酸プローブ溶液を添加し、試料溶液を調製した(試料調製(+))。また、50μlのウマ全血及び50μlのウマ血漿に、それぞれ50μlずつ、アニーリング処理後の50pM核酸プローブ溶液又は5pM核酸プローブ溶液を添加し、試料溶液を調製した(試料調製(-))。さらに、対照として、50μlの前記トリスバッファーに、それぞれ50μlずつ、アニーリング処理後の50pM核酸プローブ溶液又は5pM核酸プローブ溶液を添加し、試料溶液を調製した(Control)。 <Preparation of sample solution>
In Test Example 1, a target nucleic acid molecule A and a nucleic acid probe A were mixed in Tris buffer (10 mM Tris-HCl, 1 mM EDTA, 100 mM NaCl, pH 8.0) so as to be 50 pM, respectively. Was prepared. In addition, a 5 pM nucleic acid probe solution was prepared by mixing the target nucleic acid molecule A and the nucleic acid probe A in the Tris buffer so that each would be 5 pM. The obtained nucleic acid probe solution was annealed at 95 ° C. for 10 minutes, 70 ° C. for 10 minutes, 60 ° C. for 10 minutes, 50 ° C. for 10 minutes, and 20 ° C. for 10 minutes, and the target nucleic acid molecule A and nucleic acid probe A Was formed.
Meanwhile, a nucleic acid extract was prepared from 50 μl of whole horse blood or 50 μl of horse plasma using a nucleic acid extraction kit (product name: QIAamp DNA Micro kit, manufactured by QIAGEN). The nucleic acid extract corresponds to the biological sample after the protein removal treatment in the embodiment of the present invention. Moreover, the whole horse blood or horse plasma before the treatment with the nucleic acid extraction kit corresponds to a biological sample before the protein removal treatment.
To the prepared nucleic acid extract, 50 μl each of the annealed 50 pM nucleic acid probe solution or 5 pM nucleic acid probe solution was added to prepare a sample solution (sample preparation (+)). In addition, 50 μl each of 50 μl of equine whole blood and 50 μl of equine plasma were added with 50 pM nucleic acid probe solution or 5 pM nucleic acid probe solution after annealing treatment to prepare a sample solution (sample preparation (−)). Further, as a control, 50 μl each of the 50 pM nucleic acid probe solution or the 5 pM nucleic acid probe solution after the annealing treatment was added to 50 μl of the Tris buffer to prepare a sample solution (Control).
試験例1は、各試料溶液中の標的核酸分子A及び核酸プローブAからなる会合体の分子数を、走査分子計数法により計数した。具体的には、計測においては、光分析装置として、共焦点蛍光顕微鏡の光学系とフォトンカウンティングシステムを備えた1分子蛍光測定装置MF20(オリンパス株式会社)を用い、上記の各試料溶液について、時系列のフォトンカウントデータを取得した。その際、励起光は、543nmのレーザ光を用いて、回転速度6,000rpm、300μWで照射する。また、検出光波長は、バンドパスフィルターを用いて560~620nmとした。アバランシェフォトダイオードから得られるシグナルは、BINTIMEを10μ秒とし、測定時間は、2秒間とした。
測定によって得られた時系列データをSavinzky-Golayのアルゴリズムでスムージングした後、微分によりピークが検出された。ピークとみなされた領域のうち、ガウス関数に近似できる領域は、シグナルとして抽出される。 <Counting by scanning molecule counting method>
In Test Example 1, the number of molecules of the aggregate composed of the target nucleic acid molecule A and the nucleic acid probe A in each sample solution was counted by a scanning molecule counting method. Specifically, in the measurement, a single-molecule fluorescence measuring device MF20 (Olympus Corporation) equipped with an optical system of a confocal fluorescence microscope and a photon counting system is used as an optical analysis device. Series photon count data was obtained. At that time, excitation light is irradiated at a rotational speed of 6,000 rpm and 300 μW using a laser beam of 543 nm. The detection light wavelength was 560 to 620 nm using a band pass filter. As for the signal obtained from the avalanche photodiode, BINTIME was set to 10 μs, and the measurement time was set to 2 seconds.
The time series data obtained by the measurement was smoothed by the Savinzky-Golay algorithm, and then a peak was detected by differentiation. Of the regions regarded as peaks, a region that can be approximated to a Gaussian function is extracted as a signal.
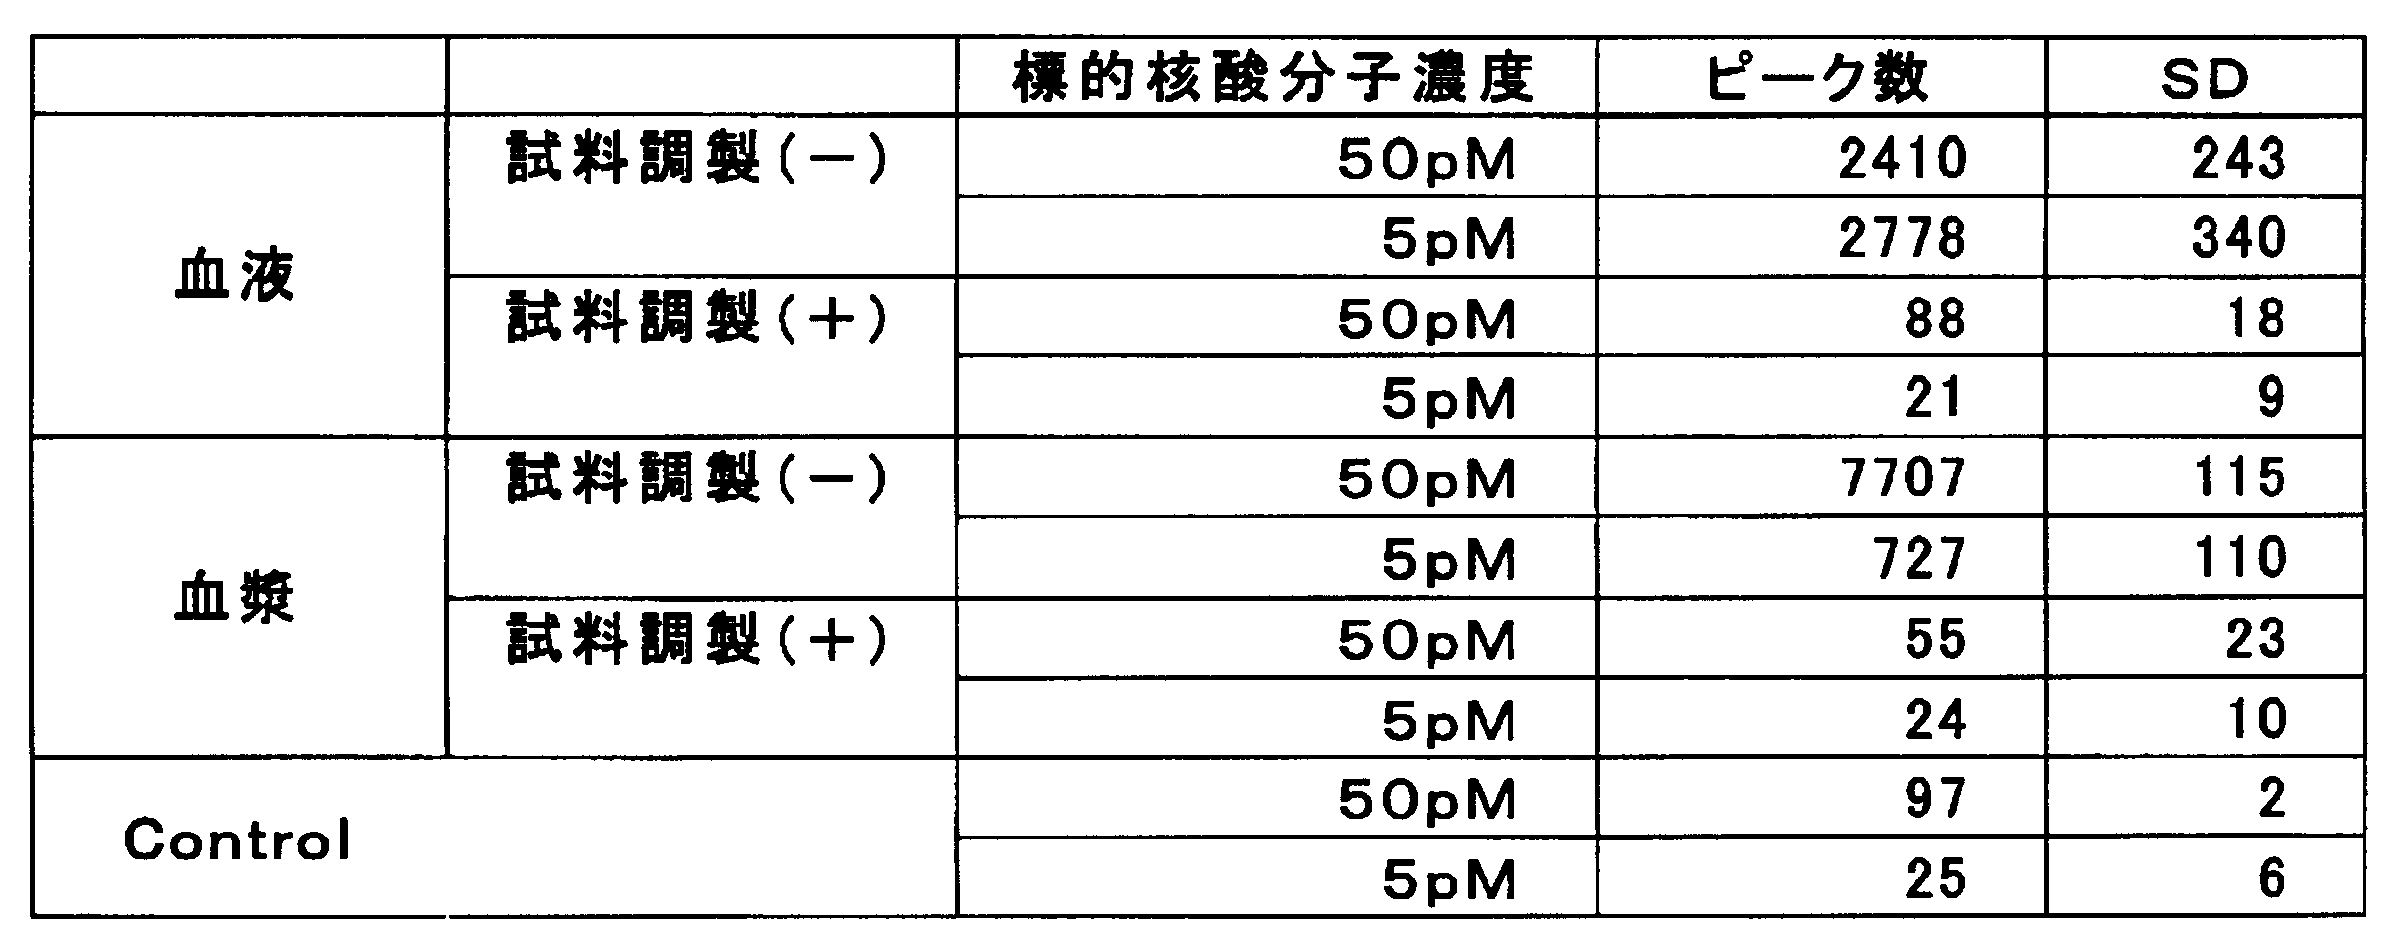
実施例1においては、蛍光標識されたプライマーと非標識のプライマーを用いてPCRにより得られたPCR産物のうち、非標識のプライマーから伸長した一本鎖核酸分子を標的核酸とした。蛍光標識されたプライマーから伸長した一本鎖核酸分子を核酸プローブとした。これらをパラフィン包埋組織切片から脱パラフィン処理により得られた生体試料に添加したものを擬似生体試料とし、当該擬似生体試料中の標的核酸分子を走査分子計数法により検出した。 [Example 1]
In Example 1, out of PCR products obtained by PCR using a fluorescently labeled primer and an unlabeled primer, a single-stranded nucleic acid molecule extended from the unlabeled primer was used as the target nucleic acid. A single-stranded nucleic acid molecule extended from a fluorescently labeled primer was used as a nucleic acid probe. These were added to a biological sample obtained by deparaffinization from a paraffin-embedded tissue section as a pseudo biological sample, and target nucleic acid molecules in the pseudo biological sample were detected by a scanning molecule counting method.
実施例1においては、プラスミドpUC19(タカラバイオ社製)を鋳型とし、TAMRA標識のオリゴヌクレオチドプライマー、蛍光物質で標識されていないオリゴヌクレオチドプライマー、及びPCRキット(製品名:AmpliTaq Gold、Applied Biosystems社製)を用いて、800bpの鎖長からなるPCR産物を調製した。Wizard SV Gel and PCR Clean-Up System(Promega社製)を用いて、当該PCR産物から未反応のオリゴヌクレオチドプライマーを除去した後、電気泳動装置Bioanalyzer(Agilent社製)を用いた電気泳動により、PCR産物の有無及び濃度を測定した。トリスバッファー(10mM Tris-HCl、1mM EDTA、100mM NaCl、pH8.0)を用いて、当該PCR産物の濃度が2pM、20pM、又は200pMとなるように調整したPCR産物溶液をそれぞれ調製した。なお、当該PCR産物を構成する2本の1本鎖核酸分子のうち、蛍光標識されている核酸分子を核酸プローブBとした。また、蛍光標識されていない核酸分子を標的核酸分子Bとした。 <Preparation of target nucleic acid molecule B and nucleic acid probe B>
In Example 1, using plasmid pUC19 (manufactured by Takara Bio Inc.) as a template, TAMRA-labeled oligonucleotide primer, oligonucleotide primer not labeled with a fluorescent substance, and PCR kit (product name: AmpliTaq Gold, Applied Biosystems) ) Was used to prepare a PCR product having a chain length of 800 bp. After removing unreacted oligonucleotide primers from the PCR product using Wizard SV Gel and PCR Clean-Up System (Promega), PCR was performed by electrophoresis using an electrophoresis apparatus Bioanalyzer (Agilent). The presence and concentration of the product was measured. PCR product solutions were prepared using Tris buffer (10 mM Tris-HCl, 1 mM EDTA, 100 mM NaCl, pH 8.0) so that the concentration of the PCR product was 2 pM, 20 pM, or 200 pM. Of the two single-stranded nucleic acid molecules constituting the PCR product, the fluorescently labeled nucleic acid molecule was designated as nucleic acid probe B. A nucleic acid molecule that was not fluorescently labeled was designated as target nucleic acid molecule B.
実施例1においては、ラット肝臓及び腎臓の4%ホルマリン固定パラフィン包埋組織切片を、キシレンによる脱パラフィンした後、プロテイナーゼKを添加し、56℃で10分間酵素反応処理を行った。酵素反応処理後の溶液は、プロテイナーゼK処理済生体試料溶液とした。
プロテイナーゼK処理済生体試料溶液と、各濃度のPCR産物溶液又は前記トリスバッファーとを等量ずつ添加し、PCR産物濃度が0、1、10、及び100pMの試料溶液をそれぞれ調製した(タンパク質除去処理無し)。各試料溶液は、さらに、95℃で10分間、55℃で10分間、その後室温に維持することにより、アニーリング処理を行った。
一方で、プロテイナーゼK処理済生体試料溶液をさらに70℃で10分間処理した後、等量のPCR産物溶液又は前記トリスバッファーをそれぞれ添加し、PCR産物濃度が0、1、10、及び100pMの試料溶液をそれぞれ調製した。各試料溶液に対しては、さらに、試料溶液(タンパク質除去処理無し)と同様にアニーリング処理を行った。その後、核酸精製キット(製品名:MinElute PCR purification kit、QIAGEN社製)を用いて、前記アニーリング処理した試料溶液を精製し、得られた核酸抽出液を測定試料とした(タンパク質除去処理あり1)。
また、70℃で10分間の処理を行うことなく、プロテイナーゼK処理済生体試料溶液と、各濃度のPCR産物溶液又は前記トリスバッファーとを等量ずつ添加し、PCR産物濃度が0、1、10、及び100pMの試料溶液をそれぞれ調製した。各試料溶液に対しては、さらに、試料溶液(タンパク質除去処理あり1)と同様にして、アニーリング処理を行った後、核酸精製キットを用いて精製し、得られた核酸抽出液を測定試料とした(タンパク質除去処理あり2)。
対照として、各濃度のPCR産物溶液と前記トリスバッファーとを等量ずつ添加し、PCR産物濃度が0、1、10、及び100pMの試料溶液をそれぞれ調製した(Control)。各試料溶液に対しては、さらに、試料溶液(タンパク質除去処理無し)と同様にアニーリング処理を行った。 <Preparation of sample solution>
In Example 1, 4% formalin-fixed paraffin-embedded tissue sections of rat liver and kidney were deparaffinized with xylene, proteinase K was added, and enzyme reaction treatment was performed at 56 ° C. for 10 minutes. The solution after the enzyme reaction treatment was a proteinase K-treated biological sample solution.
A proteinase K-treated biological sample solution and an equal amount of each PCR product solution or Tris buffer were added to prepare sample solutions having PCR product concentrations of 0, 1, 10, and 100 pM (protein removal treatment). None). Each sample solution was further annealed by maintaining at 95 ° C. for 10 minutes, 55 ° C. for 10 minutes and then at room temperature.
On the other hand, after the proteinase K-treated biological sample solution was further treated at 70 ° C. for 10 minutes, an equal amount of the PCR product solution or the Tris buffer was added, respectively, and the PCR product concentrations were 0, 1, 10, and 100 pM. Each solution was prepared. Each sample solution was further subjected to an annealing treatment in the same manner as the sample solution (without protein removal treatment). Thereafter, the sample solution subjected to the annealing treatment was purified using a nucleic acid purification kit (product name: MinElute PCR purification kit, manufactured by QIAGEN), and the obtained nucleic acid extract was used as a measurement sample (with protein removal treatment 1). .
Further, without performing the treatment at 70 ° C. for 10 minutes, the proteinase K-treated biological sample solution and the PCR product solution of each concentration or the Tris buffer are added in equal amounts, and the PCR product concentration is 0, 1, 10 , And 100 pM sample solutions were prepared, respectively. Each sample solution is further annealed in the same manner as the sample solution (with protein removal treatment 1), and then purified using a nucleic acid purification kit, and the resulting nucleic acid extract is used as a measurement sample. (With protein removal treatment 2).
As a control, equal amounts of the PCR product solution at each concentration and the Tris buffer were added to prepare sample solutions having PCR product concentrations of 0, 1, 10, and 100 pM, respectively (Control). Each sample solution was further subjected to an annealing treatment in the same manner as the sample solution (without protein removal treatment).
実施例1においては、試験例1と同様にして、走査分子計数法により、上記の各試料溶液中に存在する標的核酸分子Bと核酸プローブBからなる会合体の数を計数した。
計数結果を図9及び表3に示す。さらに、図9において、各試料溶液における標的核酸分子の濃度と、計数されたピーク数の関係の近似直線を表4に示す。生体試料を添加していない試料溶液(Control)において計数されたピーク数が、生体試料由来の夾雑物による影響を受けていない信頼性の高い計数結果である。試料溶液(タンパク質除去処理無し)では、試料溶液(Control)と比べて極端な高値を示した。また、試料溶液中の標的核酸分子の濃度と検出されるピーク数との関係は、試料溶液(Control)と比較して、著しく直線性が失われていた。一方で、試料溶液(タンパク質除去処理あり1)及び試料溶液(タンパク質除去処理あり2)は、いずれも試料溶液(Control)とほぼ同等のピーク数が検出されており、いずれも測定試料中の標的核酸分子を定量的に精度よく検出できることが示された。特に、プロテイナーゼK処理後の酵素失活処理を省略した試料溶液(タンパク質除去処理あり2)は、試料溶液(タンパク質除去処理あり1)と同様に精度よく標的核酸分子を検出できることから、本発明の実施形態の核酸分子の検出方法により、酵素の失活処理等を省略した場合であっても、走査分子計数法による計測ができることは明らかである。 <Counting by scanning molecule counting method>
In Example 1, in the same manner as in Test Example 1, the number of aggregates composed of the target nucleic acid molecule B and the nucleic acid probe B present in each sample solution was counted by the scanning molecule counting method.
The counting results are shown in FIG. Furthermore, in FIG. 9, the approximate straight line of the relationship between the density | concentration of the target nucleic acid molecule in each sample solution and the number of counted peaks is shown in Table 4. The number of peaks counted in the sample solution (Control) to which the biological sample is not added is a highly reliable counting result that is not affected by contaminants derived from the biological sample. The sample solution (without protein removal treatment) showed an extremely high value compared to the sample solution (Control). In addition, the relationship between the concentration of the target nucleic acid molecule in the sample solution and the number of detected peaks was significantly lost in linearity compared to the sample solution (Control). On the other hand, the sample solution (with protein removal treatment 1) and the sample solution (with protein removal treatment 2) both have almost the same number of peaks as the sample solution (Control), and both are targets in the measurement sample. It was shown that nucleic acid molecules can be detected quantitatively with high accuracy. In particular, the sample solution (with protein removal treatment 2) in which the enzyme deactivation treatment after the proteinase K treatment is omitted can detect the target nucleic acid molecule with high accuracy in the same manner as the sample solution (with protein removal treatment 1). It is apparent that measurement by the scanning molecule counting method can be performed even when the enzyme deactivation treatment or the like is omitted by the nucleic acid molecule detection method of the embodiment.
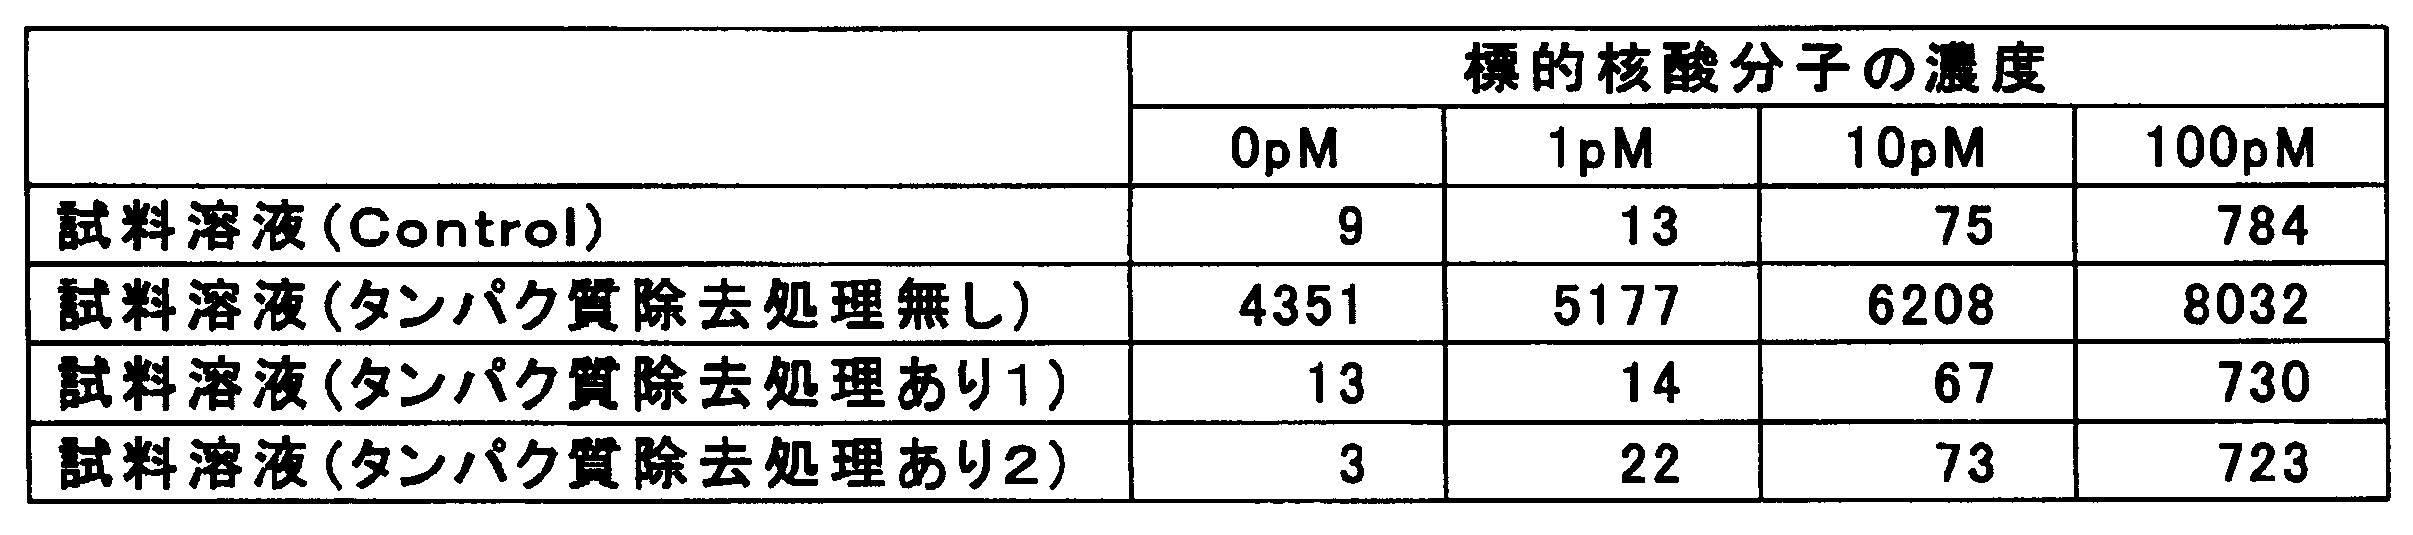
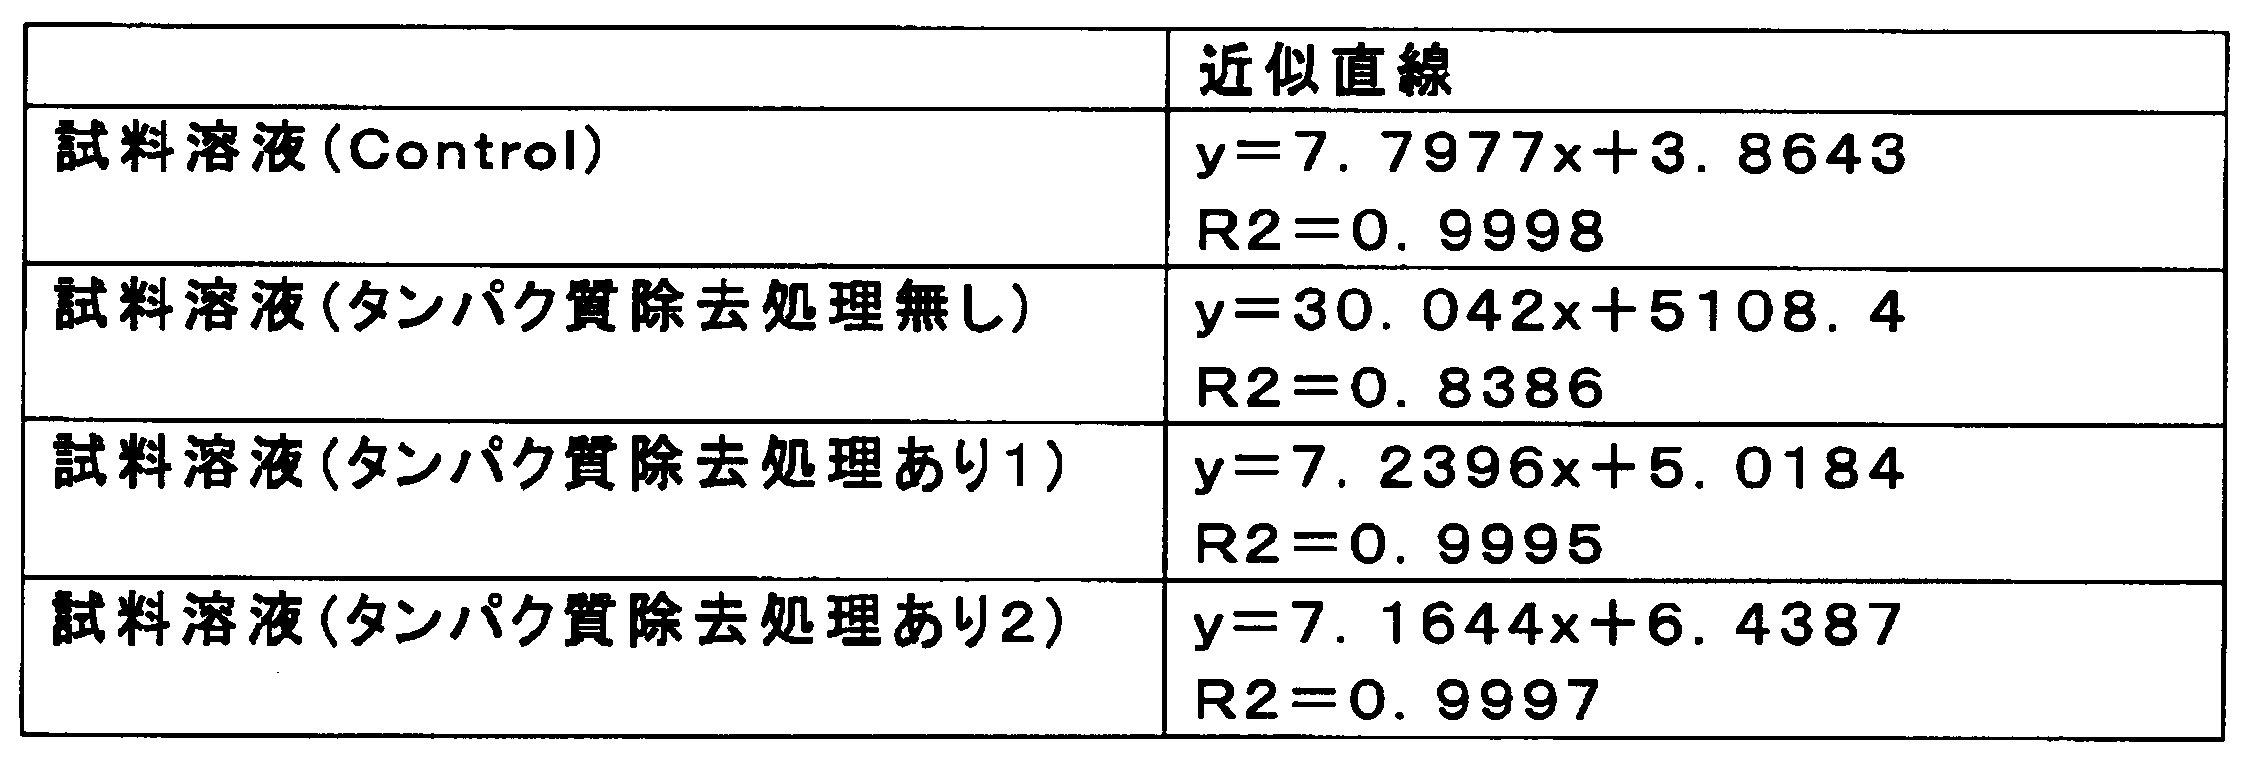
実施例2においては、蛍光標識されたプライマーと非標識のプライマーを用いてPCRにより得られたPCR産物のうち、非標識のプライマーから伸長した一本鎖核酸分子を標的核酸とした。蛍光標識されたプライマーから伸長した一本鎖核酸分子を核酸プローブとした。これらをウマ血漿に添加した試料を擬似生体試料とし、当該擬似生体試料中の標的核酸分子を走査分子計数法により検出した。 [Example 2]
In Example 2, out of PCR products obtained by PCR using a fluorescently labeled primer and an unlabeled primer, a single-stranded nucleic acid molecule extended from the unlabeled primer was used as the target nucleic acid. A single-stranded nucleic acid molecule extended from a fluorescently labeled primer was used as a nucleic acid probe. A sample obtained by adding these to horse plasma was used as a pseudo biological sample, and target nucleic acid molecules in the pseudo biological sample were detected by a scanning molecule counting method.
実施例2においては、プラスミドpUC19(タカラバイオ社製)を鋳型とし、ATTO647N標識のオリゴヌクレオチドプライマー、蛍光物質で標識されていないオリゴヌクレオチドプライマー、及びPCRキット(製品名:AmpliTaq Gold、Applied Biosystems社製)を用いて、800bpの鎖長からなるPCR産物を調製した。Wizard SV Gel and PCR Clean-Up System(Promega社製)を用いて、当該PCR産物から未反応のオリゴヌクレオチドプライマーを除去した後、電気泳動装置Bioanalyzer(Agilent社製)を用いた電気泳動により、PCR産物の有無及び濃度を測定した。トリスバッファー(10mM Tris-HCl、1mM EDTA、100mM NaCl、pH8.0)を用いて、当該PCR産物の濃度が2pM、20pM、又は200pMとなるように調整したPCR産物溶液をそれぞれ調製した。なお、当該PCR産物を構成する2本の1本鎖核酸分子のうち、蛍光標識されている核酸分子を核酸プローブCとした。また、蛍光標識されていない核酸分子を標的核酸分子Cとした。 <Preparation of target nucleic acid molecule C and nucleic acid probe C>
In Example 2, using plasmid pUC19 (manufactured by Takara Bio Inc.) as a template, oligonucleotide primer labeled with ATTO647N, oligonucleotide primer not labeled with a fluorescent substance, and PCR kit (product name: AmpliTaq Gold, Applied Biosystems) ) Was used to prepare a PCR product having a chain length of 800 bp. After removing unreacted oligonucleotide primers from the PCR product using Wizard SV Gel and PCR Clean-Up System (Promega), PCR was performed by electrophoresis using an electrophoresis apparatus Bioanalyzer (Agilent). The presence and concentration of the product was measured. PCR product solutions were prepared using Tris buffer (10 mM Tris-HCl, 1 mM EDTA, 100 mM NaCl, pH 8.0) so that the concentration of the PCR product was 2 pM, 20 pM, or 200 pM. Of the two single-stranded nucleic acid molecules constituting the PCR product, a nucleic acid molecule that was fluorescently labeled was used as a nucleic acid probe C. A nucleic acid molecule that was not fluorescently labeled was designated as target nucleic acid molecule C.
実施例2においては、1.5mlのチューブに、ウマ血漿と、実施例1で調製した2pM、20pM、又は200pMのPCR産物溶液又は前記トリスバッファーとを等量ずつ添加し、PCR産物濃度が0、1、10、及び100pMである試料溶液100μlを、2本ずつそれぞれ調製した。
2本ずつ調製した試料溶液のうち、1本にはタンパク質除去剤(製品名:BindPro(登録商標)、Biotech Support Group社製)を200μl加え、懸濁させた。一方には、PBS(pH7.2)を200μl加え、懸濁させた。その後、各試料溶液を10分間静置した後、16,000×gで5分間遠心分離処理を行い、上清を分取した。 <Preparation of sample solution>
In Example 2, equine plasma and 2 pM, 20 pM, or 200 pM PCR product solution prepared in Example 1 or the Tris buffer were added in equal amounts to a 1.5 ml tube so that the PCR product concentration was 0. Two 100 μl sample solutions of 1, 10, and 100 pM were prepared respectively.
Of the sample solutions prepared in duplicate, 200 μl of a protein removing agent (product name: BindPro (registered trademark), manufactured by Biotech Support Group) was added and suspended. On one side, 200 μl of PBS (pH 7.2) was added and suspended. Thereafter, each sample solution was allowed to stand for 10 minutes, and then centrifuged at 16,000 × g for 5 minutes, and the supernatant was collected.
実施例2においては、励起光として633nmのレーザ光を用い、検出光波長を、バンドパスフィルターを用いて660~710nmとした以外は、試験例1と同様にして、走査分子計数法により、上記の各上清中に存在する標的核酸分子Cと核酸プローブCからなる会合体の数を計数した。
計数結果を図10及び表5に示す。図10中、「除去なし」はタンパク質除去剤に代えてPBSを添加した試料溶液の結果(タンパク質除去処理無し)を示す。また、図10中、「除去あり」はタンパク質除去剤を添加した試料溶液の結果(タンパク質除去処理あり)を示す。
また、図10中、濃度は、各試料溶液中の標的核酸分子の濃度を示す。この結果、タンパク質除去処理を行わなかった試料溶液では、標的核酸分子の濃度に関わらず、いずれも顕著にピーク数が多かった。これに対して、タンパク質除去処理を行った試料溶液では、標的核酸分子の濃度が0pMの場合にはほとんどピークが検出されず、かつ、1~100pMにおいて、標的核酸分子の濃度に依存したピーク数の増加が確認された。これらの結果から、走査分子計数法による測定の前に、生体試料由来のタンパク質の除去処理を行うことにより、非特異的なシグナルが消失し、標的核酸分子を精度よく検出できることが明らかである。 <Counting by scanning molecule counting method>
In Example 2, a scanning molecule counting method was used in the same manner as in Test Example 1 except that 633 nm laser light was used as excitation light and the detection light wavelength was 660 to 710 nm using a bandpass filter. The number of aggregates composed of the target nucleic acid molecule C and the nucleic acid probe C present in each supernatant was counted.
The counting results are shown in FIG. In FIG. 10, “no removal” indicates the result of the sample solution to which PBS was added instead of the protein removal agent (no protein removal treatment). In FIG. 10, “with removal” indicates the result of the sample solution to which the protein removing agent is added (with protein removal treatment).
In FIG. 10, the concentration indicates the concentration of the target nucleic acid molecule in each sample solution. As a result, in the sample solutions that were not subjected to the protein removal treatment, the number of peaks was remarkably large regardless of the concentration of the target nucleic acid molecule. In contrast, in the sample solution subjected to the protein removal treatment, almost no peak is detected when the concentration of the target nucleic acid molecule is 0 pM, and the number of peaks depending on the concentration of the target nucleic acid molecule is 1 to 100 pM. Increase was confirmed. From these results, it is clear that a non-specific signal disappears and the target nucleic acid molecule can be detected with high accuracy by performing the removal treatment of the protein derived from the biological sample before the measurement by the scanning molecule counting method.

2 光源
3 シングルモードオプティカルファイバー
4 コリメータレンズ
5 ダイクロイックミラー
6、7、11 反射ミラー
8 対物レンズ
9 マイクロプレート
10 ウェル(試料溶液容器)
12 コンデンサーレンズ
13 ピンホール
14 バリアフィルター
15 マルチモードオプティカルファイバー
16 光検出器
17 ミラー偏向器
17a ステージ位置変更装置
18 コンピュータ 1 Optical analyzer (confocal microscope)
2 Light source 3 Single mode
DESCRIPTION OF
Claims (13)
- 解析対象の核酸分子と特異的にハイブリダイズする核酸プローブと、生体試料とを含む試料溶液を調製する工程と、
前記調製する工程において調製された試料溶液中の核酸分子と前記核酸プローブとを会合させる工程と、
前記会合させる工程の後、前記調製する工程において調製された試料溶液中の、前記核酸プローブを含む会合体の分子数を算出する工程と、
を有し、
前記算出する工程における前記試料溶液内の共焦点顕微鏡又は多光子顕微鏡の光学系の光検出領域の位置を移動する工程と、
前記試料溶液内において前記光学系の光検出領域の位置を移動させながら、前記光検出領域中の前記会合体から放出される蛍光を検出する工程と、
前記検出された光から、個々の会合体からの光信号を個別に検出して、会合体を個別に検出する工程と、
前記個別に検出された会合体の数を計数して前記光検出領域の位置の移動中に検出された前記粒子の数を計数する工程と、
により行い、
前記算出する工程の前に、前記試料溶液からタンパク質を除去する工程、又は前記調製する工程の前に、前記生体試料からタンパク質を除去する工程、を有する核酸分子の検出方法。 Preparing a sample solution including a nucleic acid probe that specifically hybridizes with a nucleic acid molecule to be analyzed, and a biological sample;
Associating the nucleic acid probe with the nucleic acid molecule in the sample solution prepared in the preparing step;
After the step of associating, calculating the number of molecules of the aggregate containing the nucleic acid probe in the sample solution prepared in the preparing step;
Have
Moving the position of the light detection region of the optical system of the confocal microscope or multiphoton microscope in the sample solution in the calculating step;
Detecting fluorescence emitted from the aggregate in the light detection region while moving the position of the light detection region of the optical system in the sample solution;
Detecting individually the optical signals from the individual aggregates from the detected light, and detecting the aggregates individually;
Counting the number of individually detected aggregates and counting the number of particles detected during movement of the position of the photodetection region;
Done by
A method for detecting a nucleic acid molecule, comprising a step of removing a protein from the sample solution before the calculating step, or a step of removing a protein from the biological sample before the preparing step. - 前記会合させる工程の後、前記算出する工程の前に、前記試料溶液からタンパク質を除去する工程を有する請求項1に記載の核酸分子の検出方法。 The method for detecting a nucleic acid molecule according to claim 1, further comprising a step of removing proteins from the sample solution after the step of associating and before the step of calculating.
- 前記試料溶液又は前記生体試料からのタンパク質の除去を、前記試料溶液又は前記生体試料中の核酸分子を、無機支持体に吸着させた後、吸着させた核酸を無機支持体から溶出させることにより行う請求項1又は2に記載の核酸分子の検出方法。 The protein is removed from the sample solution or the biological sample by adsorbing nucleic acid molecules in the sample solution or the biological sample to the inorganic support, and then eluting the adsorbed nucleic acid from the inorganic support. The method for detecting a nucleic acid molecule according to claim 1 or 2.
- 前記生体試料が、生体から採取された後、タンパク質分解酵素処理がなされている請求項1~3のいずれか一項に記載の核酸分子の検出方法。 The method for detecting a nucleic acid molecule according to any one of claims 1 to 3, wherein the biological sample is treated with a proteolytic enzyme after being collected from the living body.
- 前記核酸プローブが、蛍光物質により標識されている請求項1~4のいずれか一項に記載の核酸分子の検出方法。 The method for detecting a nucleic acid molecule according to any one of claims 1 to 4, wherein the nucleic acid probe is labeled with a fluorescent substance.
- 前記核酸プローブが、蛍光物質により標識されており、
前記調製する工程において、前記試料溶液中に、蛍光性2本鎖核酸結合物質がさらに含まれており、
前記核酸プローブを標識している蛍光物質と前記蛍光性2本鎖核酸結合物質とのいずれか一方が、蛍光エネルギー移動現象におけるエネルギー・ドナーと成る蛍光物質であり、他方が前記蛍光エネルギー移動現象におけるエネルギー・アクセプターと成る物質であり、前記算出する工程において、前記核酸プローブを含む会合体から放出される蛍光は、前記核酸プローブを標識している蛍光物質と前記蛍光性2本鎖核酸結合物質との間に起こった蛍光エネルギー移動現象により放出される蛍光である請求項1~4のいずれか一項に記載の核酸分子の検出方法。 The nucleic acid probe is labeled with a fluorescent substance;
In the preparing step, the sample solution further includes a fluorescent double-stranded nucleic acid binding substance,
One of the fluorescent substance labeling the nucleic acid probe and the fluorescent double-stranded nucleic acid binding substance is a fluorescent substance that serves as an energy donor in the fluorescence energy transfer phenomenon, and the other is in the fluorescence energy transfer phenomenon. The substance that is an energy acceptor, and in the step of calculating, the fluorescence emitted from the aggregate including the nucleic acid probe is a fluorescent substance that labels the nucleic acid probe and the fluorescent double-stranded nucleic acid binding substance. The method for detecting a nucleic acid molecule according to any one of claims 1 to 4, which is fluorescence emitted by a fluorescence energy transfer phenomenon occurring during - 前記核酸プローブは、単独で存在している状態では蛍光エネルギー移動が起こり、かつ他の1本鎖核酸分子と会合体を形成した状態では蛍光エネルギー移動が起こらないように、エネルギー・ドナーと成る蛍光物質とエネルギー・アクセプターと成る物質とが結合されており、
前記核酸プローブを含む会合体から放出される蛍光は、前記エネルギー・ドナーと成る蛍光物質から放出される蛍光である請求項1~4のいずれか一項に記載の核酸分子の検出方法。 The nucleic acid probe is a fluorescence that serves as an energy donor so that fluorescence energy transfer occurs when it is present alone, and does not occur when it is associated with other single-stranded nucleic acid molecules. The substance and the substance that becomes the energy acceptor are combined.
The method for detecting a nucleic acid molecule according to any one of claims 1 to 4, wherein the fluorescence emitted from the aggregate containing the nucleic acid probe is fluorescence emitted from a fluorescent substance serving as the energy donor. - 前記光検出領域の位置を移動する工程において、前記光検出領域の位置が所定の速度にて移動される請求項1~7のいずれか一項に記載の核酸分子の検出方法。 The method for detecting a nucleic acid molecule according to any one of claims 1 to 7, wherein in the step of moving the position of the light detection region, the position of the light detection region is moved at a predetermined speed.
- 前記光検出領域の位置を移動する工程において、前記光検出領域の位置が、前記会合体の拡散移動速度よりも速い速度にて移動される請求項1~8のいずれか一項に記載の核酸分子の検出方法。 The nucleic acid according to any one of claims 1 to 8, wherein in the step of moving the position of the photodetection region, the position of the photodetection region is moved at a speed faster than a diffusion movement speed of the aggregate. Molecular detection method.
- 前記検出された光から、個々の会合体からの光信号を個別に検出して、会合体を個別に検出する工程において、検出された時系列の光信号の形状に基づいて、1つの会合体が前記光検出領域に入ったことが検出される請求項1~9のいずれか一項に記載の核酸分子の検出方法。 In the step of individually detecting an optical signal from each aggregate from the detected light and detecting the aggregate individually, one aggregate is detected based on the shape of the detected time-series optical signal. The method for detecting a nucleic acid molecule according to any one of claims 1 to 9, wherein it is detected that has entered the light detection region.
- 前記試料溶液が、界面活性剤、ホルムアミド、ジメチルスルホキシド、及び尿素からなる群より選択される1種以上を含む請求項1~10のいずれか一項に記載の核酸分子の検出方法。 The method for detecting a nucleic acid molecule according to any one of claims 1 to 10, wherein the sample solution contains at least one selected from the group consisting of a surfactant, formamide, dimethyl sulfoxide, and urea.
- 前記会合させる工程を、
前記調製する工程において調製された試料溶液の温度を70℃以上にすることにより、前記試料溶液中の核酸分子を変性させた後、前記試料溶液の液温を0.05℃/秒以上の降温速度で低下させることにより、前記試料溶液中の核酸分子を会合させることにより行う請求項1~11のいずれか一項に記載の核酸分子の検出方法。 The step of associating,
After denaturing the nucleic acid molecules in the sample solution by setting the temperature of the sample solution prepared in the preparing step to 70 ° C. or higher, the temperature of the sample solution is lowered to 0.05 ° C./second or higher. The method for detecting a nucleic acid molecule according to any one of claims 1 to 11, wherein the nucleic acid molecule is associated with the nucleic acid molecule in the sample solution by decreasing at a rate. - 前記核酸プローブが、DNA、RNA、及び核酸類似物質からなる群より選択される2以上の分子が結合して構成されている請求項1~12のいずれか一項に記載の核酸分子の検出方法。 The method for detecting a nucleic acid molecule according to any one of claims 1 to 12, wherein the nucleic acid probe is constituted by binding two or more molecules selected from the group consisting of DNA, RNA, and nucleic acid-like substances. .
Priority Applications (4)
| Application Number | Priority Date | Filing Date | Title |
|---|---|---|---|
| JP2013511006A JP6013327B2 (en) | 2011-04-20 | 2012-04-17 | Method for detecting nucleic acid molecule in biological sample |
| EP12773621.3A EP2700934B1 (en) | 2011-04-20 | 2012-04-17 | Method for detecting a nucleic acid molecule in a biosample |
| CN201280030676.4A CN103608663B (en) | 2011-04-20 | 2012-04-17 | The detection method of the nucleic acid molecules in biological sample |
| US14/056,123 US20140093874A1 (en) | 2011-04-20 | 2013-10-17 | Method for detecting nucleic acid molecule in biosample |
Applications Claiming Priority (2)
| Application Number | Priority Date | Filing Date | Title |
|---|---|---|---|
| JP2011-094293 | 2011-04-20 | ||
| JP2011094293 | 2011-04-20 |
Related Child Applications (1)
| Application Number | Title | Priority Date | Filing Date |
|---|---|---|---|
| US14/056,123 Continuation US20140093874A1 (en) | 2011-04-20 | 2013-10-17 | Method for detecting nucleic acid molecule in biosample |
Publications (1)
| Publication Number | Publication Date |
|---|---|
| WO2012144485A1 true WO2012144485A1 (en) | 2012-10-26 |
Family
ID=47041591
Family Applications (1)
| Application Number | Title | Priority Date | Filing Date |
|---|---|---|---|
| PCT/JP2012/060334 WO2012144485A1 (en) | 2011-04-20 | 2012-04-17 | Method for detecting nucleic acid molecule in biosample |
Country Status (5)
| Country | Link |
|---|---|
| US (1) | US20140093874A1 (en) |
| EP (1) | EP2700934B1 (en) |
| JP (1) | JP6013327B2 (en) |
| CN (1) | CN103608663B (en) |
| WO (1) | WO2012144485A1 (en) |
Citations (19)
| Publication number | Priority date | Publication date | Assignee | Title |
|---|---|---|---|---|
| JPH04337446A (en) | 1991-05-15 | 1992-11-25 | Hitachi Ltd | Method and device for measuring fine grain and constant quantity method |
| JP2965131B2 (en) | 1995-07-07 | 1999-10-18 | 東洋紡績株式会社 | Magnetic carrier for nucleic acid binding and nucleic acid isolation method using the same |
| JP3575633B2 (en) | 1994-12-27 | 2004-10-13 | 株式会社島津製作所 | Nucleic acid synthesis method |
| JP2004532649A (en) * | 2001-06-25 | 2004-10-28 | ジョージア テック リサーチ コーポレイション | Double resonance energy transfer nucleic acid probe |
| JP2005098876A (en) | 2003-09-25 | 2005-04-14 | Institute Of Physical & Chemical Research | Analytical method of analyzing interaction between two components |
| JP2006187221A (en) | 2005-01-04 | 2006-07-20 | Toyobo Gene Analysis:Kk | Pretreatment method of whole blood sample and method for amplifying nucleic acid |
| JP2007006890A (en) * | 2005-06-30 | 2007-01-18 | F Hoffmann La Roche Ag | Light emission modifiers and teir uses in nucleic acid detection, amplification, and analysis |
| JP2007020565A (en) | 2005-06-13 | 2007-02-01 | Kansai Bunri Sogo Gakuen | Method and system for detecting virus in specimen |
| JP4023523B2 (en) | 1996-10-12 | 2007-12-19 | オリンパス株式会社 | How to analyze samples by determining specific brightness function |
| JP2008116440A (en) | 2006-10-13 | 2008-05-22 | Shiga Pref Gov | Method and system for detecting fluorescent substance in sample |
| WO2008080417A1 (en) | 2006-12-28 | 2008-07-10 | Flult Biosystems Gmbh | A method of determining characteristic properties of a sample containing particles |
| JP2008292371A (en) | 2007-05-25 | 2008-12-04 | Institute Of Physical & Chemical Research | Method for analyzing interaction by a plurality of components by fluorescence correlated spectroscopy and method for screening compound for controlling interaction |
| JP2010044714A (en) | 2008-08-18 | 2010-02-25 | Hataguchi Masahiro | Business management system and business management method |
| JP2010190730A (en) * | 2009-02-18 | 2010-09-02 | Olympus Corp | Method of correlation spectroscopic analysis and device for correlation spectroscopic analysis |
| JP2011002415A (en) * | 2009-06-22 | 2011-01-06 | Olympus Corp | Fluorescence correlation spectroscopic device |
| JP2011036150A (en) * | 2009-08-07 | 2011-02-24 | Olympus Corp | Method for quantifying target nucleic acid molecule and kit for quantifying target nucleic acid molecule |
| JP2011508219A (en) * | 2007-12-19 | 2011-03-10 | シンギュレックス・インコーポレイテッド | Single molecule scanning analyzer and method of use thereof |
| WO2011108369A1 (en) * | 2010-03-01 | 2011-09-09 | オリンパス株式会社 | Optical analysis device, optical analysis method, and computer program for optical analysis |
| WO2012014778A1 (en) * | 2010-07-26 | 2012-02-02 | オリンパス株式会社 | Method for detecting dilute particles in solution using luminescent probe |
Family Cites Families (15)
| Publication number | Priority date | Publication date | Assignee | Title |
|---|---|---|---|---|
| US6214565B1 (en) * | 1998-10-09 | 2001-04-10 | The Regents Of The University Of California | Assay for disease related conformation of a protein and isolating same |
| US6782297B2 (en) * | 2001-05-24 | 2004-08-24 | Eric Paul Tabor | Methods and apparatus for data smoothing |
| JPWO2003006650A1 (en) * | 2001-07-09 | 2004-11-04 | 旭化成株式会社 | Nucleic acid purification method and detection method using nonwoven fabric |
| US20030092090A1 (en) * | 2001-11-14 | 2003-05-15 | Kiamars Hajizadeh | Rapid prion-detection device, system, and test kit |
| US20050287616A1 (en) * | 2004-06-29 | 2005-12-29 | Gross Adam F | Method of assaying denaturation of proteins |
| US20070099227A1 (en) * | 2004-10-12 | 2007-05-03 | Curry Bo U | Significance analysis using data smoothing with shaped response functions |
| CN101147055A (en) * | 2005-01-31 | 2008-03-19 | 伊利诺伊大学评议会 | Methods and devices for characterizing particles in clear and turbid media |
| WO2007010803A1 (en) * | 2005-07-15 | 2007-01-25 | Olympus Corporation | Light measuring instrument |
| EP2116614A1 (en) * | 2008-05-06 | 2009-11-11 | Qiagen GmbH | Simultaneous detection of multiple nucleic acid sequences in a reaction |
| CN102076870A (en) * | 2008-06-25 | 2011-05-25 | 实时基因组有限公司 | Method and apparatus for melting curve analysis of nucleic acids in microarray format |
| EP2784508B1 (en) * | 2008-12-25 | 2017-06-14 | Universal Bio Research Co., Ltd. | Automated nucleic acid assay system |
| KR101083420B1 (en) * | 2008-12-30 | 2011-11-14 | 한국과학기술연구원 | Autoantibody against Vinculin for breast cancer diagnosis and diagnosis kit using the same |
| CN101865843B (en) * | 2010-05-04 | 2012-05-23 | 中国科学院深圳先进技术研究院 | Detection method of multicomponent biological marker |
| WO2012102326A1 (en) * | 2011-01-26 | 2012-08-02 | オリンパス株式会社 | Method for identifying polymorphism of nucleic acid molecule |
| JP5856984B2 (en) * | 2011-01-26 | 2016-02-10 | オリンパス株式会社 | Nucleic acid molecule polymorphism identification method |
-
2012
- 2012-04-17 EP EP12773621.3A patent/EP2700934B1/en not_active Not-in-force
- 2012-04-17 JP JP2013511006A patent/JP6013327B2/en active Active
- 2012-04-17 WO PCT/JP2012/060334 patent/WO2012144485A1/en active Application Filing
- 2012-04-17 CN CN201280030676.4A patent/CN103608663B/en not_active Expired - Fee Related
-
2013
- 2013-10-17 US US14/056,123 patent/US20140093874A1/en not_active Abandoned
Patent Citations (19)
| Publication number | Priority date | Publication date | Assignee | Title |
|---|---|---|---|---|
| JPH04337446A (en) | 1991-05-15 | 1992-11-25 | Hitachi Ltd | Method and device for measuring fine grain and constant quantity method |
| JP3575633B2 (en) | 1994-12-27 | 2004-10-13 | 株式会社島津製作所 | Nucleic acid synthesis method |
| JP2965131B2 (en) | 1995-07-07 | 1999-10-18 | 東洋紡績株式会社 | Magnetic carrier for nucleic acid binding and nucleic acid isolation method using the same |
| JP4023523B2 (en) | 1996-10-12 | 2007-12-19 | オリンパス株式会社 | How to analyze samples by determining specific brightness function |
| JP2004532649A (en) * | 2001-06-25 | 2004-10-28 | ジョージア テック リサーチ コーポレイション | Double resonance energy transfer nucleic acid probe |
| JP2005098876A (en) | 2003-09-25 | 2005-04-14 | Institute Of Physical & Chemical Research | Analytical method of analyzing interaction between two components |
| JP2006187221A (en) | 2005-01-04 | 2006-07-20 | Toyobo Gene Analysis:Kk | Pretreatment method of whole blood sample and method for amplifying nucleic acid |
| JP2007020565A (en) | 2005-06-13 | 2007-02-01 | Kansai Bunri Sogo Gakuen | Method and system for detecting virus in specimen |
| JP2007006890A (en) * | 2005-06-30 | 2007-01-18 | F Hoffmann La Roche Ag | Light emission modifiers and teir uses in nucleic acid detection, amplification, and analysis |
| JP2008116440A (en) | 2006-10-13 | 2008-05-22 | Shiga Pref Gov | Method and system for detecting fluorescent substance in sample |
| WO2008080417A1 (en) | 2006-12-28 | 2008-07-10 | Flult Biosystems Gmbh | A method of determining characteristic properties of a sample containing particles |
| JP2008292371A (en) | 2007-05-25 | 2008-12-04 | Institute Of Physical & Chemical Research | Method for analyzing interaction by a plurality of components by fluorescence correlated spectroscopy and method for screening compound for controlling interaction |
| JP2011508219A (en) * | 2007-12-19 | 2011-03-10 | シンギュレックス・インコーポレイテッド | Single molecule scanning analyzer and method of use thereof |
| JP2010044714A (en) | 2008-08-18 | 2010-02-25 | Hataguchi Masahiro | Business management system and business management method |
| JP2010190730A (en) * | 2009-02-18 | 2010-09-02 | Olympus Corp | Method of correlation spectroscopic analysis and device for correlation spectroscopic analysis |
| JP2011002415A (en) * | 2009-06-22 | 2011-01-06 | Olympus Corp | Fluorescence correlation spectroscopic device |
| JP2011036150A (en) * | 2009-08-07 | 2011-02-24 | Olympus Corp | Method for quantifying target nucleic acid molecule and kit for quantifying target nucleic acid molecule |
| WO2011108369A1 (en) * | 2010-03-01 | 2011-09-09 | オリンパス株式会社 | Optical analysis device, optical analysis method, and computer program for optical analysis |
| WO2012014778A1 (en) * | 2010-07-26 | 2012-02-02 | オリンパス株式会社 | Method for detecting dilute particles in solution using luminescent probe |
Non-Patent Citations (4)
| Title |
|---|
| MASATAKA KINJO, PROTEIN, NUCLEIC ACID, AND ENZYME, vol. 44, no. 9, 1999, pages 1431 - 1438 |
| MEYER-ALMS: "Fluorescence Correlation Spectroscopy", 2000, SPRINGER, pages: 204 - 224 |
| NORIKO KATO ET AL., GENE & MEDICINE, vol. 6, no. 2, 2002, pages 271 - 277 |
| See also references of EP2700934A4 * |
Also Published As
| Publication number | Publication date |
|---|---|
| CN103608663B (en) | 2016-01-13 |
| US20140093874A1 (en) | 2014-04-03 |
| JP6013327B2 (en) | 2016-10-25 |
| CN103608663A (en) | 2014-02-26 |
| EP2700934A1 (en) | 2014-02-26 |
| JPWO2012144485A1 (en) | 2014-07-28 |
| EP2700934B1 (en) | 2016-12-14 |
| EP2700934A4 (en) | 2014-11-05 |
Similar Documents
| Publication | Publication Date | Title |
|---|---|---|
| JP6013328B2 (en) | Target particle quantification method | |
| JP6010034B2 (en) | Target particle detection method | |
| JP6013332B2 (en) | Target particle counting method | |
| US9428796B2 (en) | Method for detecting a target particle | |
| EP2743682B1 (en) | Method for detecting target particles | |
| JP5856984B2 (en) | Nucleic acid molecule polymorphism identification method | |
| JP6010029B2 (en) | Method for detecting fluorescent particles | |
| JP6009944B2 (en) | Nucleic acid molecule polymorphism identification method | |
| JP6013339B2 (en) | Method for detecting target particles in a biological sample containing pancreatic juice | |
| JP6013327B2 (en) | Method for detecting nucleic acid molecule in biological sample | |
| JP2014048098A (en) | Noise reduction method in scan molecule counting method, and method for detecting target particle | |
| JP2014219295A (en) | Detection method for target particle | |
| JP2015000047A (en) | Method for measuring mutation rate of target nucleic acid |
Legal Events
| Date | Code | Title | Description |
|---|---|---|---|
| 121 | Ep: the epo has been informed by wipo that ep was designated in this application |
Ref document number: 12773621 Country of ref document: EP Kind code of ref document: A1 |
|
| ENP | Entry into the national phase |
Ref document number: 2013511006 Country of ref document: JP Kind code of ref document: A |
|
| NENP | Non-entry into the national phase |
Ref country code: DE |
|
| REEP | Request for entry into the european phase |
Ref document number: 2012773621 Country of ref document: EP |
|
| WWE | Wipo information: entry into national phase |
Ref document number: 2012773621 Country of ref document: EP |