WO2012121368A1 - 医用画像診断装置、医用画像表示装置、医用画像処理装置、及び医用画像処理プログラム - Google Patents
医用画像診断装置、医用画像表示装置、医用画像処理装置、及び医用画像処理プログラム Download PDFInfo
- Publication number
- WO2012121368A1 WO2012121368A1 PCT/JP2012/056109 JP2012056109W WO2012121368A1 WO 2012121368 A1 WO2012121368 A1 WO 2012121368A1 JP 2012056109 W JP2012056109 W JP 2012056109W WO 2012121368 A1 WO2012121368 A1 WO 2012121368A1
- Authority
- WO
- WIPO (PCT)
- Prior art keywords
- wall
- image
- raised portion
- medical image
- color
- Prior art date
Links
Images


Classifications
-
- G—PHYSICS
- G06—COMPUTING; CALCULATING OR COUNTING
- G06T—IMAGE DATA PROCESSING OR GENERATION, IN GENERAL
- G06T7/00—Image analysis
- G06T7/0002—Inspection of images, e.g. flaw detection
- G06T7/0012—Biomedical image inspection
-
- A—HUMAN NECESSITIES
- A61—MEDICAL OR VETERINARY SCIENCE; HYGIENE
- A61B—DIAGNOSIS; SURGERY; IDENTIFICATION
- A61B5/00—Measuring for diagnostic purposes; Identification of persons
- A61B5/103—Detecting, measuring or recording devices for testing the shape, pattern, colour, size or movement of the body or parts thereof, for diagnostic purposes
- A61B5/107—Measuring physical dimensions, e.g. size of the entire body or parts thereof
- A61B5/1077—Measuring of profiles
-
- A—HUMAN NECESSITIES
- A61—MEDICAL OR VETERINARY SCIENCE; HYGIENE
- A61B—DIAGNOSIS; SURGERY; IDENTIFICATION
- A61B5/00—Measuring for diagnostic purposes; Identification of persons
- A61B5/74—Details of notification to user or communication with user or patient ; user input means
- A61B5/742—Details of notification to user or communication with user or patient ; user input means using visual displays
- A61B5/7425—Displaying combinations of multiple images regardless of image source, e.g. displaying a reference anatomical image with a live image
-
- A—HUMAN NECESSITIES
- A61—MEDICAL OR VETERINARY SCIENCE; HYGIENE
- A61B—DIAGNOSIS; SURGERY; IDENTIFICATION
- A61B6/00—Apparatus for radiation diagnosis, e.g. combined with radiation therapy equipment
- A61B6/52—Devices using data or image processing specially adapted for radiation diagnosis
- A61B6/5211—Devices using data or image processing specially adapted for radiation diagnosis involving processing of medical diagnostic data
-
- A—HUMAN NECESSITIES
- A61—MEDICAL OR VETERINARY SCIENCE; HYGIENE
- A61B—DIAGNOSIS; SURGERY; IDENTIFICATION
- A61B8/00—Diagnosis using ultrasonic, sonic or infrasonic waves
- A61B8/52—Devices using data or image processing specially adapted for diagnosis using ultrasonic, sonic or infrasonic waves
- A61B8/5215—Devices using data or image processing specially adapted for diagnosis using ultrasonic, sonic or infrasonic waves involving processing of medical diagnostic data
-
- G—PHYSICS
- G06—COMPUTING; CALCULATING OR COUNTING
- G06T—IMAGE DATA PROCESSING OR GENERATION, IN GENERAL
- G06T7/00—Image analysis
- G06T7/60—Analysis of geometric attributes
- G06T7/64—Analysis of geometric attributes of convexity or concavity
-
- G—PHYSICS
- G16—INFORMATION AND COMMUNICATION TECHNOLOGY [ICT] SPECIALLY ADAPTED FOR SPECIFIC APPLICATION FIELDS
- G16H—HEALTHCARE INFORMATICS, i.e. INFORMATION AND COMMUNICATION TECHNOLOGY [ICT] SPECIALLY ADAPTED FOR THE HANDLING OR PROCESSING OF MEDICAL OR HEALTHCARE DATA
- G16H50/00—ICT specially adapted for medical diagnosis, medical simulation or medical data mining; ICT specially adapted for detecting, monitoring or modelling epidemics or pandemics
- G16H50/20—ICT specially adapted for medical diagnosis, medical simulation or medical data mining; ICT specially adapted for detecting, monitoring or modelling epidemics or pandemics for computer-aided diagnosis, e.g. based on medical expert systems
-
- A—HUMAN NECESSITIES
- A61—MEDICAL OR VETERINARY SCIENCE; HYGIENE
- A61B—DIAGNOSIS; SURGERY; IDENTIFICATION
- A61B6/00—Apparatus for radiation diagnosis, e.g. combined with radiation therapy equipment
- A61B6/50—Clinical applications
- A61B6/504—Clinical applications involving diagnosis of blood vessels, e.g. by angiography
-
- A—HUMAN NECESSITIES
- A61—MEDICAL OR VETERINARY SCIENCE; HYGIENE
- A61B—DIAGNOSIS; SURGERY; IDENTIFICATION
- A61B6/00—Apparatus for radiation diagnosis, e.g. combined with radiation therapy equipment
- A61B6/52—Devices using data or image processing specially adapted for radiation diagnosis
- A61B6/5211—Devices using data or image processing specially adapted for radiation diagnosis involving processing of medical diagnostic data
- A61B6/5217—Devices using data or image processing specially adapted for radiation diagnosis involving processing of medical diagnostic data extracting a diagnostic or physiological parameter from medical diagnostic data
-
- A—HUMAN NECESSITIES
- A61—MEDICAL OR VETERINARY SCIENCE; HYGIENE
- A61B—DIAGNOSIS; SURGERY; IDENTIFICATION
- A61B6/00—Apparatus for radiation diagnosis, e.g. combined with radiation therapy equipment
- A61B6/52—Devices using data or image processing specially adapted for radiation diagnosis
- A61B6/5211—Devices using data or image processing specially adapted for radiation diagnosis involving processing of medical diagnostic data
- A61B6/5223—Devices using data or image processing specially adapted for radiation diagnosis involving processing of medical diagnostic data generating planar views from image data, e.g. extracting a coronal view from a 3D image
-
- A—HUMAN NECESSITIES
- A61—MEDICAL OR VETERINARY SCIENCE; HYGIENE
- A61B—DIAGNOSIS; SURGERY; IDENTIFICATION
- A61B8/00—Diagnosis using ultrasonic, sonic or infrasonic waves
- A61B8/08—Detecting organic movements or changes, e.g. tumours, cysts, swellings
- A61B8/0891—Detecting organic movements or changes, e.g. tumours, cysts, swellings for diagnosis of blood vessels
-
- A—HUMAN NECESSITIES
- A61—MEDICAL OR VETERINARY SCIENCE; HYGIENE
- A61B—DIAGNOSIS; SURGERY; IDENTIFICATION
- A61B8/00—Diagnosis using ultrasonic, sonic or infrasonic waves
- A61B8/52—Devices using data or image processing specially adapted for diagnosis using ultrasonic, sonic or infrasonic waves
- A61B8/5215—Devices using data or image processing specially adapted for diagnosis using ultrasonic, sonic or infrasonic waves involving processing of medical diagnostic data
- A61B8/5223—Devices using data or image processing specially adapted for diagnosis using ultrasonic, sonic or infrasonic waves involving processing of medical diagnostic data for extracting a diagnostic or physiological parameter from medical diagnostic data
-
- G—PHYSICS
- G06—COMPUTING; CALCULATING OR COUNTING
- G06T—IMAGE DATA PROCESSING OR GENERATION, IN GENERAL
- G06T2207/00—Indexing scheme for image analysis or image enhancement
- G06T2207/30—Subject of image; Context of image processing
- G06T2207/30004—Biomedical image processing
- G06T2207/30101—Blood vessel; Artery; Vein; Vascular
-
- G—PHYSICS
- G06—COMPUTING; CALCULATING OR COUNTING
- G06T—IMAGE DATA PROCESSING OR GENERATION, IN GENERAL
- G06T2207/00—Indexing scheme for image analysis or image enhancement
- G06T2207/30—Subject of image; Context of image processing
- G06T2207/30172—Centreline of tubular or elongated structure
-
- G—PHYSICS
- G06—COMPUTING; CALCULATING OR COUNTING
- G06T—IMAGE DATA PROCESSING OR GENERATION, IN GENERAL
- G06T2210/00—Indexing scheme for image generation or computer graphics
- G06T2210/41—Medical
Definitions
- Embodiments described herein relate generally to a medical image diagnostic apparatus, a medical image display apparatus, a medical image processing apparatus, and a medical image processing program that acquire three-dimensional medical image data of a living tissue by imaging the living tissue.
- Patent Document 1 There is an application for processing a medical image for displaying a wall surface of a living tissue based on three-dimensional medical image data (for example, Patent Document 1). By using this application, for example, it is possible to observe unevenness of the inner wall of a living tissue having a tubular form.
- a fly-through image that allows observation of the wall surface shape inside the tube while moving along the core line set in the tube of biological tissue
- a tomographic image in which the tubular tissue is cross-sectioned along a predetermined cross-section
- a developed image phye review that allows the inner wall of the tubular tissue to be overlooked by setting the boundary of the specific tissue represented in the tomographic image, and developing the specific tissue along the boundary, for example, There is a fish eye view or the like that can observe the wall shape in the tube at a wide angle of 170 degrees.
- a plaque formed on the inner wall of a coronary artery may be bulged inward so as to narrow the lumen of the blood vessel, or may be bulged outward so as to increase the diameter of the blood vessel.
- Negative remodeling that protrudes inward may be referred to as a first protrusion.
- positive remodeling that protrudes outward may be referred to as a second protrusion.
- the modeling in which each bulges inward and outward may be referred to as a third bulge.
- the inside of the blood vessel is observed using the above-described application, it is possible to find the first raised portion that appears convex to the inner wall of the blood vessel, but the second that does not appear convex to the inner wall of the blood vessel.
- the raised portion has a problem that it is overlooked only by observation within the blood vessel.
- the second protuberance is often a soft plaque and often causes an acute disease, so early detection and early treatment of the disease are necessary. Moreover, since it often occurs at an early stage when plaques begin to form, early detection and early treatment of a disease can be realized by reliably finding out.
- This embodiment solves the above-described problem, and when displaying the inner wall of a living tissue, the medical image diagnostic apparatus, the medical image display apparatus, and the medical device capable of simultaneously displaying the raised portion where the outer wall is raised.
- An object is to provide an image processing apparatus and a medical image processing program.
- the medical image diagnostic apparatus includes an image acquisition unit, an inner wall extraction unit, an outer wall extraction unit, a first bulge calculation unit, a second bulge calculation unit, and a display control unit.
- the image acquisition means acquires the three-dimensional medical image data of the living tissue by photographing the living tissue having the inner wall and the outer wall.
- the inner wall extracting means extracts the inner wall of the living tissue based on the medical image data.
- the outer wall extracting means extracts the outer wall of the living tissue based on the medical image data.
- the first protruding portion calculating means obtains information including the presence of the first protruding portion where the inner wall of the living tissue protrudes inward.
- the second protruding portion calculating means Based on the extracted outer wall of the living tissue, the second protruding portion calculating means obtains information including the presence of the second protruding portion where the outer wall of the living tissue protrudes outward.
- the display control means superimposes the information on the first raised portion obtained by the first raised portion calculating means and the information on the second raised portion obtained by the second raised portion calculating means on the image of the living tissue. Display on the display means.
- FIG. 4 is a cross-sectional view taken along the line VI-VI in FIG. 3 for explaining a first color created by color-coding each stage. It is a top view of the 1st protruding part displayed on a development picture of a tubular part in piles.
- FIG. 5 is a cross-sectional view taken along line VIII-VIII in FIG. 4 for explaining a second color created by color-coding each stage. It is a top view of the 2nd protruding part displayed on a development picture of a tubular part in piles.
- FIG. 6 is a cross-sectional view taken along the line XX of FIG. 5 for explaining a third color to be created. It is a top view which shows the range of the 1st protruding part displayed on the expansion image of a tubular part, and the 2nd protruding part. It is a flowchart which shows operation
- FIG. 15 It is a figure which shows an example of the display mode when displaying the 1st protruding part and the 2nd protruding part simultaneously in the medical image diagnostic apparatus which concerns on 2nd Embodiment. It is a figure which shows the other example of a display mode when displaying a 1st protruding part and a 2nd protruding part simultaneously. It is a figure which shows an example of the display mode when a cross-sectional image is displayed with a expansion
- FIG. 5 It is a figure which shows an example of the display mode when a cross-sectional image is displayed with the expansion
- the medical image diagnostic apparatus it is a diagram illustrating an example of a display mode when a cross-sectional image is displayed together with a developed image, an MPR image, and a view image.
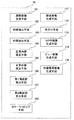
- FIG. 1 is a block diagram showing a configuration of a medical image diagnostic apparatus. As shown in FIG. 1, the imaging unit 11 is connected to a medical image display device via a communication unit 12.
- the imaging unit 11 is called a modality, and is a device that inspects a subject and generates three-dimensional medical image data (digital data).
- a modality any conventionally used apparatus such as an X-ray CT (Computer Tomography) apparatus, an MRI (Magnetic Resonance Imaging) apparatus, an ultrasonic diagnostic apparatus, or the like is applied.
- the X-ray CT apparatus reconstructs an internal image (tomographic image or three-dimensional image) of a subject by scanning the subject with radiation, detecting radiation transmitted through the subject, and performing computer processing.
- the MRI apparatus reconstructs an internal image of a subject using a nuclear magnetic resonance phenomenon.
- An ultrasonic diagnostic apparatus irradiates a subject with ultrasonic waves, analyzes the echo state, and images the inside of the body.
- the communication means 12 performs data communication via a LAN (Local area network).
- the communication unit 12 includes a communication device such as a LAN card.
- the medical image display apparatus includes a control unit 13, a storage unit 14, a data conversion unit 15, an image generation unit 16, an image synthesis unit 17, an operation unit 18, a display control unit 21, and a display unit 22.
- the image processing apparatus includes, for example, the control unit 13, the storage unit 14, the data conversion unit 15, the image generation unit 16, the image synthesis unit 17, and the operation unit 18.
- the storage unit 14 stores various types of information.
- the storage unit 14 stores medical image data and incidental information received by the communication unit 12 from a server (not shown).
- the control unit 13 executes processing for storing information in the storage unit 14 and processing for reading out information stored in the storage unit 14.
- the storage unit 14 includes a writable storage device such as a hard disk drive.
- Data conversion means 15 converts medical image data into monochrome image data.
- the monochrome image data is gradation image data expressed by luminance values in a predetermined gradation range (for example, 0 to 255).
- the operating means 18 is used by the operator to operate the display means 22 and input various information.
- the operation means 18 includes an arbitrary operation device or input device such as a mouse, a keyboard, a joystick, a trackball, and a dedicated control panel.
- FIG. 2 is a block diagram showing the configuration of the image generation means 16.
- the image generating means 16 includes a developed image generating means 161, an inner wall extracting means 162, an outer wall extracting means 163, a normal inner wall estimating means 164, a normal outer wall estimating means 165, a first raised portion calculating means 166, a first 2 ridge calculating means 167 and color mapping means 168.
- the image generation means 16 generates a desired image based on the image data of the subject imaged by the above modality.
- the image generation means 16 that generates a developed image of a living tissue and an image of a lesioned part on the developed image based on three-dimensional medical image data captured by an X-ray CT apparatus will be described.
- a tubular part in which a tissue is formed in a tubular shape such as a coronary artery will be described as an example of a biological tissue.
- the CT value acquired for each contrast medium flowing in the tubular part, the tubular part (including the lesioned part), and the chest cavity is different (projection data).
- the image generation means 16 generates image data of the living tissue based on this CT value. Thereby, it becomes possible to extract a living tissue from the generated image data.
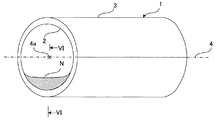
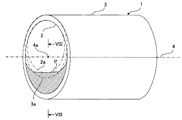
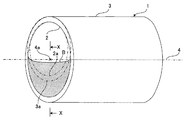
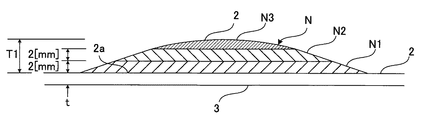
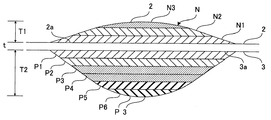
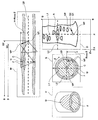
- FIGS. 3 to 5 are partial perspective views of the tubular portion 1 in which a lesion is generated.
- the tubular part 1 has a lesion part where plaque is deposited locally.
- a lesion part where the inner wall 2 of the tubular part 1 is raised inward is referred to as a first raised part N.
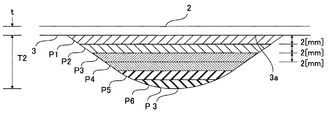
- the lesioned part in which the outer wall 3 of the tubular part 1 is raised outward is referred to as a second raised part P.
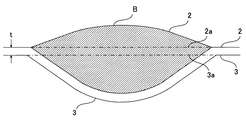
- a lesion having both the first raised portion N and the second raised portion P is referred to as a third raised portion B.
- the developed image generation means 161 sets a boundary for the tomographic image along the predetermined cross section of the tubular part 1, sets a viewpoint at a predetermined position for the tomographic image data along the predetermined cross section of the tubular part 1, and the viewpoint A volume rendering is performed on the volume data along the line-of-sight direction from to the boundary, thereby generating a developed image in which the tubular portion 1 is developed along the boundary.
- the control unit 13 stores the generated developed image in the storage unit 14.
- the inner wall extraction means 162 extracts the inner wall 2 of the tubular part 1 based on the medical image data (the vicinity image of the tubular part 1, the starting point of the tubular part 1, and the core wire 4 of the tubular part 1).
- the inner wall of the lesioned part corresponds to the “inner wall of the living tissue” at the site where the lesioned part occurs.
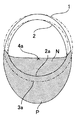
- the core wire 4 corresponds to a line passing through the center 4a of each transverse section of the tubular portion 1 (see FIGS. 3 to 5).
- control means 13 receives the designation by the operation means 18 and extracts the neighborhood image of the tubular portion 1 displayed on the display means 22 and stores the extracted neighborhood image of the tubular portion 1 in the storage means 14 (tubular) (Neighboring image extraction of part 1).
- control means 13 receives an operation by the operation means 18 and causes the display means 22 to display the vicinity image of the tubular portion 1, designates the displayed start point of the tubular portion 1, and stores the designated start point as the storage means 14. (Starting point detection of the tubular portion 1).
- a predetermined application for obtaining the starting point based on the extracted tubular portion 1 may be used.
- the image generation means 16 executes a predetermined application and extracts the core wire 4 of the tubular portion 1.
- the control means 13 stores the extracted core wire 4 of the tubular portion 1 in the storage means 14 (extraction of the core wire 4 of the tubular portion 1).
- an image of the tubular portion 1 that is a diagnosis target is extracted.
- the above-described extraction of the vicinity of the tubular portion 1 to the extraction of the core wire 4 of the tubular portion 1 are performed for each diagnosis target when there are two diagnosis targets such as the left coronary artery and the right coronary artery.
- the inner wall extraction means 162 extracts the boundary of the inner wall 2 of the tubular part 1 by alternately applying a smoothing filter and a sharpening filter, for example, based on the image of the tubular part 1. In addition, since it is an actual wall, stenosis etc. are also included.
- the control means 13 causes the storage means 14 to store the extracted inner wall 2 of the tubular portion 1 (including the inner wall of the first raised portion N) as information on the first raised portion N.
- the outer wall extracting means 163 alternately applies a smoothing filter and a sharpening filter on the basis of the vicinity image of the tubular part 1 and the inner wall 2 of the tubular part 1 extracted by the inner wall extracting means 162.
- the outer wall 3 is extracted.
- the control unit 13 causes the storage unit 14 to store the extracted outer wall 3 (including the second raised portion P) 3 of the tubular portion 1 as information on the second raised portion P.
- the normal inner wall estimating means 164 estimates the normal inner wall 2a that is the shape of the inner wall 2 before the bulge shown by the imaginary line in FIGS. .
- the normal inner wall estimation means 164 interpolates the surroundings of the first bulge portion N (region before the bulge) with a smooth surface in the first bulge portion N that is convex inward of the tubular portion 1.
- the normal inner wall 2a is estimated.
- the normal inner wall estimation means 164 may estimate an arc-shaped region that is spaced apart from the core wire 4 by a predetermined length as the normal inner wall 2a.
- the control means 13 stores the estimated normal inner wall 2a in the storage means 14.
- the normal outer wall estimating means 165 estimates the normal outer wall 3a that is the shape of the outer wall 3 before the bulging indicated by the imaginary line in FIGS. .
- the normal outer wall estimation means 165 is configured to surround the second bulge portion P (region before the bulge) in the second bulge portion P that is convex outward of the tubular portion 1. )
- the normal outer wall 3a is estimated by interpolating each other with a smooth surface.
- the normal outer wall estimation means 165 may estimate an arc-shaped region separated from the core wire 4 by a predetermined length in the outward direction as the normal outer wall 3a.
- the control means 13 stores the estimated normal outer wall 3a in the storage means 14.
- the first bulge calculation means 166 has a height at which the first bulge N bulges from the normal inner wall 2a based on the inner wall and the normal inner wall 2a of the first bulge N read from the storage means 14.
- the thickness T1 is obtained.
- the control means 13 stores the obtained first thickness T1 in the storage means 14 as information on the first raised portion N.
- the information (T1> 0) is information indicating that the first raised portion N exists.
- the second raised portion calculating means 167 Based on the inner wall and normal outer wall 3a of the second raised portion P read from the storage means 14, the second raised portion calculating means 167 has a height at which the second raised portion P rises from the normal outer wall 3a.
- the thickness T2 is obtained.
- the control unit 13 stores the obtained second thickness T2 in the storage unit 14 as information on the second raised portion P.
- the information (T2> 0) is information indicating that the second raised portion P exists.
- the color mapping means 168 creates a first color for the first thickness T1 and a second color for the second thickness T2.
- the color mapping unit 168 has a table (color map) that defines the correspondence between the color numbers (0 to 15) and the actual colors. For example, the color mapping unit 168 assigns a color number to the first color (for example, blue). 1 is assigned, and color number 2 is assigned to the second color (for example, red). For example, the color mapping unit 168 assigns color number 1 to the first color (for example, blue) and assigns color number 2 to the second color (for example, red).
- the control unit 13 stores the assigned color number in the storage unit 14 in association with the picture element (pixel) representing the region of the tubular portion 1.
- the color mapping means 168 creates the first color by dividing the thickness direction of the first thickness T1 stepwise, for example, every 2 [mm], and color-coding the regions of each step.
- FIG. 6 is a cross-sectional view taken along the line VI-VI in FIG. 3, and is a diagram for explaining a first color created by color-coding each stage.
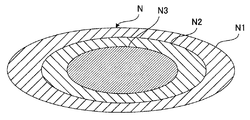
- the color mapping means 168 has colors (N1 to N1) such that the saturation of the first color (blue) is increased in the thickness direction with respect to the regions of the first ridges N. Assign a color number of N3).
- the control unit 13 stores the assigned color number in the storage unit 14 in association with the pixel representing the region of each stage of the first raised portion N.
- the image synthesizing unit 17 creates an image obtained by synthesizing the developed image of the tubular portion 1 read from the storage unit 14 and the information of the first raised portion N read from the storage unit 14.
- the control unit 13 stores the synthesized image in the storage unit 14.
- the display control unit 21 causes the display unit 22 to display the synthesized image.
- FIG. 7 is a plan view of the first raised portion N displayed so as to be superimposed on the developed image of the tubular portion 1. As shown in FIG. 7, the first raised portion N displayed on the display means 22 is colored with the first colors (N1 to N3) with different saturations.
- the color mapping means 168 creates the first color by dividing the thickness direction of the first thickness T1 stepwise, for example, every 2 [mm], and color-coding the regions of each step. It is possible to represent the height of the first raised portion N by coloring the first raised portion N with the first color that is changed stepwise. In addition, you may represent the height of the 1st protruding part N with a contour line.
- FIG. 8 is a cross-sectional view taken along the line VIII-VIII in FIG. 4, and is a view for explaining a second color created by color-coding each stage.
- the color mapping means 168 has a color (P1 ⁇ P) in which the saturation of the second color (red) is increased in the thickness direction for each stage region of the second raised portion P. Assign the color number of P6).
- the control unit 13 stores the assigned color number in the storage unit 14 in association with the pixels representing the regions of the respective stages of the second raised portion P.
- the image synthesizing unit 17 creates an image obtained by synthesizing the developed image of the tubular portion 1 read from the storage unit 14 and the information of the second raised portion P read from the storage unit 14.
- the control unit 13 stores the synthesized image in the storage unit 14.
- the display control unit 21 causes the display unit 22 to display the synthesized image.
- FIG. 9 is a plan view of the second raised portion P displayed superimposed on the developed image of the tubular portion 1.
- the second raised portion P displayed on the display means 22 is colored with the second color (P1 to P6) with the saturation being changed stepwise. Thereby, the height of the second raised portion P can be expressed.
- first bulge portion N is generally generated after the second bulge portion P is generated in the tubular portion 1, in practice, only the first bulge portion N is rarely displayed.
- the second raised portion P is often displayed together. If both the first raised portion N and the second raised portion P are displayed at the same time, they may be confused and difficult to see each other.
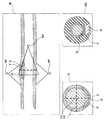
- FIG. 10 is a cross-sectional view taken along the line XX of FIG. 5 and is a diagram for explaining the third color to be created.
- the third raised portion B (the first raised portion N and the second raised portion P) is generated in the tubular portion 1.
- the color mapping means 168 has the third raised portion B generated. Judge that there is.
- the color mapping means 168 creates a third color for the region where the third raised portion B is generated.
- the color mapping means 168 assigns color number 3 to the third color (for example, purple).
- the control unit 13 stores the assigned color number in the storage unit 14 in association with the picture element (pixel) representing the region of the tubular portion 1.
- the image synthesizing unit 17 creates an image obtained by synthesizing the developed image of the tubular portion 1 read out from the storage unit 14 and the information on the third raised portion B read out from the storage unit 14.
- the control unit 13 stores the synthesized image in the storage unit 14.
- the display control unit 21 causes the display unit 22 to display the synthesized image.
- FIG. 11 is a plan view of the third raised portion B displayed so as to overlap the developed image of the tubular portion 1.
- the range of the 3rd protruding part B displayed on the display means 22 is colored with the 3rd color (purple).
- the color mapping means 168 may color the third raised portion B by increasing the saturation of the third color according to the thickness T3 of the third raised portion B.
- FIG. 12 is a flowchart showing the operation of the image processing apparatus.
- CT image acquisition step S1
- a server not shown
- Step S2 extraction of the vicinity image of the tubular portion: Step S2
- the control means 13 extracts the vicinity image of the tubular portion 1 displayed on the display means 22.
- Step S3 (Starting point detection of tubular portion: Step S3) Next, in response to an operation by the operation means 18, the start point of the extracted neighborhood image of the tubular portion 1 is designated.
- the image generation means 16 extracts the core wire 4 of the tubular portion 1.
- the coordinates (xg, yg) of the center 4a of the tubular portion 1 can be obtained from the following equation, for example.
- xg Sy / A
- yg Sx / A (3)
- Sx is the cross-sectional primary moment about the x-axis
- Sy is the cross-sectional primary moment about the y-axis
- A is the total cross-sectional area of the tubular part (including the lesioned part and the cavity) 1.
- the inner wall extraction means 162 extracts the inner wall 2 of the tubular part 1 based on the image of the tubular part 1.
- the inner wall 2 at this time also includes the inner wall of the first raised portion N that is raised inward of the tubular portion 1 because it is not an inner wall of the coronary artery but an actual wall.
- Step S6 External wall extraction of tubular portion: Step S6
- the outer wall extraction means 163 extracts the outer wall 3 of the tubular part 1 based on the image of the tubular part 1.
- the outer wall 3 at this time also includes the outer wall 3 that protrudes outward from the tubular portion 1 by the second protruding portion P.
- the normal inner wall estimation means 164 estimates the normal inner wall 2a which is the shape of the inner wall 2 before the bulging based on the inner wall 2 of the tubular portion 1 which is an actual wall.
- the normal outer wall estimation means 165 estimates the normal outer wall 3a which is the shape of the outer wall 3 before the bulging based on the outer wall 3 of the tubular portion 1.
- Step S8 Based on the inner wall 2 and the normal inner wall 2a of the first raised portion N, the first raised portion calculating means 166 obtains a first thickness T1 that is the height of the first raised portion N.
- the color mapping unit 168 creates a first color (for example, blue) for the first thickness T1. For example, the color mapping unit 168 assigns a color number of the first color to each pixel representing the region of the first raised portion N, and the control unit 13 stores the color number in the storage unit 14 in association with each pixel. .
- a first color for example, blue
- the control unit 13 stores the color number in the storage unit 14 in association with each pixel.
- Step S10 Based on the outer wall 3 and the normal outer wall 3a of the second raised portion P, the second raised portion calculating means 167 obtains a second thickness T2 that is the height of the second raised portion P.
- the color mapping means 168 creates a second color (for example, red) for the second thickness T2.
- the color mapping unit 168 assigns a color number of the second color to each pixel representing the region of the second raised portion P, and the control unit 13 stores the color number in the storage unit 14 in association with each pixel. .
- the developed image generating means 161 In parallel with the steps S1 to S11, the developed image generating means 161 generates a developed image in which the tubular portion 1 is developed based on the image data of the tubular portion 1.
- the image synthesizing unit 17 displays the information on the first raised portion N and the information on the second raised portion P on the developed image of the tubular portion 1.
- the information of the first raised portion N includes an image of the first raised portion N, information that the first raised portion N is present in the tubular portion 1, and the first thickness T1. And information indicating the degree of the thickness T1.
- the information of the second raised portion P includes an image of the second raised portion P, information that the second raised portion P exists in the tubular portion 1 (existence information), and the second thickness T2 and Information indicating the degree of the thickness T2 is included.
- image processing program is configured to cause the computer to execute the processing from step S1 to step S12 as an example.
- the third bulge portion B is shown to indicate that both the first bulge portion N and the second bulge portion P are generated.
- the range of the third ridge B is colored by increasing the saturation of the third color in accordance with the thickness T3 of the third ridge B.
- it is difficult to distinguish the first bulge portion N and the second bulge portion P it is difficult to determine the progress of each lesion in the first bulge portion N and the second bulge portion P.
- FIG. 13 is a diagram showing an example of a display mode when the first raised portion N and the second raised portion P are displayed simultaneously.
- a first ridge N indicated by a first color (for example, blue) in a tomographic image (image of the tubular portion 1) in which the wall of the tubular portion 1 is sectioned along the core line 4 and
- the second raised portion P indicated by the second color (for example, red) is displayed in an overlapping manner.
- the control means 13 specifying the position of the tubular part 1, receiving the specified position
- the image generating means 16 creates a tomographic image in which the tubular portion 1 has a cross section at that position.
- the image generation means 16 creates a tomographic image as an image of the tubular portion 1, creates a first raised portion N and a second raised portion P for the tomographic image, and creates a tomographic image and the first raised portion N and the second raised portion. Synthesize P.
- the display control unit 21 causes the display unit 22 to display the synthesized image. Note that the first color and the second color may have different chromatic colors step by step.
- control means 13 changes the cross section when creating the tomographic image
- the image generating means 16 receives the changed cross section
- the image generating means 16 receives the tomographic image of the tubular portion 1, the first raised part. N and the second raised portion P are created
- the display control means 21 causes the display means 22 to display the first raised portion N and the second raised portion P on the tomographic image. Accordingly, the progress of each lesion is observed from a different angle, and the progress of the lesion can be visually recognized more accurately.
- FIG. 14 is a diagram showing another example of the display mode when the first raised portion N and the second raised portion P are displayed simultaneously.
- the 2nd protruding part P shown by the 2nd color for example, red
- the first color and the second color may have different chromatic colors step by step.
- the first bulge portion N and the second bulge portion P are simultaneously displayed on the image of the tubular portion 1.
- the first bulge portion N and the second bulge portion are displayed. Since it is difficult to distinguish the part P, it is difficult to determine the progress of each lesion in the first raised part N and the second raised part P.
- the image composition means 17 superimposes both the composite image obtained by superimposing the image of the first raised portion N on the image of the tubular portion 1 and the composite image obtained by superimposing the image of the second raised portion P on the image of the tubular portion 1. Then, the display control unit 21 switches and displays both composite images on the display unit 22. Thereby, it becomes possible to make it easy to determine the progress of each lesion in the first raised portion N and the second raised portion P.
- the image generation means 16 is based on information (T1> 0) when the first bulge portion N exists and information (T2> 0) when the second ridge portion P exists.
- a first identification mark for identifying the presence of the first raised portion N and a second identification mark for identifying the presence of the second raised portion P are created, and the display control means 21 serves as the display means.
- the first identification mark and the second identification mark are superimposed and displayed on the image. Thereby, it becomes possible to distinguish the 1st protruding part N and the 2nd protruding part P.
- the display control means 21 includes information (for example, a numerical value) indicating the first thickness T1, information (for example, N1, N2, N3...) Indicating the degree of the first thickness T1, Information indicating the thickness T2 (for example, a numerical value) and information indicating the degree of the second thickness T2 (for example, P1, P2, P3,...) May be displayed in an overlapping manner.
- the first thickness T1 of the first raised portion N and the second thickness T2 of the second raised portion P are displayed in comparison, for example, 2 [mm] / 3 [mm], or the first thickness T1.
- the second thickness T2 are displayed in comparison with each other as N3 / P5, for example, so that it is easy to determine the progress of the lesion.
- the raised portion where the outer wall is raised is displayed on the image of the living tissue at the same time.
- region of the component was color-coded is shown.
- biological tissue images include any one of a cross-sectional image, a developed image, an MPR image, a view image, and an outer wall developed image, or a combination of these images. Details of the cross-sectional image, the developed image, the MPR image, the view image, and the outer wall developed image will be described later.
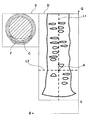
- FIG. 15 is a diagram illustrating an example of a display mode when a cross-sectional image is displayed together with a developed image.
- 3rd Embodiment mainly demonstrates the structure different from the said embodiment, The description is abbreviate
- the image generation unit 16 includes a cross-sectional image creation unit 171 and a color classification unit 172.
- the cross-sectional image creation means 171 creates an image when the biological tissue is cross-sectioned at a specified position (including a predetermined position) based on the three-dimensional medical image data.
- the three-dimensional medical image data may be referred to as three-dimensional data or volume data.
- the position of the cross section is determined by the three-dimensional coordinates designated based on the three-dimensional medical image data.
- the developed image generating means 161 generates a developed image in which the inner wall 2 of the tubular portion 1 is developed in a planar shape based on the three-dimensional medical image data (described above).
- An example of the developed image is based on the three-dimensional medical image data, the value of the projection processing performed along the radial direction from the central axis of the tubular portion 1, and the horizontal axis around the central axis as the horizontal axis.
- the image is distributed with the position on the central axis as the vertical axis.
- the position on the central axis is determined by three-dimensional coordinates specified based on three-dimensional medical image data.
- the color classification unit 172 classifies (discriminates) the components (for example, calcium and fat) of the biological tissue based on the luminance value in the cross-sectional image created by the cross-sectional image creation unit 171 and color-codes the region of the component for each classification. To do. For example, the calcium component region and the fat component region of the living tissue are displayed so as to be distinguishable by different colors of “white” and “yellow”.
- the display control means 21 displays the developed image together with the cross-sectional image in which the region of the component of the biological tissue is color-coded (see FIG. 15).
- the display control means 21 displays the position of the cross section on the developed image so that it can be designated by the operation of the operation means (input unit) 18.
- the position specified on the developed image (position on the central axis) and the position of the cross section are associated with each other by three-dimensional coordinates.
- the cross-sectional image generation unit 171 receives a position designated on the developed image, and creates a cross-sectional image when the generation information is made a cross-section at the position of the cross-section associated with the position.
- the display control means 21 displays a developed image, a position designated on the developed image, and a cross-sectional image when the biological information is taken as a cross-section at the position of the cross-section corresponding to the position (see FIG. 15).
- FIG. 15 shows the cross-sectional image as “S”, the developed image as “D”, the calcium component region as “C”, and the fat component region as “F”. Further, in FIG. 15, the designated position shown on the developed image is “A”, the central axis of the tubular portion 1 is “L0”, the line along the central axis L0 is “L1”, and passes through the position A. A line orthogonal to the line L1 is indicated by “L2”. The central axis L0 may be referred to as the core wire 4.
- FIG. 16 is a diagram illustrating an example of a display mode when the region of the component of the biological tissue on the developed image illustrated in FIG. 15 is color-coded.
- the color classification unit 172 color-codes the region of the biological tissue component on the cross-sectional image for each classification. In this modification, the color classification unit 172 further determines the region of the biological tissue component on the developed image. Color by category.
- the same component region has the same color as the color image on the cross-sectional image described above (for example, the calcium component region is “white” and the fat component region is the same). “yellow”).
- the cross-sectional image and the developed image it is possible to easily visually recognize the components (for example, lime component and / or lipid component) of the living tissue.
- FIG. 16 shows a developed image “D” that is color-coded similar to the cross-sectional image “S”.
- deployment image was shown as an image of the biological tissue which displays a cross-sectional image together.
- an MPR (Multi Planar Reconstruction) image is further displayed. Note that an MPR image may be displayed instead of the developed image.
- FIG. 17 is a diagram illustrating an example of a display mode when a cross-sectional image is displayed together with a developed image and an MPR image in the medical image diagnostic apparatus according to the fourth embodiment.
- the fourth embodiment will mainly describe the configuration different from the above-described embodiment, and the description of the same configuration as the above-described embodiment will be omitted.
- the image generation means 16 has an MPR image generation means 173.
- the MPR image generation unit 173 receives the designation of the position of the cross section by the operation of the operation unit (input unit) 18 and generates an MPR image representing a plurality of cross sections of the living tissue based on the three-dimensional medical image data. .
- the color classification means 172 further classifies (determines) the components of the living tissue on the MPR image based on the luminance value, and colors the component areas for each classification.
- the color coding on the MPR image is preferably the same as the color coding on the cross-sectional image and / or developed image described above (for example, the calcium component region is “white” and the fat component region is “yellow”). . Thereby, it becomes easy to compare the components of the living tissue between the MPR image and the cross-sectional image and / or the developed image, and the living tissue that has become the lime component or the lipid component can be easily visually recognized.
- FIG. 17 shows an MPR image “M” when the tubular portion 1 is sectioned along the central axis at the position “A” of the section. Further, in FIG. 17, the central axis of the tubular portion 1 shown on the MPR image is indicated by “L0”, the line along the central axis L0 is indicated by “L1”, and the line orthogonal to the line L1 is indicated by “L2”.
- the developed image and the MPR image are shown as the images of the living tissue on which the cross-sectional images are displayed together.
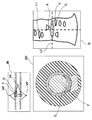
- a view image is displayed together with a developed image and an MPR image. Note that the view image may be displayed instead of the developed image and / or the MPR image.
- FIG. 18 is a diagram illustrating an example of a display mode when a cross-sectional image is displayed together with a developed image, an MPR image, and a view image in the medical image diagnostic apparatus according to the fifth embodiment.
- the fifth embodiment will mainly describe the configuration different from the above-described embodiment, and the description of the same configuration as the above-described embodiment will be omitted.
- the image generation means 16 has a view image generation means 174.
- the view image generation means 174 creates a view image showing the outside of the tubular part 1 when the tubular part 1 is viewed from the viewpoint based on the three-dimensional medical image data. Further, a view image showing the inside of the tubular portion 1 may be created with the viewpoint in the tubular portion 1.
- a known technique for example, Japanese Patent Laid-Open No. 2006-346177 is used for creating the view image.
- the publication discloses a means for setting a plurality of viewpoints in a predetermined mode (fly-through mode) based on the MPR image data, and renders the wall information volume data based on the set viewpoint information to obtain the fly-through image data. And means for generating. It is possible to create a view image using this fly-through image generation technique.
- the viewpoint and the visual field range can be specified by the user, and the control unit 13 stores the viewpoint and the visual field range in the storage unit 14 in response to the operation of the operation unit (input unit) 18 by the user.
- FIG. 18 shows the cross-sectional image as “S”, the developed image as “D”, the MPR image as “M”, the view image as “V”, the central axis of the tubular portion 1 as “L0”, and the viewpoint as “VP”.
- the uppermost position is the origin “0”
- the clockwise angle from the origin 0 is “ ⁇ ”
- the distance from the central axis L0 to the viewpoint VP is “R”.
- the vertical axis along the central axis L0 is the distance (P) from the origin 0
- the horizontal axis is the clockwise rotation angle ( ⁇ ) from the origin 0
- the viewpoint VP is moved ( The movement from “Q1” to “Q2” at the position on the line L1 is indicated by an arrow.
- the movement of the viewpoint VP (movement from “Q1” to “Q2” at the position on the central axis L0) is indicated by an arrow.
- the position of the viewpoint VP on the cross-sectional image S is represented by a rotation angle ⁇ around the central axis L0 and a distance R from the central axis L0.
- the position of the viewpoint VP on the developed image D is represented by a position Q (distance from the origin 0) on the central axis L0 and a rotation angle ⁇ from the origin 0.
- the positions of the viewpoint VP on the developed image D and the viewpoint VP on the MPR image M can be represented by P, ⁇ , and R, respectively. That is, if the expression of the position of the viewpoint VP on the developed image D is f (P, ⁇ , R), the position of the viewpoint VP on the developed image D is obtained by substituting P, ⁇ , and R into the expression. be able to. This means that P, ⁇ , and R can be derived from the position of the viewpoint VP on the developed image D using f (P, ⁇ , R).
- the expression of the position of the viewpoint VP on the MPR image M is g (P, ⁇ , R)
- the position of the viewpoint VP on the MPR image M is obtained by substituting P, ⁇ , and R into the expression. be able to.
- P, ⁇ , and R can be derived from the position of the viewpoint VP on the MPR image M using g (P, ⁇ , R).
- the position of the viewpoint VP on the MPR image M can be obtained from the position of the viewpoint VP on the developed image D. Further, the position of the viewpoint VP on the developed image D can be obtained from the position of the viewpoint VP on the MPR image M.
- the display control means 21 receives the operation of the operation means (input unit) 18 and displays the viewpoint on the MPR image so as to be movable.
- the display control means 21 displays the viewpoint on the developed image and displays the viewpoint on the developed image in conjunction with the viewpoint on the MPR image. Therefore, when the display control means 21 receives an operation of the operation means (input unit) 18 and moves one viewpoint of the developed image and the MPR image, the display control means 21 receives the viewpoint position and moves the viewpoint on the other image. Can be displayed.
- the display control means 21 displays a form including a concave portion and / or a convex portion of the outer wall 3 of the tubular portion 1 in the view image (indicated by “V” in FIG. 18). At this time, the display control means 21 displays the concave portion and the convex portion in a distinguishable manner.
- a concave portion and a convex portion (indicated by “U” in FIG. 18) may be distinguished by different colors, or may be distinguished by different shadows or hatching.
- the concave portion in the inner wall 2 of the tubular portion 1 refers to a portion that is recessed from the estimated normal inner wall 2a
- the convex portion refers to a portion that protrudes from the normal inner wall 2a.
- the concave portion refers to a portion recessed from the estimated normal outer wall 3 a
- the convex portion refers to a portion raised from the normal outer wall 3 a
- both the concave portion and the convex portion are 3 of the medical image. Judgment is made based on the dimension data.
- the developed image, the MPR image, and the view image are shown as the images of the living tissue on which the cross-sectional images are displayed together.
- an MPR image and an outer wall development image are displayed.
- the outer wall developed image may be displayed instead of the MPR image, or may be displayed together with the developed image and / or the view image.
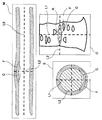
- FIG. 19 is a diagram illustrating an example of a display mode when a cross-sectional image is displayed together with an MPR image and an outer wall development image in the medical image diagnostic apparatus according to the sixth embodiment. Note that the sixth embodiment will mainly describe the configuration different from the above-described embodiment, and the description of the same configuration as the above-described embodiment will be omitted.
- the image generation means 16 has an outer wall expanded image generation means 175.
- the outer wall developed image generation means 175 generates an outer wall developed image that is expressed as if the outer wall 3 of the tubular portion 1 is opened to the outside of the cross-sectional image (as if it is extended in the radial direction with the central axis L0).
- the extended length is the length of the portion of the outer wall 3 that falls within the visual field range.
- the display control means 21 displays the cross-sectional image together with the MPR image and the outer wall development image.
- the display control means 21 displays a form including a concave portion and / or a convex portion of the outer wall 3 of the tubular portion 1 in the outer wall developed image.
- the display control means 21 displays the concave portion and the convex portion (indicated by “U” in FIG. 18) in a distinguishable manner.
- the concave portion and the convex portion may be distinguished by different colors, or may be distinguished by different shadows or hatching.
- the concave portion in the inner wall 2 of the tubular portion 1 refers to a portion that is recessed from the estimated normal inner wall 2a
- the convex portion refers to a portion that protrudes from the normal inner wall 2a. Both concave and convex portions are determined based on the three-dimensional data of the medical image.
- the concave portion refers to a portion recessed from the estimated normal outer wall 3 a
- the convex portion refers to a portion raised from the normal outer wall 3 a
- both the concave portion and the convex portion are 3 of the medical image. Judgment is made based on the dimension data.
- FIG. 19 shows the outer wall development image “OD”.
- the MPR image and the outer wall development image are displayed together with the cross-sectional image.
- an MPR image and an outer wall developed image are displayed together with the developed image.
- FIG. 20 is a diagram illustrating an example of a display mode when the developed image is displayed together with the MPR image and the outer wall developed image in the medical image diagnostic apparatus according to the seventh embodiment.
- the seventh embodiment will mainly describe the configuration different from the above-described embodiment, and the description of the same configuration as the above-described embodiment will be omitted.
- the display control means 21 displays the developed image together with the MPR image and the outer wall developed image.
- the display control means 21 displays the unfolded image and the unfolded image of the outer wall.
Priority Applications (3)
| Application Number | Priority Date | Filing Date | Title |
|---|---|---|---|
| CN201280011423.2A CN103402434B (zh) | 2011-03-10 | 2012-03-09 | 医用图像诊断装置、医用图像显示装置以及医用图像处理装置 |
| US13/981,451 US9196057B2 (en) | 2011-03-10 | 2012-03-09 | Medical image diagnosis apparatus, medical image display apparatus, medical image processing apparatus, and medical image processing program |
| US14/931,206 US9449387B2 (en) | 2011-03-10 | 2015-11-03 | Medical image diagnosis apparatus, medical image display apparatus, medical image processing apparatus, and medical image processing program |
Applications Claiming Priority (2)
| Application Number | Priority Date | Filing Date | Title |
|---|---|---|---|
| JP2011-052982 | 2011-03-10 | ||
| JP2011052982 | 2011-03-10 |
Related Child Applications (2)
| Application Number | Title | Priority Date | Filing Date |
|---|---|---|---|
| US13/981,451 A-371-Of-International US9196057B2 (en) | 2011-03-10 | 2012-03-09 | Medical image diagnosis apparatus, medical image display apparatus, medical image processing apparatus, and medical image processing program |
| US14/931,206 Division US9449387B2 (en) | 2011-03-10 | 2015-11-03 | Medical image diagnosis apparatus, medical image display apparatus, medical image processing apparatus, and medical image processing program |
Publications (1)
| Publication Number | Publication Date |
|---|---|
| WO2012121368A1 true WO2012121368A1 (ja) | 2012-09-13 |
Family
ID=46798319
Family Applications (1)
| Application Number | Title | Priority Date | Filing Date |
|---|---|---|---|
| PCT/JP2012/056109 WO2012121368A1 (ja) | 2011-03-10 | 2012-03-09 | 医用画像診断装置、医用画像表示装置、医用画像処理装置、及び医用画像処理プログラム |
Country Status (4)
| Country | Link |
|---|---|
| US (2) | US9196057B2 (zh) |
| JP (1) | JP6054043B2 (zh) |
| CN (1) | CN103402434B (zh) |
| WO (1) | WO2012121368A1 (zh) |
Families Citing this family (12)
| Publication number | Priority date | Publication date | Assignee | Title |
|---|---|---|---|---|
| JP6113460B2 (ja) * | 2012-11-09 | 2017-04-12 | 東芝メディカルシステムズ株式会社 | 医用画像処理装置および医用画像診断装置 |
| JP6257913B2 (ja) * | 2013-04-19 | 2018-01-10 | 東芝メディカルシステムズ株式会社 | 医用画像処理装置および医用画像処理プログラム |
| WO2015088277A1 (ko) * | 2013-12-12 | 2015-06-18 | 삼성메디슨 주식회사 | 초음파 영상 표시 방법 및 장치 |
| JP2015127680A (ja) | 2013-12-27 | 2015-07-09 | スリーエム イノベイティブ プロパティズ カンパニー | 計測装置、システムおよびプログラム |
| US9741104B2 (en) * | 2015-05-18 | 2017-08-22 | Toshiba Medical Systems Corporation | Apparatus, method, and computer-readable medium for quad reconstruction using hybrid filter convolution and high dynamic range tone-mapping |
| JP6591203B2 (ja) * | 2015-06-01 | 2019-10-16 | キヤノンメディカルシステムズ株式会社 | 医用画像処理装置 |
| JP6639935B2 (ja) * | 2016-02-09 | 2020-02-05 | キヤノンメディカルシステムズ株式会社 | 画像処理装置およびmri装置 |
| JP7083833B2 (ja) * | 2017-02-01 | 2022-06-13 | ユニバーシティ オブ ユタ リサーチ ファウンデーション | 心臓組織マッピングのための装置および方法 |
| DE102017210528A1 (de) * | 2017-06-22 | 2018-12-27 | Siemens Healthcare Gmbh | Visualisierung eines medizintechnischen Objekts |
| JP6907324B2 (ja) * | 2017-08-25 | 2021-07-21 | 富士フイルム株式会社 | 診断支援システム、内視鏡システム及び診断支援方法 |
| US11276250B2 (en) * | 2019-10-23 | 2022-03-15 | International Business Machines Corporation | Recognition for overlapped patterns |
| JPWO2021200296A1 (zh) * | 2020-03-31 | 2021-10-07 |
Citations (6)
| Publication number | Priority date | Publication date | Assignee | Title |
|---|---|---|---|---|
| JP2006110341A (ja) * | 2004-10-11 | 2006-04-27 | General Electric Co <Ge> | 筒状構造に沿って組織種別を解析するための装置及び方法 |
| WO2006118100A1 (ja) * | 2005-04-28 | 2006-11-09 | Hitachi Medical Corporation | 画像表示装置及びプログラム |
| JP2008067991A (ja) * | 2006-09-15 | 2008-03-27 | Toshiba Corp | 画像診断装置、管腔物情報表示装置及び管腔物情報表示方法 |
| JP2009502227A (ja) * | 2005-07-22 | 2009-01-29 | コーニンクレッカ フィリップス エレクトロニクス エヌ ヴィ | 多色スペクトルによるx線検出器イメージング |
| WO2010047324A1 (ja) * | 2008-10-20 | 2010-04-29 | 株式会社 日立メディコ | 医用画像処理装置、及び医用画像処理方法 |
| JP2010178906A (ja) * | 2009-02-05 | 2010-08-19 | Toshiba Corp | 医用画像処理装置、画像診断装置および医用画像処理プログラム |
Family Cites Families (5)
| Publication number | Priority date | Publication date | Assignee | Title |
|---|---|---|---|---|
| DE10317367B4 (de) | 2003-04-15 | 2007-01-11 | Siemens Ag | Verfahren zur Durchführung der digitalen Subtraktionsangiographie unter Verwendung nativer Volumendatensätze |
| US7432924B2 (en) | 2003-08-28 | 2008-10-07 | Kabushiki Kaisha Toshiba | 3D digital subtraction angiography image processing apparatus |
| US8175348B2 (en) * | 2007-06-05 | 2012-05-08 | The United States Of America As Represented By The Secretary Of The Department Of Health And Human Services | Segmenting colon wall via level set techniques |
| JP5283877B2 (ja) | 2007-09-21 | 2013-09-04 | 株式会社東芝 | 超音波診断装置 |
| JP5624308B2 (ja) | 2008-11-21 | 2014-11-12 | 株式会社東芝 | 画像処理装置及び画像処理方法 |
-
2012
- 2012-03-09 CN CN201280011423.2A patent/CN103402434B/zh active Active
- 2012-03-09 JP JP2012052409A patent/JP6054043B2/ja active Active
- 2012-03-09 WO PCT/JP2012/056109 patent/WO2012121368A1/ja active Application Filing
- 2012-03-09 US US13/981,451 patent/US9196057B2/en active Active
-
2015
- 2015-11-03 US US14/931,206 patent/US9449387B2/en active Active
Patent Citations (6)
| Publication number | Priority date | Publication date | Assignee | Title |
|---|---|---|---|---|
| JP2006110341A (ja) * | 2004-10-11 | 2006-04-27 | General Electric Co <Ge> | 筒状構造に沿って組織種別を解析するための装置及び方法 |
| WO2006118100A1 (ja) * | 2005-04-28 | 2006-11-09 | Hitachi Medical Corporation | 画像表示装置及びプログラム |
| JP2009502227A (ja) * | 2005-07-22 | 2009-01-29 | コーニンクレッカ フィリップス エレクトロニクス エヌ ヴィ | 多色スペクトルによるx線検出器イメージング |
| JP2008067991A (ja) * | 2006-09-15 | 2008-03-27 | Toshiba Corp | 画像診断装置、管腔物情報表示装置及び管腔物情報表示方法 |
| WO2010047324A1 (ja) * | 2008-10-20 | 2010-04-29 | 株式会社 日立メディコ | 医用画像処理装置、及び医用画像処理方法 |
| JP2010178906A (ja) * | 2009-02-05 | 2010-08-19 | Toshiba Corp | 医用画像処理装置、画像診断装置および医用画像処理プログラム |
Also Published As
| Publication number | Publication date |
|---|---|
| US20130315455A1 (en) | 2013-11-28 |
| US20160071267A1 (en) | 2016-03-10 |
| US9449387B2 (en) | 2016-09-20 |
| US9196057B2 (en) | 2015-11-24 |
| CN103402434B (zh) | 2016-06-08 |
| JP6054043B2 (ja) | 2016-12-27 |
| CN103402434A (zh) | 2013-11-20 |
| JP2012196437A (ja) | 2012-10-18 |
Similar Documents
| Publication | Publication Date | Title |
|---|---|---|
| JP6054043B2 (ja) | 医用画像診断装置、医用画像表示装置、医用画像処理装置、及び医用画像処理プログラム | |
| JP5551957B2 (ja) | 投影画像生成装置およびその作動方法、並びに投影画像生成プログラム | |
| JP6395995B2 (ja) | 医療映像処理方法及び装置 | |
| JP4709177B2 (ja) | 三次元画像処理装置および方法並びにプログラム | |
| US11883118B2 (en) | Using augmented reality in surgical navigation | |
| JP5950619B2 (ja) | 情報処理装置 | |
| US9036882B2 (en) | Diagnosis assisting apparatus, diagnosis assisting method, and recording medium having a diagnosis assisting program stored therein | |
| JP4563421B2 (ja) | 画像処理方法及び画像処理プログラム | |
| JP4912389B2 (ja) | 画像表示装置及びプログラム | |
| JP6445784B2 (ja) | 画像診断支援装置、その処理方法及びプログラム | |
| US7286693B2 (en) | Medical viewing system and image processing method for visualization of folded anatomical portions of object surfaces | |
| JP4146438B2 (ja) | 識別方法 | |
| JP4350226B2 (ja) | 三次元画像処理装置 | |
| JP4634437B2 (ja) | 展開画像投影方法、展開画像投影プログラム、展開画像投影装置 | |
| KR101293744B1 (ko) | 복수의 2차원 영상들과 3차원 모델의 합성을 위한 방법 및 장치 | |
| JP5380231B2 (ja) | 医用画像表示装置および方法ならびにプログラム | |
| JP2010075549A (ja) | 画像処理装置 | |
| CN106028943A (zh) | 超声虚拟内窥成像系统和方法及其装置 | |
| JP6533687B2 (ja) | 医用画像処理装置、医用画像処理方法、及び医用画像処理プログラム | |
| JP5487339B2 (ja) | 医用画像処理装置 | |
| JP6188874B2 (ja) | 情報処理装置、方法及びプログラム | |
| JP2005261531A (ja) | 医用画像表示方法および装置 |
Legal Events
| Date | Code | Title | Description |
|---|---|---|---|
| 121 | Ep: the epo has been informed by wipo that ep was designated in this application |
Ref document number: 12755298 Country of ref document: EP Kind code of ref document: A1 |
|
| WWE | Wipo information: entry into national phase |
Ref document number: 13981451 Country of ref document: US |
|
| NENP | Non-entry into the national phase |
Ref country code: DE |
|
| 122 | Ep: pct application non-entry in european phase |
Ref document number: 12755298 Country of ref document: EP Kind code of ref document: A1 |