WO2012002302A1 - 光断層画像化装置及び光断層画像化方法 - Google Patents
光断層画像化装置及び光断層画像化方法 Download PDFInfo
- Publication number
- WO2012002302A1 WO2012002302A1 PCT/JP2011/064627 JP2011064627W WO2012002302A1 WO 2012002302 A1 WO2012002302 A1 WO 2012002302A1 JP 2011064627 W JP2011064627 W JP 2011064627W WO 2012002302 A1 WO2012002302 A1 WO 2012002302A1
- Authority
- WO
- WIPO (PCT)
- Prior art keywords
- image data
- light
- unit
- frequency
- image
- Prior art date
- Legal status (The legal status is an assumption and is not a legal conclusion. Google has not performed a legal analysis and makes no representation as to the accuracy of the status listed.)
- Ceased
Links
Images






Classifications
-
- A—HUMAN NECESSITIES
- A61—MEDICAL OR VETERINARY SCIENCE; HYGIENE
- A61B—DIAGNOSIS; SURGERY; IDENTIFICATION
- A61B5/00—Measuring for diagnostic purposes; Identification of persons
- A61B5/0059—Measuring for diagnostic purposes; Identification of persons using light, e.g. diagnosis by transillumination, diascopy, fluorescence
- A61B5/0062—Arrangements for scanning
- A61B5/0066—Optical coherence imaging
-
- A—HUMAN NECESSITIES
- A61—MEDICAL OR VETERINARY SCIENCE; HYGIENE
- A61B—DIAGNOSIS; SURGERY; IDENTIFICATION
- A61B5/00—Measuring for diagnostic purposes; Identification of persons
- A61B5/0059—Measuring for diagnostic purposes; Identification of persons using light, e.g. diagnosis by transillumination, diascopy, fluorescence
- A61B5/0082—Measuring for diagnostic purposes; Identification of persons using light, e.g. diagnosis by transillumination, diascopy, fluorescence adapted for particular medical purposes
- A61B5/0084—Measuring for diagnostic purposes; Identification of persons using light, e.g. diagnosis by transillumination, diascopy, fluorescence adapted for particular medical purposes for introduction into the body, e.g. by catheters
-
- A—HUMAN NECESSITIES
- A61—MEDICAL OR VETERINARY SCIENCE; HYGIENE
- A61B—DIAGNOSIS; SURGERY; IDENTIFICATION
- A61B5/00—Measuring for diagnostic purposes; Identification of persons
- A61B5/72—Signal processing specially adapted for physiological signals or for diagnostic purposes
- A61B5/7235—Details of waveform analysis
- A61B5/7253—Details of waveform analysis characterised by using transforms
- A61B5/7257—Details of waveform analysis characterised by using transforms using Fourier transforms
Definitions
- the present invention relates to an optical tomographic imaging apparatus and an optical tomographic imaging method, and more particularly to an optical tomographic imaging apparatus and an optical tomographic imaging method capable of clearly rendering an image of a layer structure of interest such as a mucosal muscle plate.
- OCT optical coherence tomography
- This OCT measurement has an advantage that the resolution is about 10 ⁇ m higher than that of ultrasonic measurement, and a detailed tomographic image inside the living body can be obtained.
- a three-dimensional tomographic image can be obtained by acquiring a plurality of images while shifting the position in a direction perpendicular to the tomographic image.
- frequency domain OCT Frequency domain OCT
- Patent Document 3 there is a technique for specifying a pixel position corresponding to a layer boundary by applying a differential filter in the depth direction after performing preprocessing (smoothing, averaging processing, etc.) on image data.
- Typical examples of the device configuration that performs frequency domain OCT (Frequency domain OCT) measurement include SD-OCT (Spectral Domain OCT) device and SS-OCT (Swept Source SCT).
- the SD-OCT device uses broadband low-coherent light such as SLD (Super Luminescence Diode) or ASE (Amplified Spontaneous Emission) light source, white light as a light source, and uses a Michelson interferometer or the like to generate broadband low-coherent light.
- SLD Super Luminescence Diode
- ASE Ampton
- the measurement light is irradiated onto the measurement object, the reflected light returned at that time interferes with the reference light, and this interference light is decomposed into frequency components using a spectrometer.
- the resulting spectral interference intensity signal is Fourier-transformed by a computer, and optical tomography An image is constructed.
- the SS-OCT apparatus uses a laser that temporally sweeps the optical frequency as a light source, causes reflected light and reference light to interfere with each other at each wavelength, and measures the time waveform of the signal corresponding to the temporal change of the optical frequency.
- An optical tomographic image is constructed by Fourier-transforming the spectral interference intensity signal thus obtained with a computer.
- OCT measurement is a method for acquiring an optical tomographic image of a specific region as described above.
- an endoscope for example, a cancer lesion is observed by observation with a normal illumination light endoscope or a special light endoscope.
- OCT measurement By finding and performing OCT measurement of the region, it is possible to determine how far the cancerous lesion has infiltrated. Further, by scanning the optical axis of the measurement light two-dimensionally, three-dimensional information can be acquired together with depth information obtained by OCT measurement.
- Integrating OCT measurement and 3D computer graphic technology makes it possible to display a 3D structure model consisting of structural information of a measurement object having a resolution on the order of micrometers.
- this three-dimensional structure model by OCT measurement is referred to as three-dimensional volume data.
- the fundus layer structure is extracted, but in this diagnostic field, for observation in a relatively shallow observation depth range. Even if the image data once imaged is subjected to processing such as smoothing and average processing, the layer structure can be easily extracted, but it is required to depict, for example, a mucosal muscle plate existing in a deep part In the OCT for digestive organs, since the S / N is poor in the deep part, it is difficult to depict the mucosal muscle plate by the same method.
- the present invention has been made in view of such circumstances, and provides an optical tomographic imaging apparatus and an optical tomographic imaging method capable of clearly rendering an image of a layer of interest structure such as a mucosal muscle plate, for example. Objective.
- the optical tomographic imaging apparatus divides the light emitted from the wavelength swept light source into measurement light and reference light, and irradiates the measurement object with the measurement light. , The reflected light from the measurement object and the reference light are combined, the interference light when the reflected light and the reference light are combined is detected as an interference signal, and the measurement object is detected using the interference signal.
- An optical tomographic imaging apparatus for acquiring a tomographic image, wherein the interference signal is Fourier-transformed to generate tomographic information of the measurement target, and the tomographic information of the measurement target is logarithmically transformed and input image data And a first frequency filter having a lower center frequency out of at least two types of frequency filters having different center frequencies, and applying a filtering process to the input image data to generate a first By performing a filtering process on the input image data using a first filtering unit that generates intermediate image data and a second frequency filter having a higher center frequency among the at least two types of frequency filters.
- a second filtering unit that generates second intermediate image data
- an AND processing unit that generates output image data by extracting an overlapping portion between the first intermediate image data and the second intermediate image data
- An image generation unit that generates an image to be displayed on the monitor unit from the output image data.
- the first intermediate image data generated by the filtering process by the first frequency filter (low frequency filter) and the filtering process by the second frequency filter (high frequency filter) are generated.
- a process (AND process) for extracting an overlapping portion with the second intermediate image data a high-frequency noise component is removed and a layer structure of interest such as a mucosal muscle plate is clearly extracted. Images can be acquired.
- the optical tomographic imaging apparatus is the optical tomographic imaging apparatus according to the first aspect, and changes the center frequency of the first or second frequency filter according to the type of the measurement object.
- a center frequency changing unit is provided.
- An optical tomographic imaging apparatus is the optical tomographic imaging apparatus according to the second aspect, wherein the center frequency changing unit determines a center frequency of the first frequency filter as a target layer of the measurement target. It is determined based on the thickness of the structure and the thickness of the adjacent layer of the target layer structure.
- An optical tomographic imaging apparatus is the optical tomographic imaging apparatus according to the second aspect or the third aspect, wherein the center frequency changing unit measures the center frequency of the second frequency filter. This is determined based on the thickness of the target layer structure of interest.
- An optical tomographic imaging apparatus is the optical tomographic imaging apparatus according to any one of the second to fourth aspects, and includes a measurement target identification unit that identifies the type of the measurement target.
- the center frequency changing unit changes the center frequency of the first or second frequency filter based on the result identified by the measurement target identifying unit.
- An optical tomographic imaging apparatus is the optical tomographic imaging apparatus according to the fifth aspect, wherein the measurement target identifying unit is provided to an endoscope insertion unit that is inserted into a subject. The type of the measurement object is identified based on the identification ID.
- An optical tomographic imaging apparatus is the optical tomographic imaging apparatus according to the fifth aspect, wherein the measurement target identifying unit identifies the type of the measurement target from an endoscopic image. .
- An optical tomographic imaging apparatus is the optical tomographic imaging apparatus according to any one of the first to seventh aspects, in which the first filtering unit is configured to process the input image data.
- the first intermediate image data is generated by performing a binarization process after performing a filtering process by the first frequency filter.
- An optical tomographic imaging apparatus is the optical tomographic imaging apparatus according to any one of the first to eighth aspects, wherein the second filtering unit applies the input image data to the input image data. After the filtering process is performed by the second frequency filter, the second intermediate image data is generated by further performing a binarization process.
- An optical tomographic imaging apparatus is the optical tomographic imaging apparatus according to any one of the first to ninth aspects, wherein the image generated by the image generation unit and the tomographic image are displayed.
- An image composition unit that generates a composite image by adding at a preset ratio is provided.
- an optical tomographic imaging method divides light emitted from a wavelength swept light source into measurement light and reference light, and uses the measurement light as a measurement object. Irradiate, combine the reflected light from the measurement object and the reference light, detect interference light when the reflected light and the reference light are combined as an interference signal, and use the interference signal to perform the measurement
- a logarithmic conversion step for generating image data and a filtering process for the input image data using a first frequency filter having a lower center frequency among at least two types of frequency filters having different center frequencies
- the first intermediate image data generated by the filtering process by the first frequency filter (low frequency filter) and the filtering process by the second frequency filter (high frequency filter) are generated.
- a process (AND process) for extracting an overlapping portion with the second intermediate image data a high-frequency noise component is removed and a layer structure of interest such as a mucosal muscle plate is clearly extracted. Images can be acquired.
- An optical tomographic imaging method is the optical tomographic imaging method according to the eleventh aspect, wherein the center frequency of the first or second frequency filter is changed according to the type of the measurement object.
- a center frequency changing step is included.
- the optical tomographic imaging method of the thirteenth aspect of the present invention is the optical tomographic imaging method of the twelfth aspect, wherein the center frequency changing step uses the center frequency of the first frequency filter as the target layer of the measurement object. It is determined based on the thickness of the structure and the thickness of the adjacent layer of the target layer structure.
- An optical tomographic imaging method is the optical tomographic imaging method according to the twelfth aspect or thirteenth aspect, wherein the center frequency changing step measures the center frequency of the second frequency filter. This is determined based on the thickness of the target layer structure of interest.
- An optical tomographic imaging method is the optical tomographic imaging method according to any one of the twelfth to fourteenth aspects, and includes a measurement object identification step for identifying the type of the measurement object.
- the center frequency changing step changes the center frequency of the first or second frequency filter based on the result identified by the measurement object identifying step.
- An optical tomographic imaging method is the optical tomographic imaging method according to the fifteenth aspect, wherein the measurement object identifying step is applied to an endoscope insertion portion that is inserted into a subject.
- the type of the measurement object is identified based on the identification ID.
- An optical tomographic imaging method is the optical tomographic imaging method according to the fifteenth aspect, wherein the measurement target identifying step identifies the type of the measurement target from an endoscopic image. .
- An optical tomographic imaging method is the optical tomographic imaging method according to any one of the eleventh aspect to the seventeenth aspect, wherein the first filtering step is performed on the input image data.
- the first intermediate image data is generated by performing a binarization process after performing a filtering process by the first frequency filter.
- An optical tomographic imaging method is the optical tomographic imaging method according to any one of the eleventh aspect to the eighteenth aspect, wherein the second filtering step is performed on the input image data. After the filtering process is performed by the second frequency filter, the second intermediate image data is generated by further performing a binarization process.
- An optical tomographic imaging method is the optical tomographic imaging method according to any one of the eleventh to nineteenth aspects, wherein the image generated by the image generating step and the tomographic image are combined. It includes an image composition step for generating a composite image by adding at a preset ratio.
- a process (AND process) for extracting an overlap portion with the intermediate image data an image in which a high-frequency noise component is removed and an attention layer structure such as a mucosal muscle plate is clearly extracted is obtained. be able to.
- FIG. 1 is an external view showing an image diagnostic apparatus using an optical tomographic imaging apparatus according to a first embodiment.
- the block diagram which shows the internal structure of the OCT processor of FIG. Sectional view of the OCT probe of FIG.
- FIG. 2 The figure which shows the three-dimensional volume data constructed
- the block diagram which shows the structure of the signal processing part of FIG. A figure showing an example of an input image (original image)
- the figure which showed the image obtained when performing the high frequency band pass filtering with respect to the input image of FIG. 11 is a diagram showing an image obtained when AND processing is performed on the image shown in FIG. 11 and the image shown in FIG.
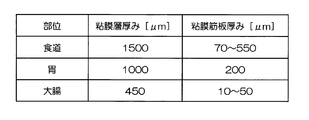
- a diagram showing the relationship between the normal mucosa of the main digestive system and the thickness of the mucosal fascia The figure which showed an example of the screen displayed on a monitor device It is the flowchart figure which showed an example of the method of identifying a measurement region
- the block diagram which shows the structure of the signal processing part which concerns on 2nd Embodiment.
- FIG. 1 is an external view showing an image diagnostic apparatus using the optical tomographic imaging apparatus according to the first embodiment of the present invention.
- the diagnostic imaging apparatus 10 mainly includes an endoscope 100, an endoscope processor 200, a light source device 300, an OCT processor 400 as an optical tomographic imaging device, and a monitor device 500.
- the endoscope processor 200 may be configured to incorporate the light source device 300.
- the endoscope 100 includes a hand operation unit 112 and an insertion unit 114 connected to the hand operation unit 112. The surgeon grasps and operates the hand operation unit 112 and performs observation by inserting the insertion unit 114 into the body of the subject.
- the hand operation part 112 is provided with a forceps insertion part 138, and the forceps insertion part 138 communicates with the forceps port 156 of the distal end part 144.
- the OCT probe 600 is led out from the forceps opening 156 by inserting the OCT probe 600 from the forceps insertion portion 138.
- the OCT probe 600 is inserted into the OCT processor 400 via the insertion portion 602 inserted from the forceps insertion portion 138 and led out from the forceps opening 156, the operation portion 604 for the operator to operate the OCT probe 600, and the connector 610. It consists of a cable 606 to be connected.
- Endoscope At the distal end portion 144 of the endoscope 100, an observation optical system 150, an illumination optical system 152, and a CCD (not shown) are disposed.
- the observation optical system 150 forms an image of a subject on a light receiving surface (not shown) of the CCD, and the CCD converts the subject image formed on the light receiving surface into an electric signal by each light receiving element.
- the CCD of this embodiment is a color CCD in which three primary color red (R), green (G), and blue (B) color filters are arranged for each pixel in a predetermined arrangement (Bayer arrangement, honeycomb arrangement). is there.
- reference numeral 154 denotes a cleaning nozzle for supplying a cleaning liquid and pressurized air toward the observation optical system 150.
- the light source device 300 causes visible light to enter a light guide (not shown). One end of the light guide is connected to the light source device 300 via the LG connector 120, and the other end of the light guide faces the illumination optical system 152. The light emitted from the light source device 300 is emitted from the illumination optical system 152 via the light guide, and illuminates the visual field range of the observation optical system 150.
- Endoscope processor An image signal output from the CCD is input to the endoscope processor 200 via the electrical connector 110.
- the analog image signal is converted into a digital image signal in the endoscope processor 200, and necessary processing for displaying on the screen of the monitor device 500 is performed.
- observation image data obtained by the endoscope 100 is output to the endoscope processor 200, and an image is displayed on the monitor device 500 connected to the endoscope processor 200.
- FIG. 2 is a block diagram showing an internal configuration of the OCT processor of FIG.
- An OCT processor 400 and an OCT probe 600 shown in FIG. 2 are for obtaining an optical tomographic image of a measurement object by an optical coherence tomography (OCT) measurement method, and emit a light La for measurement.
- One light source unit (first light source unit) 12 and the light La emitted from the first light source unit 12 are branched into measurement light (first light beam) L1 and reference light L2, and are a subject.
- An optical fiber coupler (branching / combining unit) 14 that combines the return light L3 from the measurement target S and the reference light L2 to generate an interference light L4, and the measurement light L1 branched by the optical fiber coupler 14 is a measurement target.
- the OCT probe 600 including the rotation-side optical fiber FB1 that guides the return light L3 from the measurement target, and guides the measurement light L1 to the rotation-side optical fiber FB1 and rotates the rotation-side optical fiber.
- the fixed-side optical fiber FB2 that guides the return light L3 guided by the fiber FB1 and the rotation-side optical fiber FB1 are rotatably connected to the fixed-side optical fiber FB2, and the measurement light L1 and the return light L3 are transmitted.
- the optical connector 18, the interference light detection unit 20 that detects the interference light L 4 generated by the optical fiber coupler 14 as an interference signal, and the interference signal detected by the interference light detection unit 20 to process the optical tomographic image ( Hereinafter, it is also referred to as a “tomographic image”). Further, the optical tomographic image acquired by the signal processing unit 22 is displayed on the monitor device 500.
- the OCT processor 400 adjusts the optical path length of the second light source unit (second light source unit) 13 that emits aiming light (second light flux) Le for indicating a mark of measurement, and the reference light L2.
- An optical path length adjustment unit 26 an optical fiber coupler 28 that branches the light La emitted from the first light source unit 12, and detectors 30a and 30b that detect return lights L4 and L5 combined by the optical fiber coupler 14.
- an operation control unit 32 that inputs various conditions to the signal processing unit 22, changes settings, and the like.
- various lights including the above-described emission light La, aiming light Le, measurement light L1, reference light L2, return light L3, and the like are guided between components such as optical devices.
- Various optical fibers FB (FB3, FB4, FB5, FB6, FB7, FB8, etc.) including the rotation side optical fiber FB1 and the fixed side optical fiber FB2 are used as light paths for wave transmission.
- the first light source unit 12 emits light for OCT measurement (for example, laser light having a wavelength of 1.3 ⁇ m or low-coherence light), and the first light source unit 12 has a frequency of a constant period. This is a light source that emits a laser beam La centered at a wavelength of 1.3 ⁇ m, for example, in the infrared region, while being swept with a laser beam.
- the first light source unit 12 includes a light source 12a that emits laser light or low-coherence light La, and a lens 12b that condenses the light La emitted from the light source 12a.
- the light La emitted from the first light source unit 12 is divided into the measurement light L1 and the reference light L2 by the optical fiber coupler 14 via the optical fibers FB4 and FB3, and the measurement light L1 is Input to the optical connector 18.
- the second light source unit 13 emits visible light to make it easy to confirm the measurement site as the aiming light Le.
- red semiconductor laser light having a wavelength of 0.66 ⁇ m, He—Ne laser light having a wavelength of 0.63 ⁇ m, blue semiconductor laser light having a wavelength of 0.405 ⁇ m, or the like can be used. Therefore, the second light source unit 13 includes, for example, a semiconductor laser 13a that emits red, blue, or green laser light, and a lens 13b that condenses the aiming light Le emitted from the semiconductor laser 13a.
- the aiming light Le emitted from the second light source unit 13 is input to the optical connector 18 through the optical fiber FB8.
- the measurement light L1 and the aiming light Le are combined and guided to the rotation side optical fiber FB1 in the OCT probe 600.
- the optical fiber coupler (branching / combining unit) 14 is composed of, for example, a 2 ⁇ 2 optical fiber coupler, and is optically connected to the fixed-side optical fiber FB2, the optical fiber FB3, the optical fiber FB5, and the optical fiber FB7, respectively. ing.
- the optical fiber coupler 14 divides the light La incident from the first light source unit 12 via the optical fibers FB4 and FB3 into measurement light (first light flux) L1 and reference light L2, and the measurement light L1 is fixed.
- the light is incident on the optical fiber FB2, and the reference light L2 is incident on the optical fiber FB5.
- the optical fiber coupler 14 is incident on the optical fiber FB5, is subjected to frequency shift and optical path length change by the optical path length adjusting unit 26 described later, and is returned by the optical fiber FB5 and acquired by the OCT probe 600 described later. Then, the light L3 guided from the fixed side optical fiber FB2 is multiplexed and emitted to the optical fiber FB3 (FB6) and the optical fiber FB7.
- the OCT probe 600 is connected to the fixed optical fiber FB2 via the optical connector 18, and the measurement light L1 combined with the aiming light Le is rotated from the fixed optical fiber FB2 via the optical connector 18.
- the light enters the side optical fiber FB1.
- the measurement light L1 combined with the incident aiming light Le is transmitted by the rotation side optical fiber FB1, and is irradiated to the measurement object S.
- the return light L3 from the measuring object S is acquired, the acquired return light L3 is transmitted by the rotation side optical fiber FB1, and is emitted to the fixed side optical fiber FB2 via the optical connector 18.
- the optical connector 18 multiplexes the measurement light (first light beam) L1 and the aiming light (second light beam) Le.
- the interference light detection unit 20 is connected to the optical fibers FB6 and FB7, and uses the interference lights L4 and L5 generated by combining the reference light L2 and the return light L3 by the optical fiber coupler 14 as interference signals. It is to detect.
- the OCT processor 400 includes a detector 30a for detecting the light intensity of the interference light L4 provided on the optical fiber FB6 branched from the optical fiber coupler 28, and the interference light L5 on the optical path of the optical fiber FB7. And a detector 30b for detecting the light intensity.
- the interference light detection unit 20 generates an interference signal based on the detection results of the detector 30a and the detector 30b.
- the signal processing unit 22 generates image data from the interference signal detected by the interference light detection unit 20, and outputs an image obtained by performing various processes on the image data to the monitor device 500.
- the optical path length adjusting unit 26 is arranged on the side of the optical fiber FB5 where the reference light L2 is emitted (that is, the end of the optical fiber FB5 opposite to the optical fiber coupler 14).
- the optical path length adjustment unit 26 includes a first optical lens 80 that converts the light emitted from the optical fiber FB5 into parallel light, a second optical lens 82 that condenses the light converted into parallel light by the first optical lens 80, and The reflection mirror 84 that reflects the light collected by the second optical lens 82, the base 86 that supports the second optical lens 82 and the reflection mirror 84, and the base 86 are moved in a direction parallel to the optical axis direction.
- the optical path length of the reference light L2 is adjusted by changing the distance between the first optical lens 80 and the second optical lens 82.
- the first optical lens 80 converts the reference light L2 emitted from the core of the optical fiber FB5 into parallel light, and condenses the reference light L2 reflected by the reflection mirror 84 on the core of the optical fiber FB5.
- the second optical lens 82 condenses the reference light L2 converted into parallel light by the first optical lens 80 on the reflection mirror 84, and makes the reference light L2 reflected by the reflection mirror 84 parallel light.
- the first optical lens 80 and the second optical lens 82 form a confocal optical system.
- the reflection mirror 84 is disposed at the focal point of the light collected by the second optical lens 82 and reflects the reference light L2 collected by the second optical lens 82.
- the reference light L2 emitted from the optical fiber FB5 becomes parallel light by the first optical lens 80, and is condensed on the reflection mirror 84 by the second optical lens 82. Thereafter, the reference light L2 reflected by the reflection mirror 84 becomes parallel light by the second optical lens 82 and is condensed by the first optical lens 80 on the core of the optical fiber FB5.
- the base 86 fixes the second optical lens 82 and the reflecting mirror 84, and the mirror moving mechanism 88 moves the base 86 in the optical axis direction of the first optical lens 80 (the direction of arrow A in FIG. 2). .
- the distance between the first optical lens 80 and the second optical lens 82 can be changed, and the optical path length of the reference light L2 can be adjusted. Can do.
- the operation control unit 32 has input means such as a keyboard and a mouse, and control means for managing various conditions based on the input information, and is connected to the signal processing unit 22.
- the operation control unit 32 inputs, sets, and changes various processing conditions and the like in the signal processing unit 22 based on an operator instruction input from the input unit.
- the operation control unit 32 may display the operation screen on the monitor device 500, or may provide a separate display unit to display the operation screen. Further, the operation control unit 32 controls the operation of the first light source unit 12, the second light source unit 13, the optical connector 18, the interference light detection unit 20, the optical path length, the detectors 30a and 30b, and sets various conditions. You may do it.
- FIG. 3 is a cross-sectional view of the OCT probe of FIG.
- the distal end portion of the insertion portion 602 has a probe outer cylinder 620, a cap 622, a rotation side optical fiber FB 1, a spring 624, a fixing member 626, and an optical lens 628. .
- the probe outer cylinder (sheath) 620 is a flexible cylindrical member, and is made of a material through which the measurement light L1 combined with the aiming light Le and the return light L3 are transmitted in the optical connector 18.
- the probe outer cylinder 620 is a tip through which the measurement light L1 (aiming light Le) and the return light L3 pass (the tip of the rotation side optical fiber FB1 opposite to the optical connector 18, hereinafter referred to as the tip of the probe outer cylinder 620). It is only necessary that a part of the side is made of a material that transmits light over the entire circumference (transparent material), and parts other than the tip may be made of a material that does not transmit light.
- the cap 622 is provided at the tip of the probe outer cylinder 620 and closes the tip of the probe outer cylinder 620.
- the rotation side optical fiber FB1 is a linear member, is accommodated in the probe outer cylinder 620 along the probe outer cylinder 620, is emitted from the fixed side optical fiber FB2, and is emitted from the optical fiber FB8 by the optical connector 18.
- the aiming light Le and the combined measurement light L1 are guided to the optical lens 628, and the measurement object L is irradiated with the measurement light L1 (aiming light Le) from the measurement object S acquired by the optical lens 628.
- the return light L3 is guided to the optical connector 18 and enters the fixed optical fiber FB2.
- the rotation-side optical fiber FB1 and the fixed-side optical fiber FB2 are connected by the optical connector 18, and are optically connected in a state where the rotation of the rotation-side optical fiber FB1 is not transmitted to the fixed-side optical fiber FB2. ing.
- the rotation-side optical fiber FB1 is arranged so as to be rotatable with respect to the probe outer cylinder 620 and movable in the axial direction of the probe outer cylinder 620.
- the spring 624 is fixed to the outer periphery of the rotation side optical fiber FB1.
- the rotation side optical fiber FB1 and the spring 624 are connected to the optical connector 18.
- the optical lens 628 is disposed at the measurement-side tip of the rotation-side optical fiber FB1 (tip of the rotation-side optical fiber FB1 opposite to the optical connector 18), and the tip is measured from the rotation-side optical fiber FB1.
- the light L1 aiming light Le
- it is formed in a substantially spherical shape.
- the optical lens 628 irradiates the measurement target S with the measurement light L1 (aiming light Le) emitted from the rotation side optical fiber FB1, collects the return light L3 from the measurement target S, and enters the rotation side optical fiber FB1. .
- the fixing member 626 is disposed on the outer periphery of the connection portion between the rotation side optical fiber FB1 and the optical lens 628, and fixes the optical lens 628 to the end portion of the rotation side optical fiber FB1.
- the fixing method of the rotation-side optical fiber FB1 and the optical lens 628 by the fixing member 626 is not particularly limited, and the fixing member 626, the rotation-side optical fiber FB1, and the optical lens 628 are bonded and fixed by an adhesive. Or you may fix with a mechanical structure using a volt
- the fixing member 626 may be any member as long as it is used for fixing, holding or protecting the optical fiber such as a zirconia ferrule or a metal ferrule.
- the rotation side optical fiber FB1 and the spring 624 are connected to a rotation cylinder 656, which will be described later.
- the optical lens 628 is moved to the probe outer cylinder 620.
- the optical connector 18 includes a rotary encoder, and detects the irradiation position of the measurement light L1 from the position information (angle information) of the optical lens 628 based on a signal from the rotary encoder. That is, the measurement position is detected by detecting the angle of the rotating optical lens 628 with respect to the reference position in the rotation direction.
- the rotation side optical fiber FB1, the spring 624, the fixing member 626, and the optical lens 628 are moved through the probe outer cylinder 620 in the arrow S1 direction (forceps opening direction) and the S2 direction (probe outer cylinder 620) by a driving unit described later. It is configured to be movable in the direction of the tip.
- FIG. 3 is a diagram showing an outline of a drive unit such as the rotation side optical fiber FB1 in the operation unit 604 of the OCT probe 600.
- the probe outer cylinder 620 is fixed to a fixing member 670.
- the rotation side optical fiber FB1 and the spring 624 are connected to a rotating cylinder 656, and the rotating cylinder 656 is configured to rotate via a gear 654 in accordance with the rotation of the motor 652.
- the rotary cylinder 656 is connected to the optical connector 18, and the measurement light L1 and the return light L3 are transmitted between the rotation side optical fiber FB1 and the fixed side optical fiber FB2 via the optical connector 18.
- the frame 650 containing these is provided with a support member 662, and the support member 662 has a screw hole (not shown).
- a forward and backward movement ball screw 664 is engaged with the screw hole, and a motor 660 is connected to the forward and backward movement ball screw 664. Therefore, the frame 650 can be moved forward and backward by rotationally driving the motor 660, whereby the rotation side optical fiber FB1, the spring 624, the fixing member 626, and the optical lens 628 can be moved in the S1 and S2 directions in FIG. It has become.
- the OCT probe 600 is configured as described above, and the measurement side light L1 emitted from the optical lens 628 is obtained by rotating the rotation-side optical fiber FB1 and the spring 624 in the direction of the arrow R2 in FIG. (Aiming light Le) is irradiated to the measuring object S while scanning in the arrow R2 direction (circumferential direction of the probe outer cylinder 620), and the return light L3 is acquired.
- the aiming light Le is irradiated to the measuring object S as, for example, blue, red, or green spot light, and the reflected light of the aiming light Le is also displayed as a bright spot on the observation image displayed on the monitor device 500.
- a desired part of the measurement target S can be accurately captured and the return light L3 reflected from the measurement target S can be acquired over the entire circumference of the probe outer cylinder 620 in the circumferential direction.
- the optical lens 628 is moved to the end of the movable range in the direction of the arrow S1 by the drive unit, and a predetermined amount is acquired while acquiring the tomographic images. Move to the end of the movable range while moving in the S2 direction or alternately repeating tomographic image acquisition and a predetermined amount of movement in the S2 direction.
- a plurality of tomographic images in a desired range can be obtained for the measurement object S, and three-dimensional volume data can be obtained based on the acquired plurality of tomographic images.
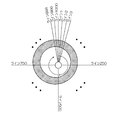
- FIG. 4 is a diagram showing a scan surface of a tomographic image when the optical scanning is radial scan with respect to the measurement target S of FIG. 2
- FIG. 5 is a diagram showing three-dimensional volume data constructed by the tomographic image of FIG. It is.
- a tomographic image in the depth direction (first direction) of the measurement target S is acquired from the interference signal, and the measurement target S is scanned (radial scan) in the direction of arrow R2 in FIG. 3 (circumferential direction of the probe outer cylinder 620).
- a tomographic image on the scan plane composed of the first direction and the second direction orthogonal to the first direction can be acquired.
- a plurality of tomographic images for generating three-dimensional volume data can be acquired as shown in FIG.
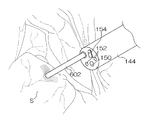
- FIG. 6 is a view showing a state in which a tomographic image is obtained using an OCT probe derived from the forceps opening of the endoscope shown in FIG.
- the tomographic image is obtained by bringing the distal end portion of the insertion portion 602 of the OCT probe close to a desired portion of the measurement target S.
- the optical lens 628 may be moved within the probe outer cylinder 620 by the drive unit described above.
- FIG. 7 is a diagram illustrating a configuration in which a tomographic image is acquired by performing sector scanning on the measurement target S in FIG. 2, and FIG. 8 is a diagram illustrating three-dimensional volume data constructed from the tomographic image in FIG. .
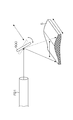
- the present invention can also be applied to a configuration in which a galvano mirror 900 is used and a sector scan is performed from above the measurement target S to acquire a tomographic image. As shown, a plurality of tomographic images for generating three-dimensional volume data can be acquired.
- FIG. 9 is a block diagram showing a configuration of the signal processing unit 22 of FIG.
- the signal processing unit 22 is a processing unit that performs signal processing for generating an image output to the monitor device 500 from the interference signal input from the interference light detection unit 20.
- the control unit 490 controls each unit of the signal processing unit 22 based on the operation signal from the operation control unit 32.
- the interference light detection unit 20 divides the light emitted from the first light source unit 12 as the wavelength sweep light source into measurement light and reference light, and irradiates the measurement target S with the measurement light from the OCT probe 600. Interference light when the obtained reflected light and reference light are combined is input.
- the interference light detection unit 20 converts an input interference light (optical signal) into an interference signal (electric signal), and converts the interference signal generated by the interference signal generation unit 20a from an analog signal to a digital signal. It comprises an AD conversion unit 20b that converts it into a signal.
- the AD conversion unit 20b for example, conversion from an analog signal to a digital signal is performed with a resolution of about 14 bits at a sampling rate of about 80 MHz, but these values are not particularly limited.
- the interference signal converted into a digital signal by the AD conversion unit 20 b is input to the Fourier transform unit 410 of the signal processing unit 22.
- the Fourier transform unit 410 performs frequency analysis by FFT (Fast Fourier Transform) on the interference signal converted into a digital signal in the AD conversion unit 20b of the interference light detection unit 20, and the reflected light L3 at each depth position of the measurement target S.
- Intensity that is, reflection intensity data (tomographic information) in the depth direction.
- the logarithmic conversion unit 420 performs logarithmic conversion of the data (tomographic information) Fourier-transformed by the Fourier transform unit 410, and generates image data (input image data) that is the original data of the image displayed on the monitor device 500.
- the image data generated by the logarithmic conversion unit 420 is input to the low frequency filtering unit 430 and the high frequency filtering unit 440, respectively.
- the low frequency filtering unit 430 includes a low frequency band pass filter unit (low frequency BPF unit) 432 and a binarization processing unit 434.
- the low frequency BPF unit 432 includes a low frequency band pass filter (not shown), and performs filtering (low frequency band pass filtering) with the low frequency band pass filter on the image data input from the logarithmic conversion unit 420.
- the low-frequency bandpass filter is configured by a generally known Gaussian filter, DOG filter, or the like.
- the center frequency of the low frequency band filter is assumed to be lower than the center frequency of the high frequency band pass filter provided in the high frequency BPF 442 described later.
- the noise suppression performance of the low-frequency bandpass filter becomes higher as the center frequency is lower.
- the layer structure of interest for example, the mucosal muscle plate
- the adjacent layer cannot be distinguished. May end up.
- the center frequency of the low-frequency bandpass filter is determined according to the layer structure of interest and the thickness of the adjacent layer.
- the normal mucosal layer has a thickness of 450 [ ⁇ m] and the mucosal muscle plate has a thickness of 10 to 50 [ ⁇ m].
- the filter for example, a band-pass filter having a center frequency of 4.16 [mm ⁇ 1 ] (half cycle 120 [ ⁇ m]) is preferably used.
- the binarization processing unit 434 performs binarization processing on the image data that has been subjected to low-frequency bandpass filtering by the low-frequency BPF unit 432 by comparison with a predetermined threshold.
- the image data (first intermediate image data) binarized by the binarization processing unit 434 is input to the AND unit 450.
- the binarization processing unit 434 extracts image data that exceeds the threshold value (or image data that is less than the threshold value) from the image data as a candidate region for the mucosal muscle. However, as the threshold value is larger (or smaller), the noise component included in the image data after the binarization processing is reduced. Conversely, when the threshold value is too large (or too small), it is originally extracted. In some cases, the candidate region of the mucosal muscle to be performed is also excluded. For this reason, the binarization processing unit 434 needs to use a threshold value optimized through experiment or experience. For example, the threshold value may be statistically determined based on a conventional measurement image. Further, the threshold value may be handled as a fixed parameter, or may be changed manually according to the intention of the operator (observer).
- the high frequency filtering unit 440 includes a high frequency band pass filter unit (high frequency BPF unit) 442 and a binarization processing unit 444.
- the high frequency BPF unit 442 includes a high frequency band pass filter (not shown) having a higher center frequency than the above-described low frequency band pass filter, and the image data input from the logarithmic conversion unit 420 is filtered by the high frequency band pass filter. (High-frequency bandpass filtering) is performed. Note that the high-frequency bandpass filter is configured by a Gaussian filter, a DOG filter, or the like, similarly to the low-frequency bandpass filter.
- the center frequency of the high-frequency bandpass filter is determined according to the thickness of the layer structure of interest (for example, the mucosal muscle plate).
- the thickness of the mucosal muscle plate in the normal large intestine is 10 to 50 [ ⁇ m] as described above. Therefore, as the high-frequency bandpass filter, for example, the center frequency is 10 [mm ⁇ 1. ] (Half-cycle 50 [ ⁇ m]) band-pass filter is preferably used.
- the binarization processing unit 444 performs binarization processing on the image data that has been subjected to high-frequency bandpass filtering by the high-frequency BPF unit 442 by comparison with a predetermined threshold.
- Image data (second intermediate image data) binarized by the binarization processing unit 444 is input to the AND unit 450.
- the threshold value used in the binarization processing unit 444 is the same as that of the above-described binarization processing unit 434, and it is necessary to use a threshold value optimized through experiment or experience.
- the threshold value is statistically determined based on a conventional measurement image.
- the threshold value may be handled as a fixed parameter, or may be changed manually according to the intention of the operator (observer).
- the AND unit 450 performs a logical product of the image data (first intermediate image data) input from the low frequency filtering unit 430 and the image data (second intermediate image data) input from the high frequency filtering unit 440, that is, Then, AND processing (overlapping portion extraction processing) for extracting overlapping portions of each image data is performed to generate AND image data (output image data).
- the AND image data generated by the AND unit 450 is input to the AND image construction unit 460.
- the AND image construction unit 460 constructs an AND image in accordance with the monitor device 500 and its display method based on the input AND image data. Specifically, the AND image is constructed by adjusting the brightness and contrast, resampling in accordance with the display size, coordinate conversion in accordance with a scanning method such as radial scanning and sector scanning. At that time, a pseudo color may be applied as necessary, or superimposition with a tomographic image may be performed as in a second embodiment described later.
- the Fourier transform unit 410 performs frequency analysis by FFT (Fast Fourier Transform). Thereby, reflection intensity data (tomographic information) in the depth direction of the measuring object S is generated.
- FFT Fast Fourier Transform
- the tomographic information generated by the Fourier transform unit 410 is logarithmically converted by the logarithm conversion unit 420.
- image data input image data
- the image data generated in this way is input to the low frequency filtering unit 430 and the high frequency filtering unit 440, respectively.
- the image data input to the low frequency filtering unit 430 is first subjected to low frequency bandpass filtering in the low frequency BPF unit 432 and then subjected to binarization processing in the binarization processing unit 434. Thereby, for example, a layer structure of interest such as a mucosal muscle plate is roughly extracted, but image data from which high-frequency noise components are removed (first intermediate image data) can be obtained.
- the image data obtained in this way is input to the AND unit 450.
- the image data input to the high frequency filtering unit 440 is first subjected to high frequency band pass filtering in the high frequency BPF unit 442 and then subjected to binarization processing in the binarization processing unit 444.
- image data (second intermediate image data) in which a layer structure such as a mucosal muscle plate is clearly extracted is obtained although many high-frequency noise components are included.
- the image data obtained in this way is input to the AND unit 450.
- AND processing for extracting overlapping portions of two image data (first and second intermediate image data) input in the AND portion 450 is performed, and AND image data (output image data) ) Is generated.
- the AND image data generated in this way has the advantages of the two input image data (first and second intermediate image data), and the layer structure of interest such as a mucosal muscle plate is clearly shown.
- the extracted high frequency noise component is removed.
- the AND image data is input to the AND image construction unit 460, and an AND image to be displayed on the monitor device 500 is generated based on the AND image data.
- the AND image generated by the AND image constructing unit 460 in this way is displayed on the monitor device 500 and can be diagnosed.
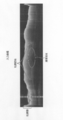
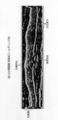
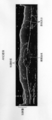
- FIG. 11 shows an intermediate image
- FIG. 12 shows an image (second intermediate image) obtained when high-frequency bandpass filtering (center frequency 10 [mm ⁇ 1 ]) is performed.
- FIG. 13 shows an image (AND image) obtained when AND processing is applied to the image shown in FIG. 11 and the image shown in FIG.
- the input image shown in FIG. 10 is the same as a tomographic image constructed by a tomographic image construction unit 470 (FIG. 17) described later, and this corresponds to a grace scale tomographic image obtained by conventional OCT signal processing. .
- a tomographic image construction unit 470 FIG. 17
- FIG. 17 an image obtained when sector scanning is performed from above the subject (measurement target S) using the galvanometer mirror 900 described in FIG. 7 is shown.
- the images shown in FIG. 13 are generated by performing AND processing on these images. According to this, the high-frequency noise component is removed, the image of the mucosal muscle plate as the layer structure of interest is clearly depicted, and the boundary (edge) between the mucosal muscle plate and its adjacent layer is also clearly separated. Is displayed.
- FIGS. 11 to 13 are displayed in black and white due to the limitations of the drawings, but the pseudo color (red in this example) is actually applied to the portion displayed in light gray. This makes it easier to recognize the target structure.
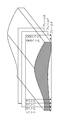
- FIG. 14 is a diagram showing the relationship between the normal mucosal layer of the main digestive tract and the thickness of the mucosal muscle plate. As shown in FIG. 14, generally, the thickness of the mucosa layer and the mucosal muscle plate in the digestive tract varies depending on the region. Despite the fact that the thickness of the mucosal layer and mucosal fascia varies depending on the measurement site, if the center frequency of the low-frequency bandpass filter and the high-frequency bandpass filter is fixed uniformly, depending on the measurement site, the layer structure of interest May not be extracted properly or noise components may not be removed.
- the center frequencies of the low-frequency bandpass filter and the high-frequency bandpass filter it is desirable to change the center frequencies of the low-frequency bandpass filter and the high-frequency bandpass filter according to the measurement site (that is, the type of the measurement target S).
- the mucosal layer thickness at the measurement site is a [ ⁇ m] and the mucosal muscle plate thickness is b [ ⁇ m] (where a> b)
- the center frequency of the low-frequency bandpass filter is 1 / 2a to 1 / 2b [mm ⁇ 1 ] (half cycle b to a [ ⁇ m])
- the center frequency of the high-frequency bandpass filter is 1/2 b [mm ⁇ 1 ] (half cycle b [ ⁇ m]).
- the layer structure of interest such as the mucosal muscle plate can be accurately depicted without being affected by the thickness of the mucosa layer or mucosal muscle plate at the measurement site. It becomes possible to do.
- the method for identifying the measurement site is not particularly limited.
- the following method is conceivable.
- an identification ID for identifying the measurement site is provided in the insertion unit 114 of the endoscope 100, and the signal processing unit 22 performs low-frequency bandpass based on the identification ID read by a reading device (not shown).
- the center frequency of the filter and the high-frequency bandpass filter is changed, and various processes are executed.
- the signal processing unit 22 stores the thickness of the mucosa layer and the mucosal muscle plate of the measurement site corresponding to the identification ID in a data table and stored in a storage unit (not shown). According to such an identification method, the measurement site is identified by performing a simple operation, and the center frequencies of the low-frequency bandpass filter and the high-frequency bandpass filter are automatically changed based on the result. The burden on the operator can be reduced.
- the monitor device 500 displays an observation image (endoscope image) 510 obtained by the endoscope 100 on the left side of the display screen, and signals of the OCT processor 400 on the right side thereof.
- An image (OCT image) 520 generated by the processing unit 22 is displayed.
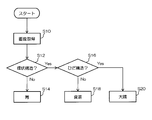
- FIG. 16 is a flowchart showing an example of a method for identifying a measurement site based on an endoscopic image.
- the signal processing unit 22 acquires an endoscopic image (step S10).
- the endoscope image is acquired from the endoscope processor 200 that generates an endoscope image.
- the signal processing unit 22 determines whether or not an annular structure exists in the acquired endoscopic image (step S14). When it is determined that no annular structure exists in the endoscopic image, the measurement site is identified as the stomach (step S16).
- step S18 it is further determined whether or not a pleat structure is present in the endoscopic image. If it is determined that no pleat structure exists in the endoscopic image, the measurement site is identified as the esophagus (step S20). On the other hand, if it is determined that a pleat structure exists in the endoscopic image, the measurement site is identified as the large intestine.
- the signal processing unit 22 reads the thickness of the mucosa layer and the mucosal muscle plate of the measurement site specified as described above from the storage unit (not shown), and according to the thickness of the mucosa layer and the mucosal muscle plate of the measurement site.
- the center frequency of the low frequency band pass filter and the high frequency band pass filter is set, and the above-described various processes are executed.
- the image data that has been subjected to the low-frequency filtering process (first intermediate image data) and the image data that has been subjected to the high-frequency filtering process (second intermediate image data)
- the process (AND process) for extracting the overlapping parts of the above it is possible to obtain an image in which the high-frequency noise component is removed and the layer structure of interest such as the mucosal muscle plate is clearly extracted.
- the process (AND process) for extracting the overlapping parts of the above By performing the process (AND process) for extracting the overlapping parts of the above, it is possible to obtain an image in which the high-frequency noise component is removed and the layer structure of interest such as the mucosal muscle plate is clearly extracted.
- the region where the mucosal muscle plate has not been extracted is due to the tear of the mucosal muscle plate.
- FIG. 17 is a block diagram showing a configuration of a signal processing unit according to the second embodiment.
- elements that are the same as or similar to those in FIG. 17 are the same as or similar to those in FIG. 17
- the signal processing unit 22B as the second embodiment further includes a tomographic image construction unit 470 and an image composition unit 480 in addition to the configuration of the first embodiment (see FIG. 9). Yes.
- the tomographic image construction unit 470 is a processing unit that constructs a normal tomographic image in the same manner as in the past, and the image data (input image data) generated by the logarithmic conversion unit 420 is input, and the monitor device 500 uses the image data.
- a tomographic image is constructed in accordance with the display method. Specifically, a tomographic image is constructed by adjusting brightness and contrast, resampling in accordance with the display size, coordinate conversion in accordance with a scanning method such as radial scanning and sector scanning.
- the image composition unit 480 combines the tomographic image constructed by the tomographic image construction unit 470 and the AND image constructed by the AND image construction unit 460, and outputs the synthesized image to the monitor device 500.
- the image composition method in the image composition unit 480 is preferably a method in which the tomographic image and the AND image are added and combined at a preset ratio.
- Composite image tomographic image + ⁇ ⁇ AND image (0 ⁇ ⁇ 1)
- Composite image (1- ⁇ ) ⁇ tomographic image + ⁇ ⁇ AND image (0 ⁇ ⁇ 1)
- the image composition method is not limited to these, and any generally used method such as a method of superimposing an AND image on a tomographic image may be used.
- the synthesized image output from the image synthesizing unit 480 is displayed on the monitor device 500 and can be diagnosed.
- the attention layer structure can be easily identified. This makes it possible to more reliably determine whether or not the region where the mucosal muscle plate has not been extracted is due to the tear of the mucosal muscle plate. As a result, it becomes easier to determine whether the cancer has infiltrated the mucosal fascia.
- the SS-OCT (Swept Source OCT) apparatus has been described as the OCT processor 400.
- the present invention is not limited to this, and the OCT processor 400 can also be applied as an SD-OCT (SpectralDomain OCT) apparatus. Is possible.
- optical tomographic imaging apparatus and optical tomographic imaging method of the present invention have been described in detail above, but the present invention is not limited to the above examples, and various improvements and modifications can be made without departing from the spirit of the present invention. Of course, deformation may be performed.
- DESCRIPTION OF SYMBOLS 10 ... Diagnostic imaging apparatus, 20 ... Interference light detection part, 20a ... Interference signal generation part, 20b ... AD conversion part, 22 ... Signal processing part, 100 ... Endoscope, 200 ... Endoscope processor, 300 ... Light source device, 400 ... OCT processor, 410 ... Fourier transform unit, 420 ... logarithmic transform unit, 430 ... low frequency filtering unit, 432 ... low frequency BPF unit, 434 ... binarization processing unit, 440 ... high frequency filtering unit, 442 ... high frequency BPF unit 444, binarization processing unit, 450, AND unit, 460, AND image construction unit, 470, tomographic image construction unit, 480, image composition unit, 490, control unit, 500, monitor device
Landscapes
- Health & Medical Sciences (AREA)
- Life Sciences & Earth Sciences (AREA)
- Engineering & Computer Science (AREA)
- Physics & Mathematics (AREA)
- Surgery (AREA)
- Public Health (AREA)
- Pathology (AREA)
- Veterinary Medicine (AREA)
- Biomedical Technology (AREA)
- Heart & Thoracic Surgery (AREA)
- Medical Informatics (AREA)
- Molecular Biology (AREA)
- Biophysics (AREA)
- Animal Behavior & Ethology (AREA)
- General Health & Medical Sciences (AREA)
- Nuclear Medicine, Radiotherapy & Molecular Imaging (AREA)
- Radiology & Medical Imaging (AREA)
- Mathematical Physics (AREA)
- Artificial Intelligence (AREA)
- Computer Vision & Pattern Recognition (AREA)
- Physiology (AREA)
- Psychiatry (AREA)
- Signal Processing (AREA)
- Investigating Or Analysing Materials By Optical Means (AREA)
- Endoscopes (AREA)
Abstract
OCTプロセッサ400の信号処理装置22は、干渉信号から測定対象の断層情報を生成するフーリエ変換部410と、測定対象の断層情報を対数変換して入力画像データを生成する対数変換部420と、入力画像データに低周波バンドパスフィルタリング処理を施して第1の中間画像データを生成する低周波フィルタリング部430と、入力画像データに高周波バンドパスフィルタリング処理を施して第2の中間画像データを生成する高周波フィルタリング部440と、第1及び第2の中間画像データの重複部分を抽出することによりAND画像データを生成するAND部450と、AND画像データからモニタ装置500の表示画像を生成するAND画像データ構築部460とを備え、例えば粘膜筋板のような注目層構造の画像を明瞭に描出可能にする。
Description
本発明は光断層画像化装置及び光断層画像化方法に係り、特に、例えば粘膜筋板のような注目層構造の画像を明瞭に描出可能な光断層画像化装置及び光断層画像化方法に関する。
近年、例えば医療分野などで、非侵襲で生体内部の断層像を得る方法の一つとして、光コヒーレンストモグラフィ(OCT)計測が利用されるようになってきた。このOCT計測は超音波計測に比べ、分解能が10μm程度と一桁高く、生体内部の詳細な断層像が得られるという利点がある。また、断層像に垂直な方向に位置をずらしながら複数画像を取得して3次元断層像を得ることができる。
現在、癌の診断等の目的で生体の詳細な断層像を取得することが求められている。その方法として、従来から低干渉性光源から出力される光を走査して被検体に対する断層像を得る「Time domain OCT」が提案されている(特許文献1)。
また、近年は「Time domain OCT」の欠点である最適な信号/ノイズ比(S/N比)が得られない、撮像フレームレートが低い、浸透深度(観察深度)が乏しいという問題を解決した改良型のOCTである周波数ドメインOCT(Frequency domain OCT)(特許文献2、非特許文献1)が利用されている。
一方、他の診断領域でも周波数ドメインOCT(Frequency domain OCT)が利用されていて、広く臨床に供されている。
また、OCT断層画像に関して、画像データに対して前処理(平滑化、平均処理等)を行った後、深度方向に微分フィルタを適用して、層の境界に対応する画素位置を特定する技術が開示されている(特許文献3、特許文献4)。
周波数ドメインOCT(Frequency domain OCT)計測を行う装置構成で代表的なものとしては、SD-OCT(Spectral Domain OCT)装置とSS-OCT(Swept Source OCT)の2種類が挙げられる。
SD-OCT装置は、SLD(Super Luminescence Diode)やASE(Amplified Spontaneous Emission)光源、白色光といった広帯域の低コヒーレント光を光源に用い、マイケルソン型干渉計等を用いて、広帯域の低コヒーレント光を測定光と参照光とに分割した後、測定光を測定対象に照射させ、そのとき戻ってきた反射光と参照光とを干渉させ、この干渉光をスペクトロメータを用いて各周波数成分に分解し、フォトダイオード等の素子がアレイ状に配列されたディテクタアレイを用いて各周波数成分毎の干渉光強度を測定し、これにより得られたスペクトル干渉強度信号を計算機でフーリエ変換することにより、光断層画像を構成するようにしたものである。
一方、SS-OCT装置は、光周波数を時間的に掃引させるレーザを光源に用い、反射光と参照光とを各波長において干渉させ、光周波数の時間変化に対応した信号の時間波形を測定し、これにより得られたスペクトル干渉強度信号を計算機でフーリエ変換することにより光断層画像を構成するようにしたものである。
ところで、OCT計測は上述したように特定の領域の光断層画像を取得する方法であるが、内視鏡下では、例えば癌病変部を通常照明光内視鏡や特殊光内視鏡の観察により発見し、その領域をOCT測定することで、癌病変部がどこまで浸潤しているかを見わけることが可能となる。また、測定光の光軸を2次元的に走査することで、OCT計測による深さ情報と合わせて3次元的な情報を取得することができる。
OCT計測と3次元コンピュータグラフィック技術の融合により、マイクロメートルオーダの分解能を持つ測定対象の構造情報からなる3次元構造モデルを表示することが可能となる。以下では、このOCT計測による3次元構造モデルを3次元ボリュームデータと呼ぶ。
Optics Express, Vol.11, Issue22, pp.2953-2963 "High-speed optical frequency-domain imaging"
しかしながら、一般的に癌の診断において、例えば癌が粘膜筋板層を浸潤しているか否かが治療方針に大きくかかわるが、非特許文献1等の従来技術のOCTでは反射光の強度をグレースケールや、インデックスカラーを用いて表示するのみでその識別が難しいという問題がある。
一方、眼科領域で用いられている特許文献3、特許文献4等の従来技術では、眼底の層構造の抽出を行っているが、この診断分野では比較的観察深度が浅い範囲での観察のため、一旦画像化した後の画像データに対して平滑化、平均処理等の処理を行っても、容易に層構造の抽出が行えるが、深い部位に存在する例えば粘膜筋板の描出が要求される消化器用のOCTでは、深部では、S/Nが悪いため、同様の手法では、粘膜筋板の描出は困難である。
本発明は、このような事情に鑑みてなされたもので、例えば粘膜筋板のような注目層構造の画像を明瞭に描出可能な光断層画像化装置及び光断層画像化方法を提供することを目的とする。
前記目的を達成するために、本発明の第1態様の光断層画像化装置は、波長掃引光源から射出される光を測定光と参照光に分割し、前記測定光にて測定対象に照射し、該測定対象からの反射光と前記参照光とを合波し、前記反射光と前記参照光が合波したときの干渉光を干渉信号として検出し、該干渉信号を用いて前記測定対象の断層画像を取得する光断層画像化装置であって、前記干渉信号をフーリエ変換して前記測定対象の断層情報を生成するフーリエ変換部と、前記測定対象の断層情報を対数変換して入力画像データを生成する対数変換部と、中心周波数が異なる少なくとも2種類の周波数フィルタのうち、中心周波数が低い方の第1の周波数フィルタを用いて前記入力画像データに対してフィルタリング処理を施すことにより第1の中間画像データを生成する第1のフィルタリング部と、前記少なくとも2種類の周波数フィルタのうち、中心周波数が高い方の第2の周波数フィルタを用いて前記入力画像データに対してフィルタリング処理を施すことにより第2の中間画像データを生成する第2のフィルタリング部と、前記第1の中間画像データと前記第2の中間画像データとの重複部分を抽出することにより出力画像データを生成するAND処理部と、前記出力画像データからモニタ部に表示するための画像を生成する画像生成部と、を備える。
本発明の第1態様によれば、第1の周波数フィルタ(低周波フィルタ)によるフィルタリング処理により生成された第1の中間画像データと、第2の周波数フィルタ(高周波フィルタ)によるフィルタリング処理により生成された第2の中間画像データとの重複部分を抽出する処理(AND処理)を行うことにより、高周波のノイズ成分が除去され、且つ、例えば粘膜筋板のような注目層構造が明瞭に抽出された画像を取得することができる。
本発明の第2態様の光断層画像化装置は、第1態様の光断層画像化装置であって、前記測定対象の種類に応じて前記第1又は第2の周波数フィルタの中心周波数を変更する中心周波数変更部を備えたものである。
本発明の第3態様の光断層画像化装置は、第2態様の光断層画像化装置であって、前記中心周波数変更部は、前記第1の周波数フィルタの中心周波数を前記測定対象の注目層構造の厚み及び該注目層構造の隣接層の厚みを基に決定するものである。
本発明の第4態様の光断層画像化装置は、第2態様又は第3態様の光断層画像化装置であって、前記中心周波数変更部は、前記第2の周波数フィルタの中心周波数を前記測定対象の注目層構造の厚みを基に決定するものである。
本発明の第5態様の光断層画像化装置は、第2態様乃至第4態様のいずれか1態様の光断層画像化装置であって、前記測定対象の種類を識別する測定対象識別部を備え、前記中心周波数変更部は、前記測定対象識別部により識別された結果に基づき、前記第1又は第2の周波数フィルタの中心周波数を変更するものである。
本発明の第6態様の光断層画像化装置は、第5態様の光断層画像化装置であって、前記測定対象識別部は、被検体内に挿入される内視鏡挿入部に付与された識別IDに基づき、前記測定対象の種類を識別するものである。
本発明の第7態様の光断層画像化装置は、第5態様の光断層画像化装置であって、前記測定対象識別部は、内視鏡画像から前記測定対象の種類を識別するものである。
本発明の第8態様の光断層画像化装置は、第1態様乃至第7態様のいずれか1態様の光断層画像化装置であって、前記第1のフィルタリング部は、前記入力画像データに対して前記第1の周波数フィルタによりフィルタリング処理を施した後、さらに二値化処理を行うことにより、前記第1の中間画像データを生成するものである。
本発明の第9態様の光断層画像化装置は、第1態様乃至第8態様のいずれか1態様の光断層画像化装置であって、前記第2のフィルタリング部は、前記入力画像データに対して前記第2の周波数フィルタによりフィルタリング処理を施した後、さらに二値化処理を行うことにより、前記第2の中間画像データを生成するものである。
本発明の第10態様の光断層画像化装置は、第1態様乃至第9態様のいずれか1態様の光断層画像化装置であって、前記画像生成部により生成された画像と前記断層画像をあらかじめ設定した割合で加算することにより合成画像を生成する画像合成部を備えたものである。
また、前記目的を達成するために、本発明の第11態様の光断層画像化方法は、波長掃引光源から射出される光を測定光と参照光に分割し、前記測定光にて測定対象に照射し、該測定対象からの反射光と前記参照光とを合波し、前記反射光と前記参照光が合波したときの干渉光を干渉信号として検出し、該干渉信号を用いて前記測定対象の断層画像を取得する光断層画像化方法であって、前記干渉信号をフーリエ変換して前記測定対象の断層情報を生成するフーリエ変換ステップと、前記測定対象の断層情報を対数変換して入力画像データを生成する対数変換ステップと、中心周波数が異なる少なくとも2種類の周波数フィルタのうち、中心周波数が低い方の第1の周波数フィルタを用いて前記入力画像データに対してフィルタリング処理を施すことにより第1の中間画像データを生成する第1のフィルタリングステップと、前記少なくとも2種類の周波数フィルタのうち、中心周波数が高い方の第2の周波数フィルタを用いて前記入力画像データに対してフィルタリング処理を施すことにより第2の中間画像データを生成する第2のフィルタリングステップと、前記第1の中間画像データと前記第2の中間画像データとの重複部分を抽出することにより出力画像データを生成するAND処理ステップと、前記出力画像データからモニタ部に表示するための画像を生成する画像生成ステップと、を含む。
本発明の第11態様によれば、第1の周波数フィルタ(低周波フィルタ)によるフィルタリング処理により生成された第1の中間画像データと、第2の周波数フィルタ(高周波フィルタ)によるフィルタリング処理により生成された第2の中間画像データとの重複部分を抽出する処理(AND処理)を行うことにより、高周波のノイズ成分が除去され、且つ、例えば粘膜筋板のような注目層構造が明瞭に抽出された画像を取得することができる。
本発明の第12態様の光断層画像化方法は、第11態様の光断層画像化方法であって、前記測定対象の種類に応じて前記第1又は第2の周波数フィルタの中心周波数を変更する中心周波数変更ステップを含むものである。
本発明の第13態様の光断層画像化方法は、第12態様の光断層画像化方法であって、前記中心周波数変更ステップは、前記第1の周波数フィルタの中心周波数を前記測定対象の注目層構造の厚み及び該注目層構造の隣接層の厚みを基に決定するものである。
本発明の第14態様の光断層画像化方法は、第12態様又は第13態様の光断層画像化方法であって、前記中心周波数変更ステップは、前記第2の周波数フィルタの中心周波数を前記測定対象の注目層構造の厚みを基に決定するものである。
本発明の第15態様の光断層画像化方法は、第12態様乃至第14態様のいずれか1態様の光断層画像化方法であって、前記測定対象の種類を識別する測定対象識別ステップを含み、前記中心周波数変更ステップは、前記測定対象識別ステップにより識別された結果に基づき、前記第1又は第2の周波数フィルタの中心周波数を変更するものである。
本発明の第16態様の光断層画像化方法は、第15態様の光断層画像化方法であって、前記測定対象識別ステップは、被検体内に挿入される内視鏡挿入部に付与された識別IDに基づき、前記測定対象の種類を識別するものである。
本発明の第17態様の光断層画像化方法は、第15態様の光断層画像化方法であって、前記測定対象識別ステップは、内視鏡画像から前記測定対象の種類を識別するものである。
本発明の第18態様の光断層画像化方法は、第11態様乃至第17態様のいずれか1態様の光断層画像化方法であって、前記第1のフィルタリングステップは、前記入力画像データに対して前記第1の周波数フィルタによりフィルタリング処理を施した後、さらに二値化処理を行うことにより、前記第1の中間画像データを生成するものである。
本発明の第19態様の光断層画像化方法は、第11態様乃至第18態様のいずれか1態様の光断層画像化方法であって、前記第2のフィルタリングステップは、前記入力画像データに対して前記第2の周波数フィルタによりフィルタリング処理を施した後、さらに二値化処理を行うことにより、前記第2の中間画像データを生成するものである。
本発明の第20態様の光断層画像化方法は、第11態様乃至第19態様のいずれか1態様の光断層画像化方法であって、前記画像生成ステップにより生成された画像と前記断層画像をあらかじめ設定した割合で加算することにより合成画像を生成する画像合成ステップを含むものである。
本発明によれば、第1の周波数フィルタ(低周波フィルタ)によるフィルタリング処理により生成された第1の中間画像データと、第2の周波数フィルタ(高周波フィルタ)によるフィルタリング処理により生成された第2の中間画像データとの重複部分を抽出する処理(AND処理)を行うことにより、高周波のノイズ成分が除去され、且つ、例えば粘膜筋板のような注目層構造が明瞭に抽出された画像を取得することができる。
以下、添付図面に従って本発明の好ましい実施の形態について詳説する。
〔第1の実施形態〕
まず、本発明の第1の実施形態について説明する。
まず、本発明の第1の実施形態について説明する。
<画像診断装置の外観>
図1は本発明の第1の実施形態に係る光断層画像化装置を用いた画像診断装置を示す外観図である。
図1は本発明の第1の実施形態に係る光断層画像化装置を用いた画像診断装置を示す外観図である。
図1に示すように、画像診断装置10は、主として内視鏡100、内視鏡プロセッサ200、光源装置300、光断層画像化装置としてのOCTプロセッサ400、及びモニタ装置500とから構成されている。なお、内視鏡プロセッサ200は、光源装置300を内蔵するように構成されていてもよい。
内視鏡100は、手元操作部112と、この手元操作部112に連設される挿入部114とを備える。術者は手元操作部112を把持して操作し、挿入部114を被検者の体内に挿入することによって観察を行う。
手元操作部112には、鉗子挿入部138が設けられており、この鉗子挿入部138が先端部144の鉗子口156に連通されている。本実施形態では、OCTプローブ600を鉗子挿入部138から挿入することによって、OCTプローブ600を鉗子口156から導出する。OCTプローブ600は、鉗子挿入部138から挿入され、鉗子口156から導出される挿入部602と、術者がOCTプローブ600を操作するための操作部604、及びコネクタ610を介してOCTプロセッサ400と接続されるケーブル606から構成されている。
<内視鏡、内視鏡プロセッサ、光源装置の構成>
[内視鏡]
内視鏡100の先端部144には、観察光学系150、照明光学系152、及びCCD(不図示)が配設されている。
[内視鏡]
内視鏡100の先端部144には、観察光学系150、照明光学系152、及びCCD(不図示)が配設されている。
観察光学系150は、被検体を図示しないCCDの受光面に結像させ、CCDは受光面上に結像された被検体像を各受光素子によって電気信号に変換する。本実施形態のCCDは、3原色の赤(R)、緑(G)、青(B)のカラーフィルタが所定の配列(ベイヤー配列、ハニカム配列)で各画素毎に配設されたカラーCCDである。
なお、符号154は、観察光学系150に向けて洗浄液や加圧エアを供給するための洗浄ノズルである。
[光源装置]
光源装置300は、可視光を図示しないライトガイドに入射させる。ライトガイドの一端はLGコネクタ120を介して光源装置300に接続され、ライトガイドの他端は照明光学系152に対面している。光源装置300から発せられた光は、ライトガイドを経由して照明光学系152から出射され、観察光学系150の視野範囲を照明する。
光源装置300は、可視光を図示しないライトガイドに入射させる。ライトガイドの一端はLGコネクタ120を介して光源装置300に接続され、ライトガイドの他端は照明光学系152に対面している。光源装置300から発せられた光は、ライトガイドを経由して照明光学系152から出射され、観察光学系150の視野範囲を照明する。
[内視鏡プロセッサ]
内視鏡プロセッサ200には、CCDから出力される画像信号が電気コネクタ110を介して入力される。このアナログの画像信号は、内視鏡プロセッサ200内においてデジタルの画像信号に変換され、モニタ装置500の画面に表示するための必要な処理が施される。
内視鏡プロセッサ200には、CCDから出力される画像信号が電気コネクタ110を介して入力される。このアナログの画像信号は、内視鏡プロセッサ200内においてデジタルの画像信号に変換され、モニタ装置500の画面に表示するための必要な処理が施される。
このように、内視鏡100で得られた観察画像のデータが内視鏡プロセッサ200に出力され、内視鏡プロセッサ200に接続されたモニタ装置500に画像が表示される。
<OCTプロセッサ、OCTプローブの内部構成>
図2は図1のOCTプロセッサの内部構成を示すブロック図である。
図2は図1のOCTプロセッサの内部構成を示すブロック図である。
[OCTプロセッサ]
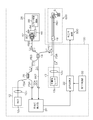
図2に示すOCTプロセッサ400及びOCTプローブ600は、光干渉断層(OCT:Optical Coherence Tomography)計測法による測定対象の光断層画像を取得するためのもので、測定のための光Laを射出する第1の光源部(第1の光源ユニット)12と、第1の光源部12から射出された光Laを測定光(第1の光束)L1と参照光L2とに分岐するとともに、被検体である測定対象Sからの戻り光L3と参照光L2とを合波して干渉光L4を生成する光ファイバカプラ(分岐合波部)14と、光ファイバカプラ14で分岐された測定光L1を測定対象まで導波するとともに測定対象からの戻り光L3を導波する回転側光ファイバFB1を備えるOCTプローブ600と、測定光L1を回転側光ファイバFB1まで導波するとともに回転側光ファイバFB1によって導波された戻り光L3を導波する固定側光ファイバFB2と、回転側光ファイバFB1を固定側光ファイバFB2に対して回転可能に接続し、測定光L1および戻り光L3を伝送する光コネクタ18と、光ファイバカプラ14で生成された干渉光L4を干渉信号として検出する干渉光検出部20と、この干渉光検出部20によって検出された干渉信号を処理して光断層画像(以下、単に「断層画像」とも言う。)を取得する信号処理部22とを有する。また、信号処理部22で取得された光断層画像はモニタ装置500に表示される。
図2に示すOCTプロセッサ400及びOCTプローブ600は、光干渉断層(OCT:Optical Coherence Tomography)計測法による測定対象の光断層画像を取得するためのもので、測定のための光Laを射出する第1の光源部(第1の光源ユニット)12と、第1の光源部12から射出された光Laを測定光(第1の光束)L1と参照光L2とに分岐するとともに、被検体である測定対象Sからの戻り光L3と参照光L2とを合波して干渉光L4を生成する光ファイバカプラ(分岐合波部)14と、光ファイバカプラ14で分岐された測定光L1を測定対象まで導波するとともに測定対象からの戻り光L3を導波する回転側光ファイバFB1を備えるOCTプローブ600と、測定光L1を回転側光ファイバFB1まで導波するとともに回転側光ファイバFB1によって導波された戻り光L3を導波する固定側光ファイバFB2と、回転側光ファイバFB1を固定側光ファイバFB2に対して回転可能に接続し、測定光L1および戻り光L3を伝送する光コネクタ18と、光ファイバカプラ14で生成された干渉光L4を干渉信号として検出する干渉光検出部20と、この干渉光検出部20によって検出された干渉信号を処理して光断層画像(以下、単に「断層画像」とも言う。)を取得する信号処理部22とを有する。また、信号処理部22で取得された光断層画像はモニタ装置500に表示される。
また、OCTプロセッサ400は、測定の目印を示すためのエイミング光(第2の光束)Leを射出する第2の光源部(第2の光源ユニット)13と、参照光L2の光路長を調整する光路長調整部26と、第1の光源部12から射出された光Laを分岐させる光ファイバカプラ28と、光ファイバカプラ14で合波された戻り光L4およびL5を検出する検出器30aおよび30bと、信号処理部22への各種条件の入力、設定の変更等を行う操作制御部32とを有する。
なお、図2に示すOCTプロセッサ400においては、上述した射出光La、エイミング光Le、測定光L1、参照光L2および戻り光L3などを含む種々の光を各光デバイスなどの構成要素間で導波し、伝送するための光の経路として、回転側光ファイバFB1および固定側光ファイバFB2を含め種々の光ファイバFB(FB3、FB4、FB5、FB6、FB7、FB8など)が用いられている。
第1の光源部12は、OCTの測定のための光(例えば、波長1.3μmのレーザ光あるいは低コヒーレンス光)を射出するものであり、この第1の光源部12は周波数を一定の周期で掃引させながら、赤外領域である、例えば波長1.3μmを中心とするレーザ光Laを射出する光源である。この第1の光源部12は、レーザ光あるいは低コヒーレンス光Laを射出する光源12aと、光源12aから射出された光Laを集光するレンズ12bとを備えている。また、詳しくは後述するが、第1の光源部12から射出された光Laは、光ファイバFB4、FB3を介して光ファイバカプラ14で測定光L1と参照光L2に分割され、測定光L1は光コネクタ18に入力される。
また、第2の光源部13は、エイミング光Leとして測定部位を確認しやすくするために可視光を射出するものである。例えば、波長0.66μmの赤半導体レーザ光、波長0.63μmのHe-Neレーザ光、波長0.405μmの青半導体レーザ光などを用いることができる。そこで、第2の光源部13としては、例えば赤色あるいは青色あるいは緑色のレーザ光を射出する半導体レーザ13aと、半導体レーザ13aから射出されたエイミング光Leを集光するレンズ13bとを備えている。第2の光源部13から射出されたエイミング光Leは、光ファイバFB8を介して光コネクタ18に入力される。
光コネクタ18では、測定光L1とエイミング光Leとが合波され、OCTプローブ600内の回転側光ファイバFB1に導波される。
光ファイバカプラ(分岐合波部)14は、例えば2×2の光ファイバカプラで構成されており、固定側光ファイバFB2、光ファイバFB3、光ファイバFB5、光ファイバFB7とそれぞれ光学的に接続されている。
光ファイバカプラ14は、第1の光源部12から光ファイバFB4およびFB3を介して入射した光Laを測定光(第1の光束)L1と参照光L2とに分割し、測定光L1を固定側光ファイバFB2に入射させ、参照光L2を光ファイバFB5に入射させる。
さらに、光ファイバカプラ14は、光ファイバFB5に入射され後述する光路長調整部26によって周波数シフトおよび光路長の変更が施されて光ファイバFB5を戻った光L2と、後述するOCTプローブ600で取得され固定側光ファイバFB2から導波された光L3とを合波し、光ファイバFB3(FB6)および光ファイバFB7に射出する。
OCTプローブ600は、光コネクタ18を介して、固定側光ファイバFB2と接続されており、固定側光ファイバFB2から、光コネクタ18を介して、エイミング光Leと合波された測定光L1が回転側光ファイバFB1に入射される。入射されたこのエイミング光Leと合波された測定光L1を回転側光ファイバFB1によって伝送して測定対象Sに照射する。そして測定対象Sからの戻り光L3を取得し、取得した戻り光L3を回転側光ファイバFB1によって伝送して、光コネクタ18を介して、固定側光ファイバFB2に射出するようになっている。
光コネクタ18は、測定光(第1の光束)L1とエイミング光(第2の光束)Leとを合波するものである。
干渉光検出部20は、光ファイバFB6および光ファイバFB7と接続されており、光ファイバカプラ14で参照光L2と戻り光L3とを合波して生成された干渉光L4およびL5を干渉信号として検出するものである。
ここで、OCTプロセッサ400は、光ファイバカプラ28から分岐させた光ファイバFB6上に設けられた、干渉光L4の光強度を検出する検出器30aと、光ファイバFB7の光路上に干渉光L5の光強度を検出する検出器30bとを有している。
干渉光検出部20は、検出器30aおよび検出器30bの検出結果に基づいて、干渉信号を生成する。
信号処理部22は、干渉光検出部20で検出した干渉信号から画像データを生成し、当該画像データに対して各種処理を施して得られる画像をモニタ装置500へ出力する。
光路長調整部26は、光ファイバFB5の参照光L2の射出側(すなわち、光ファイバFB5の光ファイバカプラ14とは反対側の端部)に配置されている。
光路長調整部26は、光ファイバFB5から射出された光を平行光にする第1光学レンズ80と、第1光学レンズ80で平行光にされた光を集光する第2光学レンズ82と、第2光学レンズ82で集光された光を反射する反射ミラー84と、第2光学レンズ82および反射ミラー84を支持する基台86と、基台86を光軸方向に平行な方向に移動させるミラー移動機構88とを有し、第1光学レンズ80と第2光学レンズ82との距離を変化させることで参照光L2の光路長を調整する。
第1光学レンズ80は、光ファイバFB5のコアから射出された参照光L2を平行光にするとともに、反射ミラー84で反射された参照光L2を光ファイバFB5のコアに集光する。
また、第2光学レンズ82は、第1光学レンズ80により平行光にされた参照光L2を反射ミラー84上に集光するとともに、反射ミラー84により反射された参照光L2を平行光にする。このように、第1光学レンズ80と第2光学レンズ82とにより共焦点光学系が形成されている。
さらに、反射ミラー84は、第2光学レンズ82で集光される光の焦点に配置されており、第2光学レンズ82で集光された参照光L2を反射する。
これにより、光ファイバFB5から射出した参照光L2は、第1光学レンズ80により平行光になり、第2光学レンズ82により反射ミラー84上に集光される。その後、反射ミラー84により反射された参照光L2は、第2光学レンズ82により平行光になり、第1光学レンズ80により光ファイバFB5のコアに集光される。
また、基台86は、第2光学レンズ82と反射ミラー84とを固定し、ミラー移動機構88は、基台86を第1光学レンズ80の光軸方向(図2矢印A方向)に移動させる。
ミラー移動機構88で、基台86を矢印A方向に移動させることで、第1光学レンズ80と第2光学レンズ82との距離を変更することができ、参照光L2の光路長を調整することができる。
操作制御部32は、キーボード、マウス等の入力手段と、入力された情報に基づいて各種条件を管理する制御手段とを有し、信号処理部22に接続されている。操作制御部32は、入力手段から入力されたオペレータの指示に基づいて、信号処理部22における各種処理条件等の入力、設定、変更等を行う。
なお、操作制御部32は、操作画面をモニタ装置500に表示させてもよいし、別途表示部を設けて操作画面を表示させてもよい。また、操作制御部32で、第1の光源部12、第2の光源部13、光コネクタ18、干渉光検出部20、光路長ならびに検出器30aおよび30bの動作制御や各種条件の設定を行うようにしてもよい。
[OCTプローブ]
図3は図2のOCTプローブの断面図である。
図3は図2のOCTプローブの断面図である。
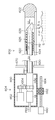
図3に示すように、挿入部602の先端部は、プローブ外筒620と、キャップ622と、回転側光ファイバFB1と、バネ624と、固定部材626と、光学レンズ628とを有している。
プローブ外筒(シース)620は、可撓性を有する筒状の部材であり、光コネクタ18においてエイミング光Leが合波された測定光L1および戻り光L3が透過する材料からなっている。なお、プローブ外筒620は、測定光L1(エイミング光Le)および戻り光L3が通過する先端(光コネクタ18と反対側の回転側光ファイバFB1の先端、以下プローブ外筒620の先端と言う)側の一部が全周に渡って光を透過する材料(透明な材料)で形成されていればよく、先端以外の部分については光を透過しない材料で形成されていてもよい。
キャップ622は、プローブ外筒620の先端に設けられ、プローブ外筒620の先端を閉塞している。
回転側光ファイバFB1は、線状部材であり、プローブ外筒620内にプローブ外筒620に沿って収容されており、固定側光ファイバFB2から射出され、光コネクタ18で光ファイバFB8から射出されたエイミング光Leと合波された測定光L1とを光学レンズ628まで導波するとともに、測定光L1(エイミング光Le)を測定対象Sに照射して光学レンズ628で取得した測定対象Sからの戻り光L3を光コネクタ18まで導波し、固定側光ファイバFB2に入射する。
ここで、回転側光ファイバFB1と固定側光ファイバFB2とは、光コネクタ18によって接続されており、回転側光ファイバFB1の回転が固定側光ファイバFB2に伝達しない状態で、光学的に接続されている。また、回転側光ファイバFB1は、プローブ外筒620に対して回転自在、およびプローブ外筒620の軸方向に移動自在な状態で配置されている。
バネ624は、回転側光ファイバFB1の外周に固定されている。また、回転側光ファイバFB1およびバネ624は、光コネクタ18に接続されている。
光学レンズ628は、回転側光ファイバFB1の測定側先端(光コネクタ18と反対側の回転側光ファイバFB1の先端)に配置されており、先端部が、回転側光ファイバFB1から射出された測定光L1(エイミング光Le)を測定対象Sに対し集光するために略球状の形状で形成されている。
光学レンズ628は、回転側光ファイバFB1から射出した測定光L1(エイミング光Le)を測定対象Sに対し照射し、測定対象Sからの戻り光L3を集光し回転側光ファイバFB1に入射する。
固定部材626は、回転側光ファイバFB1と光学レンズ628との接続部の外周に配置されており、光学レンズ628を回転側光ファイバFB1の端部に固定する。ここで、固定部材626による回転側光ファイバFB1と光学レンズ628との固定方法は、特に限定されず、接着剤により、固定部材626と回転側光ファイバFB1および光学レンズ628を接着させて固定されても、ボルト等を用い機械的構造で固定してもよい。なお、固定部材626は、ジルコニアフェルールやメタルフェルールなど光ファイバの固定や保持あるいは保護のために用いられるものであれば、如何なるものを用いても良い。
また、回転側光ファイバFB1およびバネ624は、後述する回転筒656に接続されており、回転筒656によって回転側光ファイバFB1およびバネ624を回転させることで、光学レンズ628をプローブ外筒620に対し、矢印R2方向に回転させる。また、光コネクタ18は、回転エンコーダを備え、回転エンコーダからの信号に基づいて光学レンズ628の位置情報(角度情報)から測定光L1の照射位置を検出する。つまり、回転している光学レンズ628の回転方向における基準位置に対する角度を検出して、測定位置を検出する。
さらに、回転側光ファイバFB1、バネ624、固定部材626、及び光学レンズ628は、後述する駆動部により、プローブ外筒620内部を矢印S1方向(鉗子口方向)、及びS2方向(プローブ外筒620の先端方向)に移動可能に構成されている。
また、図3左側は、OCTプローブ600の操作部604における回転側光ファイバFB1等の駆動部の概略を示す図である。
プローブ外筒620は、固定部材670に固定されている。これに対し、回転側光ファイバFB1およびバネ624は、回転筒656に接続されており、回転筒656は、モータ652の回転に応じてギア654を介して回転するように構成されている。回転筒656は、光コネクタ18に接続されており、測定光L1及び戻り光L3は、光コネクタ18を介して回転側光ファイバFB1と固定側光ファイバFB2間を伝送される。
また、これらを内蔵するフレーム650は支持部材662を備えており、支持部材662は、図示しないネジ孔を有している。ネジ孔には進退移動用ボールネジ664が咬合しており、進退移動用ボールネジ664には、モータ660が接続されている。したがって、モータ660を回転駆動することによりフレーム650を進退移動させ、これにより回転側光ファイバFB1、バネ624、固定部材626、及び光学レンズ628を図3のS1及びS2方向に移動させることが可能となっている。
OCTプローブ600は、以上のような構成であり、光コネクタ18により回転側光ファイバFB1およびバネ624が、図3中矢印R2方向に回転されることで、光学レンズ628から射出される測定光L1(エイミング光Le)を測定対象Sに対し、矢印R2方向(プローブ外筒620の円周方向)に対し走査しながら照射し、戻り光L3を取得する。エイミング光Leは、測定対象Sに、例えば青色、赤色あるいは緑色のスポット光として照射され、このエイミング光Leの反射光は、モニタ装置500に表示された観察画像に輝点としても表示される。
これにより、プローブ外筒620の円周方向の全周において、測定対象Sの所望の部位を正確にとらえることができ、測定対象Sを反射した戻り光L3を取得することができる。
さらに、3次元ボリュームデータを生成するための複数の断層画像を取得する場合は、駆動部により光学レンズ628が矢印S1方向の移動可能範囲の終端まで移動され、断層画像を取得しながら所定量ずつS2方向に移動し、又は断層画像取得とS2方向への所定量移動を交互に繰り返しながら、移動可能範囲の終端まで移動する。
このように測定対象Sに対して所望の範囲の複数の断層画像を得て、取得した複数の断層画像に基づいて3次元ボリュームデータを得ることができる。
図4は図2の測定対象Sに対して光走査がラジアル走査の場合の断層画像のスキャン面を示す図であり、図5は図4の断層画像により構築される3次元ボリュームデータを示す図である。干渉信号により測定対象Sの深さ方向(第1の方向)の断層画像を取得し、測定対象Sに対し図3矢印R2方向(プローブ外筒620の円周方向)に走査(ラジアル走査)することで、図4に示すように、第1の方向と該第1の方向と直交する第2の方向とからなるスキャン面での断層画像を取得することができる。またさらに、このスキャン面に直交する第3の方向に沿ってスキャン面を移動させることで、図5に示すように、3次元ボリュームデータを生成するための複数の断層画像が取得できる。
図6は図1の内視鏡の鉗子口から導出されたOCTプローブを用いて断層画像を得る様子を示す図である。図6に示すように、OCTプローブの挿入部602の先端部を、測定対象Sの所望の部位に近づけて、断層画像を得る。所望の範囲の複数の断層画像を取得する場合は、OCTプローブ600本体を移動させる必要はなく、前述の駆動部によりプローブ外筒620内で光学レンズ628を移動させればよい。
なお、測定光L1(エイミング光Le)を測定対象Sにラジアル走査するとしたが、これに限らない。図7は図2の測定対象Sに対してセクタ走査を行って断層画像を取得する構成を示す図であり、図8は図7の断層画像により構築される3次元ボリュームデータを示す図である。図7に示すように、ガルバノミラー900を使用し、測定対象Sの上方からセクタ走査を行って断層画像を取得する構成にも適用でき、この場合もスキャン面を移動させることで、図8に示すように、3次元ボリュームデータを生成するための複数の断層画像が取得できる。
[信号処理部]
図9は図2の信号処理部22の構成を示すブロック図である。
図9は図2の信号処理部22の構成を示すブロック図である。
図9に示すように、本実施形態の信号処理部22は、干渉光検出部20から入力される干渉信号からモニタ装置500に出力される画像を生成するための信号処理を行う処理部であり、主として、フーリエ変換部410、対数変換部420、低周波フィルタリング部430、高周波フィルタリング部440、AND部450、AND画像構築部460、及び制御部490を備えて構成される。なお、制御部490は、操作制御部32からの操作信号に基づき信号処理部22の各部を制御する。
干渉光検出部20には、波長掃引光源としての第1の光源部12から射出された光が測定光と参照光とに分割され、OCTプローブ600から測定対象Sに測定光を照射したときに得られる反射光と参照光とが合波したときの干渉光が入力される。この干渉光検出部20は、入力された干渉光(光信号)を干渉信号(電気信号)に変換する干渉信号生成部20aと、干渉信号生成部20aで生成された干渉信号をアナログ信号からデジタル信号に変換するAD変換部20bとから構成される。
AD変換部20bでは、例えば、80MHz程度のサンプリングレートで14bit程度の分解能でアナログ信号からデジタル信号への変換が実施されるが、これらの値に特に限定されるものではない。AD変換部20bにおいてデジタル信号に変換された干渉信号は、信号処理部22のフーリエ変換部410に入力される。
フーリエ変換部410は、干渉光検出部20のAD変換部20bにおいてデジタル信号に変換された干渉信号をFFT(高速フーリエ変換)により周波数解析を行い、測定対象Sの各深さ位置における反射光L3の強度、すなわち深度方向の反射強度データ(断層情報)を生成する。
対数変換部420は、フーリエ変換部410でフーリエ変換されたデータ(断層情報)の対数変換を行い、モニタ装置500に表示される画像の元データとなる画像データ(入力画像データ)を生成する。対数変換部420で生成された画像データは、低周波フィルタリング部430と高周波フィルタリング部440とにそれぞれ入力される。
低周波フィルタリング部430は、低周波バンドパスフィルタ部(低周波BPF部)432と、二値化処理部434とから構成される。
低周波BPF部432は、低周波バンドパスフィルタ(不図示)を備え、対数変換部420から入力された画像データに対して低周波バンドパスフィルタによるフィルタリング(低周波バンドパスフィルタリング)を行う。
低周波バンドパスフィルタは、一般的に知られているガウシアンフィルタやDOGフィルタなどで構成される。なお、低周波バンドフィルタの中心周波数は、後述の高周波BPF442に備えられる高周波バンドパスフィルタの中心周波数よりも低いものとする。
ここで、低周波バンドパスフィルタは、その中心周波数が低いほどノイズ抑制性能は高くなるものの、中心周波数が低すぎると注目層構造(例えば粘膜筋板)とその隣接層との区別ができなくなってしまう場合がある。
このため、本実施形態では、低周波バンドパスフィルタの中心周波数は、注目層構造とその隣接層の厚みに応じて決められることが好ましい。例えば測定対象Sが大腸である場合には、正常な粘膜層の厚みは一般的に450[μm]であり、粘膜筋板の厚みは10~50[μm]であることから、低周波バンドパスフィルタとしては、例えば中心周波数4.16[mm-1](半周期120[μm])のバンドパスフィルタが好ましく用いられる。
二値化処理部434は、低周波BPF部432で低周波バンドパスフィルタリングが施された画像データに対して所定の閾値との比較により二値化処理を行う。二値化処理部434で二値化処理された画像データ(第1の中間画像データ)は、AND部450に入力される。
二値化処理部434では、上記画像データのうち、閾値を超える画像データ(又は閾値未満の画像データ)を粘膜筋板の候補領域として抽出する。但し、閾値の値が大きいほど(又は小さいほど)、二値化処理後の画像データに含まれるノイズ成分は少なくなるが、逆に閾値の値が大きすぎると(又は小さすぎると)、本来抽出されるべき粘膜筋板の候補領域も除外されてしまう場合がある。このため、二値化処理部434では、実験又は経験を通じて最適化された閾値が用いられることが必要である。例えば、従来の計測画像を基に統計的に閾値を決定すればよい。また、閾値は、固定パラメータとして扱ってもよく、術者(観察者)の意図に応じて手動で変えられるようにしてもよい。
高周波フィルタリング部440は、高周波バンドパスフィルタ部(高周波BPF部)442と、二値化処理部444とから構成される。
高周波BPF部442は、前述の低周波バンドパスフィルタよりも高い中心周波数を有する高周波バンドパスフィルタ(不図示)を備え、対数変換部420から入力された画像データに対して高周波バンドパスフィルタによるフィルタリング(高周波バンドパスフィルタリング)を行う。なお、高周波バンドパスフィルタは、低周波バンドパスフィルタと同様に、ガウシアンフィルタやDOGフィルタなどで構成される。
また、本実施形態では、高周波バンドパスフィルタの中心周波数は、注目層構造(例えば粘膜筋板)の厚みに応じて決定されることが好ましい。例えば測定対象Sが大腸である場合、上述のように正常な大腸における粘膜筋板の厚みは10~50[μm]であることから、高周波バンドパスフィルタとしては、例えば中心周波数10[mm-1](半周期50[μm])のバンドパスフィルタが好ましく用いられる。
二値化処理部444は、高周波BPF部442で高周波バンドパスフィルタリングが施された画像データに対して所定の閾値との比較により二値化処理を行う。二値化処理部444で二値化処理された画像データ(第2の中間画像データ)は、AND部450に入力される。
なお、二値化処理部444で用いられる閾値についても、上述の二値化処理部434と同様であり、実験又は経験を通じて最適化された閾値が用いられることが必要である。例えば、従来の計測画像を基に統計的に閾値は決定される。また、閾値は、固定パラメータとして扱ってもよく、術者(観察者)の意図に応じて手動で変えられるようにしてもよい。
AND部450は、低周波フィルタリング部430から入力される画像データ(第1の中間画像データ)と、高周波フィルタリング部440から入力される画像データ(第2の中間画像データ)との論理積、すなわち、各画像データの重複部分を抽出するAND処理(重複部抽出処理)を行い、AND画像データ(出力画像データ)を生成する。AND部450で生成されたAND画像データは、AND画像構築部460に入力される。
AND画像構築部460は、入力されたAND画像データに基づき、モニタ装置500、及びその表示方法にあわせてAND画像を構築する。具体的には、輝度、コントラストの調整、表示サイズにあわせたリサンプル、ラジアル走査、セクタ走査等の走査方法に合わせての座標変換などによりAND画像を構築する。その際、必要に応じて疑似カラーを適用してもよいし、後述する第2の実施形態のように断層画像との重ね合わせを行うようにしてもよい。
次に、上記の如く構成された本実施形態の作用について説明する。
まず、干渉光検出部20で生成された干渉信号が信号処理部22に入力されると、フーリエ変換部410にてFFT(高速フーリエ変換)による周波数解析が行われる。これにより、測定対象Sの深度方向の反射強度データ(断層情報)が生成される。
次に、フーリエ変換部410で生成された断層情報は、対数変換部420で対数変換される。これにより、モニタ装置500に表示される元画像となる画像データ(入力画像データ)が生成される。このようにして生成された画像データは、低周波フィルタリング部430と高周波フィルタリング部440とにそれぞれ入力される。
低周波フィルタリング部430に入力された画像データは、まず、低周波BPF部432において低周波バンドパスフィルタリングが施され、次いで、二値化処理部434において二値化処理が施される。これにより、例えば粘膜筋板のような注目層構造はおおまかに抽出されることになるが、高周波のノイズ成分が除去された画像データ(第1の中間画像データ)を得ることができる。このようにして得られた画像データは、AND部450に入力される。
一方、高周波フィルタリング部440に入力された画像データは、まず、高周波BPF部442において高周波バンドパスフィルタリングが施され、次いで、二値化処理部444において二値化処理が施される。これにより、高周波のノイズ成分は多く含まれるが、粘膜筋板のような層構造が明瞭に抽出された画像データ(第2の中間画像データ)が得られる。このようにして得られた画像データは、AND部450に入力される。
次に、AND部450において入力された2つの画像データ(第1及び第2の中間画像データ)の重複部分を抽出するAND処理(重複部抽出処理)が施され、AND画像データ(出力画像データ)が生成される。このようにして生成されたAND画像データは、入力された2つの画像データ(第1及び第2の中間画像データ)の長所を兼ね備えており、例えば粘膜筋板のような注目層構造が明瞭に抽出され、且つ、高周波のノイズ成分が除去されたものとなる。
そして、AND画像データはAND画像構築部460に入力され、AND画像データに基づき、モニタ装置500に表示されるAND画像が生成される。このようにしてAND画像構築部460で生成されたAND画像はモニタ装置500に表示され、診断が可能となる。
ここで、一例として、図10に示した入力画像(元画像)に対して、低周波バンドパスフィルタリング(中心周波数4.16[mm-1])を施した場合に得られる画像(第1の中間画像)を図11に示し、高周波バンドパスフィルタリング(中心周波数10[mm-1])を施した場合に得られる画像(第2の中間画像)を図12に示す。また、図11に示した画像と図12に示した画像とにAND処理を施した場合に得られる画像(AND画像)を図13に示す。
図10に示した入力画像は、後述の断層画像構築部470(図17)で構築される断層画像と同じものであり、これは従来のOCTの信号処理により得られるグレーススケール断層画像に相当する。ここでは、図7において説明したガルバノミラー900を使用し、被検体(測定対象S)の上方からセクタ走査を行ったときに得られる画像を示している。
一方、図11に示した画像では、高周波成分のノイズが除去されているが、粘膜筋板の候補領域がおおまかに抽出されるので、癌の浸潤により本来破壊されて途切れているはずの粘膜筋板がつながった状態で検出されたり、粘膜筋板とそれに隣接する層(粘膜層)との境界がはっきりせずに1つの層として検出されていたりしてしまう欠点がある。
また、図12に示した画像では、粘膜筋板に隣接する粘膜層との境界(隣接エッジ)が明瞭に抽出されており、粘膜筋板が途切れている部分を容易に識別することが可能となっているものの、高周波のノイズ成分が多く残存してしまうといった欠点がある。
そこで本実施形態では、図11及び図12に示した画像の欠点を補うべく、これらの画像に対してAND処理を施すことにより、図13に示した画像が生成されるようになっている。これによれば、高周波のノイズ成分が除去され、且つ、注目層構造としての粘膜筋板の画像が明瞭に描出され、粘膜筋板とその隣接層との境界(エッジ)も明確に分離されて表示される。
なお、図11~図13に示した画像では、図面の制約上、モノクロで表示されているが、実際には薄くグレーで表示された部分には疑似カラー(本例では赤色)が適用されており、より目的の構造が認識しやすくなっている。
図14は、主な消化器の正常な粘膜層と粘膜筋板の厚みとの関係を示した図である。図14に示すように、一般的に消化器における粘膜層と粘膜筋板は部位によってその厚みが異なる。このように計測部位によって粘膜層や粘膜筋板の厚みが異なるにもかかわらず、低周波バンドパスフィルタ及び高周波バンドパスフィルタの中心周波数が一律に固定されていると、計測部位によっては注目層構造が適切に抽出されなかったり、ノイズ成分が除去されなかったりという不具合が生じる恐れがある。
そこで本実施形態では、低周波バンドパスフィルタ及び高周波バンドパスフィルタの中心周波数は、計測部位(すなわち、測定対象Sの種類)に応じて変更することが望ましい。具体的には、計測部位における粘膜層厚みをa[μm]、粘膜筋板厚みをb[μm]としたとき(但し、a>bとする。)、低周波バンドパスフィルタの中心周波数は1/2a~1/2b[mm-1](半周期b~a[μm])、高周波バンドパスフィルタの中心周波数は1/2b[mm-1](半周期b[μm])とすることが好ましい。このように各フィルタの中心周波数を計測部位に応じて変更することにより、計測部位の粘膜層や粘膜筋板の厚みに左右されることなく、粘膜筋板のような注目層構造を精度良く描出することが可能となる。
また、本実施形態では、計測部位の識別方法としては特に限定されるものではないが、例えば、以下に示すような方法が考えられる。
一般に内視鏡100では、検査や治療の目的によって上部内視鏡や下部内視鏡が存在しており、計測部位の種類によって挿入部114の太さが異なっている。そこで、内視鏡100の挿入部114に計測部位を識別するための識別IDを設けておき、信号処理部22は、読み取り装置(不図示)で読み取られた識別IDに基づき、低周波バンドパスフィルタ及び高周波バンドパスフィルタの中心周波数を変更し、各種処理を実行する。なお、信号処理部22には、識別IDに対応する計測部位の粘膜層及び粘膜筋板の厚みがデータテーブル化されて記憶部(不図示)に記憶されているものとする。このような識別方法によれば、簡単な操作を行うだけで計測部位が識別され、その結果に基づいて低周波バンドパスフィルタ及び高周波バンドパスフィルタの中心周波数が自動的に変更されるので、術者の操作負担を軽減することができる。
また、モニタ装置500には、例えば図15に示すように、表示画面の左側に内視鏡100で得られた観察画像(内視鏡画像)510が表示され、その右側にOCTプロセッサ400の信号処理部22で生成された画像(OCT画像)520が表示される。そこで、このようにモニタ装置500に表示される内視鏡画像510を利用して、計測部位の種別を識別することも考えられる。
図16は、内視鏡画像に基づき計測部位を識別する方法の一例を示したフローチャート図である。図16に示すように、まず、信号処理部22は、内視鏡画像を取得する(ステップS10)。例えば、内視鏡画像は、内視鏡画像を生成する内視鏡プロセッサ200から取得する。
次に、信号処理部22は、取得した内視鏡画像の中に環状構造が存在するか否かを判断する(ステップS14)。そして、内視鏡画像の中に環状構造が存在しないと判断した場合には、計測部位を胃と特定する(ステップS16)。
一方、内視鏡画像の中に環状構造が存在すると判断した場合には、さらにその中にひだ構造が存在するか否かを判断する(ステップS18)。そして、内視鏡画像の中にひだ構造が存在しないと判断した場合には、計測部位を食道と特定する(ステップS20)。一方、内視鏡画像の中にひだ構造が存在すると判断した場合には、計測部位を大腸と特定する。
その後、信号処理部22は、上述のようにして特定した計測部位の粘膜層及び粘膜筋板の厚みを記憶部(不図示)から読み出し、計測部位の粘膜層及び粘膜筋板の厚みに応じて低周波バンドパスフィルタ及び高周波バンドパスフィルタの中心周波数を設定し、上述した各種処理を実行する。
以上説明したように本実施形態によれば、低周波フィルタリング処理が施された画像データ(第1の中間画像データ)と、高周波フィルタリング処理が施された画像データ(第2の中間画像データ)との重複部分を抽出する処理(AND処理)を行うことにより、高周波のノイズ成分が除去され、且つ、例えば粘膜筋板のような注目層構造が明瞭に抽出された画像を取得することができる。その結果、粘膜筋板が抽出されていない領域が粘膜筋板の断裂によるものなのか否かをより確実に判断することが可能になる。その結果、癌が粘膜筋板を浸潤しているかどうかの判断がより容易になる。
〔第2の実施形態〕
次に、本発明の第2の実施形態について説明する。以下、第1の実施形態と共通する部分については説明を省略し、本実施形態の特徴的な部分を中心に説明する。
次に、本発明の第2の実施形態について説明する。以下、第1の実施形態と共通する部分については説明を省略し、本実施形態の特徴的な部分を中心に説明する。
図17は第2の実施形態に係る信号処理部の構成を示すブロック図である。図17中、図9と共通又は類似の要素には同一の番号を付している。
図17に示すように、第2の実施形態としての信号処理部22Bは、第1の実施形態の構成(図9参照)に加え、さらに、断層画像構築部470、画像合成部480を備えている。
断層画像構築部470は、従来と同様にして通常の断層画像を構築する処理部であり、対数変換部420で生成された画像データ(入力画像データ)が入力され、その画像データからモニタ装置500及びその表示方法にあわせて断層画像を構築する。具体的には、輝度、コントラストの調整、表示サイズにあわせたリサンプル、ラジアル走査、セクタ走査等の走査方法に合わせての座標変換などにより断層画像を構築する。
画像合成部480は、断層画像構築部470で構築された断層画像と、AND画像構築部460で構築されたAND画像とを合成して、この合成された画像をモニタ装置500に出力する。
画像合成部480での画像合成方法は、断層画像とAND画像をあらかじめ設定した割合で加算して合成する方法が望ましい。具体的には、
(1)断層画像を1とした場合に対してAND画像を一定の比率βで加算する方法
合成画像 = 断層画像 + β×AND画像 (0<β<1)
もしくは、
(2)両者を一定の比率で加算する方法
合成画像 = (1-β)×断層画像 + β×AND画像 (0<β<1)
がある。但し、画像の合成方法については、これらに限定するものではなく、断層画像上にAND画像をスーパーインポーズする方法等、一般的に用いられているどのような方法を用いてもよい。画像合成部480から出力された合成画像はモニタ装置500に表示され、診断が可能となる。
(1)断層画像を1とした場合に対してAND画像を一定の比率βで加算する方法
合成画像 = 断層画像 + β×AND画像 (0<β<1)
もしくは、
(2)両者を一定の比率で加算する方法
合成画像 = (1-β)×断層画像 + β×AND画像 (0<β<1)
がある。但し、画像の合成方法については、これらに限定するものではなく、断層画像上にAND画像をスーパーインポーズする方法等、一般的に用いられているどのような方法を用いてもよい。画像合成部480から出力された合成画像はモニタ装置500に表示され、診断が可能となる。
第2の実施形態によれば、断層画像とAND画像とを合成することで、モニタ装置500に表示される合成画像には粘膜筋板のような注目層構造に関する情報が付加されることになり、注目層構造を容易に識別可能となる。これにより、粘膜筋板が抽出されていない領域が粘膜筋板の断裂によるものなのか否かをより確実に判断することが可能になる。その結果、癌が粘膜筋板を浸潤しているかどうかの判断がより容易になる。
なお、上述した各実施形態では、OCTプロセッサ400としてSS-OCT(Swept Source OCT)装置を用いて説明したが、これに限らず、OCTプロセッサ400をSD-OCT(Spectral Domain OCT)装置としても適用可能である。
以上、本発明の光断層画像化装置及び光断層画像化方法について詳細に説明したが、本発明は、以上の例には限定されず、本発明の要旨を逸脱しない範囲において、各種の改良や変形を行ってもよいのはもちろんである。
10…画像診断装置、20…干渉光検出部、20a…干渉信号生成部、20b…AD変換部、22…信号処理部、100…内視鏡、200…内視鏡プロセッサ、300…光源装置、400…OCTプロセッサ、410…フーリエ変換部、420…対数変換部、430…低周波フィルタリング部、432…低周波BPF部、434…二値化処理部、440…高周波フィルタリング部、442…高周波BPF部、444…二値化処理部、450…AND部、460…AND画像構築部、470…断層画像構築部、480…画像合成部、490…制御部、500…モニタ装置
Claims (20)
- 波長掃引光源から射出される光を測定光と参照光とに分割し、前記測定光にて測定対象に照射し、該測定対象からの反射光と前記参照光とを合波し、前記反射光と前記参照光とが合波したときの干渉光を干渉信号として検出し、該干渉信号を用いて前記測定対象の断層画像を取得する光断層画像化装置であって、
前記干渉信号をフーリエ変換して前記測定対象の断層情報を生成するフーリエ変換部と、
前記測定対象の断層情報を対数変換して入力画像データを生成する対数変換部と、
中心周波数が異なる少なくとも2種類の周波数フィルタのうち、中心周波数が低い方の第1の周波数フィルタを用いて前記入力画像データに対してフィルタリング処理を施すことにより第1の中間画像データを生成する第1のフィルタリング部と、
前記少なくとも2種類の周波数フィルタのうち、中心周波数が高い方の第2の周波数フィルタを用いて前記入力画像データに対してフィルタリング処理を施すことにより第2の中間画像データを生成する第2のフィルタリング部と、
前記第1の中間画像データと前記第2の中間画像データとの重複部分を抽出することにより出力画像データを生成するAND処理部と、
前記出力画像データからモニタ部に表示するための画像を生成する画像生成部と、
を備えた光断層画像化装置。 - 前記測定対象の種類に応じて前記第1又は第2の周波数フィルタの中心周波数を変更する中心周波数変更部を備えた請求項1に記載の光断層画像化装置。
- 前記中心周波数変更部は、前記第1の周波数フィルタの中心周波数を前記測定対象の注目層構造の厚み及び該注目層構造の隣接層の厚みを基に決定する請求項2に記載の光断層画像化装置。
- 前記中心周波数変更部は、前記第2の周波数フィルタの中心周波数を前記測定対象の注目層構造の厚みを基に決定する請求項2又は3に記載の光断層画像化装置。
- 前記測定対象の種類を識別する測定対象識別部を備え、
前記中心周波数変更部は、前記測定対象識別部により識別された結果に基づき、前記第1又は第2の周波数フィルタの中心周波数を変更する請求項2乃至4のいずれか1項に記載の光断層画像化装置。 - 前記測定対象識別部は、被検体内に挿入される内視鏡挿入部に付与された識別IDに基づき、前記測定対象の種類を識別する請求項5に記載の光断層画像化装置。
- 前記測定対象識別部は、内視鏡画像から前記測定対象の種類を識別する請求項5に記載の光断層画像化装置。
- 前記第1のフィルタリング部は、前記入力画像データに対して前記第1の周波数フィルタによりフィルタリング処理を施した後、さらに二値化処理を行うことにより、前記第1の中間画像データを生成する請求項1乃至7のいずれか1項に記載の光断層画像化装置。
- 前記第2のフィルタリング部は、前記入力画像データに対して前記第2の周波数フィルタによりフィルタリング処理を施した後、さらに二値化処理を行うことにより、前記第2の中間画像データを生成する請求項1乃至8のいずれか1項に記載の光断層画像化装置。
- 前記画像生成部により生成された画像と前記断層画像をあらかじめ設定した割合で加算することにより合成画像を生成する画像合成部を備えた請求項1乃至9のいずれか1項に記載の光断層画像化装置。
- 波長掃引光源から射出される光を測定光と参照光とに分割し、前記測定光にて測定対象に照射し、該測定対象からの反射光と前記参照光とを合波し、前記反射光と前記参照光とが合波したときの干渉光を干渉信号として検出し、該干渉信号を用いて前記測定対象の断層画像を取得する光断層画像化方法であって、
前記干渉信号をフーリエ変換して前記測定対象の断層情報を生成するフーリエ変換ステップと、
前記測定対象の断層情報を対数変換して入力画像データを生成する対数変換ステップと、
中心周波数が異なる少なくとも2種類の周波数フィルタのうち、中心周波数が低い方の第1の周波数フィルタを用いて前記入力画像データに対してフィルタリング処理を施すことにより第1の中間画像データを生成する第1のフィルタリングステップと、
前記少なくとも2種類の周波数フィルタのうち、中心周波数が高い方の第2の周波数フィルタを用いて前記入力画像データに対してフィルタリング処理を施すことにより第2の中間画像データを生成する第2のフィルタリングステップと、
前記第1の中間画像データと前記第2の中間画像データとの重複部分を抽出することにより出力画像データを生成するAND処理ステップと、
前記出力画像データからモニタ部に表示するための画像を生成する画像生成ステップと、
を含む光断層画像化方法。 - 前記測定対象の種類に応じて前記第1又は第2の周波数フィルタの中心周波数を変更する中心周波数変更ステップを含む請求項11に記載の光断層画像化方法。
- 前記中心周波数変更ステップは、前記第1の周波数フィルタの中心周波数を前記測定対象の注目層構造の厚み及び該注目層構造の隣接層の厚みを基に決定する請求項12に記載の光断層画像化方法。
- 前記中心周波数変更ステップは、前記第2の周波数フィルタの中心周波数を前記測定対象の注目層構造の厚みを基に決定する請求項12又は13に記載の光断層画像化方法。
- 前記測定対象の種類を識別する測定対象識別ステップを含み、
前記中心周波数変更ステップは、前記測定対象識別ステップにより識別された結果に基づき、前記第1又は第2の周波数フィルタの中心周波数を変更する請求項12乃至14のいずれか1項に記載の光断層画像化方法。 - 前記測定対象識別ステップは、被検体内に挿入される内視鏡挿入部に付与された識別IDに基づき、前記測定対象の種類を識別する請求項15に記載の光断層画像化方法。
- 前記測定対象識別ステップは、内視鏡画像から前記測定対象の種類を識別する請求項15に記載の光断層画像化方法。
- 前記第1のフィルタリングステップは、前記入力画像データに対して前記第1の周波数フィルタによりフィルタリング処理を施した後、さらに二値化処理を行うことにより、前記第1の中間画像データを生成する請求項11乃至17のいずれか1項に記載の光断層画像化方法。
- 前記第2のフィルタリングステップは、前記入力画像データに対して前記第2の周波数フィルタによりフィルタリング処理を施した後、さらに二値化処理を行うことにより、前記第2の中間画像データを生成する請求項11乃至18のいずれか1項に記載の光断層画像化方法。
- 前記画像生成ステップにより生成された画像と前記断層画像をあらかじめ設定した割合で加算することにより合成画像を生成する画像合成ステップを含む請求項11乃至19のいずれか1項に記載の光断層画像化方法。
Applications Claiming Priority (2)
| Application Number | Priority Date | Filing Date | Title |
|---|---|---|---|
| JP2010-148031 | 2010-06-29 | ||
| JP2010148031A JP5653087B2 (ja) | 2010-06-29 | 2010-06-29 | 光断層画像化装置及びその作動方法 |
Publications (1)
| Publication Number | Publication Date |
|---|---|
| WO2012002302A1 true WO2012002302A1 (ja) | 2012-01-05 |
Family
ID=45402015
Family Applications (1)
| Application Number | Title | Priority Date | Filing Date |
|---|---|---|---|
| PCT/JP2011/064627 Ceased WO2012002302A1 (ja) | 2010-06-29 | 2011-06-27 | 光断層画像化装置及び光断層画像化方法 |
Country Status (2)
| Country | Link |
|---|---|
| JP (1) | JP5653087B2 (ja) |
| WO (1) | WO2012002302A1 (ja) |
Cited By (8)
| Publication number | Priority date | Publication date | Assignee | Title |
|---|---|---|---|---|
| CN106413518A (zh) * | 2014-05-27 | 2017-02-15 | 株式会社高永科技 | 装拆式光学相干断层扫描装置 |
| US10631718B2 (en) | 2015-08-31 | 2020-04-28 | Gentuity, Llc | Imaging system includes imaging probe and delivery devices |
| CN111417334A (zh) * | 2017-11-30 | 2020-07-14 | 爱尔康公司 | 光学相干断层扫描成像中的改进分割 |
| US11278206B2 (en) | 2015-04-16 | 2022-03-22 | Gentuity, Llc | Micro-optic probes for neurology |
| US11684242B2 (en) | 2017-11-28 | 2023-06-27 | Gentuity, Llc | Imaging system |
| US12239412B2 (en) | 2019-05-21 | 2025-03-04 | Spryte Medical, Inc. | Systems and methods for OCT-guided treatment of a patient |
| US12262872B2 (en) | 2018-09-17 | 2025-04-01 | Gentuity, Llc | Imaging system with optical pathway |
| US12364385B2 (en) | 2019-04-30 | 2025-07-22 | Gentuity, Llc | Imaging probe with fluid pressurization element |
Families Citing this family (1)
| Publication number | Priority date | Publication date | Assignee | Title |
|---|---|---|---|---|
| EP3208600A4 (en) | 2014-10-16 | 2018-08-22 | National Institute of Advanced Industrial Science and Technology | Optical tomographic imaging method, device therefor, and program |
Citations (3)
| Publication number | Priority date | Publication date | Assignee | Title |
|---|---|---|---|---|
| US3779492A (en) * | 1971-10-18 | 1973-12-18 | Grumman Aerospace Corp | Automatic target recognition system |
| JPH10208037A (ja) * | 1997-01-21 | 1998-08-07 | Mitsubishi Electric Corp | 目標検出装置 |
| JP2009250630A (ja) * | 2008-04-01 | 2009-10-29 | Fujifilm Corp | 光断層画像取得装置および方法 |
-
2010
- 2010-06-29 JP JP2010148031A patent/JP5653087B2/ja active Active
-
2011
- 2011-06-27 WO PCT/JP2011/064627 patent/WO2012002302A1/ja not_active Ceased
Patent Citations (3)
| Publication number | Priority date | Publication date | Assignee | Title |
|---|---|---|---|---|
| US3779492A (en) * | 1971-10-18 | 1973-12-18 | Grumman Aerospace Corp | Automatic target recognition system |
| JPH10208037A (ja) * | 1997-01-21 | 1998-08-07 | Mitsubishi Electric Corp | 目標検出装置 |
| JP2009250630A (ja) * | 2008-04-01 | 2009-10-29 | Fujifilm Corp | 光断層画像取得装置および方法 |
Cited By (17)
| Publication number | Priority date | Publication date | Assignee | Title |
|---|---|---|---|---|
| US10986996B2 (en) | 2014-05-27 | 2021-04-27 | Koh Young Technology Inc. | Removable Optical Coherence Tomography (OCT) device |
| CN106413518B (zh) * | 2014-05-27 | 2018-11-09 | 株式会社高永科技 | 装拆式光学相干断层扫描装置 |
| CN106413518A (zh) * | 2014-05-27 | 2017-02-15 | 株式会社高永科技 | 装拆式光学相干断层扫描装置 |
| US11278206B2 (en) | 2015-04-16 | 2022-03-22 | Gentuity, Llc | Micro-optic probes for neurology |
| US11937786B2 (en) | 2015-08-31 | 2024-03-26 | Gentuity, Llc | Imaging system includes imaging probe and delivery devices |
| US11064873B2 (en) | 2015-08-31 | 2021-07-20 | Gentuity, Llc | Imaging system includes imaging probe and delivery devices |
| US11583172B2 (en) | 2015-08-31 | 2023-02-21 | Gentuity, Llc | Imaging system includes imaging probe and delivery devices |
| US10631718B2 (en) | 2015-08-31 | 2020-04-28 | Gentuity, Llc | Imaging system includes imaging probe and delivery devices |
| US12232705B2 (en) | 2015-08-31 | 2025-02-25 | Spryte Medical, Inc. | Imaging system includes imaging probe and delivery devices |
| US11684242B2 (en) | 2017-11-28 | 2023-06-27 | Gentuity, Llc | Imaging system |
| JP2021504025A (ja) * | 2017-11-30 | 2021-02-15 | アルコン インコーポレイティド | 光コヒーレンストモグラフィ撮像におけるセグメント化の改善 |
| CN111417334A (zh) * | 2017-11-30 | 2020-07-14 | 爱尔康公司 | 光学相干断层扫描成像中的改进分割 |
| CN111417334B (zh) * | 2017-11-30 | 2023-03-28 | 爱尔康公司 | 光学相干断层扫描成像中的改进分割 |
| JP7417524B2 (ja) | 2017-11-30 | 2024-01-18 | アルコン インコーポレイティド | 光コヒーレンストモグラフィ撮像におけるセグメント化の改善 |
| US12262872B2 (en) | 2018-09-17 | 2025-04-01 | Gentuity, Llc | Imaging system with optical pathway |
| US12364385B2 (en) | 2019-04-30 | 2025-07-22 | Gentuity, Llc | Imaging probe with fluid pressurization element |
| US12239412B2 (en) | 2019-05-21 | 2025-03-04 | Spryte Medical, Inc. | Systems and methods for OCT-guided treatment of a patient |
Also Published As
| Publication number | Publication date |
|---|---|
| JP5653087B2 (ja) | 2015-01-14 |
| JP2012010775A (ja) | 2012-01-19 |
Similar Documents
| Publication | Publication Date | Title |
|---|---|---|
| JP5653087B2 (ja) | 光断層画像化装置及びその作動方法 | |
| JP5259374B2 (ja) | 光構造観察装置及びその構造情報処理方法 | |
| JP6765786B2 (ja) | 撮像装置、撮像装置の作動方法、情報処理装置、及び情報処理装置の作動方法 | |
| JP4577504B2 (ja) | 画像診断装置 | |
| JP2010068865A (ja) | 画像診断装置 | |
| US20110082335A1 (en) | Optical structure observation apparatus, structure information processing method of the same and endoscope apparatus including optical structure observation apparatus | |
| JP5298352B2 (ja) | 光構造像観察装置及び内視鏡装置 | |
| JP2010043994A (ja) | 光プローブ及び3次元画像取得装置 | |
| JP2010158343A (ja) | 光立体構造解析装置及びその立体構造情報処理方法 | |
| JP2010179042A (ja) | 光構造観察装置及びその構造情報処理方法、光構造観察装置を備えた内視鏡システム | |
| JP5779461B2 (ja) | 光干渉断層画像処理装置及びその作動方法 | |
| JP5696178B2 (ja) | 光断層画像化装置及びその作動方法 | |
| JP2012013432A (ja) | 断層画像処理装置及び方法、並びに光干渉断層画像診断装置 | |
| JP5748281B2 (ja) | 光干渉断層画像処理方法及びその装置 | |
| WO2011158848A1 (ja) | 光断層画像化装置及び光断層画像化方法 | |
| JP2012010776A (ja) | 断層画像処理装置及び方法、並びに光干渉断層画像診断装置 | |
| WO2011158849A1 (ja) | 断層画像処理装置及び方法、並びに光干渉断層画像診断装置 | |
| JP5405839B2 (ja) | 光立体構造像観察装置、その作動方法及び光立体構造像観察装置を備えた内視鏡システム | |
| JP5373389B2 (ja) | 光構造情報取得装置及びその光干渉信号処理方法 | |
| JP5657941B2 (ja) | 光断層画像化装置及びその作動方法 | |
| JP5752538B2 (ja) | 光干渉断層画像処理方法及びその装置 | |
| JP2010179043A (ja) | 光構造観察装置及びその構造情報処理方法 | |
| JP5812785B2 (ja) | 光断層画像処理装置及び光断層画像処理装置の作動方法 | |
| JP2010185782A (ja) | 光構造観察装置及びその構造情報処理方法 | |
| JP2010201077A (ja) | 生体断層画像生成装置及びその情報処理方法 |
Legal Events
| Date | Code | Title | Description |
|---|---|---|---|
| 121 | Ep: the epo has been informed by wipo that ep was designated in this application |
Ref document number: 11800766 Country of ref document: EP Kind code of ref document: A1 |
|
| NENP | Non-entry into the national phase |
Ref country code: DE |
|
| 122 | Ep: pct application non-entry in european phase |
Ref document number: 11800766 Country of ref document: EP Kind code of ref document: A1 |