WO2010032701A1 - 運用管理装置、運用管理方法、および運用管理プログラム - Google Patents
運用管理装置、運用管理方法、および運用管理プログラム Download PDFInfo
- Publication number
- WO2010032701A1 WO2010032701A1 PCT/JP2009/065990 JP2009065990W WO2010032701A1 WO 2010032701 A1 WO2010032701 A1 WO 2010032701A1 JP 2009065990 W JP2009065990 W JP 2009065990W WO 2010032701 A1 WO2010032701 A1 WO 2010032701A1
- Authority
- WO
- WIPO (PCT)
- Prior art keywords
- information
- failure
- performance
- performance information
- abnormality
- Prior art date
Links
Images


Classifications
-
- G—PHYSICS
- G06—COMPUTING; CALCULATING OR COUNTING
- G06F—ELECTRIC DIGITAL DATA PROCESSING
- G06F11/00—Error detection; Error correction; Monitoring
- G06F11/30—Monitoring
- G06F11/34—Recording or statistical evaluation of computer activity, e.g. of down time, of input/output operation ; Recording or statistical evaluation of user activity, e.g. usability assessment
- G06F11/3409—Recording or statistical evaluation of computer activity, e.g. of down time, of input/output operation ; Recording or statistical evaluation of user activity, e.g. usability assessment for performance assessment
-
- G—PHYSICS
- G06—COMPUTING; CALCULATING OR COUNTING
- G06F—ELECTRIC DIGITAL DATA PROCESSING
- G06F11/00—Error detection; Error correction; Monitoring
- G06F11/07—Responding to the occurrence of a fault, e.g. fault tolerance
- G06F11/0703—Error or fault processing not based on redundancy, i.e. by taking additional measures to deal with the error or fault not making use of redundancy in operation, in hardware, or in data representation
- G06F11/0706—Error or fault processing not based on redundancy, i.e. by taking additional measures to deal with the error or fault not making use of redundancy in operation, in hardware, or in data representation the processing taking place on a specific hardware platform or in a specific software environment
- G06F11/0709—Error or fault processing not based on redundancy, i.e. by taking additional measures to deal with the error or fault not making use of redundancy in operation, in hardware, or in data representation the processing taking place on a specific hardware platform or in a specific software environment in a distributed system consisting of a plurality of standalone computer nodes, e.g. clusters, client-server systems
-
- G—PHYSICS
- G06—COMPUTING; CALCULATING OR COUNTING
- G06F—ELECTRIC DIGITAL DATA PROCESSING
- G06F11/00—Error detection; Error correction; Monitoring
- G06F11/07—Responding to the occurrence of a fault, e.g. fault tolerance
- G06F11/0703—Error or fault processing not based on redundancy, i.e. by taking additional measures to deal with the error or fault not making use of redundancy in operation, in hardware, or in data representation
- G06F11/0751—Error or fault detection not based on redundancy
-
- H—ELECTRICITY
- H04—ELECTRIC COMMUNICATION TECHNIQUE
- H04L—TRANSMISSION OF DIGITAL INFORMATION, e.g. TELEGRAPHIC COMMUNICATION
- H04L41/00—Arrangements for maintenance, administration or management of data switching networks, e.g. of packet switching networks
- H04L41/06—Management of faults, events, alarms or notifications
- H04L41/0631—Management of faults, events, alarms or notifications using root cause analysis; using analysis of correlation between notifications, alarms or events based on decision criteria, e.g. hierarchy, tree or time analysis
- H04L41/064—Management of faults, events, alarms or notifications using root cause analysis; using analysis of correlation between notifications, alarms or events based on decision criteria, e.g. hierarchy, tree or time analysis involving time analysis
-
- H—ELECTRICITY
- H04—ELECTRIC COMMUNICATION TECHNIQUE
- H04L—TRANSMISSION OF DIGITAL INFORMATION, e.g. TELEGRAPHIC COMMUNICATION
- H04L41/00—Arrangements for maintenance, administration or management of data switching networks, e.g. of packet switching networks
- H04L41/50—Network service management, e.g. ensuring proper service fulfilment according to agreements
- H04L41/5003—Managing SLA; Interaction between SLA and QoS
- H04L41/5009—Determining service level performance parameters or violations of service level contracts, e.g. violations of agreed response time or mean time between failures [MTBF]
-
- G—PHYSICS
- G06—COMPUTING; CALCULATING OR COUNTING
- G06F—ELECTRIC DIGITAL DATA PROCESSING
- G06F11/00—Error detection; Error correction; Monitoring
- G06F11/30—Monitoring
- G06F11/34—Recording or statistical evaluation of computer activity, e.g. of down time, of input/output operation ; Recording or statistical evaluation of user activity, e.g. usability assessment
- G06F11/3438—Recording or statistical evaluation of computer activity, e.g. of down time, of input/output operation ; Recording or statistical evaluation of user activity, e.g. usability assessment monitoring of user actions
-
- G—PHYSICS
- G06—COMPUTING; CALCULATING OR COUNTING
- G06F—ELECTRIC DIGITAL DATA PROCESSING
- G06F11/00—Error detection; Error correction; Monitoring
- G06F11/30—Monitoring
- G06F11/34—Recording or statistical evaluation of computer activity, e.g. of down time, of input/output operation ; Recording or statistical evaluation of user activity, e.g. usability assessment
- G06F11/3466—Performance evaluation by tracing or monitoring
- G06F11/3495—Performance evaluation by tracing or monitoring for systems
Definitions
- the present invention relates to the operation of information and communication services such as web services and business services, and more particularly to the detection of the occurrence of a failure in the service and the identification of the cause.
- an operation management device that detects the occurrence of a failure and identifies the cause in the operation of an information communication service such as a web service or a business service.
- Patent Document 1 describes a technique of periodically measuring a response time of a web server or the like and notifying an administrator if the response time value does not satisfy a compensation value.
- Patent Document 2 describes a technique for determining the similarity of changes between a plurality of different types of parameters such as fuel flow rate and vehicle body speed.
- Patent Document 3 describes a technique of calculating a distribution moment of dissimilarity when a plurality of direction data is modeled, and determining that it is abnormal when it exceeds a threshold value.
- Patent Document 4 describes a technique in which analysis information obtained by analyzing a log of a monitoring target computer is searched for a pattern similar to past analysis information, thereby predicting the occurrence of a failure.
- Patent Document 5 describes a technique for displaying a state history of plant equipment that changes in time series in an easy-to-understand manner (by color coding or the like).
- Patent Document 6 describes a failure information display device that displays the location and order of failures so that they can be visually recognized easily.
- the strength of correlation between performance information is calculated based on the degree of change in performance information in order to appropriately detect the above-described performance degradation failure. It is possible to appropriately determine whether changes in information according to the passage of time are similar.
- Patent Documents 1, 3 and 5 do not describe a technique that can easily present the location of the failure and its cause. Therefore, even if these documents are combined, it is not possible to obtain an operation management apparatus that easily presents the location and cause of a failure to an inexperienced administrator.
- the purpose of the present invention is to provide an operation management that makes it possible to present an easy-to-understand location and cause of a failure even to an administrator who has little experience and does not accurately understand the configuration and behavior of the target system.
- An apparatus, an operation management method, and an operation management program are provided.
- the operation management apparatus obtains performance information for each of a plurality of types of performance items from one or more managed apparatuses constituting the system, and operates and manages the managed apparatus.
- the management device has the first performance information indicating the time series change of the performance information related to at least the first element and the performance information related to the second element.
- Information collecting means for collecting second performance information indicating a series change
- correlation model generating means for deriving a correlation function between the first and second performance information and generating a correlation model based on the correlation function
- a correlation change analysis means for determining whether or not the current first and second performance information acquired by the information collection means satisfies the relationship indicated by the correlation function within a certain error range, and a correlation change analysis
- the stage determines that the first and second performance information does not satisfy the relationship indicated by the correlation function, the stage has failure period extracting means for extracting the period in the state as the failure period It is characterized by.
- the operation management method obtains performance information for each of a plurality of types of performance items from one or more managed devices constituting the system, and operates and manages the managed devices.
- the performance item or the managed device is an element
- the first performance information indicating the time series change of the performance information related to at least the first element from the element and the performance information related to the second element
- Current performance information is collected by collecting second performance information indicating a series change, deriving a correlation function between the first and second performance information, generating a correlation model based on the correlation function, It is determined whether or not the first and second performance information satisfy the relationship indicated by the correlation function within a certain error range, and the relationship indicated by the first and second performance information is indicated by the correlation function. In a state that does not meet If it is determined that that, and extracts a period which is the state as a failure period.
- an operation management program obtains performance information for each of a plurality of types of performance items from one or a plurality of managed devices constituting the system, and operates and manages the managed device.
- the performance item or managed device is an element in the computer that controls the management apparatus
- the first performance information and the performance information related to the second element indicate a time-series change in performance information related to at least the first element from the element.
- the procedure for determining whether the current first and second performance information acquired by the information collecting means satisfies the relationship indicated by the correlation function within a certain error range and the first and second characteristics Information when it is determined that the state does not satisfy the relationships shown by the correlation function characterized in that to execute a function of extracting a period which is the state as a failure period.
- the present invention is configured to generate the correlation model from the performance information as described above and detect the period out of the correlation model as the failure period, it appropriately detects the occurrence of the failure, and further It becomes easy to identify the factors. As a result, the location of the failure and its cause can be presented to the administrator in an easy-to-understand manner.
- FIG. 10 is a graph showing an example of an abnormality degree distribution calculated by an abnormality degree change information calculating unit and an abnormality degree distribution information calculating unit in the operation management apparatus (according to the fourth embodiment) shown in FIG.
- FIG. 9 shows an example of a display screen presented by the manager interaction means to the manager in the operation management apparatus (according to the fourth embodiment) shown in FIG.
- the operation management apparatus 100 acquires performance information for each of a plurality of types of performance items from one or more managed apparatuses (service execution means 101) constituting the system, and manages the managed apparatus.
- a first performance information indicating a time-series change of performance information related to at least the first element from the element (service execution unit 101) and the first performance information and the first
- a correlation model generation unit 107 for generating a correlation model based on the correlation function, and the current first and second performance information acquired by the information collection unit 103 are correlated.
- Correlation change analysis means 109 for determining whether or not the relationship indicated by (1) is satisfied within a certain error range, and the correlation change analysis means 109 is a relationship in which the first and second performance information is indicated by a correlation function.
- the failure period extracting unit 110 extracts the period in the state as the failure period.
- the operation management apparatus 100 calculates statistical information about the degree of abnormality, which is the degree to which the first and second performance information deviates from the conversion function, during the failure period extracted by the failure period extraction unit 110 as abnormality degree change information.
- a degree-of-abnormality change information calculation unit 111 calculates statistical information about the degree of abnormality, which is the degree to which the first and second performance information deviates from the conversion function, during the failure period extracted by the failure period extraction unit 110 as abnormality degree change information.
- the operation management apparatus 100 classifies the performance information into a plurality of types and stores the performance classification information storage means 112 that stores the performance information as performance classification information, and the failure basis extraction from the performance classification information stored in the performance classification information storage means 112.
- the degree-of-abnormality distribution information for calculating the degree-of-abnormality distribution information indicating the degree-of-abnormality distribution for each element of the performance information by extracting the performance information and the degree of abnormality included in the correlation changed within the failure period extracted by the means 110 And calculating means 113.
- the embodiment of the present invention appropriately detects the occurrence of a failure, easily identifies the cause of the failure, and makes it easy for the administrator to identify the location of the failure and its cause. It is possible to present. Hereinafter, this will be described in more detail.
- FIG. 1 is an explanatory diagram showing a configuration of an operation management apparatus 100 according to the first embodiment of the present invention.
- the operation management apparatus 100 actually includes a control unit 114 that is a main body that executes a computer program including a CPU, a RAM, an OS, and the like.
- the control unit 114 is composed of a CPU, and by causing the CPU to execute a program, on the software, the service execution unit 101, the information collection unit 103, the failure analysis unit 104, the administrator interaction unit 105, the countermeasure execution unit 106, the correlation A model generation unit 107 and a correlation change analysis unit 109 are realized.
- the performance information storage means 102 and the correlation model storage means 108 are realized by a nonvolatile storage means such as a disk device provided in the operation management apparatus 100.
- the performance information storage unit 102 and the correlation model storage unit 108 are also shown in the control unit 114 for easy understanding.
- the control unit 114 includes an abnormality degree analysis unit 115 described later.
- achieved on software was shown in figure, it is not restricted to this, You may implement
- the service execution means 101 provides information communication services such as WEB services and business services.
- the service execution means 101 may be singular or plural, and may be configured by a computer that is physically different from other elements of the operation management apparatus 100, or may be configured by the same computer.
- the performance information storage unit 102 stores the performance information of each element of the service execution unit 101.
- the information collecting unit 103 detects and outputs the performance information of the service execution unit 101 and an operation state such as an error message, and stores the performance information included in the operation state in the performance information storage unit 102.
- the failure analysis unit 104 receives the outputs from the information collection unit 103 and the abnormality level analysis unit 115, performs failure analysis, and outputs the result to the administrator dialogue unit 105.
- the administrator interaction unit 105 receives the result of the failure analysis output from the failure analysis unit 104, presents it to the administrator, and receives an input from the administrator.
- the countermeasure execution unit 106 executes a process for handling a failure on the service execution unit 101 in accordance with an instruction from the administrator dialogue unit 105.
- the correlation model generation unit 107 extracts the performance information for a certain period from the performance information storage unit 102, and derives a time series conversion function of the values of any two performance information values to thereby determine the overall operating state of the service execution unit 101. Generate a correlation model of The correlation model storage unit 108 stores the correlation model generated by the correlation model generation unit 107.
- the correlation change analysis unit 109 receives newly detected performance information from the information collection unit 103, and the performance value included in the performance information is converted between the pieces of performance information of the correlation model stored in the correlation model storage unit 108. Analyzes whether the relationship indicated by the function is satisfied within a certain error range, and outputs the result.
- FIG. 1 An operation management apparatus not equipped with the abnormality degree analysis unit 115 in the embodiment of the present invention is assumed as the comparative example.
- the failure analysis unit 104 receives the outputs from the information collection unit 103 and the correlation change analysis unit 109, performs failure analysis, The result is output to the manager interaction means 105.
- the administrator interaction unit 105 receives the result of the failure analysis output from the failure analysis unit 104, presents it to the administrator, and receives an input from the administrator.
- the countermeasure execution unit 106 executes a process for handling a failure on the service execution unit 101 in accordance with an instruction from the administrator dialogue unit 105.
- the information collection unit 103 detects the operating state of the service execution unit 101 and stores the detected information as performance information in the performance information storage unit 102. For example, when the WEB service is being executed by the service execution unit 101, the information collection unit 103 uses the CPU usage rate and the remaining memory capacity of each server that provides the WEB service as performance information of the service execution unit 101 for a certain period of time. Detect at intervals.
- FIG. 15 is an explanatory diagram showing an example of the performance information 511 detected and stored by the information collecting unit 103 shown in FIG.
- the performance information 511 acquired by the information collecting unit 103 includes, for example, “A.CPU”, “A.MEM”, and “B.CPU” as shown in FIG.
- the item “A.CPU” indicates the value of the CPU usage rate of one server (service execution unit 101), and the value of 17:25 on October 5, 2007 is the value. 12.
- values such as 15, 34, 63 are detected from 17:26 at intervals of 1 minute.
- “A.MEM” detects the value of the remaining amount of memory of the same server
- B.CPU detects the value of the CPU usage rate of another server at the same time.
- the failure analysis means 104 performs failure analysis by a predetermined method.
- the failure analysis unit 104 may detect the performance detected by the information collection unit 103, such as presenting a warning message to the administrator if the CPU usage (use?) Rate is equal to or greater than a certain value.
- the failure analysis is performed by determining whether or not the load on a specific server (service execution unit 101) is high according to a determination condition such as a threshold value given in advance from the value of information.
- the administrator interaction unit 105 presents the result of the failure analysis analyzed by the failure analysis unit 104 to the administrator, and when the administrator inputs an instruction for some countermeasure, the service execution unit 106 via the countermeasure execution unit 106
- the coping command is executed on 101.
- the administrator knows that the CPU load is high, and inputs a handling command for reducing the workload to the handling execution means 106 or a handling command for changing the configuration for load balancing.
- a measure such as input to the execution means 106 can be performed.
- the correlation model generation means 107 can detect a performance abnormality more accurately in such failure analysis.
- the correlation model generation unit 107 creates a correlation model by deriving a conversion function between each piece of performance information. Accumulate in the accumulation means 108.
- FIG. 16 is an explanatory diagram showing an example of the correlation model 521 created by the correlation model generation means 107.
- “ ⁇ 0.6” and “100” are determined as the values of ⁇ and ⁇ of the conversion function, respectively, and the conversion function Is compared with the time series of the actual values of the performance information to be output, and the weight “0.88” of the conversion function is calculated from the conversion error that is the difference.
- the correlation model generation unit 107 derives a conversion function between any two pieces of performance information, extracts a function having a constant weight as an effective correlation, and the entire service execution unit 101 as shown in FIG. A correlation model 521 of a typical operating state is generated.
- the present invention is not limited to this example, and the conversion function derived by the correlation model generation unit 107 is an arbitrary one. What is necessary is just to convert the time series of two performance information values.
- a known statistical method can be used for the calculation for regressing to such an expression.
- the correlation change analysis unit 109 analyzes whether the performance information newly acquired from the information collection unit 103 matches the correlation shown in the correlation model generated by the correlation model generation unit 107. For example, when the correlation model generation unit 109 obtains the performance information 511 of the service execution unit 101 at the time of “2007/11/07 8:30” in the bottom row in the performance information 511 shown in FIG.
- the conversion function described in the correlation model 521 shown in FIG. 16 is sequentially searched, and the conversion value calculated by using the conversion function from the performance information of the service execution unit 101 as the input and the performance information as the output are newly acquired.
- the value is within a certain conversion error range, it is determined that the correlation is maintained, and when the value exceeds the conversion error range, it is determined that the correlation is broken.
- Correlation change in the comparative example The means 109 repeats the above-described processing for all the conversion functions of the service execution means 101, and after determining the presence or absence of correlation change of all newly acquired performance information, Correlation change information including abnormality degree information indicating the degree of correlation change and abnormal element information indicating elements related to the correlation change is created and output to the failure analysis unit 104.
- the failure analysis unit 104 receives this correlation change information, and presents it to the administrator as a possibility of failure via the administrator interaction unit 105 when the changed abnormality degree exceeds a predetermined value.
- the administrator interaction means 105 in the operation management apparatus presents a display screen 541 as shown in FIG. 17 to the administrator.
- the display screen 541 includes a correlation destruction number 541a indicating the degree of abnormality, a correlation diagram 541b indicating the abnormality location, a list 541c of elements having a large degree of abnormality, and the like. In this way, for example, it is possible to present to the administrator that there is a possibility of failure in the element “C.CPU” having a high degree of abnormality.
- a correlation model is generated from the normal performance information with no failure, and the ratio of the detected performance information to the normal correlation model is calculated.
- the occurrence of performance anomalies such as response deterioration is detected and the location is specified.
- the presented information is information of an element (service execution unit 101) whose behavior is different from that of a normal time, and which element (service execution unit 101) is actually the cause
- the administrator has to perform work to investigate the cause from this difference in behavior.
- the administrator estimates the cause factor (service execution unit 101) from the collapse of the correlation after understanding the characteristics of the actually operating system. There was a need to do. Especially in a large-scale system such as a large-scale system that has many components and a complex behavior, the amount of knowledge required by the administrator becomes enormous, and there is a risk of erroneous handling due to lack of knowledge.
- the first embodiment according to the present invention employs a configuration in which the control unit 114 is equipped with an abnormality degree analysis unit 115 as shown in FIG.
- the abnormality level analysis unit 115 includes a failure period extraction unit 110, an abnormality level change information calculation unit 111, a performance classification information accumulation unit 112, and an abnormality level distribution information calculation unit 113.
- the performance classification information accumulating unit 112 is realized by a nonvolatile storage unit such as a disk device, which is provided in the operation management apparatus 100 in advance.
- the failure period extracting unit 110, the abnormality degree change information calculating unit 111, and the abnormality degree distribution information calculating unit 113 are realized on software by causing the CPU constituting the control unit 114 to execute a computer program. Note that the failure period extraction unit 110, the abnormality degree change information calculation unit 111, and the abnormality degree distribution information calculation unit 113 are realized on software, but the present invention is not limited to this, and these are constructed by a hardware configuration. It may be.
- the failure period extraction unit 110 receives the correlation change information from the correlation change analysis unit 109, and extracts the failure period from the time series change of the degree of abnormality based on a predetermined threshold.
- the failure period extraction unit 110 sets the start of the failure period as a time point when the abnormality level that can occur during normal operation changes to an abnormality level that can be determined as a failure, and ends the failure period as an abnormality level that can occur during normal operation. Is used for a certain period of time, the correlation change information received from the correlation change analysis means 109 is used to extract the failure period from the time series change of the degree of abnormality based on a predetermined threshold.
- the abnormality level change information calculation unit 111 receives information on the failure period from the failure period extraction unit 110, and calculates abnormality level change information including statistical information such as the total degree of abnormality and maximum, minimum, and average values within the failure period. .
- the performance classification information storage unit 112 stores performance classification information for classifying the performance information collected from the service execution unit 101 into a plurality of groups.
- the abnormality degree distribution information calculation unit 113 receives the performance classification information from the performance classification information storage unit 112, extracts the performance information included in the correlation that has changed within the failure period and the degree of abnormality, and performs an abnormality for each group of the performance information. Abnormality distribution information indicating the distribution of degrees is calculated.
- the failure analysis unit 104 includes, in addition to the information from the information collection unit 103, the abnormality degree change information from the abnormality degree change information calculation unit 111 and the abnormality degree distribution.
- the abnormality distribution information from the information calculation unit 113 is received, and the failure of the service execution unit 101 is analyzed based on the information.
- the administrator interaction unit 105 presents the abnormality level change information and the abnormality level distribution information for each failure period to the administrator.
- FIG. 2 is a flowchart for explaining the operation of the correlation change analysis in the operation management apparatus 100 according to the first embodiment of the present invention shown in FIG.
- the correlation model generation unit 107 Based on the performance information collected from the service execution unit 101 by the information collection unit 103, the correlation model generation unit 107 generates a correlation model (step S611). Further, when the information collection unit 103 collects performance information during operation, the correlation change analysis unit 109 analyzes whether or not the performance information matches the correlation shown in the correlation model, and detects an abnormality from the change in the correlation. The degree is calculated (step S612).
- the operation of the operation management apparatus 100 according to the first embodiment of the present invention up to the above steps is the same as that of the comparative example described above. Next, a characteristic operation in the operation management apparatus 100 according to the first embodiment of the present invention will be described.
- the failure period extraction unit 110 extracts a failure period from the time series of the degree of abnormality received from the correlation change analysis unit 109 (step S613).
- the failure period extraction unit 110 extracts the failure period 1 and the failure period 2 from the graph 171a showing the time series change of the degree of abnormality. More specifically, the failure period extraction unit 110 uses two threshold values, a normal threshold value V1 indicating a boundary at which the degree of abnormality can be regarded as normal, and a failure threshold value V2 indicating a boundary at which the degree of abnormality indicates a failure.
- the failure period 1 starts from the time when the degree of abnormality less than the normal threshold V1 changes to the degree of abnormality (correlation destruction) V3 greater than or equal to the failure threshold V2, and then ends when the degree of abnormality continues below the normal threshold V1 for a certain period , 2 are extracted.
- the abnormality degree change information calculation unit 111 includes the failure periods 1 and 2 in the failure periods 1 and 2 extracted by the failure period extraction unit 110.
- Abnormality degree change information is calculated (step S615), and the abnormality degree distribution information calculation unit 113 calculates distribution information of influence elements (service execution unit 101) in the failure periods 1 and 2 extracted by the failure period extraction unit 110. (Step S616).
- Step S616 operations performed by the abnormality degree change information calculation unit 111 and the abnormality degree distribution information calculation unit 113 will be described in detail.
- the performance classification information storage unit 112 stores the performance classification information 131 and a relationship diagram 161 for classifying the performance information of each server (service execution unit 101).
- the performance classification information 131 and the performance classification information 131 illustrated in FIG. 3 are examples, and are not limited thereto. Various changes are made depending on the system that provides the service.
- the seven servers “A” to “G” (service execution means 101) are servers of “Web (Web server)” as in the configuration of a general Web three-tier system. , “AP (application)” server and “DB (database)” server.
- the performance classification information 131 the performance information of each server (service execution means 101) is classified into three groups according to the group classification classified in the relationship diagram 161.
- the “Web” group (service execution unit 101) includes performance information “A. *”, “B. *”, and “C. *”.
- “A. *” indicates all performance information of the server A (service execution unit 101) of the Web group.
- “B. *” indicates all performance information of the server B (service execution unit 101) of the Web group.
- “C. *” indicates all performance information of the server C (service execution unit 101) of the Web group.
- the “AP” server group includes performance information “D. *” and “E. *”.
- “D. *” indicates all performance information of the server D (service execution unit 101) of the AP group.
- “E. *” indicates all performance information of the server E (service execution unit 101) of the AP group.
- the “DB” server group includes performance information “F. *” and “G. *”.
- “F. *” indicates all performance information of the server F (service execution unit 101) of the DB group.
- “G. *” indicates all performance information of the server G (service execution unit 101) of the DB group.
- the abnormality degree distribution information calculation unit 113 displays the performance information related to the correlation change in the failure periods 1 and 2 extracted by the failure period extraction unit 110 as a group of servers A to G. 4 and the distribution information of the degree of abnormality shown in the lower part of FIG.
- a stacked graph 171b is generated for each failure period 1 and 2 and showing the degree of abnormality distribution of the partial elements in the failure periods 1 and 2.
- the abnormality degree distribution information calculating unit 113 uses the majority of the correlation changes related to the “DB” group as the abnormality degree distribution information of the partial elements in the failure period 1, and then the “Web” group.
- Abnormality distribution information is generated in which there are many correlation changes related to “AP” and there are few correlation changes related to the “AP” group.
- the abnormality degree distribution information calculating means 113 has a correlation change regarding the “Web” group as the abnormality degree distribution information of the partial elements in the failure period 2, and a correlation change regarding the “AP” group and the “DB” group. Create a degree of anomaly distribution information.
- the abnormality degree change information calculation unit 111 receives information from the failure period extraction unit 110 and extracts all elements in the failure periods 1 and 2 extracted by the failure period extraction unit 110.
- the degree of abnormality of the “Web” group, “AP” group and “DB” group) is determined based on the statistical value, and the degree of abnormality of all elements in the failure periods 1 and 2 is calculated.
- the width of the failure periods 1 and 2 handled by the abnormality degree change information calculation unit 111 and the abnormality degree distribution information calculation unit 113 is determined by the failure periods 1 and 2 extracted by the failure period extraction unit 110 based on the graph 171a.
- the abnormality degree change information calculating unit 111 and the abnormality degree distribution information calculating unit 113 are determined.
- the failure analysis means 104 receives the abnormality degree change information calculated by the abnormality degree change information calculation means 111 and the abnormality degree distribution information calculated by the abnormality degree distribution information calculation means 113, and based on these information, the service execution means 101 Are analyzed, and the analysis result is output to the manager interaction means 105.
- the manager interaction unit 105 receives the analysis result of the failure analysis unit 104 and presents the analysis result to the manager (step S617).
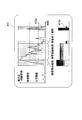
- FIG. 5 shows an example of the display screen 142 presented to the manager by the manager dialogue means 105.
- the administrator interaction unit 105 displays the failure period extraction unit 110 on the abnormality degree graph 142 a that is a time series of the degree of abnormality output from the correlation change analysis unit 109 on the display screen 142.
- the extracted failure period 1 to failure period 3 are displayed.
- the administrator dialogue means 105 has the same time series as the abnormality degree graph 142a and the abnormality in each failure period 1 to 3 calculated by the abnormality degree distribution information calculation means 113.
- the degree distribution 142b is displayed.
- the time series change abnormality degree graph is not the graph shown in FIG. 4 but an abnormality degree graph 142a as shown in the upper part of FIG.
- the failures in each failure period 1 to 3 are continuous with the same abnormality degree and period.
- the failure in period 3 is shown with a similar waveform. Therefore, the failure analysis unit 104 analyzes the failure by directly outputting the result analyzed by the correlation change analysis unit 109 to the failure analysis unit 104 as in the comparative example, and the abnormality degree graph 142a shown in the upper part of FIG.
- the administrator When the failure status is displayed to the administrator only, the administrator understands the failure in the failure period 1 to 3 as a series of failures, or the failure in the failure period 2 is a failure in the other failure periods 1 and 3 There is a high possibility that it is impossible to grasp an accurate failure by predicting a different state.
- the failure period extracting unit 110, the abnormality degree change information calculating unit 111, and the abnormality degree distribution information calculating unit 113 are included.
- the abnormality degree change information calculated by the abnormality degree change information calculation unit 111 and the abnormality degree distribution information calculated by the abnormality degree distribution information calculation unit 113 are received, and the operation state of the service execution unit 101 is analyzed based on the information. Then, the analysis result is transferred to the manager dialogue means 105. Therefore, referring to the abnormality degree distribution 142b shown in the lower part of FIG. 5, the abnormality degree change information calculated by the abnormality degree change information calculating unit 111 and the abnormality degree distribution information calculating unit 113 are calculated in the abnormality degree distribution 142a.
- the administrator can generate a failure related to the “WEB” group in the failure period 2 and 3 after a failure related to the “DB” group occurs in the failure period 1. It can be understood that they occur continuously. For this reason, the administrator can grasp the situation more accurately based on the display of the abnormality degree distribution 142a shown in the lower part of FIG. 5, and can take appropriate measures. For example, the administrator checks in detail the failure status of the “DB” group that occurred in the first failure period 1 in order to investigate the cause, and details the contents of the failure in the failure periods 2 and 3 in order to investigate the influence range. It is possible to confirm.
- the performance items or managed devices When acquiring performance information for each of multiple types of performance items from one or more managed devices that make up the system and managing the managed devices, if the performance items or managed devices are used as elements, At least the first performance information indicating the time series change of the performance information related to the first element and the second performance information indicating the time series change of the performance information related to the second element are collected by the information collecting means 103, and the correlation model is collected. A correlation function between the first and second performance information is derived using the generation unit 102 and a correlation model is generated based on the correlation function (FIG. 2: step S611), and the correlation change analysis unit 109 is used.
- the collapse of the correlation is calculated from the performance information at the time of operation, and then the failure period is extracted from the time series change of the abnormal child using the failure period extraction unit 110.
- the change information of the abnormality level within the failure period is calculated using the conversion information calculation unit 111 (step S615 in FIG. 2), and the influence factor (service execution unit) within the failure period is calculated using the abnormality degree distribution information calculation unit 113. 101) distribution information is calculated, and the degree of abnormality and the distribution of elements (service execution means 101) are presented to the administrator (step S617 in FIG. 2).
- each of the above operation steps may be programmed to be executable by a computer, and may be executed by the operation management apparatus 100 which is a computer that directly executes each of the steps.
- the failure period extraction unit 110 extracts the failure period from the time series change of the abnormality degree, and the abnormality degree change information calculation unit 111 and the abnormality degree distribution information calculation unit 113 perform correlation within the failure period. Change summary information is generated.
- the administrator can accurately grasp an outline of which period is a failure and what kind of abnormality the failure is.
- the failure period is specified based on the degree of coincidence with the correlation model indicating the correlation at the normal time, when the determination value is small (the degree of coincidence is high), the system In comparison with the case where only the threshold value for the performance information is used for determination, it is possible to clearly distinguish the abnormal period from the normal period.
- the operation management apparatus 100 detects not only an abnormal value for each element but also an abnormality caused by a relationship with a performance value of another element having an input / output relationship such as a bottleneck. It becomes possible. Since it is possible to accurately present to the administrator which element is abnormal, it is possible for the administrator to reduce mistakes and take effective measures.
- the abnormal distribution for each group has been described as an example of a stacked graph.
- the present invention is not limited to this example, and other methods can be used as long as the breakdown of abnormal elements within the failure period can be presented. The same effect can be obtained even if is used.
- the example of illustrating the failure period on the graph of the display screen has been described.
- the present invention is not limited to this example, and a function of event analysis performed by the failure analysis unit 104 by issuing a message indicating failure start or end. Information presentation and countermeasures may be performed using the. Even in this case, by specifying the failure period from the correlation change, the effect that the performance failure can be specified accurately can be obtained.
- the operation management apparatus 200 includes a failure analysis unit 104 that detects the occurrence of a failure from the first and second performance information, and a correlation model.
- the apparatus further includes performance classification information generation means 216 that generates performance classification information by classifying performance information from the strength of correlation between performance information and the pattern of related elements.
- the past failure information accumulation unit 214 that accumulates the history of failures analyzed by the failure analysis unit 104, and the abnormality degree change calculated by the abnormality degree change information calculation unit 111 for the information stored in the past failure information accumulation unit 214, respectively.
- the abnormality degree distribution information calculated by the information and abnormality degree distribution information calculating means 113 there is a similar failure searching means 215 for searching for a trouble similar to the abnormality degree change information and abnormality degree distribution information.
- the operation management apparatus 200 automatically generates a group of performance information and can perform a similar search, thereby eliminating the need for the administrator to create performance classification information. Can be reduced.
- FIG. 6 is an explanatory diagram showing the configuration of the operation management apparatus 200 according to the second embodiment of the present invention.
- the past failure information storage unit 214, the similar failure search unit 215, and the performance classification information generation unit 216 include an abnormality degree analysis unit 115. It is characterized by comprising. Since the failure analysis unit 104 is included in the operation management apparatus 100 according to the first embodiment, it is also included in the operation management apparatus 200.
- the past failure information storage means 214 is realized by a nonvolatile storage means such as a disk device, which is provided in the operation management apparatus 200 in advance. Since the other constituent elements have the same operations and actions as the operation management apparatus 100 according to the first embodiment, the element names and reference numbers are all the same.
- the past failure information accumulation unit 214 accumulates the history of failures analyzed by the failure analysis unit 104.
- the similar fault search unit 215 receives the abnormal degree change information and the abnormal degree distribution information from the abnormal degree change information calculation unit 111 and the abnormal degree distribution information calculation unit 113, respectively, and searches for similar faults from the past fault information storage unit 214.
- the performance classification information generation unit 216 reads the correlation model from the correlation model storage unit 108, classifies the performance information from the strength of the correlation between the performance information and the pattern of the relationship elements, and generates the performance classification information.
- FIG. 7 is a flowchart showing the operation of the operation management apparatus 200 shown in FIG.
- the operation of the operation management apparatus 200 according to the present embodiment newly includes step S622 and step S628 described below in addition to the operation of the operation management apparatus 100 according to the first embodiment shown in FIG.
- the performance classification information generation unit 216 reads the correlation model from the correlation model storage unit 108, and the correlation strength between the performance information and The performance classification information is generated by classifying the performance information from the pattern of the related elements (step S622).
- the performance classification information generation unit 216 performs the performance information of the service execution unit 101 by using a general classification method. If the performance information has a certain relationship, the performance classification information generation unit 216 determines the system configuration from the behavior. The performance information may be classified by estimating the group. For example, if the service execution unit 101 is a server group in which the load is distributed, in a situation where a certain amount of steady load is applied, each input and processing amount show an equal value. A relationship is generated. Further, when the service execution unit 101 has a flow of processing such as a “Web” server or an “AP” server, the relationship from the previous stage to the subsequent stage is clear in chronological order, but the reverse relationship becomes weak. The characteristics of this can be considered. In addition, there are inversion relations such as used memory and free memory, and summed values. The performance classification information generation unit 216 generates the performance information classification information of the service execution unit 101 in consideration of the information described above.
- the performance classification information generated by the performance classification information generation unit 216 is used.
- the abnormality degree distribution information calculation unit 113 calculates abnormality degree distribution information (step S627).
- the similar failure searching unit 215 receives the abnormality degree change information calculated by the abnormality degree change information calculating unit 111 and the abnormality degree distribution information calculated by the abnormality degree distribution information calculating unit 113, and stores them in the past failure information accumulating unit 214. A case having a similar abnormality degree change or abnormality degree distribution is searched from the accumulated past trouble cases, and the contents are output (step S628).
- the failure analysis unit 104 analyzes the failure based on the information searched by the similar failure search unit 215 and the information acquired by the information collection unit 103, and the analysis result is sent to the administrator dialogue unit 105 in this way. The failure content analyzed in this way is presented to the administrator (step S629).
- the performance classification information generation unit 216 automatically generates a group of performance information of the service execution unit from the correlation included in the correlation model. The burden on the administrator who creates the performance classification information for classifying information can be greatly reduced.
- the similar failure searching means 215 searches for past cases according to the extracted abnormality degree change and abnormality degree distribution in the failure period.
- the general-purpose operation management apparatus uses an error message generated at the time of failure to search for a failure case, and in order to search for similar information of continuously changing information such as performance information, Processing with heavy processing load such as searching for a multidimensional state space is required.
- key information for searching for past cases is generated as a failure period or abnormality distribution, a similarity search of performance information is performed without increasing the processing load. I can do things.
- the operation management apparatus 300 uses, for each element (service execution unit 101), the classification information and the order information included in the correlation model and the performance information.
- An abnormality distribution pattern that is assumed when a failure occurs in the element and spreads to other elements (service execution means 101) is predicted, and the abnormality distribution information is compared with the abnormality distribution pattern to determine which failure has occurred. It has a failure element estimation means 317 for estimating whether the element has occurred. With this configuration, the operation management apparatus 300 can accurately estimate the element in which an abnormality has occurred, thereby reducing handling errors and realizing more efficient handling.
- FIG. 8 is an explanatory diagram showing the configuration of the operation management apparatus 300 according to the third embodiment of the present invention.
- the operation management apparatus 300 includes a failure factor estimation unit 317 in the abnormality degree analysis unit 115.
- the performance classification information stored in the performance classification information storage unit 112 newly holds order information indicating the processing order between groups in addition to the classification information indicating the group of performance information. Since the constituent elements other than these have the same operations and actions as those of the operation management apparatus 200 according to the second embodiment except for the points described below, the element names and reference numbers are all the same.
- the failure element estimation unit 317 receives the classification information and the order information included in the correlation model and the performance classification information stored in the correlation model storage unit 108 and the performance classification information storage unit 112, and receives an element (service execution unit 101) in the system. ), The degree of abnormality distribution pattern assumed when each element becomes a failure and spreads to other elements (service execution means 101) is predicted. Furthermore, the abnormality degree distribution information is received from the abnormality degree distribution information calculation means 113 and compared with the abnormality degree distribution pattern predicted by itself, thereby estimating which element in the system is the failure.
- the similar fault search means 215 newly has a function of searching for information including fault element information estimated by the fault element estimation means 317 when searching for past cases.
- the fault analysis means 104 is a manager dialog means 105. A new function for presenting the analysis result to the administrator is provided.
- FIG. 9 is a flowchart showing the operation of the operation management apparatus 300 shown in FIG.
- the operation of the operation management apparatus 300 according to the present embodiment includes steps S633 and S639 described below in addition to the operation of the operation management apparatus 200 according to the second embodiment shown in FIG.
- step S631 after the correlation model is generated (step S631) and the performance classification information is generated (step S632), the failure element estimation unit 317 and the correlation model read from the correlation model storage unit 108 The performance classification information read from the performance classification information accumulating unit 112 is compared, and for each element in the system, an abnormal degree distribution pattern assumed when each element becomes a failure is predicted (step S633).
- FIG. 10 is an explanatory diagram showing an outline of the operation of the failure element estimation means 317 shown in FIG.
- the abnormality degree pattern 331 shows an example of the abnormality degree distribution pattern estimated by the failure element estimation means 317.
- the abnormality pattern 331 indicates which correlation is found when a correlation included in the correlation model is searched from the performance information as a failure element according to the processing order between groups when a certain element in the system becomes a failure. It is calculated in advance whether it will be destroyed.
- the abnormality degree distribution has a large correlation change in the “Web” group having a large number of units, and a small correlation change in the other groups.
- the abnormality degree distribution pattern when the servers of the “AP” group and the “DB” group are abnormal is predicted.
- the failure element estimation means 317 displays the degree of abnormality.
- the abnormality degree distribution information received from the distribution information calculation unit 113 is compared with the abnormality degree distribution pattern predicted in step S633 to estimate which element in the system is a failure (step S639).
- the similar fault search means 215 searches past cases including the estimation result (step S640), and the fault analysis means 104 analyzes the fault contents analyzed in this way via the administrator dialogue means 105. Presented to the administrator (step S641).
- FIG. 11 and 12 are explanatory diagrams showing examples of display screens 343 and 344 that are presented to the administrator by the failure analysis means 104 shown in FIG. 8 as described above. Similar to the display screen 142 of FIG. 5, the display screen 343 of FIG. 11 illustrates the abnormality degree graph 343 a, and the display screen 344 of FIG. 12 illustrates a stacked graph 344 a of the abnormality degree distribution.
- the failure element estimation unit 317 predicts an abnormality level pattern when an element in the system becomes abnormal, and compares it with the calculated abnormality degree distribution information.
- an estimation result as to which element is abnormal can be presented to the administrator.
- the number of “AP” groups is small and the number of other groups is larger, so there is a risk that the administrator misidentifies the failure as another group.
- the present embodiment by tracing the correlation according to the processing order, it is possible to present to the administrator an estimation result that the case of this distribution is a failure of the “AP” group. Thereby, it is possible to reduce coping errors and realize more efficient coping.
- the operation management apparatus 400 according to the fourth embodiment of the present invention is an apparatus having the same configuration as that of the operation management apparatus 300 according to the third embodiment, and the failure period extraction means uses the failure period as the failure start period and the failure continuation period. Categorize into periods and failure termination periods By providing this configuration, the operation management apparatus 400 can accurately present the cause of the failure and its effect to the administrator.
- the failure period extraction unit 110 newly adds a failure start period that continuously increases from a value that is less than or equal to the normal threshold to a value that is greater than or equal to the failure threshold, and a value that is less than or equal to the normal threshold after the failure start period. It has a function of dividing the failure period into a failure end period that lasts for a fixed number of times and a failure continuation period that is sandwiched between the failure start period and the failure end period. Furthermore, the abnormality degree change information calculation unit 111 and the abnormality degree distribution information calculation unit 113 have a new function of calculating abnormality degree change information and abnormality degree distribution information for each period.
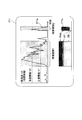
- FIG. 13 is a graph 472 showing an example of the abnormality degree distribution calculated by the abnormality degree change information calculating unit 111 and the abnormality degree distribution information calculating unit 113 in the operation management apparatus 400 described above.
- the graph 472 includes a graph 472a indicating a time-series change in the degree of abnormality and a stacked graph 472b indicating the degree of abnormality distribution.
- the abnormality period distribution is uniform in each of the failure period 1 and the failure period 2.
- the failure period extracting unit 110 divides each failure period into three periods of a failure start period, a failure continuation period, and a failure end period.
- the abnormality degree distribution information calculation unit 111 and the abnormality degree distribution information calculation unit 113 generate an abnormality degree distribution for each divided period.
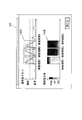
- FIG. 14 shows an example of a display screen 445 that the manager interaction means 105 presents to the administrator in the operation management apparatus 400 described above.
- the distribution screen of failure 1 and failure 2 is divided into three stacked graphs with respect to the display screen 344 described in FIG. 12 in the third embodiment.
- the failure 1 has a distribution with a lot of abnormalities in the “Web” group in the failure start period, and a distribution with a lot of abnormalities in the “DB” group in the failure continuation period.
- the administrator can grasp what distribution is present when a failure occurs, and which range is affected thereafter.
- an accurate distribution cannot be extracted unless the failure period ends, and when the failure continues for a long period of time, the distribution at the time of occurrence of the failure is the There is a problem that it becomes difficult to understand due to the influence of the distribution.
- the distribution at the time of the failure and the distribution of the continuing period can be separated, so that it becomes possible to quickly grasp the contents of the failure when the failure occurs,
- the cause (distribution at the time of occurrence) and the range of influence (distribution at the time of continuation) can be distinguished. Furthermore, it is possible to grasp the status of return to the normal state based on the distribution at the time of failure termination.
- the present invention is an information processing apparatus that provides an information communication service such as a WEB service or a business service, and can be applied to an operation management apparatus that detects and localizes system performance degradation in the information processing apparatus. .
- Performance classification information generation means 100, 200, 300, 400 Operation management apparatus 101 Service execution means 102 Performance information storage means 103 Information collection means 104 Failure analysis means 105 Administrator interaction means 106 Coping execution means 107 Correlation model generation means 108 Correlation model storage means 109 Correlation change analysis Means 110 Failure period extraction means 111 Abnormality change information calculation means 112 Performance classification information accumulation means 113 Abnormality distribution information calculation means 114 Control unit 115 Abnormality analysis part 131 Performance classification information 142 Display screen 142a Abnormality graph 142b Abnormality distribution 161 , 362 Relationship diagram 171 Abnormality distribution 171a, 171b Graph 214 Past failure information storage means 215 Similar failure search means 216 Performance classification information generation means 317 Failure element estimation means 331 Abnormality pattern 43,344,445 display screen 472,472A, lists 472b graph 511 the performance information 521 correlation model 541 display screen 541a largest element of the correlation destruction number 541b correlation diagram 541c abnormality degree
Landscapes
- Engineering & Computer Science (AREA)
- Theoretical Computer Science (AREA)
- General Engineering & Computer Science (AREA)
- Quality & Reliability (AREA)
- Physics & Mathematics (AREA)
- General Physics & Mathematics (AREA)
- Computer Hardware Design (AREA)
- Computer Networks & Wireless Communication (AREA)
- Signal Processing (AREA)
- Debugging And Monitoring (AREA)
Abstract
Description
以下、本発明の実施形態の構成について添付図に基づいて説明する。
最初に、本実施形態の基本的な内容について説明し、その後でより具体的な内容について説明する。
本実施形態に係る運用管理装置100は、システムを構成する単数または複数の被管理装置(サービス実行手段101)から複数種の性能種目毎の性能情報を取得して、前記被管理装置を運用管理する運用管理装置であって、性能種目又は被管理装置を要素とした場合に、要素(サービス実行手段101)から少なくとも第1の要素に関する性能情報の時系列変化を示す第1の性能情報および第2の要素に関する性能情報の時系列変化を示す第2の性能情報とを収集する情報収集手段103と、前記情報収集手段103が収集した第1および第2の性能情報との間の相関関数を導出し、この相関関数に基づいて相関モデルを生成する相関モデル生成手段107と、前記情報収集手段103が取得した現在の第1および第2の性能情報が相関関数で示された関係を一定の誤差範囲内で満たしているか否かを判定する相関変化分析手段109と、前記相関変化分析手段109が第1および第2の性能情報が相関関数で示された関係を満たしていない状態であると判定した場合に、該状態である期間を障害期間として抽出する障害期間抽出手段110とを有する。
以下、これをより詳細に説明する。
そこで、本発明に係る実施形態1は、上述した比較例の問題を解決するため、図1に示す様に前記制御部114に異常度分析部115を装備するという構成を採っている。
異常度分析部115は、障害期間抽出手段110と、異常度変化情報算出手段111と、性能分類情報蓄積手段112と、異常度分布情報算出手段113とを有している。このうち、性能分類情報蓄積手段112は、運用管理装置100が予め備える、ディスク装置などのような不揮発性記憶手段によって実現される。障害期間抽出手段110、異常度変化情報算出手段111、異常度分布情報算出手段113は、制御部114を構成するCPUにコンピュータプログラムを実行させることによりソフトウェア上で実現している。なお、障害期間抽出手段110、異常度変化情報算出手段111、異常度分布情報算出手段113をソフトウェア上で実現させているが、これに限られるものではなく、これらをハードウェアの構成により構築してもよいものである。
以上のステップまでの本発明の実施形態1に係る運用管理装置100の動作は上述した比較例と同様である。
次に、本発明の実施形態1に係る運用管理装置100における特徴的な動作について説明する。
次に、前記異常度変化情報算出手段111及び前記異常度分布情報算出手段113が実行する動作について詳細に説明する。
「AP」のサーバのグループには、「D.*」,「E.*」の性能情報が含まれている。「D.*」は前記APグループのサーバD(サービス実行手段101)の持つ全ての性能情報を示すものである。「E.*」は前記APグループのサーバE(サービス実行手段101)の持つ全ての性能情報を示すものである。
「DB」のサーバのグループには、「F.*」,「G.*」の性能情報が含まれている。「F.*」は前記DBグループのサーバF(サービス実行手段101)の持つ全ての性能情報を示すものである。「G.*」は前記DBグループのサーバG(サービス実行手段101)の持つ全ての性能情報を示すものである。
前記図3に示す性能分類情報131に従って、異常度分布情報算出手段113は、前記障害期間抽出手段110が抽出した障害期間1,2内の相関変化に関係する性能情報をサーバA~Gのグループに分類し、図4の下段に示す異常度の分布情報、すなわち、図4の下段に記載したグラフ171bの部分要素である「Web」グループ、「AP」グループ、「DB」グループの高さを前記障害期間1,2毎に決定し、前記障害期間1,2における部分要素の異常度分布を示す積み上げグラフ171bを生成する。
図4の下段に示す例では、前記異常度分布情報算出手段113は、障害期間1における部分要素の異常度分布情報として、「DB」グループに関する相関変化が過半数を占め、次に「Web」グループに関する相関変化が多く、「AP」グループに関する相関変化が少数となっている異常度分布情報を生成する。また、前記異常度分布情報算出手段113は、障害期間2における部分要素の異常度分布情報として、「Web」グループに関する相関変化が大半を占め、「AP」グループおよび「DB」グループに関する相関変化が少数となっている異常度分布情報を作成する。
したがって、図5の下段に示す異常度分布142bを参照すると、その異常度分布142aに、前記異常度変化情報算出手段111が算出した異常度変化情報と前記異常度分布情報算出手段113が算出した異常度分布情報とが積み上げグラフとして表示されるため、管理者は、障害期間1で「DB」グループに関係する障害が発生した後、障害期間2,3において「WEB」グループに関係する障害が連続して発生していることが理解できる。このため、管理者は、図5の下段に示す異常度分布142aの表示に基づいてより正確に状況を把握し、的確な対処を行うことができる。管理者は、例えば原因追求のために最初の障害期間1に発生した「DB」グループの障害状況を詳細に確認したり、影響範囲を調べるために障害期間2,3の障害の内容を詳細に確認したりといったことが可能となる。
本発明の第2の実施形態に係る運用管理装置200は、第1の実施形態に加えて、第1および第2の性能情報から障害の発生を検出する障害分析手段104と、相関モデルから、性能情報間の相関関係の強さおよび関係する要素のパターンから性能情報を分類して性能分類情報を生成する性能分類情報生成手段216をさらに有する。
この構成を備えることにより、運用管理装置200は、性能情報のグループを自動的に生成して、類似探索が可能となったことによって、管理者が性能分類情報を作成する必要がなくなり、その負荷を低減できる。
本発明の第3の実施形態に係る運用管理装置300は、第2の実施形態に加えて、相関モデルおよび性能情報に含まれる分類情報と順序情報から、要素(サービス実行手段101)毎に、該要素に障害が発生して他の要素(サービス実行手段101)に波及する場合に想定される異常度分布パターンを予測し、異常度分布情報と異常度分布パターンとを比較して障害がどの要素において発生したかを推定する障害要素推定手段317を有する。
この構成を備えることにより、運用管理装置300は、異常の発生した要素を正確に推定でき、これによって対処ミスを低減し、より効率的な対処を実現することができる。
本発明の第4の実施形態に係る運用管理装置400は、第3の実施形態に係る運用管理装置300と同一の構成の装置で、障害期間抽出手段が、障害期間を障害開始期間、障害継続期間、および障害終了期間に分類する。
この構成を備えることにより、運用管理装置400は、障害の原因とその影響について管理者に対して正確に提示することが可能となる。
101 サービス実行手段
102 性能情報蓄積手段
103 情報収集手段
104 障害分析手段
105 管理者対話手段
106 対処実行手段
107 相関モデル生成手段
108 相関モデル蓄積手段
109 相関変化分析手段
110 障害期間抽出手段
111 異常度変化情報算出手段
112 性能分類情報蓄積手段
113 異常度分布情報算出手段
114 制御部
115 異常度分析部
131 性能分類情報
142 表示画面
142a 異常度グラフ
142b 異常度分布
161、362 関係図
171 異常度分布
171a、171b グラフ
214 過去障害情報蓄積手段
215 類似障害探索手段
216 性能分類情報生成手段
317 障害要素推定手段
331 異常度パターン
343、344、445 表示画面
472、472a、472b グラフ
511 性能情報
521 相関モデル
541 表示画面
541a 相関破壊数
541b 相関関係図
541c 異常度合いの大きい要素のリスト
Claims (14)
- システムを構成する単数または複数の被管理装置から複数種の性能種目毎の性能情報を取得して、前記被管理装置を運用管理する運用管理装置であって、
前記性能種目または前記被管理装置を要素とした場合に、前記要素から少なくとも第1の要素に関する性能情報の時系列変化を示す第1の性能情報および第2の要素に関する性能情報の時系列変化を示す第2の性能情報とを収集する情報収集手段と、
前記第1および第2の性能情報の間の相関関数を導出し、この相関関数に基づいて相関モデルを生成する相関モデル生成手段と、
前記情報収集手段が取得した現在の前記第1および第2の性能情報が前記相関関数で示された関係を一定の誤差範囲内で満たしているか否かを判定する相関変化分析手段と、
前記相関変化分析手段が前記第1および第2の性能情報が前記相関関数で示された関係を満たしていない状態であると判定した場合に、該状態である期間を障害期間として抽出する障害期間抽出手段とを有することを特徴とする運用管理装置。 - 前記障害期間抽出手段の抽出した障害期間の間、前記第1および第2の性能情報が前記相関関数から外れた度合いである異常度についての統計情報を異常度変化情報として算出する異常度変化情報算出手段を有することを特徴とする、請求項1に記載の運用管理装置。
- 前記性能情報を複数種類に分類し、性能分類情報として保存する性能分類情報蓄積手段と、
前記性能分類情報蓄積手段に蓄積された性能分類情報から、前記障害期間内に変化した相関関係に含まれる前記性能情報とその異常度とを抽出して前記性能情報の前記要素毎の異常度の分布を示す異常度分布情報を算出する異常度分布情報算出手段とを有することを特徴とする、請求項2に記載の運用管理装置。 - 前記相関モデルから、前記性能情報間の相関関係の強さおよび関係する前記要素のパターンから前記性能情報を分類して性能分類情報を生成する性能分類情報生成手段を有することを特徴とする、請求項3に記載の運用管理装置。
- 前記第1および第2の性能情報から障害の発生を検出する障害分析手段と、
前記障害分析手段によって分析された障害の履歴を蓄積する過去障害情報蓄積手段と、
前記過去障害情報蓄積手段に記憶された情報を前記異常度変化情報および前記異常度分布情報と比較して、これらの異常度変化情報および異常度分布情報と類似する障害を検索する類似障害探索手段とを有することを特徴とする、請求項3に記載の運用管理装置。 - 前記相関モデルおよび前記性能情報に含まれる分類情報と順序情報から、前記要素毎に、該要素に障害が発生して他の要素に波及する場合に想定される異常度分布パターンを予測し、前記異常度分布情報と異常度分布パターンとを比較して前記障害がどの要素において発生したかを推定する障害要素推定手段を有することを特徴とする、請求項4に記載の運用管理装置。
- 前記障害期間抽出手段が、前記障害期間を障害開始期間、障害継続期間、および障害終了期間に分類することを特徴とする、請求項1ないし請求項6のうちいずれか1項に記載の運用管理装置。
- システムを構成する単数または複数の被管理装置から複数種の性能種目毎の性能情報を取得して、前記被管理装置を運用管理する運用管理方法であって、
前記性能種目又は前記被管理装置を要素とした場合に、前記要素から少なくとも第1の要素に関する性能情報の時系列変化を示す第1の性能情報および第2の要素に関する性能情報の時系列変化を示す第2の性能情報とを収集し、
前記第1および第2の性能情報の間の相関関数を導出し、その相関関数に基づいて相関モデルを生成し、
前記取得した前記第1および第2の性能情報が前記相関関数で示された関係を一定の誤差範囲内で満たしているか否かを判定し、
前記第1および第2の性能情報が前記相関関数で示された関係を満たしていない状態であると判定された場合に、該状態である期間を障害期間として抽出することを特徴とする運用管理方法。 - 前記抽出した障害期間の間、前記第1および第2の性能情報が前記相関関数から外れた度合いである異常度についての統計情報を異常度変化情報として算出することを特徴とする、請求項8に記載の運用管理方法。
- 前記性能情報を複数種類に分類し、性能分類情報として保存し、
前記性能分類情報から、前記障害期間内に変化した相関関係に含まれる前記性能情報とその異常度とを抽出して前記性能情報の前記要素毎の異常度の分布を示す異常度分布情報を算出することを特徴とする請求項9に記載の運用管理方法。 - 前記相関モデルから、前記性能情報間の相関関係の強さおよび関係する前記要素のパターンから前記性能情報を分類して性能分類情報を生成することを特徴とする請求項10に記載の運用管理方法。
- 記憶された過去の障害履歴情報を前記異常度変化情報および前記異常度分布情報と比較して、これらの異常度変化情報および異常度分布情報と類似する障害を検索することを特徴とする請求項10に記載の運用管理方法。
- 前記相関モデルおよび前記性能情報に含まれる分類情報と順序情報から、前記要素毎に、該要素に障害が発生して他の要素に波及する場合に想定される異常度分布パターンを予測し、前記異常度分布情報と異常度分布パターンとを比較して前記障害がどの要素において発生したかを推定することを特徴とする請求項11に記載の運用管理方法。
- システムを構成する単数または複数の被管理装置から複数種の性能種目毎の性能情報を取得して、前記被管理装置を運用管理する運用管理装置を制御するコンピュータに、
前記性能種目又は前記被管理装置を要素とした場合に、前記要素から少なくとも第1の要素に関する性能情報の時系列変化を示す第1の性能情報および第2の要素に関する性能情報の時系列変化を示す第2の性能情報とを収集する機能と、
前記第1および第2の性能情報の間の相関関数を導出し、その相関関数に基づいて相関モデルを生成する機能と、
前記情報収集手段が取得した現在の前記第1および第2の性能情報が前記相関関数で示された関係を一定の誤差範囲内で満たしているか否かを判定する機能と、
前記第1および第2の性能情報が前記相関関数で示された関係を満たしていない状態であると判定された場合に、該状態である期間を障害期間として抽出する機能とを実行させることを特徴とする運用管理プログラム。
Priority Applications (5)
| Application Number | Priority Date | Filing Date | Title |
|---|---|---|---|
| EP09814546.9A EP2330510B1 (en) | 2008-09-18 | 2009-09-14 | Operation management device, operation management method, and operation management program |
| US13/003,793 US8700953B2 (en) | 2008-09-18 | 2009-09-14 | Operation management device, operation management method, and operation management program |
| CN200980127693.8A CN102099795B (zh) | 2008-09-18 | 2009-09-14 | 运用管理装置、运用管理方法和运用管理程序 |
| JP2010529747A JP5375829B2 (ja) | 2008-09-18 | 2009-09-14 | 運用管理装置、運用管理方法、および運用管理プログラム |
| US14/188,190 US9507687B2 (en) | 2008-09-18 | 2014-02-24 | Operation management device, operation management method, and operation management program |
Applications Claiming Priority (2)
| Application Number | Priority Date | Filing Date | Title |
|---|---|---|---|
| JP2008-239068 | 2008-09-18 | ||
| JP2008239068 | 2008-09-18 |
Related Child Applications (2)
| Application Number | Title | Priority Date | Filing Date |
|---|---|---|---|
| US13/003,793 A-371-Of-International US8700953B2 (en) | 2008-09-18 | 2009-09-14 | Operation management device, operation management method, and operation management program |
| US14/188,190 Continuation US9507687B2 (en) | 2008-09-18 | 2014-02-24 | Operation management device, operation management method, and operation management program |
Publications (1)
| Publication Number | Publication Date |
|---|---|
| WO2010032701A1 true WO2010032701A1 (ja) | 2010-03-25 |
Family
ID=42039525
Family Applications (1)
| Application Number | Title | Priority Date | Filing Date |
|---|---|---|---|
| PCT/JP2009/065990 WO2010032701A1 (ja) | 2008-09-18 | 2009-09-14 | 運用管理装置、運用管理方法、および運用管理プログラム |
Country Status (5)
| Country | Link |
|---|---|
| US (2) | US8700953B2 (ja) |
| EP (1) | EP2330510B1 (ja) |
| JP (1) | JP5375829B2 (ja) |
| CN (1) | CN102099795B (ja) |
| WO (1) | WO2010032701A1 (ja) |
Cited By (24)
| Publication number | Priority date | Publication date | Assignee | Title |
|---|---|---|---|---|
| JP2011201336A (ja) * | 2010-03-24 | 2011-10-13 | Hitachi Ltd | 移動体異常判断支援システム |
| WO2011155621A1 (ja) * | 2010-06-07 | 2011-12-15 | 日本電気株式会社 | 障害検出装置、障害検出方法およびプログラム記録媒体 |
| JP2012108708A (ja) * | 2010-11-17 | 2012-06-07 | Nec Corp | 障害検知装置、情報処理方法、およびプログラム |
| WO2012086824A1 (ja) * | 2010-12-20 | 2012-06-28 | 日本電気株式会社 | 運用管理装置、運用管理方法、及びプログラム |
| WO2012128388A1 (ja) * | 2011-03-23 | 2012-09-27 | 日本電気株式会社 | 運用管理システム、運用管理方法、及びプログラム |
| JP2012190378A (ja) * | 2011-03-14 | 2012-10-04 | Kddi Corp | サーバシステム |
| WO2013027562A1 (ja) * | 2011-08-24 | 2013-02-28 | 日本電気株式会社 | 運用管理装置、運用管理方法、及びプログラム |
| WO2013136739A1 (ja) | 2012-03-14 | 2013-09-19 | 日本電気株式会社 | 運用管理装置、運用管理方法、及び、プログラム |
| JP2014507727A (ja) * | 2011-02-14 | 2014-03-27 | インターナショナル・ビジネス・マシーンズ・コーポレーション | パフォーマンス・メトリックを監視するためのコンピュータによって実施される方法、コンピュータ可読記憶媒体、およびシステム |
| WO2014109112A1 (ja) * | 2013-01-11 | 2014-07-17 | 株式会社日立製作所 | 情報処理システム監視装置、監視方法、及び監視プログラム |
| JP2014132421A (ja) * | 2013-01-07 | 2014-07-17 | Fujitsu Ltd | 分析方法、分析装置、及び分析プログラム |
| WO2014125796A1 (ja) | 2013-02-18 | 2014-08-21 | 日本電気株式会社 | システム分析装置、及び、システム分析方法 |
| EP2884695A1 (en) | 2013-12-16 | 2015-06-17 | Hitachi, Ltd. | Management server and control method for management server |
| JP2015153077A (ja) * | 2014-02-13 | 2015-08-24 | 日本電信電話株式会社 | 監視機器情報分析装置及び方法及びプログラム |
| WO2015145664A1 (ja) * | 2014-03-27 | 2015-10-01 | 株式会社日立製作所 | リソース管理方法およびリソース管理システム |
| JP2015197850A (ja) * | 2014-04-02 | 2015-11-09 | 三菱電機ビルテクノサービス株式会社 | 設備監視装置及びプログラム |
| JP2017523526A (ja) * | 2014-07-30 | 2017-08-17 | マイクロソフト テクノロジー ライセンシング,エルエルシー | 分散システムにおける故障解析のための視覚ツール |
| WO2018122890A1 (ja) * | 2016-12-27 | 2018-07-05 | 日本電気株式会社 | ログ分析方法、システムおよびプログラム |
| US10069699B2 (en) | 2015-02-26 | 2018-09-04 | Nippon Telegraph And Telephone Corporation | Monitoring device information analyzing device and method, and non-transitory storage medium storing program |
| JP2019191929A (ja) * | 2018-04-25 | 2019-10-31 | 株式会社日立製作所 | 性能分析方法および管理計算機 |
| US10977108B2 (en) | 2017-01-18 | 2021-04-13 | Fujitsu Limited | Influence range specifying method, influence range specifying apparatus, and storage medium |
| JP2021071889A (ja) * | 2019-10-30 | 2021-05-06 | 富士通株式会社 | システム分析方法、およびシステム分析プログラム |
| CN114471408A (zh) * | 2022-01-27 | 2022-05-13 | 广东天航动力科技有限公司 | 一种粉体材料生产用自动监控系统 |
| JP7302908B1 (ja) | 2022-02-21 | 2023-07-04 | Necプラットフォームズ株式会社 | 運用管理システム、運用管理方法及び運用管理のためのコンピュータプログラム |
Families Citing this family (22)
| Publication number | Priority date | Publication date | Assignee | Title |
|---|---|---|---|---|
| EP2330510B1 (en) * | 2008-09-18 | 2019-12-25 | NEC Corporation | Operation management device, operation management method, and operation management program |
| EP2228770B1 (de) * | 2009-03-10 | 2012-08-01 | Siemens Aktiengesellschaft | Verfahren und Datenverarbeitungsgerät zur Erzeugung und zur Ausgabe eines mehrdimensionalen Diagramms mit mindestens zwei Graphen |
| US9513403B2 (en) * | 2009-07-27 | 2016-12-06 | Peck Labs, Inc | Methods and systems for displaying customized icons |
| US8677191B2 (en) * | 2010-12-13 | 2014-03-18 | Microsoft Corporation | Early detection of failing computers |
| CN102609346B (zh) * | 2012-01-16 | 2014-12-03 | 深信服网络科技(深圳)有限公司 | 基于业务操作的监控方法和装置 |
| US9367382B2 (en) | 2012-01-23 | 2016-06-14 | Nec Corporation | Apparatus, method, and program product for calculating abnormality based on degree of correlation destruction |
| US9372786B1 (en) * | 2012-06-13 | 2016-06-21 | Amazon Technologies, Inc. | Constructing state-transition functions for mobile devices |
| CN104798049B (zh) * | 2012-11-20 | 2017-08-04 | 日本电气株式会社 | 操作管理装置和操作管理方法 |
| US9761027B2 (en) | 2012-12-07 | 2017-09-12 | General Electric Company | Methods and systems for integrated plot training |
| US20140160152A1 (en) * | 2012-12-07 | 2014-06-12 | General Electric Company | Methods and systems for integrated plot training |
| US10599501B2 (en) | 2015-03-17 | 2020-03-24 | Nec Corporation | Information processing device, information processing method, and recording medium |
| FR3043223A1 (fr) | 2015-11-02 | 2017-05-05 | Bull Sas | Mecanisme d'analyse de correlation lors de la degradation des performances d'une chaine applicative. |
| JP6450032B2 (ja) * | 2016-01-27 | 2019-01-09 | 日本電信電話株式会社 | 作成装置、作成方法、および作成プログラム |
| CN107203450B (zh) * | 2016-03-16 | 2020-06-02 | 伊姆西Ip控股有限责任公司 | 故障的分类方法和设备 |
| JP6717067B2 (ja) * | 2016-06-13 | 2020-07-01 | 富士通株式会社 | 対処履歴分析プログラム、方法、及び装置 |
| JP2018066084A (ja) * | 2016-10-19 | 2018-04-26 | 村田機械株式会社 | 紡績機械管理システム及び管理方法 |
| EP3407273A1 (de) * | 2017-05-22 | 2018-11-28 | Siemens Aktiengesellschaft | Verfahren und anordnung zur ermittlung eines anomalen zustands eines systems |
| US11294758B2 (en) * | 2017-11-30 | 2022-04-05 | Vmware, Inc. | Automated methods and systems to classify and troubleshoot problems in information technology systems and services |
| JP2019200618A (ja) * | 2018-05-16 | 2019-11-21 | 日本電信電話株式会社 | 作成装置、作成方法、および作成プログラム |
| CN108923952B (zh) * | 2018-05-31 | 2021-11-30 | 北京百度网讯科技有限公司 | 基于服务监控指标的故障诊断方法、设备及存储介质 |
| WO2020166011A1 (ja) * | 2019-02-14 | 2020-08-20 | 日本電気株式会社 | 時系列データ処理方法 |
| US11221908B1 (en) * | 2021-03-02 | 2022-01-11 | International Business Machines Corporation | Discovery of an inexplicit link between a change and an incident in a computing environment |
Citations (13)
| Publication number | Priority date | Publication date | Assignee | Title |
|---|---|---|---|---|
| JPH06175626A (ja) | 1992-10-06 | 1994-06-24 | Hitachi Ltd | プラント監視制御装置及びプラント監視方法 |
| JP2002099448A (ja) | 2000-09-21 | 2002-04-05 | Ntt Data Corp | 性能監視装置、及びその方法 |
| JP2005257416A (ja) | 2004-03-10 | 2005-09-22 | Internatl Business Mach Corp <Ibm> | 診断装置、検出装置、制御方法、検出方法、プログラム、及び記録媒体 |
| JP2006048253A (ja) | 2004-08-02 | 2006-02-16 | Internatl Business Mach Corp <Ibm> | 異常検出装置、異常検出方法、異常検出プログラム、及び記録媒体 |
| JP2006092358A (ja) * | 2004-09-24 | 2006-04-06 | Fujitsu Ltd | トレースデータの採取方法、採取プログラム、およびその採取装置 |
| JP2006146668A (ja) * | 2004-11-22 | 2006-06-08 | Ntt Data Corp | 運用管理支援装置及び運用管理支援プログラム |
| JP2007207117A (ja) * | 2006-02-03 | 2007-08-16 | Ns Solutions Corp | 性能監視装置、性能監視方法及びプログラム |
| JP2007272693A (ja) * | 2006-03-31 | 2007-10-18 | Fujitsu Ltd | システム分析プログラム、システム分析方法およびシステム分析装置 |
| JP2007293393A (ja) | 2006-04-20 | 2007-11-08 | Toshiba Corp | 障害監視システムと方法、およびプログラム |
| JP2008059102A (ja) * | 2006-08-30 | 2008-03-13 | Fujitsu Ltd | コンピュータ資源監視プログラム |
| JP4089339B2 (ja) | 2002-07-31 | 2008-05-28 | 日本電気株式会社 | 障害情報表示装置及びプログラム |
| JP2008191849A (ja) * | 2007-02-02 | 2008-08-21 | Ns Solutions Corp | 稼働管理装置、情報処理装置、稼働管理装置の制御方法、情報処理装置の制御方法及びプログラム |
| JP2008239068A (ja) | 2007-03-28 | 2008-10-09 | Denso Corp | 緩衝装置 |
Family Cites Families (20)
| Publication number | Priority date | Publication date | Assignee | Title |
|---|---|---|---|---|
| US7444263B2 (en) * | 2002-07-01 | 2008-10-28 | Opnet Technologies, Inc. | Performance metric collection and automated analysis |
| US7668953B1 (en) * | 2003-11-13 | 2010-02-23 | Cisco Technology, Inc. | Rule-based network management approaches |
| JP3922375B2 (ja) * | 2004-01-30 | 2007-05-30 | インターナショナル・ビジネス・マシーンズ・コーポレーション | 異常検出システム及びその方法 |
| US7424666B2 (en) * | 2005-09-26 | 2008-09-09 | Intel Corporation | Method and apparatus to detect/manage faults in a system |
| US7590513B2 (en) * | 2006-01-30 | 2009-09-15 | Nec Laboratories America, Inc. | Automated modeling and tracking of transaction flow dynamics for fault detection in complex systems |
| EP1895416B1 (en) * | 2006-08-25 | 2011-07-06 | Accenture Global Services Limited | Data visualization for diagnosing computing systems |
| JP4413915B2 (ja) * | 2006-12-13 | 2010-02-10 | 株式会社東芝 | 異常兆候検出装置および方法 |
| US20080155336A1 (en) * | 2006-12-20 | 2008-06-26 | International Business Machines Corporation | Method, system and program product for dynamically identifying components contributing to service degradation |
| US8250408B1 (en) * | 2007-04-02 | 2012-08-21 | Hewlett-Packard Development Company, L.P. | System diagnosis |
| US8095830B1 (en) * | 2007-04-03 | 2012-01-10 | Hewlett-Packard Development Company, L.P. | Diagnosis of system health with event logs |
| JP4990018B2 (ja) * | 2007-04-25 | 2012-08-01 | 株式会社日立製作所 | 装置性能管理方法、装置性能管理システム、および管理プログラム |
| JP4872944B2 (ja) * | 2008-02-25 | 2012-02-08 | 日本電気株式会社 | 運用管理装置、運用管理システム、情報処理方法、及び運用管理プログラム |
| JP4872945B2 (ja) * | 2008-02-25 | 2012-02-08 | 日本電気株式会社 | 運用管理装置、運用管理システム、情報処理方法、及び運用管理プログラム |
| US8015454B1 (en) * | 2008-06-02 | 2011-09-06 | Quest Software, Inc. | Computer systems and methods for predictive performance management of data transactions |
| US8230269B2 (en) * | 2008-06-17 | 2012-07-24 | Microsoft Corporation | Monitoring data categorization and module-based health correlations |
| US8234522B2 (en) * | 2008-09-04 | 2012-07-31 | Telcordia Technologies, Inc. | Computing diagnostic explanations of network faults from monitoring data |
| EP2330510B1 (en) * | 2008-09-18 | 2019-12-25 | NEC Corporation | Operation management device, operation management method, and operation management program |
| US7934131B1 (en) * | 2009-02-24 | 2011-04-26 | Google Inc. | Server farm diagnostic and status system |
| JPWO2011046228A1 (ja) * | 2009-10-15 | 2013-03-07 | 日本電気株式会社 | システム運用管理装置、システム運用管理方法、及びプログラム記憶媒体 |
| JP5910727B2 (ja) * | 2012-03-14 | 2016-04-27 | 日本電気株式会社 | 運用管理装置、運用管理方法、及び、プログラム |
-
2009
- 2009-09-14 EP EP09814546.9A patent/EP2330510B1/en active Active
- 2009-09-14 US US13/003,793 patent/US8700953B2/en active Active
- 2009-09-14 JP JP2010529747A patent/JP5375829B2/ja active Active
- 2009-09-14 WO PCT/JP2009/065990 patent/WO2010032701A1/ja active Application Filing
- 2009-09-14 CN CN200980127693.8A patent/CN102099795B/zh not_active Expired - Fee Related
-
2014
- 2014-02-24 US US14/188,190 patent/US9507687B2/en active Active
Patent Citations (13)
| Publication number | Priority date | Publication date | Assignee | Title |
|---|---|---|---|---|
| JPH06175626A (ja) | 1992-10-06 | 1994-06-24 | Hitachi Ltd | プラント監視制御装置及びプラント監視方法 |
| JP2002099448A (ja) | 2000-09-21 | 2002-04-05 | Ntt Data Corp | 性能監視装置、及びその方法 |
| JP4089339B2 (ja) | 2002-07-31 | 2008-05-28 | 日本電気株式会社 | 障害情報表示装置及びプログラム |
| JP2005257416A (ja) | 2004-03-10 | 2005-09-22 | Internatl Business Mach Corp <Ibm> | 診断装置、検出装置、制御方法、検出方法、プログラム、及び記録媒体 |
| JP2006048253A (ja) | 2004-08-02 | 2006-02-16 | Internatl Business Mach Corp <Ibm> | 異常検出装置、異常検出方法、異常検出プログラム、及び記録媒体 |
| JP2006092358A (ja) * | 2004-09-24 | 2006-04-06 | Fujitsu Ltd | トレースデータの採取方法、採取プログラム、およびその採取装置 |
| JP2006146668A (ja) * | 2004-11-22 | 2006-06-08 | Ntt Data Corp | 運用管理支援装置及び運用管理支援プログラム |
| JP2007207117A (ja) * | 2006-02-03 | 2007-08-16 | Ns Solutions Corp | 性能監視装置、性能監視方法及びプログラム |
| JP2007272693A (ja) * | 2006-03-31 | 2007-10-18 | Fujitsu Ltd | システム分析プログラム、システム分析方法およびシステム分析装置 |
| JP2007293393A (ja) | 2006-04-20 | 2007-11-08 | Toshiba Corp | 障害監視システムと方法、およびプログラム |
| JP2008059102A (ja) * | 2006-08-30 | 2008-03-13 | Fujitsu Ltd | コンピュータ資源監視プログラム |
| JP2008191849A (ja) * | 2007-02-02 | 2008-08-21 | Ns Solutions Corp | 稼働管理装置、情報処理装置、稼働管理装置の制御方法、情報処理装置の制御方法及びプログラム |
| JP2008239068A (ja) | 2007-03-28 | 2008-10-09 | Denso Corp | 緩衝装置 |
Cited By (47)
| Publication number | Priority date | Publication date | Assignee | Title |
|---|---|---|---|---|
| JP2011201336A (ja) * | 2010-03-24 | 2011-10-13 | Hitachi Ltd | 移動体異常判断支援システム |
| EP2579156A4 (en) * | 2010-06-07 | 2015-08-12 | Nec Corp | DEVICE FOR DETECTING MALFUNCTIONS, METHOD FOR DETECTING OBSTACLES AND PROGRAMMING MEDIUM |
| JP5267736B2 (ja) * | 2010-06-07 | 2013-08-21 | 日本電気株式会社 | 障害検出装置、障害検出方法およびプログラム記録媒体 |
| US9529659B2 (en) | 2010-06-07 | 2016-12-27 | Nec Corporation | Fault detection apparatus, a fault detection method and a program recording medium |
| CN103026344B (zh) * | 2010-06-07 | 2015-09-09 | 日本电气株式会社 | 故障检测设备、故障检测方法和程序记录介质 |
| WO2011155621A1 (ja) * | 2010-06-07 | 2011-12-15 | 日本電気株式会社 | 障害検出装置、障害検出方法およびプログラム記録媒体 |
| CN103026344A (zh) * | 2010-06-07 | 2013-04-03 | 日本电气株式会社 | 故障检测设备、故障检测方法和程序记录介质 |
| JP2012108708A (ja) * | 2010-11-17 | 2012-06-07 | Nec Corp | 障害検知装置、情報処理方法、およびプログラム |
| WO2012086824A1 (ja) * | 2010-12-20 | 2012-06-28 | 日本電気株式会社 | 運用管理装置、運用管理方法、及びプログラム |
| US8874963B2 (en) | 2010-12-20 | 2014-10-28 | Nec Corporation | Operations management apparatus, operations management method and program thereof |
| EP2657843A4 (en) * | 2010-12-20 | 2015-08-12 | Nec Corp | OPERATING MANAGEMENT DEVICE, OPERATING MANAGEMENT PROCESS AND PROGRAM THEREFOR |
| US10558544B2 (en) | 2011-02-14 | 2020-02-11 | International Business Machines Corporation | Multiple modeling paradigm for predictive analytics |
| JP2014507727A (ja) * | 2011-02-14 | 2014-03-27 | インターナショナル・ビジネス・マシーンズ・コーポレーション | パフォーマンス・メトリックを監視するためのコンピュータによって実施される方法、コンピュータ可読記憶媒体、およびシステム |
| US10558545B2 (en) | 2011-02-14 | 2020-02-11 | International Business Machines Corporation | Multiple modeling paradigm for predictive analytics |
| JP2012190378A (ja) * | 2011-03-14 | 2012-10-04 | Kddi Corp | サーバシステム |
| US9417940B2 (en) | 2011-03-23 | 2016-08-16 | Nec Corporation | Operations management system, operations management method and program thereof |
| WO2012128388A1 (ja) * | 2011-03-23 | 2012-09-27 | 日本電気株式会社 | 運用管理システム、運用管理方法、及びプログラム |
| JP5267748B2 (ja) * | 2011-03-23 | 2013-08-21 | 日本電気株式会社 | 運用管理システム、運用管理方法、及びプログラム |
| US10430268B2 (en) | 2011-03-23 | 2019-10-01 | Nec Display Solutions, Ltd. | Operations management system, operations management method and program thereof |
| US9778972B2 (en) | 2011-08-24 | 2017-10-03 | Nec Corporation | Operation management device, operation management method |
| JPWO2013027562A1 (ja) * | 2011-08-24 | 2015-03-19 | 日本電気株式会社 | 運用管理装置、運用管理方法、及びプログラム |
| JP5621937B2 (ja) * | 2011-08-24 | 2014-11-12 | 日本電気株式会社 | 運用管理装置、運用管理方法、及びプログラム |
| WO2013027562A1 (ja) * | 2011-08-24 | 2013-02-28 | 日本電気株式会社 | 運用管理装置、運用管理方法、及びプログラム |
| WO2013136739A1 (ja) | 2012-03-14 | 2013-09-19 | 日本電気株式会社 | 運用管理装置、運用管理方法、及び、プログラム |
| JP2014132421A (ja) * | 2013-01-07 | 2014-07-17 | Fujitsu Ltd | 分析方法、分析装置、及び分析プログラム |
| JP2014134987A (ja) * | 2013-01-11 | 2014-07-24 | Hitachi Ltd | 情報処理システム監視装置、監視方法、及び監視プログラム |
| WO2014109112A1 (ja) * | 2013-01-11 | 2014-07-17 | 株式会社日立製作所 | 情報処理システム監視装置、監視方法、及び監視プログラム |
| US9588833B2 (en) | 2013-01-11 | 2017-03-07 | Hitachi, Ltd. | Information processing system monitoring apparatus, monitoring method, and monitoring program |
| WO2014125796A1 (ja) | 2013-02-18 | 2014-08-21 | 日本電気株式会社 | システム分析装置、及び、システム分析方法 |
| EP2884695A1 (en) | 2013-12-16 | 2015-06-17 | Hitachi, Ltd. | Management server and control method for management server |
| US9647910B2 (en) | 2013-12-16 | 2017-05-09 | Hitachi, Ltd. | Management server and control method of the management server for managing a service system virtually built using connected components |
| JP2015153077A (ja) * | 2014-02-13 | 2015-08-24 | 日本電信電話株式会社 | 監視機器情報分析装置及び方法及びプログラム |
| WO2015145664A1 (ja) * | 2014-03-27 | 2015-10-01 | 株式会社日立製作所 | リソース管理方法およびリソース管理システム |
| US9432256B2 (en) | 2014-03-27 | 2016-08-30 | Hitachi, Ltd. | Resource management method and resource management system |
| JP2015197850A (ja) * | 2014-04-02 | 2015-11-09 | 三菱電機ビルテクノサービス株式会社 | 設備監視装置及びプログラム |
| JP2017523526A (ja) * | 2014-07-30 | 2017-08-17 | マイクロソフト テクノロジー ライセンシング,エルエルシー | 分散システムにおける故障解析のための視覚ツール |
| US10069699B2 (en) | 2015-02-26 | 2018-09-04 | Nippon Telegraph And Telephone Corporation | Monitoring device information analyzing device and method, and non-transitory storage medium storing program |
| WO2018122890A1 (ja) * | 2016-12-27 | 2018-07-05 | 日本電気株式会社 | ログ分析方法、システムおよびプログラム |
| US10977108B2 (en) | 2017-01-18 | 2021-04-13 | Fujitsu Limited | Influence range specifying method, influence range specifying apparatus, and storage medium |
| US10986006B2 (en) | 2018-04-25 | 2021-04-20 | Hitachi, Ltd. | Performance analysis method and management computer |
| JP2019191929A (ja) * | 2018-04-25 | 2019-10-31 | 株式会社日立製作所 | 性能分析方法および管理計算機 |
| JP2021071889A (ja) * | 2019-10-30 | 2021-05-06 | 富士通株式会社 | システム分析方法、およびシステム分析プログラム |
| JP7302439B2 (ja) | 2019-10-30 | 2023-07-04 | 富士通株式会社 | システム分析方法、およびシステム分析プログラム |
| CN114471408A (zh) * | 2022-01-27 | 2022-05-13 | 广东天航动力科技有限公司 | 一种粉体材料生产用自动监控系统 |
| CN114471408B (zh) * | 2022-01-27 | 2023-08-08 | 广东天航动力科技有限公司 | 一种粉体材料生产用自动监控系统 |
| JP7302908B1 (ja) | 2022-02-21 | 2023-07-04 | Necプラットフォームズ株式会社 | 運用管理システム、運用管理方法及び運用管理のためのコンピュータプログラム |
| JP2023121230A (ja) * | 2022-02-21 | 2023-08-31 | Necプラットフォームズ株式会社 | 運用管理システム、運用管理方法及び運用管理のためのコンピュータプログラム |
Also Published As
| Publication number | Publication date |
|---|---|
| EP2330510B1 (en) | 2019-12-25 |
| JPWO2010032701A1 (ja) | 2012-02-09 |
| CN102099795B (zh) | 2014-08-13 |
| US8700953B2 (en) | 2014-04-15 |
| EP2330510A4 (en) | 2015-08-12 |
| EP2330510A1 (en) | 2011-06-08 |
| US9507687B2 (en) | 2016-11-29 |
| JP5375829B2 (ja) | 2013-12-25 |
| US20140173363A1 (en) | 2014-06-19 |
| CN102099795A (zh) | 2011-06-15 |
| US20110161743A1 (en) | 2011-06-30 |
Similar Documents
| Publication | Publication Date | Title |
|---|---|---|
| JP5375829B2 (ja) | 運用管理装置、運用管理方法、および運用管理プログラム | |
| JP6394726B2 (ja) | 運用管理装置、運用管理方法、及びプログラム | |
| JP5428372B2 (ja) | 運用管理装置および運用管理方法ならびにそのプログラム | |
| JP5874936B2 (ja) | 運用管理装置、運用管理方法、及びプログラム | |
| US8719636B2 (en) | Apparatus method, and storage medium for fault cause extraction utilizing performance values | |
| JP5267736B2 (ja) | 障害検出装置、障害検出方法およびプログラム記録媒体 | |
| US10373065B2 (en) | Generating database cluster health alerts using machine learning | |
| EP3051421A1 (en) | An application performance analyzer and corresponding method | |
| JP6521096B2 (ja) | 表示方法、表示装置、および、プログラム | |
| WO2018073955A1 (ja) | システム分析方法、システム分析装置、および、プログラム | |
| JP6183449B2 (ja) | システム分析装置、及び、システム分析方法 | |
| WO2016147657A1 (ja) | 情報処理装置、情報処理方法、及び、記録媒体 | |
| US20120116827A1 (en) | Plant analyzing system | |
| CN115237717A (zh) | 一种微服务异常检测方法和系统 | |
| CN118378155A (zh) | 一种智能化中间件的故障检测方法及系统 | |
| JP2005182647A (ja) | 機器の異常検知装置 | |
| Ding et al. | A data analytic engine towards self-management of cyber-physical systems | |
| JP6973445B2 (ja) | 表示方法、表示装置、および、プログラム | |
| TWI824681B (zh) | 裝置管理系統、裝置的障礙原因推測方法以及非暫時性地記憶程式的記憶媒體 | |
| CN118363823A (zh) | 实时数据分析驱动的信息系统维护方法及系统 | |
| CN118069620A (zh) | 数据库的故障预防方法、装置、计算机设备及存储介质 | |
| CN117909113A (zh) | 应用故障智能分析方法、装置、设备及存储介质 | |
| CN117521478A (zh) | 一种基于机器学习的云计算带外管理设备辅助告警方法 |
Legal Events
| Date | Code | Title | Description |
|---|---|---|---|
| WWE | Wipo information: entry into national phase |
Ref document number: 200980127693.8 Country of ref document: CN |
|
| 121 | Ep: the epo has been informed by wipo that ep was designated in this application |
Ref document number: 09814546 Country of ref document: EP Kind code of ref document: A1 |
|
| WWE | Wipo information: entry into national phase |
Ref document number: 2009814546 Country of ref document: EP |
|
| WWE | Wipo information: entry into national phase |
Ref document number: 13003793 Country of ref document: US |
|
| WWE | Wipo information: entry into national phase |
Ref document number: 2010529747 Country of ref document: JP |
|
| NENP | Non-entry into the national phase |
Ref country code: DE |