US8160846B2 - Method of modeling phase changes due to laser pulse heating - Google Patents
Method of modeling phase changes due to laser pulse heating Download PDFInfo
- Publication number
- US8160846B2 US8160846B2 US12/453,656 US45365609A US8160846B2 US 8160846 B2 US8160846 B2 US 8160846B2 US 45365609 A US45365609 A US 45365609A US 8160846 B2 US8160846 B2 US 8160846B2
- Authority
- US
- United States
- Prior art keywords
- substrate material
- liquid
- solid
- heating
- temperature
- Prior art date
- Legal status (The legal status is an assumption and is not a legal conclusion. Google has not performed a legal analysis and makes no representation as to the accuracy of the status listed.)
- Expired - Fee Related, expires
Links
Images

Classifications
-
- G—PHYSICS
- G06—COMPUTING OR CALCULATING; COUNTING
- G06F—ELECTRIC DIGITAL DATA PROCESSING
- G06F30/00—Computer-aided design [CAD]
- G06F30/20—Design optimisation, verification or simulation
-
- G—PHYSICS
- G06—COMPUTING OR CALCULATING; COUNTING
- G06F—ELECTRIC DIGITAL DATA PROCESSING
- G06F2119/00—Details relating to the type or aim of the analysis or the optimisation
- G06F2119/08—Thermal analysis or thermal optimisation
Definitions
- the present invention relates to numerical modeling and simulation methods, and particularly to a method of modeling phase changes due to laser pulse heating that utilizes energy equations and a discretizing numerical method to model temperature variation and cavity depth in a substrate material due to laser heating.
- phase transition is the transformation of a thermodynamic system from one phase to another.
- physical properties may undergo abrupt changes, such as changes in volume, for example.
- Phase transitions such as those caused by laser heating of a substrate material, typically occur between solid and liquid phases, and between liquid and vapor phases.
- First-order phase transitions are those that involve a latent heat. During such a transition, a system either absorbs or releases a fixed (and typically large) amount of energy. During this process, the temperature of the system will stay constant as heat is added. Because energy cannot be instantaneously transferred between the system and its environment, first-order transitions are associated with “mixed-phase regimes” in which some parts of the system have completed the transition and others have not. This phenomenon is familiar to anyone who has boiled a pot of water, i.e., the water does not instantly turn into gas, but forms a turbulent mixture of water and water vapor bubbles. Mixed-phase systems are difficult to study, because their dynamics are violent and hard to control. However, many important phase transitions fall in this category, including the solid/liquid/gas transitions.
- the method of modeling phase changes due to laser pulse heating utilizes energy equations and a discretizing numerical method to model temperature variation and cavity depth in a substrate material due to laser heating. Both constant and temperature-dependent thermal properties cases are considered.
- the method includes the steps of:
- ⁇ ⁇ t ⁇ ( ⁇ s ⁇ c p s ⁇ T ) 1 r ⁇ ⁇ ⁇ r ⁇ ( k s ⁇ r ⁇ ⁇ T ⁇ r ) + ⁇ ⁇ z ⁇ ( k s ⁇ ⁇ T ⁇ z ) + S o , wherein
- the boundary conditions for the calculation of temperature variation and cavity depth in the substrate material at the solid-liquid interface are set as T for both r and z are modeled as being an infinite distance from the substrate material being equal to T 0 , wherein T 0 represents an initial temperature of the substrate material. Further, at an axis of symmetry of the substrate material,
- the mass fraction of liquid x m is given by
- x m m m m + m s , wherein m m represents a liquid mass and m s represents a solid mass.
- the discretization is performed using the following steps:
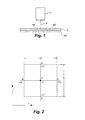
- FIG. 1 is a diagrammatic view of a system for laser pulse heating.
- FIG. 2 diagrammatically illustrates an internal grid point, along with neighbors of the grid point, for axisymmetric laser heating of a substrate material.
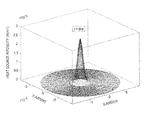
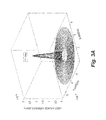
- FIG. 3A is a three-dimensional chart illustrating spatial distribution of a laser pulse.
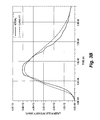
- FIG. 3B is a chart illustrating temporal variation of the laser pulse of FIG. 3B .
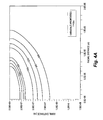
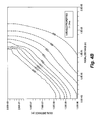
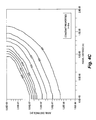
- FIGS. 4A , 4 B, 4 C and 4 D are charts illustrating temperature curves for constant and variable thermal properties cases of the method of modeling phase changes due to laser pulse heating according to the present invention.
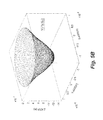
- FIG. 5A is a three-dimensional chart illustrating a cavity shape for the variable thermal properties case at a heating duration of 19.7 ns.
- FIG. 5B is a three-dimensional chart illustrating a cavity shape for the constant thermal properties case at a heating duration of 19.7 ns.
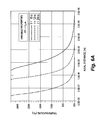
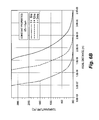
- FIGS. 6A and 6B are charts illustrating the temperature distribution inside the substrate material along the axis of symmetry for the variable and constant thermal properties cases for differing heating durations.
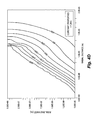
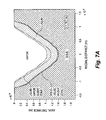
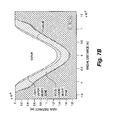
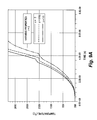
- FIG. 7A is a chart illustrating a cavity cross-section for the variable thermal properties case.
- FIG. 7B is a chart illustrating a cavity cross-section for the constant thermal properties case.
- FIGS. 8A and 8B are charts illustrating temperature distribution along the radial axis for the variable and constant thermal properties cases.
- FIGS. 9A and 9B are charts illustrating temporal variation of temperature for the variable and constant thermal properties cases.
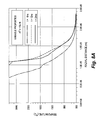
- FIGS. 10A and 10B are charts illustrating recession velocity variation along the radial direction for the variable and constant thermal properties cases.
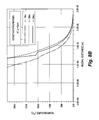
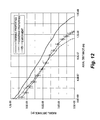
- FIG. 11 is a chart illustrating a comparison of recession velocity calculated by the method of modeling phase changes due to laser pulse heating according to the present invention vs. a conventional analytical method.
- FIG. 12 is a chart illustrating a comparison of cavity profiles calculated by the method of modeling phase changes due to laser pulse heating according to the present invention vs. experimental results.
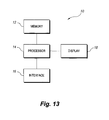
- FIG. 13 is a block diagram of a system for implementing the method of modeling phase changes due to laser pulse heating according to the present invention.
- the mushy zone generated between co-existing phases is typically relatively small in size, the consideration of the mushy zone is essential in capturing the actual physical processes. Since the material properties vary with temperature, temperature dependent thermophysical properties are utilized in the simulations and modeling described below.
- the energy equations for each phase are solved independently, as well as being coupled across the interfaces of the two phases, where both phases exist mutually (i.e., in mushy zones).
- the governing equations of heat transfer and the mushy zone are solved numerically, assuming all of the thermal properties are held constant.
- the laser output power intensity distribution at the workpiece surface is considered as Gaussian and its center is located at the center of the coordinate system.
- the temporal variation of laser power intensity resembling the actual laser pulse is accommodated in the simulations. This arrangement results in an axi-symmetric heating of the workpiece material.
- the method of modeling described below relates to a general laser-pulse system, such as that illustrated diagrammatically in FIG. 1 . In FIG.
- a substrate workpiece S rests on a support surface 100 .
- Laser L generates a laser pulse P over a short time-duration.
- the solid portion of substrate workpiece S is indicated generally as 102 , and 104 represents a mushy zone, i.e., a mixture of solid and liquid material created by the melting generated by the heating laser pulse P.
- variable t represents time (measured in seconds)
- variable r represents distance measured along the radial direction (measured in meters)
- T represents temperature (measured in K)
- z is an axial distance (measured in meters)
- ⁇ s represents the solid density (measured in kg/m 3 )
- c ps represents the specific heat capacity of the solid phase (measured in J/kg/K)
- k s is the thermal conductivity of the solid phase (measured in W/m/K).
- T o a uniform temperature
- T o a constant temperature
- h the convective heat transfer coefficient (measured in W/m 2 /K), and is taken as 10 W/m 2 /K due to natural convection from the surface prior to evaporation, using steel as an exemplary material for substrate workpiece S.
- the substrate material Since the evaporation temperature depends on the pressure, and this relation is not known for steel vapor, it is assumed that the substrate material has single melting and boiling temperatures. Further, once the phase change initiates, a mushy zone (i.e., the mutual existence of two phases) is introduced across the interface of the two phases. During the phase change process, including the mushy zone, the temperature of the substrate material remains the same, but its enthalpy changes in this region. This situation can be formulated via energy balance in the mushy zone.
- a typical, nominal laser pulse duration for a process such as this is 24 ns, thus the flow in the vapor and liquid layer during the heating process is neglected, i.e., 1 micron of fluid motion, in the radial or axial direction, in the liquid layer requires a liquid velocity on the order of 1000 m/s.
- the fluid motion in the liquid and vapor layers is assumed not to influence the heat transfer mechanism in these zones.
- T melting temperature
- L m is the latent heat of melting (measured in J/kg).
- equation (1) is used to determine the temperature rise in the liquid heating using the liquid thermal properties of the equation. Further, the liquid heating continues until the boiling point is reached in the substrate material, at which point a new mushy zone is formed.
- equation (5) is modified for a differential element in the mushy zone subjected to evaporation, given by:
- T b represents the evaporation temperature
- x b is the mass fraction in the vapor-liquid mushy zone.
- T b represents the temperature of the cells with 0 ⁇ x b ⁇ 1
- x m is replaced with x b in equation (5), which represents the fraction of vapor phase in the differential element.
- the calculation of x b is the same as that given above for x m , provided that latent heat of fusion is replaced with latent heat of evaporation of the substrate material.
- the boundary condition at the evaporating surface relates to equation (6).
- Equations (5) and (6) provide the relative position of the solid-liquid and liquid-vapor interfaces in the substrate material. The liquid-vapor interface determines the shape and size of the cavity generated during the evaporation process.
- equation (1) is applicable to solid and liquid heating
- equation (5) is applicable to the mushy zone at the solid-liquid interface
- equation (6) is applicable to the mushy zone at the liquid-vapor interface.
- equation (1) is applicable to solid and liquid heating
- equation (5) is applicable to the mushy zone at the solid-liquid interface
- equation (6) is applicable to the mushy zone at the liquid-vapor interface.
- a finite difference scheme is introduced. The details of the numerical scheme are given below in detail.
- an implicit scheme is used, i.e., using the initial conditions, the temperature in the whole domain is calculated to follow time steps with the respective conditions.
- An exemplary temporal resolution for the implicit scheme is approximately 0.5 ⁇ 10 ⁇ 9 s for a simulation.
- Equations (1), (5) and (6) contain four main variables, namely T s , T m , x m and x b .
- T s and T m are considered to be the same variable, since solid and liquid do not exist simultaneously at a grid point. Where they do, they are described by means of the quality. Thus, only three equations need to be discretized. These equations contain the following generic derivative terms:
- variable p is stet as the time index, i as the r-coordinate index and j as the z-coordinate index, leading to the discretized form of the equation (1), given by
- a C ⁇ T i , j p a E ⁇ T i + 1 , j p + a W ⁇ T i - 1 , j p + a N ⁇ T i , j + 1 p + a S ⁇ T i , j - 1 p + T i , j p - 1 + a H ⁇ S i , j p , ⁇ ⁇
- ⁇ ⁇ a E ⁇ ⁇ ⁇ t ⁇ ( r i + 0.5 ⁇ ⁇ ⁇ ⁇ r ) r i ⁇ ( ⁇ ⁇ ⁇ r ) 2
- a W ⁇ ⁇ ⁇ t ⁇ ( r i - 0.5 ⁇ ⁇ ⁇ ⁇ r ) r i ⁇ ( ⁇ ⁇ ⁇ r ) 2
- the metal vapor is ejected from the substrate and leaves behind a cavity.
- the laser beam is now focused on the deformed surface of the substrate, which constitutes the cavity.
- This aspect must also be accommodated in the solution procedure. In this case, the heat source distribution must be modified so that its peak value always occurs at the substrate surface.
- the calculation domain is divided into staggered grids and a grid independence test is then performed for the different grid sizes and orientations.
- a grid size resulting in a grid independent solution is used in the simulations, i.e., a grid preferably containing 100 ⁇ 120 mesh points in the r and z-axes is accommodated.
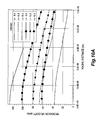
- FIGS. 4A , 4 B, 4 C and 4 D illustrate the temperature contours and cavity formation in the surface region of the substrate material during two heating periods, and for constant and variable thermal properties of the substrate material.
- the cavity size particularly enlarges in the axial direction for the constant properties case, which is more pronounced in the early heating periods when laser pulse intensity increases with time.
- the decrease in cavity depth due to the variable thermal properties case is associated with the decrease in thermal conductivity and increase in specific heat capacity with increasing temperature, i.e., the thermal conductivity is 134 W/m/K at 100° C. and 31.2 W/m/K at 1500° C., while the specific heat is 216 J/kg/K at 100° C. and 654 J/kg/K at 1500° C.
- the high temperature region extends along the axial direction in the axis of symmetry, where the absorbed laser power intensity is high.
- laser power intensity distribution at the substrate surface is Gaussian and the peak intensity occurs at the axis of symmetry.
- Increase in the cavity depth due to the constant properties case is almost twice of that corresponding to the variable thermal properties case during the heating pulse of 6 ns, while it is only 1.35 times after a 24 ns pulse, which corresponds to the time of 15 ns after the laser pulse ends. Consequently, enlargement in the cavity depth is significant during the heating pulse and then slows progression after the laser pulse ends. Further, an increase in the cavity depth after the laser pulse ends is associated with the convection heating of the cavity surface by the vapor front present in the cavity.
- a three-dimensional view of the cavity shape is shown in FIGS. 5A and 5B for the variable and constant thermal properties cases, respectively. Cavity enlargement in the axial direction is more pronounced than that along the radial direction.
- FIGS. 6A and 6B illustrate temperature distribution along the axis of symmetry inside the substrate material for the constant, as well as variable, thermal properties cases at different heating durations. It should be noted that temperature is limited to the evaporation temperature of the substrate material along the temperature axis in FIGS. 6A and 6B . Temperature decreases sharply in the liquid region (T>T m ) as compared to the solid region (T ⁇ T m ). The sharp decay of temperature can be related to the energy absorbed by the substrate material from the irradiated field in this region. It should be noted that the laser-absorbed energy decreases exponentially with the increasing depth below the surface (i.e., Lambert's Law).
- thermal conductivity reduces with increasing temperature, which, in turn, results in a small rate of heat diffusion from the irradiated region to its neighborhood.
- increased specific heat capacity with temperature reduces temperature rise in the irradiated region, thus suppressing the melting and evaporation rates in this region. Consequently, increasing specific heat capacity and reducing thermal conductivity with increasing temperature yields a small cavity depth for the variable thermal properties case.
- the small size of the liquid-solid mushy zone is associated with the low rate of heat diffusion from the liquid to the solid phases as well as the low temperature rise in the liquid phase in the region next to the solid phase, i.e., reducing thermal conductivity with increasing temperature suppresses the diffusional energy transport from the liquid phase to the solid phase, while increasing specific heat capacity with increasing temperature lowers the temperature rise in the liquid region next to the solid phase.
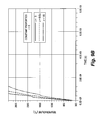
- FIGS. 8A and 8B show the temperature distribution in the radial direction at the surface for the constant and variable thermal properties cases at different durations.
- the extension of the cavity size, as determined by the radial distance corresponding to the evaporation temperature, is evident for the constant properties case due to high heat rate of diffusion and high rise of temperature due to high thermal conductivity and low specific heat capacity.
- the radial temperature gradient in the liquid phase is large for the time period t>12 ns, which corresponds to the duration after the end of the laser pulse. This is true for temperature profiles in the liquid and solid phases. Thus, cooling of the surface results in a sharp decay of temperature in both phases after the end of the laser pulse.
- the size of the mushy zone in the radial direction is larger than that of the axial direction due to laser power intensity distribution in the radial direction at the surface, which is Gaussian. This situation is also shown in FIGS. 3A and 3B . In this case, laser power intensity at the surface reduces with increasing radial distance from the symmetry axis. This, in turn, enlarges the size of the mushy zone in the radial direction.
- FIGS. 9A and 9B illustrate a temporal variation of temperature at the symmetry axis at different depths below the surface for the constant and variable thermal properties cases of the substrate material.
- the rise of the temperature is rapid in the solid as well as in the liquid phases. This is more pronounced in the surface vicinity where the power intensity absorption is the highest.
- Increasing depth below the surface lowers the rise of temperature in both phases, in particular in the liquid phase. This is associated with the amount of absorbed radiated energy by the substrate material, which reduces with increasing depth from the surface (i.e., Lambert's Law).
- the duration of constant melting temperature remains almost the same at different depths below the surface. This indicates that the duration of mushy zone formation in the substrate material remains almost constant with increasing depth, provided that the recession of the mushy zone into the substrate material may not be constant, since the time required for melting changes non-linearly as the depth below the surface increases.
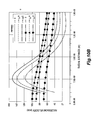
- FIGS. 10A and 10B illustrate the recession velocity of the vapor-liquid surface along the radial direction for different heating periods.
- Recession velocity is higher along the symmetry axis and it reduces gradually with increasing radial distance from the symmetry axis.
- Recession of the liquid-solid surface towards the solid bulk is higher in the case of variable thermal properties than that of the constant properties case. This is true for heating periods t ⁇ 10.9 ns.
- the attainment of the high recession velocity for the variable thermal properties case is due to the small energy diffusion in the irradiated region due to low thermal conductivity at high temperatures.
- the recession velocity also reduces significantly.
- recession velocity initiates earlier for the constant properties case because of the early start of evaporation.
- recession velocity increases rapidly and reaches its maximum, then decays rapidly with progressing time.
- High recession velocity occurs during the period of 6-10 ns, when the laser power intensity is high. As the power intensity reduces with time, the recession velocity reduces.
- recession velocity corresponding to the variable thermal properties case attains higher values than that of the constant properties case during the time period of 6-10 ns. This is because of increasing specific heat capacity with temperature, which, in turn, increases the internal energy gain of the substrate material at the vapor temperature.
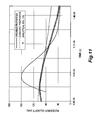
- FIG. 11 shows a comparison of recession velocity predicted from the variable and constant thermal properties cases vs. that obtained from an analytical solution.
- FIG. 12 illustrates a cavity shape predicted from the variable and constant thermal properties cases, as well as obtained from experiment. It can be observed that the cavity shape obtained from the variable thermal properties case agrees well with the experimental results.
- the calculations may be performed by any suitable computer system, such as that diagrammatically shown in FIG. 13 .
- Data is entered into system 10 via any suitable type of user interface 16 , and may be stored in memory 12 , which may be any suitable type of computer readable and programmable memory.
- Calculations are performed by processor 14 , which may be any suitable type of computer processor and may be displayed to the user on display 18 , which may be any suitable type of computer display.
Landscapes
- Engineering & Computer Science (AREA)
- Physics & Mathematics (AREA)
- Theoretical Computer Science (AREA)
- Computer Hardware Design (AREA)
- Evolutionary Computation (AREA)
- Geometry (AREA)
- General Engineering & Computer Science (AREA)
- General Physics & Mathematics (AREA)
- Investigating Or Analyzing Materials Using Thermal Means (AREA)
Abstract
Description
-
- (a) establishing a set of variables S0, Io, δ, rf, a, t, r, T, z, ρs, cps and ks, wherein the variable S0 represents a volumetric source term, the variable Io represents a laser peak power intensity, the variable δ represents an absorption coefficient for a substrate material, the variable rf represents reflectivity of the substrate material, the variable a represents a Gaussian parameter, the variable t represents time, the variable r represents distance measured along a radial direction, T represents temperature, z represents an axial distance, ρs represents a solid density, cps represents a specific heat capacity of a solid phase of the substrate material, and ks represents a thermal conductivity of the solid phase of the substrate material;
- (b) calculating temperature variation and cavity depth in the substrate material due to laser heating for solid and liquid heating of the substrate material as
wherein
-
- (c) establishing boundary conditions for the calculation of temperature variation and cavity depth in the substrate material for solid and liquid heating;
- (d) establishing a set of variables ρm, Lm, xm, and km, wherein ρm represents a density at a solid-liquid interface, Lm represents a latent heat of melting, xm represents a mass fraction of liquid, and km represents a thermal conductivity at the solid-liquid interface of the substrate material;
- (e) calculating temperature variation and cavity depth in the substrate material due to laser heating at the solid-liquid interface as
-
- (f) establishing a set of variables ρb, Lb, xb, and kb, wherein ρb represents a density at a liquid-vapor interface, Lb represents a latent heat of boiling, xb represents a mass fraction of vapor, and kb represents a thermal conductivity at the liquid-vapor interface of the substrate material;
- (g) calculating temperature variation and cavity depth in the substrate material due to laser heating at the liquid-vapor interface as
wherein calculation of temperature variation and cavity depth in the substrate material due to laser heating for solid and liquid heating, at the solid-liquid interface, and at the liquid-vapor interface is performed by discretization; and
-
- (h) displaying numerical results of the calculated temperature variation and cavity depth in the substrate material due to laser heating for solid and liquid heating at the solid-liquid interface and at the liquid-vapor interface.
and at a surface of the substrate material,
wherein h represents a convective heat transfer coefficient at the surface of the substrate material and k represents thermal conductivity at the surface of the substrate material. An energy content ΔU of a differential element having a volume Δ∀ at a melting temperature Tm of the substrate material in the calculation of temperature variation and cavity depth at the solid-liquid interface is given by ΔU=ρmΔ∀└xm(Lm+cp
wherein mm represents a liquid mass and ms represents a solid mass.
-
- (a) establishing a set of variables ρ, p, i, j, a, b, C, E, W, N, S and H, wherein p represents a time index, i represents an r-coordinate index, j represents a z-coordinate index, ρ represents density, and a, b, C, F, W, N, S and H are intermediate variables;
- (b) discretizing the calculation of temperature variation and cavity depth in the substrate material due to laser heating for solid and liquid heating as
-
- (c) discretizing the calculation of temperature variation and cavity depth in the substrate material due to laser heating for the solid-liquid interface as:
-
- (d) discretizing the calculation of temperature variation and cavity depth in the substrate material due to laser heating for the liquid-vapor interface as:
where So represents the volumetric source term and is given by:
and Io, δ, rf and a respectively represent the laser peak power intensity, absorption coefficient, reflectivity and the Gaussian parameter. The variable t represents time (measured in seconds), the variable r represents distance measured along the radial direction (measured in meters), T represents temperature (measured in K), z is an axial distance (measured in meters), ρs represents the solid density (measured in kg/m3), cps represents the specific heat capacity of the solid phase (measured in J/kg/K), and ks is the thermal conductivity of the solid phase (measured in W/m/K).
and at the surface,
where h is the convective heat transfer coefficient (measured in W/m2/K), and is taken as 10 W/m2/K due to natural convection from the surface prior to evaporation, using steel as an exemplary material for substrate workpiece S.
and Tref, mm, ms are, respectively, the reference temperature for enthalpy, the mass of liquid, and the mass of solid in the element. Assuming that the specific heat of melting is the same as that of the solid at the melting temperature (i.e., cps=cpm at T=Tm), then differentiation of equation (3) with respect to time yields:
since
where “const.” represents a constant value, and u represents the energy density.
Equation (5) is valid in the mushy zone where 0≦xm≦1, i.e., when the temperature of the cells with 0≦xm≦1 is set to the melting temperature (T=Tm). In the above, Lm is the latent heat of melting (measured in J/kg). For the situation of xm=1, the liquid phase occurs and equation (1) is used to determine the temperature rise in the liquid heating using the liquid thermal properties of the equation. Further, the liquid heating continues until the boiling point is reached in the substrate material, at which point a new mushy zone is formed. In this situation, equation (5) is modified for a differential element in the mushy zone subjected to evaporation, given by:
For a grid point, for purposes of calculation, the variables C, E and W are defined as the grid point's redirection neighbors, and N and S are defined as the grid point's z-direction neighbors, as illustrated by
For the solid phase, ρ=ρs and Cp=Cρs(T), where
For the liquid phase, ρ=ρl and Cp=Cρl(T), where
S i,j p =I o(t)δ(1−r f)exp(−δz j)exp(−r i 2 /a 2). (10)
S i,j p =I o(t)δ(1−r f)exp(−δ(z j −zc i))exp(−r i 2 /α 2)(0≦r≦r max ,z≧zc i)
S i,j p =I o(t)δ(1−r f)exp(−δz j)exp(−r i 2 /a 2)(r>r max),
where zci is the depth of the cavity, which varies with ri until r=rmax, where zc=0.
| TABLE I | |
| ks | 139.7356 − (0.1896)T + (0.0001)T2 (W/mK) (solid phase) |
| ρs | 7860 (Kg/m3) (solid phase) |
| Cps | 110.0215 + (1.2405)T − (0.0006)T2 (J/kgK) (solid phase) |
| Km | 37 (W/mK) (liquid phase) |
| ρm | 6891 7860 (Kg/m3) (liquid phase) |
| Cpm | 824 (J/kgK) (liquid phase) |
| Kb | (0.9)km (W/mK) (vapor phase) |
| ρb | ρm/15 (Kg/m3) (vapor phase) |
| Cpb | (1.1 )Cpm (vapor phase) |
| Lm | 247112 (J/kg) |
| Tm | 1811 (K) |
| Lb | 6213627 (J/kg) |
| Tb | 3134 (K) |
| To | 300 (K) |
| T∞ | 300 (K) |
| δ | 6.17 × 10⁶ (1/m) |
| rf | 0.5 |
| ro | 1.25 × 10⁻⁵ (m) |
| a | 2ro/3 (m) |
| lo | 5 × 10¹² (W/m2) |
|
|
|
| l |
|
|
|
|
| Nominal | 24 (ns) |
| Pulse | |
| length | |
Claims (7)
Priority Applications (1)
| Application Number | Priority Date | Filing Date | Title |
|---|---|---|---|
| US12/453,656 US8160846B2 (en) | 2009-05-18 | 2009-05-18 | Method of modeling phase changes due to laser pulse heating |
Applications Claiming Priority (1)
| Application Number | Priority Date | Filing Date | Title |
|---|---|---|---|
| US12/453,656 US8160846B2 (en) | 2009-05-18 | 2009-05-18 | Method of modeling phase changes due to laser pulse heating |
Publications (2)
| Publication Number | Publication Date |
|---|---|
| US20100292965A1 US20100292965A1 (en) | 2010-11-18 |
| US8160846B2 true US8160846B2 (en) | 2012-04-17 |
Family
ID=43069232
Family Applications (1)
| Application Number | Title | Priority Date | Filing Date |
|---|---|---|---|
| US12/453,656 Expired - Fee Related US8160846B2 (en) | 2009-05-18 | 2009-05-18 | Method of modeling phase changes due to laser pulse heating |
Country Status (1)
| Country | Link |
|---|---|
| US (1) | US8160846B2 (en) |
Cited By (3)
| Publication number | Priority date | Publication date | Assignee | Title |
|---|---|---|---|---|
| US20120250207A1 (en) * | 2009-12-04 | 2012-10-04 | Stenstroem Lennart | High Voltage Surge Arrester |
| US20120296318A1 (en) * | 2011-05-16 | 2012-11-22 | Wellhoefer Armin | System and process for surgical treatment of an eye as well as process for calibrating a system of such a type |
| CN107704658A (en) * | 2017-09-07 | 2018-02-16 | 南方电网科学研究院有限责任公司 | A method for verifying the accuracy of calculating the maximum temperature rise using a simplified model of deep well grounding electrodes |
Families Citing this family (6)
| Publication number | Priority date | Publication date | Assignee | Title |
|---|---|---|---|---|
| US10019827B2 (en) | 2013-12-31 | 2018-07-10 | Disney Enterprises, Inc. | Material point method for simulation of granular materials |
| US10210287B2 (en) * | 2013-12-31 | 2019-02-19 | Disney Enterprises, Inc. | Augmented material point method for simulating phase changes and varied materials |
| CN110070919B (en) * | 2019-04-12 | 2023-02-17 | 上海交通大学 | A Melting Model Involving Crystal Phase Reaction and Its Numerical Simulation Method |
| CN111046535B (en) * | 2019-11-25 | 2022-12-09 | 暨南大学 | Laser processing heat distribution calculation method |
| CN114417657B (en) * | 2021-12-28 | 2024-07-12 | 暨南大学 | Finite difference calculation method for water-guided laser processing temperature field |
| CN120046506B (en) * | 2025-03-24 | 2025-10-21 | 华南农业大学 | A modeling method for temperature prediction of efficient litchi thawing |
Citations (12)
| Publication number | Priority date | Publication date | Assignee | Title |
|---|---|---|---|---|
| US5092179A (en) | 1991-03-08 | 1992-03-03 | Duffers Scientific, Inc. | Dynamic material testing system having independent control over specimen deformation and strain rate and a method for use therein |
| US6631647B2 (en) | 2001-04-26 | 2003-10-14 | Joseph B. Seale | System and method for quantifying material properties |
| JP2004048940A (en) | 2002-07-12 | 2004-02-12 | Nippon Kouatsu Electric Co | Thunder resistant system |
| JP2004164453A (en) | 2002-11-15 | 2004-06-10 | Kanto Auto Works Ltd | Thermal buckling analysis method for press-formed products |
| JP2004330212A (en) | 2003-04-30 | 2004-11-25 | Toshiba Corp | Welded structure analysis method and welded structure analysis device |
| US6868735B2 (en) | 2002-10-09 | 2005-03-22 | Iwate University | Method for nondestructively evaluating aged deterioration of ferromagnetic construction materials |
| US6871162B2 (en) | 2002-10-02 | 2005-03-22 | The Goodyear Tire & Rubber Company | Non-iterative method for a fully-coupled thermomechanical analysis of a tire and estimating effects of compound changes on tire temperature distribution using the deformation index |
| US6874370B1 (en) | 2004-07-15 | 2005-04-05 | Reginald I. Vachon | Finite element analysis fatigue gage |
| JP2005148016A (en) | 2003-11-19 | 2005-06-09 | Toshiba Corp | Thermal fatigue life diagnosis method and apparatus for solder joints |
| JP2007210528A (en) | 2006-02-10 | 2007-08-23 | Bridgestone Corp | Tire temperature distribution prediction method, thermal analysis model, and tire temperature distribution prediction calculation program |
| JP2007309704A (en) | 2006-05-16 | 2007-11-29 | Central Res Inst Of Electric Power Ind | Numerical analysis method, apparatus and program for lead material |
| JP2008015780A (en) | 2006-07-05 | 2008-01-24 | Kaneka Corp | Prediction method of stress, strain and anisotropy of film in tenter heating process using finite element method |
-
2009
- 2009-05-18 US US12/453,656 patent/US8160846B2/en not_active Expired - Fee Related
Patent Citations (12)
| Publication number | Priority date | Publication date | Assignee | Title |
|---|---|---|---|---|
| US5092179A (en) | 1991-03-08 | 1992-03-03 | Duffers Scientific, Inc. | Dynamic material testing system having independent control over specimen deformation and strain rate and a method for use therein |
| US6631647B2 (en) | 2001-04-26 | 2003-10-14 | Joseph B. Seale | System and method for quantifying material properties |
| JP2004048940A (en) | 2002-07-12 | 2004-02-12 | Nippon Kouatsu Electric Co | Thunder resistant system |
| US6871162B2 (en) | 2002-10-02 | 2005-03-22 | The Goodyear Tire & Rubber Company | Non-iterative method for a fully-coupled thermomechanical analysis of a tire and estimating effects of compound changes on tire temperature distribution using the deformation index |
| US6868735B2 (en) | 2002-10-09 | 2005-03-22 | Iwate University | Method for nondestructively evaluating aged deterioration of ferromagnetic construction materials |
| JP2004164453A (en) | 2002-11-15 | 2004-06-10 | Kanto Auto Works Ltd | Thermal buckling analysis method for press-formed products |
| JP2004330212A (en) | 2003-04-30 | 2004-11-25 | Toshiba Corp | Welded structure analysis method and welded structure analysis device |
| JP2005148016A (en) | 2003-11-19 | 2005-06-09 | Toshiba Corp | Thermal fatigue life diagnosis method and apparatus for solder joints |
| US6874370B1 (en) | 2004-07-15 | 2005-04-05 | Reginald I. Vachon | Finite element analysis fatigue gage |
| JP2007210528A (en) | 2006-02-10 | 2007-08-23 | Bridgestone Corp | Tire temperature distribution prediction method, thermal analysis model, and tire temperature distribution prediction calculation program |
| JP2007309704A (en) | 2006-05-16 | 2007-11-29 | Central Res Inst Of Electric Power Ind | Numerical analysis method, apparatus and program for lead material |
| JP2008015780A (en) | 2006-07-05 | 2008-01-24 | Kaneka Corp | Prediction method of stress, strain and anisotropy of film in tenter heating process using finite element method |
Non-Patent Citations (7)
| Title |
|---|
| B.S. Yilbas and S.B. Mansoor, "Laser pulse heating and phase changes in the irradiated region: Temperature-dependent thermal properties case", published online at www.sciencedirect.com on Jun. 26, 2008. |
| Yilbas, B.S, et al., "Laser Pulse Heating: Cavity Formation into Steel, Nickel, and Tantalum Surfaces", Dec. 11, 2007, Elsevier Ltd. * |
| Yilbas, B.S. et al., "Laser Heatin: Jet Emanating from Laser Induced Cavity", Aug. 22, 2006, Elsevier Masson SAS. * |
| Yilbas, B.S., et al., "Laser Evaporative Heating of Surface: Simulation of Flow Field in the Laser Produced Cavity", Aug. 17, 2006, Journal of Physics D: Applied Physics 39, IOP Publishing Ltd. * |
| Yilbas, B.S., et al., "Laser Pulse Heating and Phase Changes in the Irradiated Region: Temperature-Dependent Thermal Properties Case", Jun. 26, 2008, Elsevier Masson SAS. * |
| Yilbas, B.S., et al., "Laser Pulse Heating and Vapor Front Generation", Mar. 2008, AIChE Journal, vol. 54, No. 3. * |
| Yilbas, B.S., et al., "Laser-Pulsed Heating of Aluminum: Cavity Formation at the Surface", Dec. 2008, ASM International. * |
Cited By (5)
| Publication number | Priority date | Publication date | Assignee | Title |
|---|---|---|---|---|
| US20120250207A1 (en) * | 2009-12-04 | 2012-10-04 | Stenstroem Lennart | High Voltage Surge Arrester |
| US8717732B2 (en) * | 2009-12-04 | 2014-05-06 | Abb Research Ltd. | High voltage surge arrester |
| US20120296318A1 (en) * | 2011-05-16 | 2012-11-22 | Wellhoefer Armin | System and process for surgical treatment of an eye as well as process for calibrating a system of such a type |
| US9301876B2 (en) * | 2011-05-16 | 2016-04-05 | Wavelight Gmbh | System and process for surgical treatment of an eye as well as process for calibrating a system of such a type |
| CN107704658A (en) * | 2017-09-07 | 2018-02-16 | 南方电网科学研究院有限责任公司 | A method for verifying the accuracy of calculating the maximum temperature rise using a simplified model of deep well grounding electrodes |
Also Published As
| Publication number | Publication date |
|---|---|
| US20100292965A1 (en) | 2010-11-18 |
Similar Documents
| Publication | Publication Date | Title |
|---|---|---|
| US8160846B2 (en) | Method of modeling phase changes due to laser pulse heating | |
| Gholijani et al. | Heat transfer during drop impingement onto a hot wall: The influence of wall superheat, impact velocity, and drop diameter | |
| Mukherjee et al. | Numerical study of bubble growth and wall heat transfer during flow boiling in a microchannel | |
| Hameury et al. | Accretion disc outbursts: a new version of an old model | |
| Chowdhury et al. | Heat transfer in femtosecond laser processing of metal | |
| Koshizuka et al. | Numerical analysis of fragmentation mechanisms in vapor explosions | |
| Siahpush et al. | Phase change heat transfer enhancement using copper porous foam | |
| Alexopoulou et al. | 3D finite element modeling of selective laser melting for conduction, transition and keyhole modes | |
| Khodabandeh et al. | Instability, heat transfer and flow regime in a two-phase flow thermosyphon loop at different diameter evaporator channel | |
| Hong et al. | Experimental study of bubble dynamics on a micro heater induced by pulse heating | |
| Colgan et al. | Experimental study of wall nucleation characteristics in flow boiling under subatmospheric pressures in a vertical square channel | |
| Shuja et al. | Laser heating of semi-infinite solid with consecutive pulses: Influence of materaial properties on temperature field | |
| Yilbas | The Laser Cutting Process: Analysis and Applications | |
| Peng et al. | Numerical simulation and investigation of ultra-short pulse laser ablation on Ti6Al4V and stainless steel | |
| Berdnikov et al. | The phenomenon of “cold plume” instability in Czochralski hydrodynamic model: Physical and numerical simulation | |
| Avnaim et al. | Comparison of three-dimensional multidomain and single-domain models for the horizontal solidification problem | |
| Chokappa et al. | Nonequilibrium simulation method for the study of directed thermal processing | |
| Mosdorf et al. | Chaos in nucleate boiling––nonlinear analysis and modelling | |
| Lee et al. | Flow boiling transient critical heat flux tests with stainless steel and FeCrAl: Transient correlation implementation, model calibration, and sensitivity analysis | |
| Yilbas et al. | Laser evaporative heating of surface: simulation of flow field in the laser produced cavity | |
| Yilbas et al. | Laser pulse heating and phase changes in the irradiated region: Temperature-dependent thermal properties case | |
| Zhang et al. | Phase-field lattice-Boltzmann study on eutectic growth with coupled heat and solute diffusion | |
| Farrow | A numerical model of the hydrodynamics of the thermal bar | |
| Lange et al. | Modelling bubble growth in a burning metal droplet | |
| Kumar et al. | Rayleigh-Benard convection during solidification of an eutectic solution cooled from the top |
Legal Events
| Date | Code | Title | Description |
|---|---|---|---|
| AS | Assignment |
Owner name: KING FAHD UNIV. OF PETROLEUM & MINERALS, SAUDI ARA Free format text: ASSIGNMENT OF ASSIGNORS INTEREST;ASSIGNORS:YILBAS, BEKIR SAMI;MANSOUR, SAAD BIN;REEL/FRAME:022734/0827 Effective date: 20090502 |
|
| STCF | Information on status: patent grant |
Free format text: PATENTED CASE |
|
| FPAY | Fee payment |
Year of fee payment: 4 |
|
| FEPP | Fee payment procedure |
Free format text: MAINTENANCE FEE REMINDER MAILED (ORIGINAL EVENT CODE: REM.); ENTITY STATUS OF PATENT OWNER: SMALL ENTITY |
|
| LAPS | Lapse for failure to pay maintenance fees |
Free format text: PATENT EXPIRED FOR FAILURE TO PAY MAINTENANCE FEES (ORIGINAL EVENT CODE: EXP.); ENTITY STATUS OF PATENT OWNER: SMALL ENTITY |
|
| STCH | Information on status: patent discontinuation |
Free format text: PATENT EXPIRED DUE TO NONPAYMENT OF MAINTENANCE FEES UNDER 37 CFR 1.362 |
|
| STCH | Information on status: patent discontinuation |
Free format text: PATENT EXPIRED DUE TO NONPAYMENT OF MAINTENANCE FEES UNDER 37 CFR 1.362 |