US8027790B2 - Interpretation and mapping of electromagnetic survey data - Google Patents
Interpretation and mapping of electromagnetic survey data Download PDFInfo
- Publication number
- US8027790B2 US8027790B2 US12/303,671 US30367107A US8027790B2 US 8027790 B2 US8027790 B2 US 8027790B2 US 30367107 A US30367107 A US 30367107A US 8027790 B2 US8027790 B2 US 8027790B2
- Authority
- US
- United States
- Prior art keywords
- data
- electromagnetic
- receiver
- source
- tool
- Prior art date
- Legal status (The legal status is an assumption and is not a legal conclusion. Google has not performed a legal analysis and makes no representation as to the accuracy of the status listed.)
- Active, expires
Links
Images


Classifications
-
- G—PHYSICS
- G01—MEASURING; TESTING
- G01V—GEOPHYSICS; GRAVITATIONAL MEASUREMENTS; DETECTING MASSES OR OBJECTS; TAGS
- G01V3/00—Electric or magnetic prospecting or detecting; Measuring magnetic field characteristics of the earth, e.g. declination, deviation
- G01V3/12—Electric or magnetic prospecting or detecting; Measuring magnetic field characteristics of the earth, e.g. declination, deviation operating with electromagnetic waves
-
- G—PHYSICS
- G01—MEASURING; TESTING
- G01V—GEOPHYSICS; GRAVITATIONAL MEASUREMENTS; DETECTING MASSES OR OBJECTS; TAGS
- G01V3/00—Electric or magnetic prospecting or detecting; Measuring magnetic field characteristics of the earth, e.g. declination, deviation
- G01V3/08—Electric or magnetic prospecting or detecting; Measuring magnetic field characteristics of the earth, e.g. declination, deviation operating with magnetic or electric fields produced or modified by objects or geological structures or by detecting devices
- G01V3/083—Controlled source electromagnetic [CSEM] surveying
Definitions
- This invention relates generally to the field of geophysical prospecting and reservoir delineation, and more particularly to interpretation of electromagnetic data.
- the invention is a computer software program for aiding interpretation of electromagnetic data and resistivity mapping of a subterranean region.
- Controlled-source electromagnetic (“CSEM”) surveying is a powerful tool for hydrocarbon exploration.
- raw survey data measures of one or more components of the electric or magnetic fields
- Interpreting CSEM data consists of developing a model of the earth's resistivity that is consistent with the measured CSEM data and with any other available geophysical or geological information. While they are not necessarily practiced in this order, interpretation typically includes the steps of:
- CSEM data is collected by individual receivers (laid on the sea floor) that record the signal emitted by a transmitter towed a few meters above the sea floor (however, in some experiments, the transmitter can also be fixed).
- CSEM surveys can be large and complex. For example, a survey might involve 7 tow lines, 90 receivers, and 10 or more discrete frequencies. Each receiver may record up to 6 electric and magnetic field components.
- the CSEM data may have been processed in more than one way in order to improve some signals at the expense of others or to convey uncertainties present in the data.
- many synthetic data sets may be produced as part of the iteration cycle for reconciling the measured data with an earth resistivity model. Therefore, the CSEM interpreter faces the daunting bookkeeping challenge in ensuring that all of the measured data are explained in terms of a single resistivity model of the earth.
- the invention is a computer implemented method 1000 for interpreting data from a controlled-source electromagnetic survey of a subsurface region, comprising:
- (C) receiver identification and geometry information for survey receivers including (x,y,z) coordinates and 3D orientation angles;
- (D) source information including (x,y,z) location and data specifying source antenna shape as a function of time
- steps (d) using a software program comprising the features provided in steps (a)-(c) to interpret the electromagnetic data to predict whether the subsurface region contains hydrocarbons.
- computer data storage is also provided for resistivity data in connection with inversion operations ( 1003 ).
- FIG. 1 shows the control panel display, the primary graphical user interface, for one embodiment of the present invention
- FIG. 2 shows a monitor display of a parametric plot from one embodiment of the present invention
- FIG. 3 shows a mirror plot display from one embodiment of the present invention
- FIG. 4 shows a display from one embodiment of the present invention of a plot of receivers along a tow line
- FIG. 5 shows a display from one embodiment of the present invention of a relative amplitude map
- FIG. 6A shows a resistivity depth log from a 1D simulation module
- FIG. 6B shows a graphical user interface in one embodiment of the present invention in which a resistivity log can be edited into a form suitable for the resistivity model in a 1D simulation of electromagnetic field values;
- FIG. 7 shows a graphical user interface in one embodiment of the present invention for defining an initial resistivity model for a 1D inversion computation
- FIG. 8 is a flow chart of an example work flow using the present invention.
- FIG. 9A shows a parametric plot display with graphical user interface from one embodiment of the present invention
- FIG. 9B shows the result of a bulk horizontal shift operation
- the present invention addresses the integrated interpretation (of EM survey data) problem by means of a structured computer program, which may be referred to herein as EMIM (Electro-Magnetism Interpretation and Mapping), that in certain embodiments of the invention includes mechanisms for:
- EMIM is a user-friendly tool based on graphical user interfaces.
- the main panel which may be called the EMIM Control Panel, allows the input/output and the selection of the CSEM data and their display or manipulation through command buttons.
- An example of a control panel for the present invention is shown in FIG. 1 .
- Various CESM data interpretation operations are described in the following paragraphs with reference to the actuating locations in FIG. 1 . Each feature described does not necessarily appear in all embodiments of the invention.
- Actual data are loaded from the processing package 101 .
- Actual data may have been recorded and processed in a geodetic coordinate system different than the coordinate system to be used at the interpretation stage. In this case, the program performs the coordinate transform “on the fly.”
- the horizontal components of the electric and magnetic fields of each receiver are also, at the user's option, re-oriented into the components parallel and perpendicular to the average tow line direction.
- Several versions of processed data can be loaded together. They are labeled by a processing version name provided by the user.
- 3D simulation results may be loaded from 3D forward-modeling output files 102 .
- they are in the interpretation geodetic system in which case no coordinate transformation is required. They are labeled by a scenario name provided by the user.
- the horizontal components of the electric and magnetic fields of each receiver are also, at the user's option, re-oriented into the components parallel and perpendicular to the average tow line direction.
- simulation data may be mapped to actual data based on the direction of the tow line and the receiver location.
- Simulations corresponding to the 3D inversion results may be loaded from an external 3D inversion package 103 . They are normally in the interpretation geodetic system in which case no coordinate transformation is required. They are labeled by the inversion name as provided by the user.
- the horizontal components of the electric and magnetic fields of each receiver may also be re-oriented into the components parallel and perpendicular to the average tow line direction. Simulation data corresponding to the 3D inversion results may be mapped to actual data based on the direction of the tow line and the receiver location.
- 1D inversion results are loaded from the output files of the 1D inversion package 104 which, in some embodiments, is part of the present invention.
- Data editing functions are also provided 105 ; for example, the survey name and general comments can be modified, actual or simulated data can be renamed or deleted (on a receiver or frequency basis), or entire simulation datasets can be removed.
- CSEM data 1D, 2D and 3D simulated data (generically known to as synthetic data) can be found in very different formats because of the different computer programs used to generate them. They also can represent electric or magnetic fields.
- the present invention has a feature called “EM Data Layer” where these different types of data are structured in the same way which makes it very easy to display or combine them together.
- the structure of the EM Data Layer may vary, from one embodiment of the invention to another, depending upon the program designer's preferences, but a typical choice for common internal structure features might be:
- CSEM is a rapidly evolving technology; additional parameters can be easily added to or existing parameters can be changed or removed from the “EM Data Layer”.
- the aforementioned co-rendering and editing operations are all implemented by the user through the EMIM Control Panel ( FIG. 1 ), which is the graphical user interface that allows such flexibility.
- Particular features for selecting data in an embodiment of the invention might include sub-setting the data.
- the EMIM Control Panel of FIG. 1 enables the user to select actual or synthetic CSEM data gathers, data components, frequencies, and offsets.
- a gather is the electromagnetic data corresponding to one particular receiver and one particular tow line. It is the data that were recorded at the particular receiver when the source was emitting electromagnetic signal along the particular tow line.
- the first column of buttons 111 specifies the color, the symbols and the line thickness of a gather, in the embodiment illustrated by FIG. 1 . Gathers are uniquely identified by their line name in the second column 112 and their receiver name in the third column 113 .
- the fourth column of buttons 114 permits the selection of positive offsets and those of the fifth column 115 the selection of negative offsets.
- Offset is horizontal distance between source and receiver when the particular data point was recorded by the receiver.
- Horizontal inline components parallel to the average tow-line
- horizontal cross-line components perpendicular to the average tow-line
- vertical components are respectively selected from the sixth to the eighth columns 116 , 117 , 118 . That is, the program has a tool that resolves the measured EM field components into inline, cross-line and vertical components, and these buttons enable the program user to select the desired components.
- a horizontal bulk shift of the transmitter locations can be entered in the ninth column 119 .
- Columns 10 and beyond enable the selection of frequencies available in the base dataset 120 .
- Column-wise selections selection of every button in a column
- buttons in the lower right corner of FIG. 1 permit the selection of an absolute offset range 122 and of an amplitude range 123 .
- Button 124 controls the phase display of selected data.
- the phase can be displayed explicitly (raw or unwrapped) or implicitly through its sine, cosine or other trigonometric functions.
- Available processing versions are selected at 125 . They may be uniquely defined by their version name. Color, symbols and line thickness can be defined for each selected processing version.
- Available 3D-simulations are selected in at 126 . They may be uniquely defined by their scenario name. The scenario name will likely make reference to the resistivity model the simulation was generated from. Color, symbols and line thickness can be defined for each selected 3D-simulation.
- Information about processing versions and simulations can be browsed from button 128 : receiver and line coordinates and depths, base-map and available frequencies for actual data and simulated data.
- Command 130 terminates the session. It allows the user to save the project and the configuration of the EMIM Control Panel before exiting.
- FIG. 2 shows another graphical user interface in one embodiment of the present invention.
- the amplitude and phase of the CSEM data (electric field or magnetic field) are plotted in the same display versus the absolute offsets between the receiver location and the transmitter locations. Negative and positive offset data are plotted with different symbols to allow each offset to be identified.
- the type of field (electric, magnetic or both) is selected from a popup menu 201 .
- Such a parametric plot is independent of the actual geographic location of the gathers. It is a convenient way to compare the positive and negative offsets of the same receiver and show if the earth is more resistive or more conductive right or left of a given receiver. It is also the best place to compare actual or simulated data from different locations.
- the user can zoom, un-zoom or edit the picture using the 202 commands.
- the names (line and receivers) of the gathers selected in the EMIM Control Panel are visible in a scrollable box 203 .
- the selected frequencies are visible in another scrollable box 204 . From these boxes, the user can activate or deactivate any gather and any frequency. By default, all the gathers and all the frequencies that were first selected in the EMIM Control Panel are active.
- the 1D Simulation command ( 127 in FIG. 1 ) enables the user to:
- the selected 1D model is displayed in FIG. 6A as a depth-profile of resistivity, also known as a resistivity log. It is possible in this embodiment of the invention to import resistivity information from an existing well through an external file in the standard LAS format 601 and use it as a guide. The user can also import measured sea-water conductivity profiles 602 or enter their own profile (linear or exponential profile). Then, the user can graphically edit or add resistivity sediment layers 603 .
- the SaveLayer Command 604 opens the Check and Save Log window, shown in FIG. 6B . Fields 605 define the new model name and display parameters (which can be changed later).
- the user can check and manually edit the resistivity and depth of the layers in fields 606 , define the source and receiver geometry 607 , set the desired frequencies 608 and launch the 1D simulation 609 .
- the source and receiver geometry can be automatically retrieved from the EMIM database with the name of the receiver and the name of the tow-line 607 .
- the results are automatically displayed in the Parametric Display window (command 131 in FIG. 1 ).
- 1D-simulations can be attached to a selected receiver in the example embodiment of the invention. However, it may be convenient to duplicate the simulation at the location of several (or all) receivers for both the positive and the negative offset legs. In particular, it helps co-rendering 1D-simulations with the display commands 132 to 135 .
- the command GenBkgdSim 138 on the EMIM Control Panel of FIG. 1 generates such pseudo-simulations at the selected locations and the selected frequencies. In the same way, the command GenBkgdSim can duplicate a selected positive or negative offset leg of real data or 3D-simulated data.
- SurvGeom 139 exports the CSEM survey coordinates, the receiver orientation and the transmitter information to commercial visualization packages (e.g., Gocad, Geoframe, Petrel, VoxelGeo, Jason Geophysical Benchmark). Commands like RaSec 134 or RaMap 135 can also export relative sections or maps to commercial visualization packages.
- 1DItoViz 140 reformats the resistivity models resulting of 1D inversion into a file that can be read by commercial visualization packages.
- 3DItoViz 141 reformats the resistivity model resulting from 3D inversion into a file that can be read by commercial visualization packages.
- the command To — 1Dinv 142 prepares the data selected in the EMIM Control Panel for 1D inversion.
- the selected data are displayed in the Parametric Plot window, and the Define Initial Model window is displayed as illustrated in FIG. 7 .
- the user defines:
- FIG. 8 shows a typical workflow of a CSEM interpretation study using the example embodiment of the invention suggested by FIG. 1 .
- the choices made by the user in the example work flow that follows are intended to illustrate the capabilities of one embodiment of the invention.
- Actual data is loaded first, at step 801 .
- Several processing versions 800 can be loaded at the same time for comparison into different layers of EM Data Layer, each layer being converted to a common internal structure, preferably during the loading process.
- the user displays all receivers in the Parametric Display window ( FIG. 2 ) for several frequencies, typically the lowest, the highest and selected intermediate ones.
- the receivers with bad channels are obvious 211 .
- the general noise level 212 is estimated for each frequency.
- the user can delete bad receivers with the data-base editing tools (command 105 in FIG. 1 ) or simply deselect them in the Parametric Display window.
- the offsets where the amplitude is below the noise level are usually muted (command 206 ). This muting makes subsequent plots much simpler and clearer. For instance, in FIG. 2 , the offsets greater than 10 km will be muted 213 .
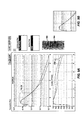
- step 803 again using button 131 on the Control Panel, the user displays positive and negative offsets receiver by receiver in another Parametric Display window, illustrated in FIG. 9A .
- the horizontal axis is offset, and one of the curves is for positive offsets, and the other for negative offsets.
- near positive and negative offsets should overlap. If there is a slight mismatch, as there is at 901 , it may be due to some imperfection in the processing stream or a navigation error.
- a small horizontal bulk shift of the transmitter location in the towing direction (less than 100 m) will fix the problem.
- the required bulk shift is typed in the EMIM Control Panel (column 119 in FIG. 1 ).
- the user applies additional muting 804 based on the phase stability.
- a convenient way to check the phase stability is to display its cosine versus offset.
- the curve should be smooth.
- the spike 902 of the phase cosine curve in FIG. 9A between offset 5 and 6 km will be graphically muted out through command 903 .
- the user can improve the phase stability (especially at far offsets) by locally restacking the data within a larger, user-defined, stacking window, typically 300 to 600 m (command 904 ). Spikes in the electric field such as 902 (probably caused by lightning) should be muted before restacking.
- the user can now prepare the cleaned data for 1D inversion in step 805 .
- the user selects receivers from the EMIM Control Panel.
- the command To — 1DInv ( 142 in FIG. 1 ) prompts the user to define a starting model: sea water resistivity, transition zone between water and sediment, initial resistivity values, resistivity bounds (fields 701 to 705 in FIG. 7 ). It has been found to be preferable to use a measured sea water resistivity profile and relatively thick a priori layers in the sediment (typically 300 m).
- the survey parameters (antenna length, receiver and transmitter depths) and the actual data are automatically retrieved from the information stored in EMIM. However, because the data are usually smooth, it is a good practice to decimate the data to save computation time.
- 1D-inversions are performed, in an external inversion package, independently on each positive and negative offset leg of each receiver.
- the 1D inversion package is an external tool (indicated by the dashed-line box 806 ) because of its demands on computer resources.
- the selected frequencies are inverted together. If the data were adequately decimated and the initial layering was not too thin, 1D inversion can be a relatively quick process. Generally, close to the edge of a resistivity anomaly, the inversion program cannot find a 1D model that fits the observed data due to failure of the earth to satisfy the 1D assumption.
- step 807 the results of the 1D-inversions (resistivity profiles and the corresponding 1D-simulations) are loaded into EMIM for quality control, display and manipulation (command 104 in FIG. 1 ).
- the electro-magnetic response of the resistivity model is simulated at step 810 with the appropriate codes using an external 3D simulation package.
- an external 3D simulation package (The embodiment of the invention assumed for this example recognizes that with present computer resources, a capability such as a 3D simulation (or inversion) package may need to be external to EMIM.)
- step 809 Such comparison shows where the actual data are more resistive or less resistive than the simulated earth model.
- step 809 the user then modifies the earth model accordingly to better fit the observed data, and the loop 809 to 812 is repeated until a good agreement is reached (a convergence criterion or other stopping point).
- a good agreement is reached (a convergence criterion or other stopping point).
- the actual data can also be prepared for 3D-inversion (step 813 ). Usually, some additional editing or phase correction is required (step 804 ). In a typical work flow where 3D inversion is to be used, steps 805 through 812 might be skipped.
- step 814 The 3D-inversion (step 814 ) would probably be run outside EMIM under present day computer constraints. It is a very compute-intensive step.
- step 815 the synthetic results are loaded back into EMIM for quality control and for reformatting of the final resistivity model into a file that can be read by an external visualization package (step 816 ).
- FIG. 10 is a flow chart for guiding a programmer to write or put together a software program 1000 for some embodiments of the present invention.
Priority Applications (1)
| Application Number | Priority Date | Filing Date | Title |
|---|---|---|---|
| US12/303,671 US8027790B2 (en) | 2006-08-24 | 2007-08-01 | Interpretation and mapping of electromagnetic survey data |
Applications Claiming Priority (3)
| Application Number | Priority Date | Filing Date | Title |
|---|---|---|---|
| US83978506P | 2006-08-24 | 2006-08-24 | |
| US12/303,671 US8027790B2 (en) | 2006-08-24 | 2007-08-01 | Interpretation and mapping of electromagnetic survey data |
| PCT/US2007/017161 WO2008024184A2 (fr) | 2006-08-24 | 2007-08-01 | Interprétation et mappage de données d'enquête électromagnétiques |
Publications (2)
| Publication Number | Publication Date |
|---|---|
| US20100179761A1 US20100179761A1 (en) | 2010-07-15 |
| US8027790B2 true US8027790B2 (en) | 2011-09-27 |
Family
ID=37682861
Family Applications (1)
| Application Number | Title | Priority Date | Filing Date |
|---|---|---|---|
| US12/303,671 Active 2029-01-27 US8027790B2 (en) | 2006-08-24 | 2007-08-01 | Interpretation and mapping of electromagnetic survey data |
Country Status (6)
| Country | Link |
|---|---|
| US (1) | US8027790B2 (fr) |
| AU (1) | AU2007288399B2 (fr) |
| CA (1) | CA2659343C (fr) |
| GB (1) | GB2456923A (fr) |
| NO (1) | NO339039B1 (fr) |
| WO (1) | WO2008024184A2 (fr) |
Cited By (2)
| Publication number | Priority date | Publication date | Assignee | Title |
|---|---|---|---|---|
| US9268052B2 (en) | 2012-12-04 | 2016-02-23 | Chevron U.S.A. Inc. | Method and system of using a data weighted electromagnetic source for time-lapse monitoring of a reservoir production or hydraulic fracturing |
| US10067252B2 (en) | 2016-07-25 | 2018-09-04 | Chevron U.S.A. Inc. | Methods and systems for identifying a clathrate deposit |
Families Citing this family (22)
| Publication number | Priority date | Publication date | Assignee | Title |
|---|---|---|---|---|
| WO2009069135A2 (fr) * | 2007-11-29 | 2009-06-04 | Elminda Ltd. | Système et procédé de modélisation neuronale de données neurophysiologiques |
| US8576953B2 (en) * | 2007-08-31 | 2013-11-05 | The United States Of America As Represented By The Secretary Of The Navy | Identification of target signals in radio frequency pulsed environments |
| US8213547B2 (en) * | 2007-08-31 | 2012-07-03 | The United States Of America As Represented By The Secretary Of The Navy | Identification of target signals in radio frequency pulsed environments |
| US8259860B1 (en) | 2007-08-31 | 2012-09-04 | The United States Of America As Represented By The Secretary Of The Navy | Identification of target signals in radio frequency pulsed environments |
| AU2008335609B2 (en) | 2007-12-12 | 2013-07-18 | Exxonmobil Upstream Research Company | Method and apparatus for evaluating submarine formations |
| US8164340B2 (en) * | 2008-10-23 | 2012-04-24 | Kjt Enterprises, Inc. | Method for determining electromagnetic survey sensor orientation |
| US8471555B2 (en) | 2008-11-04 | 2013-06-25 | Exxonmobil Upstream Research Company | Method for determining orientation of electromagnetic receivers |
| US10379255B2 (en) | 2010-07-27 | 2019-08-13 | Exxonmobil Upstream Research Company | Inverting geophysical data for geological parameters or lithology |
| US9195783B2 (en) | 2010-08-16 | 2015-11-24 | Exxonmobil Upstream Research Company | Reducing the dimensionality of the joint inversion problem |
| US20120182017A1 (en) * | 2011-01-14 | 2012-07-19 | Rune Johan Magnus Mattsson | Subsurface electromagnetic survey technique using expendable conductivity, temperature, and depth measurement devices |
| US9453929B2 (en) | 2011-06-02 | 2016-09-27 | Exxonmobil Upstream Research Company | Joint inversion with unknown lithology |
| WO2012173718A1 (fr) | 2011-06-17 | 2012-12-20 | Exxonmobil Upstream Research Company | Gel de domaine dans une inversion conjointe |
| WO2013012470A1 (fr) | 2011-07-21 | 2013-01-24 | Exxonmobil Upstream Research Company | Pondération adaptative de types de données géophysiques dans une inversion conjointe |
| JP2013208420A (ja) * | 2012-03-02 | 2013-10-10 | Nippon Koden Corp | 心電図解析レポート、心電図解析装置及び心電図解析プログラム |
| WO2014035543A1 (fr) | 2012-08-30 | 2014-03-06 | Exxonmobil Upstream Research Company | Procédés de traitement pour données csem à répartition temporelle |
| US9575205B2 (en) * | 2013-01-17 | 2017-02-21 | Pgs Geophysical As | Uncertainty-based frequency-selected inversion of electromagnetic geophysical data |
| US10591638B2 (en) | 2013-03-06 | 2020-03-17 | Exxonmobil Upstream Research Company | Inversion of geophysical data on computer system having parallel processors |
| US20140266215A1 (en) * | 2013-03-12 | 2014-09-18 | Pgs Geophysical As | Systems and methods for measuring water properties in electromagnetic marine surveys |
| US9846255B2 (en) | 2013-04-22 | 2017-12-19 | Exxonmobil Upstream Research Company | Reverse semi-airborne electromagnetic prospecting |
| US20170103144A1 (en) * | 2015-10-08 | 2017-04-13 | Schlumbeger Technology Corporation | Well trajectory adjustment |
| US10705241B2 (en) * | 2017-05-09 | 2020-07-07 | Pgs Geophysical As | Determining sea water resistivity |
| CN117742641B (zh) * | 2024-02-19 | 2024-04-23 | 中国电子科技集团公司第二十九研究所 | 一种多视角分层的电磁态势标绘显示方法及系统 |
Citations (6)
| Publication number | Priority date | Publication date | Assignee | Title |
|---|---|---|---|---|
| WO1999028767A1 (fr) | 1997-12-01 | 1999-06-10 | Schlumberger Limited | Procede et appareil permettant de creer, tester et modifier des modeles de subsurfaces geologiques |
| US6603313B1 (en) | 1999-09-15 | 2003-08-05 | Exxonmobil Upstream Research Company | Remote reservoir resistivity mapping |
| US20050077902A1 (en) | 2001-12-07 | 2005-04-14 | Macgregor Lucy M | Electromagnetic surveying for hydrocarbon reservoirs |
| US20050251340A1 (en) | 2004-05-06 | 2005-11-10 | Michael Tompkins | Electromagnetic surveying for hydrocarbon reservoirs |
| US20060197534A1 (en) | 2005-03-07 | 2006-09-07 | Exxonmobil Upstream Research Company | Method for identifying resistivity anomalies in electromagnetic survey data |
| US20060211788A1 (en) | 2005-03-18 | 2006-09-21 | Krohn Roy C | UV curable compositions for ink or paint applications |
-
2007
- 2007-08-01 CA CA2659343A patent/CA2659343C/fr not_active Expired - Fee Related
- 2007-08-01 US US12/303,671 patent/US8027790B2/en active Active
- 2007-08-01 WO PCT/US2007/017161 patent/WO2008024184A2/fr active Search and Examination
- 2007-08-01 AU AU2007288399A patent/AU2007288399B2/en not_active Ceased
-
2009
- 2009-03-11 GB GB0904165A patent/GB2456923A/en not_active Withdrawn
- 2009-03-23 NO NO20091186A patent/NO339039B1/no not_active IP Right Cessation
Patent Citations (6)
| Publication number | Priority date | Publication date | Assignee | Title |
|---|---|---|---|---|
| WO1999028767A1 (fr) | 1997-12-01 | 1999-06-10 | Schlumberger Limited | Procede et appareil permettant de creer, tester et modifier des modeles de subsurfaces geologiques |
| US6603313B1 (en) | 1999-09-15 | 2003-08-05 | Exxonmobil Upstream Research Company | Remote reservoir resistivity mapping |
| US20050077902A1 (en) | 2001-12-07 | 2005-04-14 | Macgregor Lucy M | Electromagnetic surveying for hydrocarbon reservoirs |
| US20050251340A1 (en) | 2004-05-06 | 2005-11-10 | Michael Tompkins | Electromagnetic surveying for hydrocarbon reservoirs |
| US20060197534A1 (en) | 2005-03-07 | 2006-09-07 | Exxonmobil Upstream Research Company | Method for identifying resistivity anomalies in electromagnetic survey data |
| US20060211788A1 (en) | 2005-03-18 | 2006-09-21 | Krohn Roy C | UV curable compositions for ink or paint applications |
Non-Patent Citations (5)
| Title |
|---|
| Ellingsrud, S. et al. (2002), "Remote Sensing of hydrocarbon layers by seabed logging (SBL): Results from a cruise offshore Angola", The Leading Edge 21, pp. 977-982. * |
| EP Search Report & Written Opinion, RS 114417 dated Feb. 2, 2007. |
| Mitsuhata, Y. et al. (2002) "2.5-D inversion of frequency-domain electromagnetic data generated by a grounded-wire source," Geophysics 67, No. 6, pp. 1753-1768. |
| PCT International Search Report dated Sep. 2, 2008 for PCT/US2007/017161. |
| Pennwell (1993) "Joint UK Project Developing Basin Geology," Offshore, Tulsa, OK 53, No. 4, pp. 86-87. |
Cited By (2)
| Publication number | Priority date | Publication date | Assignee | Title |
|---|---|---|---|---|
| US9268052B2 (en) | 2012-12-04 | 2016-02-23 | Chevron U.S.A. Inc. | Method and system of using a data weighted electromagnetic source for time-lapse monitoring of a reservoir production or hydraulic fracturing |
| US10067252B2 (en) | 2016-07-25 | 2018-09-04 | Chevron U.S.A. Inc. | Methods and systems for identifying a clathrate deposit |
Also Published As
| Publication number | Publication date |
|---|---|
| WO2008024184A2 (fr) | 2008-02-28 |
| CA2659343C (fr) | 2015-11-10 |
| NO339039B1 (no) | 2016-11-07 |
| WO2008024184A8 (fr) | 2010-04-08 |
| GB0904165D0 (en) | 2009-04-22 |
| AU2007288399B2 (en) | 2011-09-29 |
| AU2007288399A1 (en) | 2008-02-28 |
| NO20091186L (no) | 2009-05-22 |
| CA2659343A1 (fr) | 2008-02-28 |
| WO2008024184A3 (fr) | 2008-12-11 |
| GB2456923A (en) | 2009-08-05 |
| US20100179761A1 (en) | 2010-07-15 |
Similar Documents
| Publication | Publication Date | Title |
|---|---|---|
| US8027790B2 (en) | Interpretation and mapping of electromagnetic survey data | |
| US7979211B2 (en) | Electromagnetic data processing system | |
| AU2009308037B2 (en) | Tracking geologic object and detecting geologic anomalies in exploration seismic data volume | |
| WO2001071455A2 (fr) | Appareil, systeme d'optimisation, et mode d'utilisation en affaires | |
| Singh et al. | Bayesian framework for elastic full-waveform inversion with facies information | |
| US11079509B1 (en) | Building accurate training images for automatic seismic interpretation | |
| Zabihi Naeini et al. | Image-and horizon-guided interpolation | |
| US20220221604A1 (en) | Method of analysing seismic data | |
| Gerovska et al. | Calculation of magnitude magnetic transforms with high centricity and low dependence on the magnetization vector direction | |
| De Groot et al. | How to create and use 3D Wheeler transformed seismic volumes | |
| Plattner | GPRPy: Open-source ground-penetrating radar processing and visualization software | |
| Angerer et al. | Fractured reservoir modeling from seismic to simulator: a reality? | |
| Karpiah et al. | Crustal structure and basement-cover relationship in the Dangerous Grounds, offshore North-West Borneo, from 3D joint CSEM and MT imaging | |
| Anschütz et al. | From manual to automatic AEM bedrock mapping | |
| Chopra et al. | Detecting stratigraphic features via crossplotting of seismic discontinuity attributes and their volume visualization | |
| Saleh et al. | Seismic-electromagnetic projection attribute: Application in integrating seismic quantitative interpretation and 3D controlled-source electromagnetic-magnetotelluric broadband data inversion for robust ranking and sweet spotting of hydrocarbon prospects in offshore northwest Borneo | |
| AU2019243987A1 (en) | Wavefield propagator for tilted orthorhombic media | |
| Richardson et al. | Elastic full-waveform inversion on Caesar-Tonga—Case study | |
| Lecomte et al. | Closer to real earth in reservoir characterization: a 3D isotropic/anisotropic PSDM simulator | |
| Chopra et al. | Seismic reservoir characterization of the Gassum Formation in the Stenlille aquifer gas storage, Denmark—Part 2: Unsupervised classification | |
| Szafian et al. | Advanced Seismic Interpretation In Renewable Energy Projects Using 3D Exploration And (Ultra) High Resolution Seismic Data | |
| Alkhanjari et al. | The Wiggle that Makes a Difference: Using AI to get the Right Wavelet with Multi Well Input | |
| Goraya et al. | Delineating Karsts, Small-Scale Faults, and Fractures by Using a Global Stratigraphic Framework to Integrate Conventional Seismic Attributes with Diffraction Imaging in a Giant Offshore Field, Abu Dhabi. | |
| Giles et al. | Dataset acquisition to support geoscience | |
| Nester et al. | Seismic interpretation: part 7. Geophysical methods |
Legal Events
| Date | Code | Title | Description |
|---|---|---|---|
| STCF | Information on status: patent grant |
Free format text: PATENTED CASE |
|
| FPAY | Fee payment |
Year of fee payment: 4 |
|
| MAFP | Maintenance fee payment |
Free format text: PAYMENT OF MAINTENANCE FEE, 8TH YEAR, LARGE ENTITY (ORIGINAL EVENT CODE: M1552); ENTITY STATUS OF PATENT OWNER: LARGE ENTITY Year of fee payment: 8 |
|
| MAFP | Maintenance fee payment |
Free format text: PAYMENT OF MAINTENANCE FEE, 12TH YEAR, LARGE ENTITY (ORIGINAL EVENT CODE: M1553); ENTITY STATUS OF PATENT OWNER: LARGE ENTITY Year of fee payment: 12 |