US10852228B2 - Calibration apparatus, calibration curve creation method, and independent component analysis method - Google Patents
Calibration apparatus, calibration curve creation method, and independent component analysis method Download PDFInfo
- Publication number
- US10852228B2 US10852228B2 US15/708,516 US201715708516A US10852228B2 US 10852228 B2 US10852228 B2 US 10852228B2 US 201715708516 A US201715708516 A US 201715708516A US 10852228 B2 US10852228 B2 US 10852228B2
- Authority
- US
- United States
- Prior art keywords
- component
- calibration
- spectra
- spectrum
- components
- Prior art date
- Legal status (The legal status is an assumption and is not a legal conclusion. Google has not performed a legal analysis and makes no representation as to the accuracy of the status listed.)
- Active, expires
Links
- 238000012880 independent component analysis Methods 0.000 title claims abstract description 89
- 238000011088 calibration curve Methods 0.000 title claims abstract description 30
- 238000000034 method Methods 0.000 title claims description 68
- 238000001228 spectrum Methods 0.000 claims abstract description 278
- 230000003287 optical effect Effects 0.000 claims abstract description 99
- 238000011156 evaluation Methods 0.000 claims abstract description 28
- 239000011159 matrix material Substances 0.000 claims description 55
- 230000008569 process Effects 0.000 claims description 42
- 238000004611 spectroscopical analysis Methods 0.000 claims description 24
- 239000013598 vector Substances 0.000 claims description 24
- 238000005259 measurement Methods 0.000 claims description 21
- 238000012360 testing method Methods 0.000 claims description 17
- 238000004590 computer program Methods 0.000 claims description 12
- 239000000284 extract Substances 0.000 abstract 1
- 238000009826 distribution Methods 0.000 description 27
- WQZGKKKJIJFFOK-GASJEMHNSA-N Glucose Natural products OC[C@H]1OC(O)[C@H](O)[C@@H](O)[C@@H]1O WQZGKKKJIJFFOK-GASJEMHNSA-N 0.000 description 26
- 239000008103 glucose Substances 0.000 description 26
- 238000007781 pre-processing Methods 0.000 description 21
- 238000004364 calculation method Methods 0.000 description 13
- 238000010586 diagram Methods 0.000 description 11
- 102000009027 Albumins Human genes 0.000 description 9
- 108010088751 Albumins Proteins 0.000 description 9
- 239000007864 aqueous solution Substances 0.000 description 6
- 230000000052 comparative effect Effects 0.000 description 5
- 238000000605 extraction Methods 0.000 description 4
- 238000012986 modification Methods 0.000 description 4
- 230000004048 modification Effects 0.000 description 4
- LFQSCWFLJHTTHZ-UHFFFAOYSA-N Ethanol Chemical compound CCO LFQSCWFLJHTTHZ-UHFFFAOYSA-N 0.000 description 3
- 238000004458 analytical method Methods 0.000 description 3
- 230000002950 deficient Effects 0.000 description 3
- 230000006870 function Effects 0.000 description 3
- 238000010606 normalization Methods 0.000 description 3
- 230000003595 spectral effect Effects 0.000 description 3
- XLYOFNOQVPJJNP-UHFFFAOYSA-N water Substances O XLYOFNOQVPJJNP-UHFFFAOYSA-N 0.000 description 3
- 239000008280 blood Substances 0.000 description 2
- 210000004369 blood Anatomy 0.000 description 2
- 229930002875 chlorophyll Natural products 0.000 description 2
- 235000019804 chlorophyll Nutrition 0.000 description 2
- ATNHDLDRLWWWCB-AENOIHSZSA-M chlorophyll a Chemical compound C1([C@@H](C(=O)OC)C(=O)C2=C3C)=C2N2C3=CC(C(CC)=C3C)=[N+]4C3=CC3=C(C=C)C(C)=C5N3[Mg-2]42[N+]2=C1[C@@H](CCC(=O)OC\C=C(/C)CCC[C@H](C)CCC[C@H](C)CCCC(C)C)[C@H](C)C2=C5 ATNHDLDRLWWWCB-AENOIHSZSA-M 0.000 description 2
- 230000002349 favourable effect Effects 0.000 description 2
- 239000007788 liquid Substances 0.000 description 2
- 230000007935 neutral effect Effects 0.000 description 2
- 102000004169 proteins and genes Human genes 0.000 description 2
- 108090000623 proteins and genes Proteins 0.000 description 2
- 150000003839 salts Chemical class 0.000 description 2
- 239000002904 solvent Substances 0.000 description 2
- 235000013311 vegetables Nutrition 0.000 description 2
- 238000001069 Raman spectroscopy Methods 0.000 description 1
- 238000002835 absorbance Methods 0.000 description 1
- 238000000862 absorption spectrum Methods 0.000 description 1
- 230000008901 benefit Effects 0.000 description 1
- 230000008859 change Effects 0.000 description 1
- 230000000694 effects Effects 0.000 description 1
- 150000002632 lipids Chemical class 0.000 description 1
- 239000000203 mixture Substances 0.000 description 1
- 238000012545 processing Methods 0.000 description 1
- 238000005070 sampling Methods 0.000 description 1
- 230000005236 sound signal Effects 0.000 description 1
- 239000000126 substance Substances 0.000 description 1
- 230000017105 transposition Effects 0.000 description 1
Images


Classifications
-
- G—PHYSICS
- G01—MEASURING; TESTING
- G01N—INVESTIGATING OR ANALYSING MATERIALS BY DETERMINING THEIR CHEMICAL OR PHYSICAL PROPERTIES
- G01N21/00—Investigating or analysing materials by the use of optical means, i.e. using sub-millimetre waves, infrared, visible or ultraviolet light
- G01N21/17—Systems in which incident light is modified in accordance with the properties of the material investigated
- G01N21/25—Colour; Spectral properties, i.e. comparison of effect of material on the light at two or more different wavelengths or wavelength bands
- G01N21/27—Colour; Spectral properties, i.e. comparison of effect of material on the light at two or more different wavelengths or wavelength bands using photo-electric detection ; circuits for computing concentration
- G01N21/274—Calibration, base line adjustment, drift correction
-
- G—PHYSICS
- G01—MEASURING; TESTING
- G01N—INVESTIGATING OR ANALYSING MATERIALS BY DETERMINING THEIR CHEMICAL OR PHYSICAL PROPERTIES
- G01N21/00—Investigating or analysing materials by the use of optical means, i.e. using sub-millimetre waves, infrared, visible or ultraviolet light
- G01N21/17—Systems in which incident light is modified in accordance with the properties of the material investigated
- G01N21/25—Colour; Spectral properties, i.e. comparison of effect of material on the light at two or more different wavelengths or wavelength bands
- G01N21/31—Investigating relative effect of material at wavelengths characteristic of specific elements or molecules, e.g. atomic absorption spectrometry
- G01N21/35—Investigating relative effect of material at wavelengths characteristic of specific elements or molecules, e.g. atomic absorption spectrometry using infrared light
-
- G—PHYSICS
- G01—MEASURING; TESTING
- G01N—INVESTIGATING OR ANALYSING MATERIALS BY DETERMINING THEIR CHEMICAL OR PHYSICAL PROPERTIES
- G01N2201/00—Features of devices classified in G01N21/00
- G01N2201/12—Circuits of general importance; Signal processing
- G01N2201/127—Calibration; base line adjustment; drift compensation
- G01N2201/12746—Calibration values determination
-
- G—PHYSICS
- G01—MEASURING; TESTING
- G01N—INVESTIGATING OR ANALYSING MATERIALS BY DETERMINING THEIR CHEMICAL OR PHYSICAL PROPERTIES
- G01N2201/00—Features of devices classified in G01N21/00
- G01N2201/12—Circuits of general importance; Signal processing
- G01N2201/129—Using chemometrical methods
- G01N2201/1293—Using chemometrical methods resolving multicomponent spectra
Definitions
- the present invention relates to a calibration technique of obtaining a component amount of a target component from measured data of a test object, and an independent component analysis technique of determining an independent component on the basis of measured data such as an optical spectrum.
- JP-A-2013-36973 discloses a calibration technique in which an optical spectrum is acquired by performing spectrometry on a green vegetable, a spectrum derived from chlorophyll is estimated as an independent component by performing independent component analysis on the optical spectrum, and a chlorophyll amount in a new green vegetable sample is determined by using the estimated spectrum.
- An advantage of some aspects of the invention is to solve at least a part of the problems described above, and the invention can be implemented as the following forms or application examples.
- a calibration apparatus obtaining a component amount for a target component in a test object.
- the calibration apparatus includes an optical spectrum acquisition unit that acquires an optical spectrum obtained through spectrometry on the test object; a calibration data acquisition unit that acquires calibration data including a target component calibration spectrum corresponding to the target component, and a single regression formula indicating a calibration curve; an inner product value calculation unit that computes an inner product value between the optical spectrum acquired for the test object and the target component calibration spectrum; and a component amount calculation unit that calculates a component amount for the target component corresponding to an inner product value obtained by the inner product value calculation unit by using the single regression formula indicating a relationship between the inner product value and a component amount for the target component.
- the calibration data acquisition unit performs (a) a process of acquiring Q optical spectra obtained through spectrometry on Q (where Q is an integer of 3 or more) first samples each containing N (where N is an integer of 1 or more) components including the target component, S evaluation spectra obtained through spectrometry on S (where S is an integer of 3 or more) second samples in which a component amount for the target component is known; (b) a process of extracting R (where R is an integer of 2 or more) subsets from a set of the Q optical spectra; (c) a process of determining N component calibration spectra corresponding to the N components by performing independent component analysis in which component amounts for the N components are treated as independent components in each sample on each of the R subsets, and acquiring a total of R ⁇ N component calibration spectra; (d) a process of obtaining S inner product values by performing an inner product between each of the R ⁇ N component calibration spectra and the S evaluation spectra; (e) a process of obtaining a
- the independent component analysis since independent component analysis in which component amounts for N components in each sample are treated as independent components is performed, the independent component analysis can be performed with high accuracy, and thus calibration of a target component can be performed with high accuracy, even in a case where optical spectra derived from a plurality of components are not independent from each other.
- plurality of subsets are extracted from a set of Q optical spectra, and independent component analysis in which a component amount is treated as an independent component is performed on each of the subsets, even in a case where a component amount distribution in the whole set of the Q optical spectra is a Gaussian distribution, and thus there is a subset in which independency is deficient, independency is improved since a component amount distribution is a more non-Gaussian distribution in several subsets, and thus it is possible to obtain a target component calibration spectrum with high accuracy. As a result, it is possible to perform calibration with higher accuracy.
- the calibration method in the same manner as in the first aspect, it is possible to obtain target component calibration spectrum with high accuracy, and to perform calibration with high accuracy.
- an independent component analysis method in which component calibration spectra corresponding to a plurality of components contained in each sample are determined on the basis of a plurality of optical spectra obtained through spectrometry on a plurality of samples is provided.
- the independent component analysis method includes (1) extracting a plurality of subsets each including two or more optical spectra from a set of optical spectra obtained through spectrometry on the plurality of samples; and (2) determining a plurality of component calibration spectra respectively corresponding to the plurality of components by performing independent component analysis in which component amounts for the plurality of components in each sample are treated as independent components on each of the plurality of subsets.
- plurality of subsets are extracted from a set of a plurality of optical spectra, and independent component analysis in which a component amount is treated as an independent component is performed on each of the subsets, even in a case where a component amount distribution in the whole set of the plurality of optical spectra is a Gaussian distribution, and thus there is a subset in which independency is deficient, independency is improved since a component amount distribution is a more non-Gaussian distribution in several subsets, and thus it is possible to obtain a target component calibration spectrum with high accuracy.
- the invention may be realized in aspects such as an electronic apparatus including the above-described apparatus, a computer program for realizing functions of the respective units of the apparatus, and a non-transitory storage medium which stores the computer program thereon.
- FIG. 1 is a diagram illustrating an overview of independent component analysis in which component amounts are treated as independent components.
- FIG. 2 is a diagram illustrating an overview of a calibration curve creation process using independent component analysis.
- FIG. 3 is a diagram illustrating an overview of a target component calibration process.
- FIG. 4 is a block diagram illustrating a configuration of a calibration apparatus in an embodiment.
- FIG. 5 is a flowchart illustrating procedures of a calibration process.
- FIG. 6 is a flowchart illustrating a calibration data acquisition process.
- FIG. 7 is a diagram illustrating the content of the calibration data acquisition process.
- FIG. 8 is a graph illustrating a concentration distribution of components in all samples.
- FIG. 9 is a graph illustrating calibration accuracy in a comparative example using all samples.
- FIG. 10 is a graph illustrating a relationship between calibration accuracy and a correlation coefficient in an Example.
- FIG. 11 is a graph illustrating a concentration distribution of components in an optimal subset in the Example.
- FIG. 12 is a graph illustrating calibration accuracy obtained with an optimal subset in the Example.
- Independent component analysis used in an embodiment described below is greatly different from typical independent component analysis in which component-derived measured data (for example, an optical spectrum) is treated as an independent component in that a component amount for a component is treated as an independent component. Therefore, first, a description will be made of a difference between the typical independent component analysis and the independent component analysis in which a component amount is treated as an independent component. Hereinafter, for convenience of description, a description will be made of a case of using an optical spectrum of a test object (also referred to as a “sa “sa “sa “sa “sa “sa “sa “sa “sa “sa “sa “sa “sa “sa “sa “sa “sa “sa “sa “sa “sa “sa “sa “sa “sa “sa “sa “sa “sa “sa “sa “sa “sa “sa “sample”) as measured data, but the independent component analysis in which a component amount is treated
- optical spectra x 1 ( ⁇ ), x 2 ( ⁇ ), and x 3 ( ⁇ ) obtained through spectrometry on a plurality of samples are expressed as in the following Equation (1) as a linear combination of component natural spectra s 1 ( ⁇ ), s 2 ( ⁇ ), and s 3 ( ⁇ ) derived from a plurality of components contained in each sample.
- a 11 , a 12 , . . . , and a 33 are weighting factors indicating component amounts for the respective components.
- the number of samples and the number of components in optical spectra are assumed to be all three.
- Equation (1) is expressed as in the following Equation (2) in terms of a matrix.
- unknown component natural spectra s 1 ( ⁇ ), s 2 ( ⁇ ), and s 3 ( ⁇ ) derived from a plurality of components are treated as components which are independent from each other, and are subjected to independent component analysis by using the above Equation (2).
- the condition that a plurality of component natural spectra s 1 ( ⁇ ), s 2 ( ⁇ ), and s 3 ( ⁇ ) are statistically independent from each other is required to be established.
- the condition for performing accurate independent component analysis may not be established depending on property of measured data.
- optical spectra derived from a plurality of components may not satisfy the condition of being “statistically independent from each other”.
- the component natural spectra s 1 ( ⁇ ), s 2 ( ⁇ ), and s 3 ( ⁇ ) or the component amount matrix A cannot be accurately estimated.
- the present inventor of the invention has found that the component natural spectra s 1 ( ⁇ ), s 2 ( ⁇ ), and s 3 ( ⁇ ) or the component amount matrix A can be accurately estimated or determined by employing the independent component analysis in which a component amount is treated as an independent component instead of the above-described typical independent component analysis.
- Equation (3) is obtained by transposing both of the sides in the above Equation (2).
- the column vectors [a 11 a 12 a 13 ] T , [a 21 a 22 a 23 ] T , and [a 31 a 32 a 33 ] T of the component amount matrix A T are respectively treated as independent components, and independent component analysis is performed.
- These column vectors indicate component amounts for a plurality of components in each sample.
- the independent component analysis in which a component amount is treated as an independent component is an analysis method employed through the following examination. As described above, there is a case where component natural spectra derived from a plurality of components do not satisfy the condition of being statistically independent from each other.
- component natural spectra derived from a plurality of components are not statistically independent from each other, if the condition that component amounts (for example, concentrations) for the plurality of components have no relation to each other and are statistically independent from each other is established, in a case where component amounts (that is, the respective column vectors forming the component amount matrix A T in the above Equation (3)) for a plurality of components in each sample are treated as independent components, and independent component analysis is performed, it is possible to accurately estimate or determine the component amount matrix A T , and also to accurately estimate or determine the component natural spectra s 1 ( ⁇ ), s 2 ( ⁇ ), and s 3 ( ⁇ ).
- Equation (3) is generalized, the following Equation (4) is obtained.
- K indicates the number of measurement points of the wavelength ⁇ in a spectrum
- M indicates the number of samples
- N indicates the number of components.
- a component amount a mn (where m is 1 to M, and n is 1 to N) is a component amount (for example, a concentration) for an n-th component in an m-th sample.
- Y [ y 1 ⁇ ( ⁇ 1 ) ... y N ⁇ ( ⁇ 1 ) ⁇ ⁇ ⁇ y 1 ⁇ ( ⁇ K ) ... y N ⁇ ( ⁇ K ) ]
- W [ w 11 ... w M ⁇ ⁇ 1 ⁇ ⁇ ⁇ w 1 ⁇ N ... w MN ] ( 5 )
- x m ( ⁇ k ) indicates a spectral intensity at a wavelength ⁇ k in an m-th sample
- y n ( ⁇ k ) indicates a spectral intensity at the wavelength ⁇ k derived from an n-th component
- w mn indicates a component amount for the n-th component in the m-th sample.
- K indicates the number of measurement points of the wavelength ⁇ in a spectrum
- M indicates the number of samples
- N indicates the number of components.
- K and M are all integers of 2 or more.
- N is an integer of 1 or more, and may be an integer of 2 or more.
- Equation (5) corresponds to an equation in which an optical spectrum matrix X having optical spectra obtained through spectrometry on each sample as column vectors [x m ( ⁇ 1 ) . . . x m ( ⁇ K )] T is the same as a product between a component natural spectrum matrix Y having unknown component natural spectra derived from a plurality of respective components as column vectors [y n ( ⁇ 1 ) . . . y n ( ⁇ K )] T and a component amount matrix W having unknown component amounts indicating component amounts for a plurality of components in each sample as column vectors [w m1 . . . w mN ] T .
- FIG. 1 is a diagram illustrating an overview of independent component analysis in which a component amount is treated as an independent component.
- FIG. 1 illustrates an example of a case where an aqueous solution containing glucose or albumin is used as a sample, and optical spectra obtained through spectrometry on a plurality of samples are used as independent component analysis objects.
- a measured spectrum Xd is an absorbance spectrum obtained through spectrometry.
- a plurality of actual measured spectra Xd show considerably approximate curves, but, in FIG. 1 , for convenience of illustration, differences among the plurality of measured spectra Xd are illustrated to be exaggerated.
- the measured spectra Xd for a plurality of samples have values approximate to each other, and, thus, if these values are used as they are, there is a probability that the accuracy of a result obtained through independent component analysis may not be sufficiently high.
- the influence of a solvent on a measured spectrum may change depending on the concentration of a solute (contained component), and thus the accuracy of independent component analysis may deteriorate. Therefore, as preprocessing, a subtraction calculation is performed so that an average spectrum Xave of a plurality of measured spectra Xd is subtracted from each measured spectrum Xd, and thus a difference spectrum X is obtained.
- the difference spectrum X is used as the optical spectrum X in the above Equation (5). If independent component analysis is performed on the difference spectrum X, the accuracy of the independent component analysis can be improved. However, preprocessing may be omitted.
- the lower part in FIG. 1 illustrates a state in which the optical spectrum X is expressed by a product between the unknown component natural spectrum y n ( ⁇ ) and the unknown component amount w mn , according to the above Equation (5).
- the component amount matrix W is determined by treating each column vector [w m1 . . . w mN ] T of the component amount matrix W in the above Equation (5) as an independent component and performing the independent component analysis, and, as a result, the component natural spectrum matrix Y is also determined.
- An independent component analysis method may employ the typical independent component analysis. For example, an independent component analysis method disclosed in JP-A-2013-160574 or JP-A-2016-65803 filed by the applicant of the present application may be used, or other independent component analysis methods may be used.
- a component amount w* for a plurality of components in a new sample may be obtained by integrating an optical spectrum x* obtained through spectrometry on the new sample with a general inverse matrix Y ⁇ of the component natural spectrum matrix Y obtained through the independent component analysis.
- the component amount w* for the components of the new sample may be obtained by using the following Equation (6).
- Y ⁇ is a general inverse matrix of the component natural spectrum matrix Y obtained through independent component analysis
- y n ( ⁇ k ) ⁇ is a k-th element of a row vector of an n-th row in the general inverse matrix Y ⁇
- the above Equation (6) may be derived by multiplying the lefts of both sides in the above Equation (5) by the general inverse matrix Y ⁇ of the component natural spectrum matrix Y.
- a value of a component amount w n * for any n-th component of the new sample is obtained according to the following Equation (7) derived from the above Equation (6).
- y n ⁇ is a row vector of an n-th row in the general inverse matrix Y ⁇ of the component natural spectrum matrix Y.
- the row vector y n ⁇ is also referred to as an “inverse matrix row vector y n ⁇ ” or a “component calibration spectrum y n ⁇ ”.
- the general inverse matrix Y ⁇ of the component natural spectrum matrix Y is referred to as a “component calibration spectrum matrix Y ⁇ ”.
- the general inverse matrix Y ⁇ may be obtained on the basis of the component natural spectrum matrix Y obtained through independent component analysis, and the component amount w n * for the n-th component may be obtained by taking an inner product between the inverse matrix row vector y n ⁇ (that is, the n-th component calibration spectrum y n ⁇ ) corresponding to the n-th component in the general inverse matrix Y ⁇ and the optical spectrum x* for the new sample.
- the component natural spectrum matrix Y obtained through independent component analysis is meaningless in a value of an element thereof, and has property in which a waveform thereof is proportional to a true component natural spectrum.
- the component amount w n * obtained through the inner product in the above Equation (7) is a value which is proportional to an actual component amount.
- An actual component amount may be obtained by applying the inner product value w n * obtained through the inner product in the above Equation (7) to a calibration curve (described later).
- the component amount matrix W and the component natural spectrum matrix Y can be accurately estimated or determined.
- FIG. 2 is a diagram illustrating an overview of a component analysis (ICA) in which a component amount is treated as an independent component.
- An upper left part in FIG. 2 illustrates examples of measured spectra MS obtained through spectrometry on a plurality of samples.
- the measured spectra MS correspond to the measured spectra Xd in FIG. 1 , and may be obtained through spectrometry on a sample containing a plurality of components (for example, glucose and albumin).
- a component amount for example, a concentration
- a target component for example, glucose
- samples (first samples) in which a component amount for a target component is unknown may be used as a plurality of samples for acquiring optical spectra as independent component analysis objects.
- preprocessing is performed on the measured spectra MS, and thus optical spectra OS (the optical spectra X having undergone preprocessing in FIG. 1 ) having undergone the preprocessing are created.
- preprocessing for example, preprocessing including normalization of the measured spectra MS is performed.
- a subtraction calculation described in FIG. 1 is also preferably performed in addition to normalization.
- project on null space (PNS) may be performed in order to remove a baseline variation in the measured spectra MS.
- preprocessing may be omitted, and the measured spectra MS may be used as the optical spectra OS without being changed.
- independent component analysis in which a component amount is treated as an independent component is performed on a plurality of optical spectra OS, and thus a plurality of component calibration spectra CS 1 to CS N are obtained.
- the number in the parenthesis indicates a component number.
- the plurality of component calibration spectra CS 1 to CS N correspond to the above-described component calibration spectra y n ⁇ .
- FIG. 2 illustrates a method of creating a calibration curve by using the plurality of component calibration spectra CS 1 to CS N obtained in the above-described way.
- optical spectra EDS regarding a plurality of known samples (second samples) in which a component amount for a target component is known are acquired.
- the optical spectra EDS are obtained by performing, as necessary, the above-described preprocessing on measured spectra which are obtained through spectrometry on the known samples.
- the optical spectra EDS are referred to as “evaluation spectra EDS”.
- an inner product value between the individual evaluation spectra EDS and the component calibration spectrum CS n is computed.
- the computation of the inner product value is a calculation in which each of the evaluation spectra EDS and the component calibration spectrum CS n are treated as a single vector, and an inner product between the two vectors is taken, and, as a result, a single inner product value is obtained. Therefore, if inner products between the same component calibration spectrum CS n and a plurality of evaluation spectra EDS are computed, a plurality of inner product values corresponding to a plurality of known samples are obtained with respect to the same component calibration spectrum CS n .
- FIG. 2 shows diagrams in which inner product values P regarding a plurality of known samples are taken on a transverse axis, a known component amount C for a target component contained in the plurality of known samples is taken on a longitudinal axis, and the values are plotted.
- the n-th component calibration spectrum CS n used for an inner product is a spectrum corresponding to a target component, as in the example illustrated in FIG. 2
- the inner product value P and the component amount C for the target component of each known sample have a strong correlation. Therefore, from among the plurality of component calibration spectra CS 1 to CS N obtained through the independent component analysis, the component calibration spectrum CS n having the strongest correlation (the greatest correlation degree) may be selected as a target component calibration spectrum corresponding to the target component.
- the first component calibration spectrum CS 1 is a target component calibration spectrum corresponding to the target component (for example, glucose).
- FIG. 3 is a diagram illustrating an overview of a target component calibration process using a calibration curve.
- the calibration process is performed by using the target component calibration spectrum CS 1 and the calibration curve CC obtained through the calibration curve creation process illustrated in FIG. 2 .
- a measure spectrum TOS of a test object in which a component amount for a target component is unknown is acquired.
- preprocessing is performed on the measure spectrum TOS as necessary, and thus an optical spectrum TOS having undergone the preprocessing is created.
- This preprocessing is the same processing as the preprocessing used for creation of the calibration curve.
- the preprocessing during creation of the calibration curve in a case where a subtraction calculation described in FIG.
- the average spectrum Xave used during creation of the calibration curve may be subtracted from the measure spectrum TOS.
- An inner product between the optical spectrum TOS obtained in the above-described way and the target component calibration spectrum CS 1 is taken, and thus an inner product value P regarding the optical spectrum TOS is calculated. If the inner product value P is applied to the calibration curve CC, a component amount C for the target component contained in the test object can be determined.
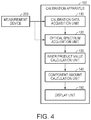
- FIG. 4 is a block diagram illustrating a configuration of a calibration apparatus 100 in an embodiment.
- the calibration apparatus 100 includes a calibration data acquisition unit 110 , an optical spectrum acquisition unit 120 , an inner product value calculation unit 130 , a component amount calculation unit 140 , and a display unit 150 .
- a measurement device 200 for acquiring measured data is connected to the calibration apparatus 100 .
- the measurement device 200 is, for example, a spectrometer measuring spectral absorbance of a sample.
- the measurement device 200 is not limited to a spectrometer, and various measurement devices suitable for characteristics of target components can be used.
- the calibration apparatus 100 may be implemented by, for example, an electronic apparatus for use in calibration only, and may be implemented by a general purpose computer. Functions of the respective units 110 to 150 of the calibration apparatus 100 may be implemented by any computer programs or hardware circuits.
- FIG. 5 is a flowchart illustrating procedures of a calibration process performed by the calibration apparatus 100 .
- the calibration data acquisition unit 110 acquires calibration data including a target component calibration spectrum (CS 1 in the example illustrated in FIG. 2 ) and the calibration curve CC. Details of the calibration data acquisition process in the present embodiment will be described later.
- step S 120 the optical spectrum acquisition unit 120 acquires the optical spectrum.
- TOS FIG. 3
- the optical spectrum TOS is obtained by performing preprocessing on a measure spectrum obtained through spectrometry, as necessary. Therefore, the optical spectrum acquisition unit 120 preferably has a function of performing the preprocessing.
- the inner product value calculation unit 130 calculates the inner product value P ( FIG. 3 ) between the optical spectrum TOS and the target component calibration spectrum CS 1 .
- the component amount calculation unit 140 calculates the component amount C corresponding to the inner product value P obtained in step S 130 by using the calibration curve CC.
- the component amount C is a component amount (for example, a glucose concentration) for the target component in the test object.
- the component amount C is displayed on the display unit 150 .
- the component amount C may be transmitted to another electronic apparatus, and other desired processes (for example, a notification sent to a test object using an electronic mail) may be performed.
- FIGS. 6 and 7 are flowchart illustrating the calibration data acquisition process in the present embodiment and diagrams illustrating the content thereof, and illustrate detailed steps of step S 110 in FIG. 5 .
- step S 210 measurement is performed on Q (where Q is an integer of 3 or more) first samples containing a plurality of components including a target component (for example, glucose) so that a set of Q optical spectra OS ( FIG. 7 ) is acquired, and measurement is performed on S (where S is an integer of 3 or more) second samples in which a component amount for the target component is known so that S pieces of evaluation data ED ( FIG. 7 ) are acquired.
- the set of the Q optical spectra OS is learning sample data for determining a component calibration spectrum by performing independent component analysis.
- the evaluation data ED includes the evaluation spectra EDS which are optical spectra for the S samples and a known component amount for the target component in each sample.
- a component amount for the target component may be known, but samples in which a component amount for the target component is unknown may be used. This is because, in the calibration data acquisition process of the present embodiment, a component amount of the target component in the Q first samples is not used.
- the number Q of first samples may be any integer of 3 or more, but, if Q is a great value of 100 or more, an effect achieved by the process in FIG. 6 is large. This is because, if the number Q of first samples increases, a component amount distribution is similar to a Gaussian distribution, thus it is difficult to perform independent component analysis in which a component amount is treated as an independent component with high accuracy, and, as a result, it is notably meaningful to create a subset which will be described later. The reason will be supplementarily described below.
- a plurality of pieces of sample data are required, and a set of the sample data preferably satisfies the following conditions.
- a plurality of optical spectra are data obtained by performing measurement on a sample in which various components which can be present during actual measurement on a test object except for a specific target component are mixed with each other.
- a component amount distribution of a plurality of components including a target component are statistically independent from each other according to a non-Gaussian distribution.
- the above condition C1 may be satisfied by performing measurement under various measurement conditions.
- the condition C2 is not ensured to be satisfied in a set of sample data which is prepared at random.
- a component amount distribution may be similar to a normal distribution (Gaussian distribution).
- a normal distribution Gaussian distribution
- step S 220 which will be described later, a subset is extracted from a set of optical spectra OS of all prepared samples, and thus independent component analysis in which a component amount is treated as an independent component is improved.
- the number S of second samples in which a component amount is known may be any integer of 3 or more, and a larger number S is preferable in that calibration accuracy is improved. Typically, the number S of second samples is smaller than the number Q of first samples. Some or all of the second samples may be used as parts of the first samples.
- step S 220 R (where R is an integer of 2 or more) subsets PA 1 to PA R ( FIG. 7 ) are extracted from the set of the Q optical spectra OS.
- Each of the R subsets PA 1 to PA R is extracted to include M (where M is an integer of 2 or more and below Q) optical spectra OS.
- the number M of optical spectra OS forming each subset PA r (where r is 1 to R) is set to a value which is equal to or more than the number of component calibration spectra obtained through the independent component analysis performed in step S 230 .
- the numbers M of optical spectra OS forming the respective subsets PA r (where r is 1 to R) may be values which are different from or the same as each other.
- Extraction of the subsets PA 1 to PA R is preferably performed at random by using random numbers.
- sampling without replacement is used so that the same optical spectrum is not extracted twice or more in the same subset PA r .
- the number of combinations of selecting M different optical spectra from among the Q optical spectra OS is the same as Q C M .
- the number R of subsets PA r may be set to be equal to or less than the number Q C M of combinations, or may be set to any integer of 2 or more.
- the R subsets PA 1 to PA R are extracted from the Q optical spectra OS prepared in step S 210 , one or more subsets PA r satisfying the above condition C2 are expected to be generated.
- step S 230 the above-described independent component analysis in which a component amount is treated as an independent component is performed on each of the R subsets PA 1 to PA R so that N component calibration spectra CS r1 to CS rN are obtained with respect to each subset PA r (where r is 1 to R) ( FIG. 7 ).
- N component calibration spectra CS rn (where r is 1 to R, and n is 1 to N) can be acquired.
- the number N of components is not required to match the number of actually contained components, and is empirically or experimentally determined so that the accuracy of independent component analysis is improved.
- a value of N may be set to an integer of 1 or more, but may be an integer of 2 or more.
- Steps S 240 to S 260 are processes of selecting an optimal target component calibration spectrum corresponding to the target component from among the R ⁇ N component calibration spectra CS rn (where r is 1 to R, and n is 1 to N) obtained in step S 230 .
- step S 240 an inner product is performed between each of the R ⁇ N component calibration spectra CS rn and the S evaluation spectra EDS so that S inner product values P are obtained.
- the S inner product values P are calculated for a single component calibration spectrum CS rn .
- step S 250 a correlation degree CD rn between the known component amount C for the target component in the S second samples and the S inner product values P calculated for the component calibration spectra CS rn are obtained with respect to each of the R ⁇ N component calibration spectra CS rn .
- Graphs in which a relationship between the inner product value P and the component amount C of the target component is plotted with respect to each of the component calibration spectra CS rn are drawn on the right end in FIG. 7 .
- the correlation degree CD rn for example, a correlation coefficient may be used.
- step S 260 from among the R ⁇ N component calibration spectra CS rn , a single component calibration spectrum CS rn causing the correlation degree CD rn to be greatest is selected as a target component calibration spectrum corresponding to the target component.
- the component calibration spectrum CS 11 is selected as a target component calibration spectrum.
- the S inner product values P regarding the target component calibration spectrum CS 11 are already obtained in step S 240 , and thus the S inner product values P may be used without being changed in step S 270 .
- the independent component analysis can be performed with high accuracy, and thus calibration of a target component can be performed with high accuracy, even in a case where optical spectra derived from a plurality of components are not independent from each other.
- a plurality of subsets PA r are extracted from a set of Q optical spectra OS, and independent component analysis in which a component amount is treated as an independent component is performed on each of the subsets PA r .
- an aqueous solution which is a mixture of glucose as a target component, albumin as another component, and water was used as a first sample and a second sample.
- the first sample for acquiring the optical spectra OS is an aqueous solution in which the glucose and the albumin are respectively mixed with pure water in concentration ranges of 50 to 400 mg/dL and 4000 to 5000 mg/dL.
- component amounts (concentrations) of the glucose and the albumin were set to concentrations determined as random values following a normal distribution in which the set range is included in 3 ⁇ with the center of the set range as an average value. In other words, independent component analysis with high accuracy was expected not to be performed on the entire first sample.
- the number Q of first samples was 5000.
- the second sample for acquiring the evaluation data ED is also an aqueous solution in which the glucose and the albumin are respectively mixed with pure water in concentration ranges of 50 to 400 mg/dL and 4000 to 5000 mg/dL.
- the second sample is an aqueous solution in which a true value of the glucose concentration is measured and is known through chemical analysis.
- the number S of second samples was 10.
- the optical spectra OS were acquired from the first samples according to the procedures in FIGS. 6 and 7 , and the evaluation data ED was acquired from the second samples.
- spectrometry including a near-infrared wavelength region of 1100 to 1300 nm was performed on the 5000 first samples so that 5000 measure spectra were acquired, and preprocessing was performed thereon so that the optical spectra OS were acquired.
- the evaluation spectra EDS were acquired for the ten second samples in which the concentration of the glucose which is a target component is known.
- the number R of subsets PA r was set to 10000
- the number M of optical spectra OS forming each subset PA r was set to 500.
- the 10000 subsets PA r are extremely small parts thereof.
- Inner products with the 10 evaluation spectra EDS were calculated with respect to each of the component calibration spectra CS, so that ten inner product values P were obtained.
- the correlation degree CD rn (correlation coefficient) between the inner product value P and the component amount C was computed as an evaluation index of the component calibration spectra CS rn on the basis of the ten inner product values P regarding each of the component calibration spectra CS rn and the known component amount C (glucose concentration) of the glucose of the second samples.
- the single regression formula C uP+v indicating a relationship between the ten inner product values P obtained through the inner product between the ten evaluation spectra EDS and the target component calibration spectrum, and the known component amount C for the target component in the ten second samples is created as a calibration curve by using the selected target component calibration spectrum.
- step S 220 in FIG. 6 the process (extraction of subsets) in step S 220 in FIG. 6 is not performed, independent component analysis in which a component amount was treated as an independent component was performed on the whole set of 5000 optical spectra OS in step S 230 , and three component calibration spectra CS were determined.
- the processes in step S 240 and the subsequent steps were performed in the same manner as in the above-described Example.
- FIG. 8 is a graph illustrating concentration distributions of glucose and albumin for the 5000 first sample.
- FIG. 9 is a graph illustrating calibration accuracy in the comparative example, in which a transverse axis expresses a true value of a glucose concentration, and a longitudinal axis expresses a calibration value.
- calibration accuracy SEP of the glucose concentration was 51.5 mg/dL
- a correlation coefficient Corr between the calibration value and the true value of the glucose concentration was 0.744.
- distributions of the calibration value and the true value are greatly spread, and thus the calibration accuracy is low.
- FIG. 10 is a graph illustrating a relationship between the calibration accuracy obtained for the 30000 component calibration spectra CS rn obtained in the Example and a correlation coefficient between the calibration value and the true value. According to this result, it can be seen that, as a correlation coefficient between the calibration value and the true value becomes larger, the calibration accuracy becomes more favorable.
- FIG. 11 is a graph illustrating concentration distributions of the glucose and the albumin with respect to 500 samples corresponding to the optimal subsets PA r in the Example.
- FIG. 12 is a graph illustrating calibration accuracy obtained with the optimal subsets PA r in the Example.
- the calibration accuracy SEP of the glucose concentration was 0.58 mg/dL
- the correlation coefficient Corr between the calibration value and the true value of the glucose concentration was 1.000
- both of the two results were more favorable than in the comparative example. Therefore, it was confirmed that the independent component analysis could be performed with high accuracy, and calibration of glucose as a target component could also be performed with high accuracy, according to the embodiment of the embodiment.
- the invention is applicable to a case where a liquid containing a salt or liquid containing a protein such as a lipid or albumin or an alcohol is used as a sample.
- the invention is also applicable to independent component analysis in which other objects such as a human body (human), a voice, and an image are used as samples.
- a human body is an object
- the invention is applicable to a case with neutral fat or alcohol in the human body, or glucose in blood as a target component.
- the word “spectrum” may be replaced with other words such as “measured data” or “object data”.
- the invention is also applicable to an apparatus in which a component concentration is estimated on the basis of spectrometric data of an optically mid-infrared spectroscopic type, near-infrared spectroscopic type, or Raman spectroscopic type.
- the invention is also applicable to any one of an optical protein concentration meter, an optical neutral fat concentration meter, an optical blood glucose meter, an optical salt concentration meter, and an optical alcohol concentration meter.
Abstract
Description
w n *=y n ‡ x*
y n ‡=[y n ‡(λ1) . . . y n ‡(λK)] (7)
Claims (3)
Applications Claiming Priority (2)
| Application Number | Priority Date | Filing Date | Title |
|---|---|---|---|
| JP2016-186728 | 2016-09-26 | ||
| JP2016186728A JP2018054306A (en) | 2016-09-26 | 2016-09-26 | Calibration device, calibration curve creation method, and independent component analysis method |
Publications (2)
| Publication Number | Publication Date |
|---|---|
| US20180088032A1 US20180088032A1 (en) | 2018-03-29 |
| US10852228B2 true US10852228B2 (en) | 2020-12-01 |
Family
ID=61686080
Family Applications (1)
| Application Number | Title | Priority Date | Filing Date |
|---|---|---|---|
| US15/708,516 Active 2038-11-26 US10852228B2 (en) | 2016-09-26 | 2017-09-19 | Calibration apparatus, calibration curve creation method, and independent component analysis method |
Country Status (2)
| Country | Link |
|---|---|
| US (1) | US10852228B2 (en) |
| JP (1) | JP2018054306A (en) |
Families Citing this family (1)
| Publication number | Priority date | Publication date | Assignee | Title |
|---|---|---|---|---|
| JP2018054304A (en) * | 2016-09-26 | 2018-04-05 | セイコーエプソン株式会社 | Calibration device and calibration curve creation method |
Citations (25)
| Publication number | Priority date | Publication date | Assignee | Title |
|---|---|---|---|---|
| WO1992007275A1 (en) | 1990-10-12 | 1992-04-30 | Exxon Research And Engineering Company | Spectral data measurement and correction |
| US20040207625A1 (en) | 2003-04-18 | 2004-10-21 | Medispectra, Inc. | Methods and apparatus for displaying diagnostic data |
| US20060013454A1 (en) | 2003-04-18 | 2006-01-19 | Medispectra, Inc. | Systems for identifying, displaying, marking, and treating suspect regions of tissue |
| JP2006271815A (en) | 2005-03-30 | 2006-10-12 | Kao Corp | Method and system for measuring oxygen saturation of skin |
| US20070061091A1 (en) * | 2004-03-29 | 2007-03-15 | Robert Schweitzer | Method for identifying components of a mixture via spectral analysis |
| US7438855B2 (en) | 2001-08-03 | 2008-10-21 | Waseda University | Apparatus for measuring glucose concentration |
| JP2013036973A (en) | 2011-07-12 | 2013-02-21 | Seiko Epson Corp | Method and device for generating calibration curve, and target component measurement device |
| JP2013160576A (en) | 2012-02-03 | 2013-08-19 | Seiko Epson Corp | Method for creating calibration curve and apparatus for the same, and apparatus for calibrating target component |
| JP2013160575A (en) | 2012-02-03 | 2013-08-19 | Seiko Epson Corp | Method for creating calibration curve and apparatus for the same, and apparatus for calibrating target component |
| JP2013160574A (en) | 2012-02-03 | 2013-08-19 | Seiko Epson Corp | Method for creating calibration curve and apparatus for the same, and apparatus for calibrating target component |
| EP2784484A1 (en) | 2013-03-27 | 2014-10-01 | Seiko Epson Corporation | Optimized calibration method for determining the content of chlorophyll using pre-processing and independent component analysis |
| US20150025851A1 (en) * | 2013-07-18 | 2015-01-22 | Seiko Epson Corporation | Calibration curve creating method and calibration curve creation apparatus |
| US20150025340A1 (en) | 2013-07-18 | 2015-01-22 | Seiko Epson Corporation | Calibration curve creating method and apparatus for the same, and blood component calibration apparatus |
| US20160054343A1 (en) | 2013-02-18 | 2016-02-25 | Theranos, Inc. | Systems and methods for multi-analysis |
| US20160078317A1 (en) * | 2013-05-03 | 2016-03-17 | National Ict Australia Limited | Image clustering for estimation of illumination spectra |
| US20160091417A1 (en) | 2014-09-25 | 2016-03-31 | Seiko Epson Corporation | Calibration curve creation method and device, target component calibration method and device, and electronic apparatus |
| US20160097676A1 (en) | 2014-10-03 | 2016-04-07 | Seiko Epson Corporation | Target component calibration device, electronic device, and target component calibration method |
| US20160103063A1 (en) | 2014-10-08 | 2016-04-14 | Seiko Epson Corporation | Calibration curve generation device, target component calibration device, electronic device, and glucose concentration calibration device |
| US20160103018A1 (en) | 2014-10-08 | 2016-04-14 | Seiko Epson Corporation | Calibration curve generation method, calibration curve generation device, target component calibration method, target component calibration device, electronic device, glucose concentration calibration method, and glucose concentration calibration device |
| JP2016075588A (en) | 2014-10-07 | 2016-05-12 | セイコーエプソン株式会社 | Method for detecting signal, method for creating calibration curve, method for measuring concentration, and signal detector |
| US20160370396A1 (en) | 2011-09-25 | 2016-12-22 | Theranos, Inc. | Systems and methods for multi-analysis |
| US20170045356A1 (en) * | 2015-08-14 | 2017-02-16 | Kla-Tencor Corporation | System, method and computer program product for calibration of metrology tools |
| US20180088033A1 (en) | 2016-09-26 | 2018-03-29 | Seiko Epson Corporation | Calibration apparatus and calibration curve creation method |
| US20180088034A1 (en) | 2016-09-26 | 2018-03-29 | Seiko Epson Corporation | Calibration apparatus, calibration curve creation method, and independent component analysis method |
| US20180088035A1 (en) | 2016-09-26 | 2018-03-29 | Seiko Epson Corporation | Calibration apparatus and calibration curve creation method |
-
2016
- 2016-09-26 JP JP2016186728A patent/JP2018054306A/en active Pending
-
2017
- 2017-09-19 US US15/708,516 patent/US10852228B2/en active Active
Patent Citations (29)
| Publication number | Priority date | Publication date | Assignee | Title |
|---|---|---|---|---|
| WO1992007275A1 (en) | 1990-10-12 | 1992-04-30 | Exxon Research And Engineering Company | Spectral data measurement and correction |
| US7438855B2 (en) | 2001-08-03 | 2008-10-21 | Waseda University | Apparatus for measuring glucose concentration |
| US20040207625A1 (en) | 2003-04-18 | 2004-10-21 | Medispectra, Inc. | Methods and apparatus for displaying diagnostic data |
| US20060013454A1 (en) | 2003-04-18 | 2006-01-19 | Medispectra, Inc. | Systems for identifying, displaying, marking, and treating suspect regions of tissue |
| US20070061091A1 (en) * | 2004-03-29 | 2007-03-15 | Robert Schweitzer | Method for identifying components of a mixture via spectral analysis |
| JP2006271815A (en) | 2005-03-30 | 2006-10-12 | Kao Corp | Method and system for measuring oxygen saturation of skin |
| JP2013036973A (en) | 2011-07-12 | 2013-02-21 | Seiko Epson Corp | Method and device for generating calibration curve, and target component measurement device |
| US20130197816A1 (en) | 2011-07-12 | 2013-08-01 | Seiko Epson Corporation | Calibration curve creation method, calibration curve creation device and target component determination device |
| US20160370396A1 (en) | 2011-09-25 | 2016-12-22 | Theranos, Inc. | Systems and methods for multi-analysis |
| JP2013160576A (en) | 2012-02-03 | 2013-08-19 | Seiko Epson Corp | Method for creating calibration curve and apparatus for the same, and apparatus for calibrating target component |
| JP2013160574A (en) | 2012-02-03 | 2013-08-19 | Seiko Epson Corp | Method for creating calibration curve and apparatus for the same, and apparatus for calibrating target component |
| JP2013160575A (en) | 2012-02-03 | 2013-08-19 | Seiko Epson Corp | Method for creating calibration curve and apparatus for the same, and apparatus for calibrating target component |
| US20160054343A1 (en) | 2013-02-18 | 2016-02-25 | Theranos, Inc. | Systems and methods for multi-analysis |
| EP2784484A1 (en) | 2013-03-27 | 2014-10-01 | Seiko Epson Corporation | Optimized calibration method for determining the content of chlorophyll using pre-processing and independent component analysis |
| US20140297197A1 (en) | 2013-03-27 | 2014-10-02 | Seiko Epson Corporation | Calibration curve creation method, calibration curve creation apparatus, and target component gauging apparatus |
| US20160078317A1 (en) * | 2013-05-03 | 2016-03-17 | National Ict Australia Limited | Image clustering for estimation of illumination spectra |
| US20150025340A1 (en) | 2013-07-18 | 2015-01-22 | Seiko Epson Corporation | Calibration curve creating method and apparatus for the same, and blood component calibration apparatus |
| US20150025851A1 (en) * | 2013-07-18 | 2015-01-22 | Seiko Epson Corporation | Calibration curve creating method and calibration curve creation apparatus |
| US9921201B2 (en) | 2013-07-18 | 2018-03-20 | Seiko Epson Corporation | Calibration curve creating method and calibration curve creation apparatus |
| US20160091417A1 (en) | 2014-09-25 | 2016-03-31 | Seiko Epson Corporation | Calibration curve creation method and device, target component calibration method and device, and electronic apparatus |
| JP2016065803A (en) | 2014-09-25 | 2016-04-28 | セイコーエプソン株式会社 | Calibration curve creation method and device, target component calibration method and device and electronic apparatus |
| US20160097676A1 (en) | 2014-10-03 | 2016-04-07 | Seiko Epson Corporation | Target component calibration device, electronic device, and target component calibration method |
| JP2016075588A (en) | 2014-10-07 | 2016-05-12 | セイコーエプソン株式会社 | Method for detecting signal, method for creating calibration curve, method for measuring concentration, and signal detector |
| US20160103063A1 (en) | 2014-10-08 | 2016-04-14 | Seiko Epson Corporation | Calibration curve generation device, target component calibration device, electronic device, and glucose concentration calibration device |
| US20160103018A1 (en) | 2014-10-08 | 2016-04-14 | Seiko Epson Corporation | Calibration curve generation method, calibration curve generation device, target component calibration method, target component calibration device, electronic device, glucose concentration calibration method, and glucose concentration calibration device |
| US20170045356A1 (en) * | 2015-08-14 | 2017-02-16 | Kla-Tencor Corporation | System, method and computer program product for calibration of metrology tools |
| US20180088033A1 (en) | 2016-09-26 | 2018-03-29 | Seiko Epson Corporation | Calibration apparatus and calibration curve creation method |
| US20180088034A1 (en) | 2016-09-26 | 2018-03-29 | Seiko Epson Corporation | Calibration apparatus, calibration curve creation method, and independent component analysis method |
| US20180088035A1 (en) | 2016-09-26 | 2018-03-29 | Seiko Epson Corporation | Calibration apparatus and calibration curve creation method |
Non-Patent Citations (2)
| Title |
|---|
| K. Uetsuki et al., "Prediction of Facial Color Variation by Using Independent Component Analysis and Evaluation on Facial Images", Journal of the Society of Photographic Science and Technology of Japan, vol. 64, No. 4, pp. 255-263 (2001). |
| Keiji Uetsuki et al., "Prediction of Facial Color Variation by Using Independent Component Analysis and Evaluation on Facial Images", 2001, Journal of the Society of Photographic Science and Technology of Japan, 4th Issue of vol. 64, pp. 255-263 with English translation. |
Also Published As
| Publication number | Publication date |
|---|---|
| US20180088032A1 (en) | 2018-03-29 |
| JP2018054306A (en) | 2018-04-05 |
Similar Documents
| Publication | Publication Date | Title |
|---|---|---|
| EP2784484B1 (en) | Optimized calibration method for determining the content of chlorophyll using pre-processing and independent component analysis | |
| US9207182B2 (en) | Analysis method of vibrational spectra | |
| US20180052144A1 (en) | Method And Technique For Verification Of Olive Oil Composition | |
| JP5887961B2 (en) | Calibration curve creation method, calibration curve creation device, target component calibration device, and computer program | |
| Lozano et al. | Four-way multivariate calibration using ultra-fast high-performance liquid chromatography with fluorescence excitation–emission detection. Application to the direct analysis of chlorophylls a and b and pheophytins a and b in olive oils | |
| US20180088035A1 (en) | Calibration apparatus and calibration curve creation method | |
| US10557792B2 (en) | Spectral modeling for complex absorption spectrum interpretation | |
| EP3032430A1 (en) | Target component calibration device, electronic device, and target component calibration method | |
| CN104990895B (en) | A kind of near infrared spectrum signal standards normal state bearing calibration based on regional area | |
| US20050143943A1 (en) | Adaptive compensation for measurement distortions in spectroscopy | |
| CN104792752A (en) | Method for determining content of pigments in mixed pigment solutions by adopting three-dimensional fluorescence spectroscopy combined with PARAFAC (parallel factor analysis) algorithm | |
| US20160097712A1 (en) | Signal detection method, calibration curve creation method, quantification method, signal detection device, measuring device, and glucose concentration measuring device | |
| Allegrini et al. | Generalized error-dependent prediction uncertainty in multivariate calibration | |
| US10488329B2 (en) | Calibration apparatus, calibration curve creation method, and independent component analysis method | |
| DE102017112612A1 (en) | A liquid chromatograph and method for correcting variations in a detector output of the liquid chromatograph | |
| US10852228B2 (en) | Calibration apparatus, calibration curve creation method, and independent component analysis method | |
| US11204314B2 (en) | Calibration apparatus and calibration curve creation method | |
| CN105548068B (en) | Dynamic Evolution Model bearing calibration and system | |
| Šašić et al. | Comparison of principal component analysis and generalized two-dimensional correlation spectroscopy: spectral analysis of synthetic model system and near-infrared spectra of milk | |
| JP6572169B2 (en) | Component concentration measuring apparatus and component concentration measuring method | |
| JP2018132463A (en) | Calibration device and calibration curve creation method | |
| Arroyo-Manzanares et al. | A non-targeted metabolomic strategy for characterization of the botanical origin of honey samples using headspace gas chromatography—ion mobility spectrometry | |
| Engelsen et al. | Quantitative analysis of time domain NMR relaxation data | |
| JP2022527850A (en) | Methods for configuring a spectroscopic measuring device | |
| JP6992633B2 (en) | Calibration device and calibration method |
Legal Events
| Date | Code | Title | Description |
|---|---|---|---|
| AS | Assignment |
Owner name: SEIKO EPSON CORPORATION, JAPAN Free format text: ASSIGNMENT OF ASSIGNORS INTEREST;ASSIGNOR:KURASAWA, HIKARU;REEL/FRAME:043624/0867 Effective date: 20170731 |
|
| FEPP | Fee payment procedure |
Free format text: ENTITY STATUS SET TO UNDISCOUNTED (ORIGINAL EVENT CODE: BIG.); ENTITY STATUS OF PATENT OWNER: LARGE ENTITY |
|
| STPP | Information on status: patent application and granting procedure in general |
Free format text: DOCKETED NEW CASE - READY FOR EXAMINATION |
|
| STPP | Information on status: patent application and granting procedure in general |
Free format text: NON FINAL ACTION MAILED |
|
| STPP | Information on status: patent application and granting procedure in general |
Free format text: NOTICE OF ALLOWANCE MAILED -- APPLICATION RECEIVED IN OFFICE OF PUBLICATIONS |
|
| STPP | Information on status: patent application and granting procedure in general |
Free format text: AWAITING TC RESP., ISSUE FEE NOT PAID |
|
| STPP | Information on status: patent application and granting procedure in general |
Free format text: PUBLICATIONS -- ISSUE FEE PAYMENT RECEIVED |
|
| STCF | Information on status: patent grant |
Free format text: PATENTED CASE |