EP2784484A1 - Optimized calibration method for determining the content of chlorophyll using pre-processing and independent component analysis - Google Patents
Optimized calibration method for determining the content of chlorophyll using pre-processing and independent component analysis Download PDFInfo
- Publication number
- EP2784484A1 EP2784484A1 EP14161517.9A EP14161517A EP2784484A1 EP 2784484 A1 EP2784484 A1 EP 2784484A1 EP 14161517 A EP14161517 A EP 14161517A EP 2784484 A1 EP2784484 A1 EP 2784484A1
- Authority
- EP
- European Patent Office
- Prior art keywords
- processing
- target component
- component
- independent
- observation data
- Prior art date
- Legal status (The legal status is an assumption and is not a legal conclusion. Google has not performed a legal analysis and makes no representation as to the accuracy of the status listed.)
- Granted
Links
- 238000007781 pre-processing Methods 0.000 title claims abstract description 230
- 238000000034 method Methods 0.000 title claims abstract description 166
- 238000012880 independent component analysis Methods 0.000 title claims abstract description 60
- 229930002875 chlorophyll Natural products 0.000 title description 41
- 235000019804 chlorophyll Nutrition 0.000 title description 41
- ATNHDLDRLWWWCB-AENOIHSZSA-M chlorophyll a Chemical compound C1([C@@H](C(=O)OC)C(=O)C2=C3C)=C2N2C3=CC(C(CC)=C3C)=[N+]4C3=CC3=C(C=C)C(C)=C5N3[Mg-2]42[N+]2=C1[C@@H](CCC(=O)OC\C=C(/C)CCC[C@H](C)CCC[C@H](C)CCCC(C)C)[C@H](C)C2=C5 ATNHDLDRLWWWCB-AENOIHSZSA-M 0.000 title description 41
- 239000011159 matrix material Substances 0.000 claims abstract description 128
- 238000005259 measurement Methods 0.000 claims abstract description 97
- 238000012545 processing Methods 0.000 claims abstract description 85
- 238000011088 calibration curve Methods 0.000 claims abstract description 82
- 230000008569 process Effects 0.000 claims abstract description 69
- 238000003672 processing method Methods 0.000 claims abstract description 39
- 230000002087 whitening effect Effects 0.000 claims abstract description 23
- 238000004364 calculation method Methods 0.000 claims description 62
- 238000001228 spectrum Methods 0.000 claims description 52
- 239000013598 vector Substances 0.000 claims description 33
- 238000000556 factor analysis Methods 0.000 claims description 28
- 238000000513 principal component analysis Methods 0.000 claims description 24
- 238000010606 normalization Methods 0.000 claims description 14
- 238000012937 correction Methods 0.000 claims description 5
- 238000009499 grossing Methods 0.000 claims description 5
- 239000000284 extract Substances 0.000 claims description 3
- 238000000926 separation method Methods 0.000 abstract description 8
- 230000003595 spectral effect Effects 0.000 description 29
- 230000004048 modification Effects 0.000 description 25
- 238000012986 modification Methods 0.000 description 25
- 230000000875 corresponding effect Effects 0.000 description 24
- 230000006870 function Effects 0.000 description 20
- 235000013311 vegetables Nutrition 0.000 description 17
- 238000010586 diagram Methods 0.000 description 16
- 238000000862 absorption spectrum Methods 0.000 description 15
- 238000004422 calculation algorithm Methods 0.000 description 12
- 238000011156 evaluation Methods 0.000 description 10
- 239000000203 mixture Substances 0.000 description 8
- 230000009466 transformation Effects 0.000 description 8
- 238000003384 imaging method Methods 0.000 description 7
- 238000002835 absorbance Methods 0.000 description 6
- 230000009467 reduction Effects 0.000 description 5
- 238000004590 computer program Methods 0.000 description 4
- 239000000126 substance Substances 0.000 description 4
- 241000219315 Spinacia Species 0.000 description 3
- 235000009337 Spinacia oleracea Nutrition 0.000 description 3
- 238000004458 analytical method Methods 0.000 description 3
- 230000002596 correlated effect Effects 0.000 description 3
- 230000007423 decrease Effects 0.000 description 3
- 230000000694 effects Effects 0.000 description 3
- 238000000985 reflectance spectrum Methods 0.000 description 3
- 238000007476 Maximum Likelihood Methods 0.000 description 2
- 238000000149 argon plasma sintering Methods 0.000 description 2
- 230000008901 benefit Effects 0.000 description 2
- 230000006835 compression Effects 0.000 description 2
- 238000007906 compression Methods 0.000 description 2
- 230000003287 optical effect Effects 0.000 description 2
- 230000002093 peripheral effect Effects 0.000 description 2
- WRIDQFICGBMAFQ-UHFFFAOYSA-N (E)-8-Octadecenoic acid Natural products CCCCCCCCCC=CCCCCCCC(O)=O WRIDQFICGBMAFQ-UHFFFAOYSA-N 0.000 description 1
- LQJBNNIYVWPHFW-UHFFFAOYSA-N 20:1omega9c fatty acid Natural products CCCCCCCCCCC=CCCCCCCCC(O)=O LQJBNNIYVWPHFW-UHFFFAOYSA-N 0.000 description 1
- QSBYPNXLFMSGKH-UHFFFAOYSA-N 9-Heptadecensaeure Natural products CCCCCCCC=CCCCCCCCC(O)=O QSBYPNXLFMSGKH-UHFFFAOYSA-N 0.000 description 1
- 235000010149 Brassica rapa subsp chinensis Nutrition 0.000 description 1
- 235000000536 Brassica rapa subsp pekinensis Nutrition 0.000 description 1
- 241000499436 Brassica rapa subsp. pekinensis Species 0.000 description 1
- 235000008534 Capsicum annuum var annuum Nutrition 0.000 description 1
- 240000008384 Capsicum annuum var. annuum Species 0.000 description 1
- 102000008186 Collagen Human genes 0.000 description 1
- 108010035532 Collagen Proteins 0.000 description 1
- 108010010803 Gelatin Proteins 0.000 description 1
- 239000005642 Oleic acid Substances 0.000 description 1
- ZQPPMHVWECSIRJ-UHFFFAOYSA-N Oleic acid Natural products CCCCCCCCC=CCCCCCCCC(O)=O ZQPPMHVWECSIRJ-UHFFFAOYSA-N 0.000 description 1
- 229930006000 Sucrose Natural products 0.000 description 1
- CZMRCDWAGMRECN-UGDNZRGBSA-N Sucrose Chemical compound O[C@H]1[C@H](O)[C@@H](CO)O[C@@]1(CO)O[C@@H]1[C@H](O)[C@@H](O)[C@H](O)[C@@H](CO)O1 CZMRCDWAGMRECN-UGDNZRGBSA-N 0.000 description 1
- 238000012884 algebraic function Methods 0.000 description 1
- 230000005540 biological transmission Effects 0.000 description 1
- 238000006243 chemical reaction Methods 0.000 description 1
- 229920001436 collagen Polymers 0.000 description 1
- 238000007405 data analysis Methods 0.000 description 1
- 238000013500 data storage Methods 0.000 description 1
- 230000003247 decreasing effect Effects 0.000 description 1
- 235000013305 food Nutrition 0.000 description 1
- 229920000159 gelatin Polymers 0.000 description 1
- 239000008273 gelatin Substances 0.000 description 1
- 235000019322 gelatine Nutrition 0.000 description 1
- 235000011852 gelatine desserts Nutrition 0.000 description 1
- QXJSBBXBKPUZAA-UHFFFAOYSA-N isooleic acid Natural products CCCCCCCC=CCCCCCCCCC(O)=O QXJSBBXBKPUZAA-UHFFFAOYSA-N 0.000 description 1
- 230000031700 light absorption Effects 0.000 description 1
- 235000013372 meat Nutrition 0.000 description 1
- ZQPPMHVWECSIRJ-KTKRTIGZSA-N oleic acid Chemical compound CCCCCCCC\C=C/CCCCCCCC(O)=O ZQPPMHVWECSIRJ-KTKRTIGZSA-N 0.000 description 1
- 230000004044 response Effects 0.000 description 1
- 238000010187 selection method Methods 0.000 description 1
- 239000005720 sucrose Substances 0.000 description 1
- 230000001131 transforming effect Effects 0.000 description 1
Images


Classifications
-
- G—PHYSICS
- G01—MEASURING; TESTING
- G01N—INVESTIGATING OR ANALYSING MATERIALS BY DETERMINING THEIR CHEMICAL OR PHYSICAL PROPERTIES
- G01N33/00—Investigating or analysing materials by specific methods not covered by groups G01N1/00 - G01N31/00
- G01N33/0098—Plants or trees
-
- G—PHYSICS
- G01—MEASURING; TESTING
- G01N—INVESTIGATING OR ANALYSING MATERIALS BY DETERMINING THEIR CHEMICAL OR PHYSICAL PROPERTIES
- G01N21/00—Investigating or analysing materials by the use of optical means, i.e. using sub-millimetre waves, infrared, visible or ultraviolet light
- G01N21/17—Systems in which incident light is modified in accordance with the properties of the material investigated
- G01N21/25—Colour; Spectral properties, i.e. comparison of effect of material on the light at two or more different wavelengths or wavelength bands
- G01N21/27—Colour; Spectral properties, i.e. comparison of effect of material on the light at two or more different wavelengths or wavelength bands using photo-electric detection ; circuits for computing concentration
-
- G—PHYSICS
- G01—MEASURING; TESTING
- G01N—INVESTIGATING OR ANALYSING MATERIALS BY DETERMINING THEIR CHEMICAL OR PHYSICAL PROPERTIES
- G01N2201/00—Features of devices classified in G01N21/00
- G01N2201/12—Circuits of general importance; Signal processing
- G01N2201/129—Using chemometrical methods
Definitions
- the present invention relates to a technique of creating a calibration curve, which is used to derive the content of a target component in a subject, from observation data of the subject, and a technique of calculating the content of the target component in the subject.
- a method has been proposed in which the concentration or the like of a target component is analyzed by performing independent component analysis of observation data, which is observed at a plurality of different positions of the subject, and expressing the observation data as a linear sum of a basic function with an independent component calculated by the independent component analysis as the basic function (refer to JP-A-2007-44104 ).
- the observation data may be changed due to variations in the composition or the structure of the subject. In such a case, there is a problem in that the accuracy of independent component analysis or measurement using the same is reduced.
- An advantage of some aspects of the invention is that accurate measurement from a piece of observation data regarding a subject can be achieved when measuring a target component of the subject.
- This application example is directed to a calibration curve creation method of creating a calibration curve, which is used to derive a content of a target component in a subject, from observation data of the subject.
- the calibration curve creation method includes: (a) acquiring the observation data for a plurality of samples of the subject; (b) acquiring the content of the target component in each sample; (c) executing pre-processing for the observation data of each sample, a pre-processing method is selected from a plurality of options; (d) estimating a plurality of independent components when separating the pre-processed observation data of each sample into a plurality of independent components and calculating a mixing coefficient corresponding to the target component for each sample based on the plurality of independent components; and (e) calculating a regression equation of the calibration curve based on the content of the target component of each of the plurality of samples and the mixing coefficient of each sample.
- the pre-processing includes first pre-processing including processing for correcting the observation data and second pre-processing including whitening, and a plurality of processing methods are prepared as processing methods of each of the first pre-processing and the second pre-processing and the pre-processing method is set by combining one or more of the processing methods of each of the first pre-processing and the second pre-processing.
- the process (d) includes: (i) calculating an independent component matrix including the independent component of each sample; (ii) calculating an estimated mixing matrix, which indicates a set of vectors defining a ratio of an independent component element of each independent component in each sample, from the independent component matrix; and (iii) calculating a correlation between each of the vectors included in the estimated mixing matrix and the content of the target component of each of the plurality of samples and select the vector, which is determined to have the highest correlation, as a mixing coefficient corresponding to the target component.
- the first pre-processing, the second pre-processing, and independent component analysis processing are executed in this order using the pre-processing method selected in the process (c).
- the calibration curve for deriving the amount of target component included in the subject from the observation data of the subject is created from the content of the target component and the observation data acquired from each sample. For this reason, if this calibration curve is used, the content of the target component can be accurately calculated even if the number of pieces of observation data of the subject is one. Therefore, if the calibration curve is created in advance according to the calibration curve creation method of Application Example 1, it is sufficient to acquire a piece of observation data for the subject at the time of measurement. As a result, the amount of target component can be accurately calculated from a piece of observation data that is an actual measurement value. In addition, since an estimated mixing matrix is calculated and a vector highly correlated with the content of the target component of the sample is extracted from the estimated mixing matrix, it is possible to obtain the mixing coefficient with high estimation accuracy.
- the appropriate pre-processing is selected and executed according to the characteristics of the observation data of the subject, information included in the observation data of the subject can be appropriately extracted. As a result, it is possible to improve the measurement accuracy.
- This application example is directed to the calibration curve creation method according to Application Example 1, wherein in the process (c), the processing methods of the first pre-processing includes a projection on null space.
- This application example is directed to the calibration curve creation method according to Application Example 1, wherein in the process (c), the processing methods of the first pre-processing includes centering.
- This application example is directed to the calibration curve creation method according to Application Example 1, wherein in the process (c), the processing methods of the first pre-processing includes normalization.
- This application example is directed to the calibration curve creation method according to Application Example 1, wherein in the process (c), the processing methods of the first pre-processing includes smoothing processing.
- This application example is directed to the calibration curve creation method according to Application Example 1, wherein in the process (c), the processing methods of the first pre-processing includes differential spectrum processing.
- This application example is directed to the calibration curve creation method according to Application Example 1, wherein in the process (c), the processing methods of the first pre-processing includes differential processing.
- This application example is directed to the calibration curve creation method according to Application Example 1, wherein in the process (c), the processing methods of the second pre-processing includes a principal component analysis.
- the independent component analysis processing of the process (d) can be accurately performed at high speed.
- This application example is directed to the calibration curve creation method according to Application Example 1, wherein in the process (c), the processing methods of the second pre-processing includes a factor analysis.
- the independent component analysis processing of the process (d) can be accurately performed at high speed.
- the calibration curve creation apparatus includes: a sample observation data acquisition unit that acquires the observation data for a plurality of samples of the subject; a sample target component amount acquisition unit that acquires the content of the target component in each sample; a pre-processing method selection unit that selects a processing method of a pre-processing of the observation data from a plurality of options, the pre-processing includes first pre-processing including correction processing and second pre-processing including whitening; a mixing coefficient estimation unit that estimates a plurality of independent components when separating the observation data of each sample into a plurality of independent components and calculates a mixing coefficient corresponding to the target component for each sample based on the plurality of independent components; and a regression equation calculation unit that calculates a regression equation of the calibration curve based on the content of the target component of each of the plurality of samples and the mixing coefficient of
- a plurality of processing methods are prepared as processing methods of each of the first pre-processing and the second pre-processing, and the pre-processing method selection unit combines one or more of the processing methods of each of the first pre-processing and the second pre-processing to set the pre-processing method having a plurality of options and selects an optimal combination from the set pre-processing method.
- the mixing coefficient estimation unit includes: an independent component matrix calculation section that calculates an independent component matrix including the independent component of each sample; an estimated mixing matrix calculation section that calculates an estimated mixing matrix, which indicates a set of vectors defining a ratio of an independent component element of each independent component in each sample, from the independent component matrix; and a mixing coefficient selection section that calculates a correlation between each of the vectors included in the estimated mixing matrix and the content of the target component of each of the plurality of samples and selects the vector, which is determined to have the highest correlation, as a mixing coefficient corresponding to the target component.
- the independent component matrix calculation section calculates the independent component matrix by executing the first pre-processing, the second pre-processing, and independent component analysis processing in this order using the pre-processing method selected by the pre-processing method selection unit.
- the calibration curve creation apparatus of Application Example 10 similar to the calibration curve creation method of Application Example 1, it is sufficient to acquire a piece of observation data for the subject at the time of measurement. Therefore, an effect that the amount of target component can be accurately calculated from a piece of observation data, which is an actual measurement value, is obtained.
- the appropriate pre-processing is selected and executed according to the characteristics of the observation data by the pre-processing method selection unit, information included in the observation data can be appropriately extracted by the mixing coefficient estimation unit. As a result, it is possible to improve the measurement accuracy.
- This application example is directed to the calibration curve creation apparatus according to Application Example 10, wherein the pre-processing method selection unit includes a projection on null space as an option of the processing method of the first pre-processing.
- This application example is directed to the calibration curve creation apparatus according to Application Example 10, wherein the pre-processing method selection unit includes centering as an option of the processing method of the first pre-processing.
- This application example is directed to the calibration curve creation apparatus according to Application Example 10, wherein the pre-processing method selection unit includes normalization as an option of the processing method of the first pre-processing.
- This application example is directed to the calibration curve creation apparatus according to Application Example 10, wherein the pre-processing method selection unit includes smoothing processing as an option of the processing method of the first pre-processing.
- This application example is directed to the calibration curve creation apparatus according to Application Example 10, wherein the pre-processing method selection unit includes differential spectrum processing as an option of the processing method of the first pre-processing.
- This application example is directed to the calibration curve creation apparatus according to Application Example 10, wherein the pre-processing method selection unit includes differential processing as an option of the processing method of the first pre-processing.
- This application example is directed to the calibration curve creation apparatus according to Application Example 10, wherein the pre-processing method selection unit includes a principal component analysis as an option of the processing method of the second pre-processing.
- This application example is directed to the calibration curve creation apparatus according to Application Example 10, wherein the pre-processing method selection unit includes a factor analysis as an option of the processing method of the second pre-processing.
- This application example is directed to the calibration curve creation apparatus according to Application Example 10, wherein the calibration curve creation apparatus further includes a storage unit that stores the independent component matrix calculated by the independent component matrix calculation section, a target component rank indicating at which position of the estimated mixing matrix the mixing coefficient selected by the mixing coefficient selection section is present, and a regression equation calculated by the regression equation calculation unit.
- the calibration curve creation apparatus can store the independent component matrix, the target component rank, and the regression equation in the storage unit.
- the target component gauging apparatus includes: a subject observation data acquisition unit that acquires observation data of the subject; a data-for-measurement acquisition unit that acquires measurement data including at least an independent component corresponding to the target component; a mixing coefficient calculation unit that calculates a mixing coefficient with respect to the target component for the subject based on the measurement data and the observation data of the subject; and a target component amount calculation unit that calculates the content of the target component based on a constant of a regression equation indicating a relationship between a content and a mixing coefficient corresponding to the target component, which is prepared in advance, and the mixing coefficient calculated by the mixing coefficient calculation unit.
- the mixing coefficient calculation unit executes a pre-processing method, which is selected by a pre-processing method selection unit of a calibration curve creation apparatus that calculates the independent component, as first pre-processing including processing for correcting the observation data and second pre-processing including whitening, in this order.
- the content of the target component in the subject can be accurately calculated just by acquiring a piece of observation data regarding the subject.
- This application example is directed to the target component gauging apparatus according to Application Example 20, wherein the data-for-measurement acquisition unit acquires an independent component, which corresponds to the target component and is calculated in advance, as the measurement data, and the mixing coefficient calculation unit calculates an inner product of the independent component and the observation data of the subject and sets an value of the inner product as the mixing coefficient.
- a mixing coefficient highly correlated with the target component of the subject can be accurately and easily calculated.
- This application example is directed to the target component gauging apparatus according to Application Example 20, wherein the data-for-measurement acquisition unit acquires, as the data for measurement, a plurality of independent components when separating observation data of a plurality of samples into a plurality of independent components, and the mixing coefficient estimation unit calculates an estimated mixing matrix for the subject based on the observation data of the subject and the plurality of independent components, and extracts a mixing coefficient corresponding to the target component from the calculated estimated mixing matrix.
- a mixing coefficient highly correlated with the target component of the subject can be accurately calculated.
- the invention can be realized in various forms other than those described above.
- the invention can also be realized in a form as a target component gauging apparatus that stores the regression line calculated by the calibration curve creation method in a memory, a form as a computer program to realize as a function the configuration of each unit included in the target component gauging apparatus, and a storage medium (non-transitory storage medium) on which the computer program or the computer program is recorded.
- An embodiment is related to a method of creating the calibration curve for deriving the chlorophyll content in green vegetables from the spectrum of the spectral reflectance of the green vegetables as observation data.
- the green vegetables are spinach, Chinese cabbage, and a green pepper, for example.
- Fig. 1 is a flowchart showing a calibration curve creation method as an embodiment. As shown in Fig. 1 , this calibration curve creation method includes seven steps of steps 1 to 7. The steps 1 to 7 are performed in this order. The steps 1 to 7 will be described in order.
- the step 1 is a preparatory step, and is performed by the operator.
- the operator prepares a plurality of green vegetables (for example, spinach) of the same type, which have different freshness, as samples.
- n is an integer of 2 or more samples are used.
- the step 2 is a spectrum measurement step, and is performed by the operator using a spectrometer.
- the operator measures the spectrum of the spectral reflectance for each sample by imaging each of the plurality of samples prepared in step 1 using the spectrometer.
- the spectrometer is a known instrument that measures a spectrum by making light from a measured object be transmitted through a spectroscope and receiving the spectrum output from the spectroscope on the imaging surface of an imaging device.
- the relationship expressed as in the following Expression (1) is satisfied between the spectrum of the spectral reflectance and the spectrum of absorbance.
- Absorbance - log 10 Reflectance
- the spectrum of the measured spectral reflectance is converted into the absorbance spectrum using Expression (1) . Conversion into the absorbance spectrum is performed because a linear combination needs to be established in the mixed signal analyzed in the independent component analysis, which will be described later, and the linear combination is established for the absorbance from the Lambert-Beer's law. Therefore, in step 2, it is also possible to measure the absorbance spectrum instead of the spectral reflectance spectrum. As a measurement result, data of absorbance distribution showing the characteristics with respect to the wavelength of the measured object is output. The data of absorbance distribution is also referred to as spectral data.
- the operator images a predetermined portion for each sample, and measures the spectrum of the predetermined portion.
- the predetermined portion may be any portion in each sample, but a portion having freshness that is not greatly different from that of the entire sample is preferable. For example, when the freshness of a certain portion in a sample is extremely low, a portion excluding the portion with low freshness is set as a predetermined portion to be measured.
- Fig. 2 is a graph showing the relationship between the wavelength of light and the spectral reflectance for green vegetables having different freshness.
- the spectrum waveforms of fresh vegetable, slightly shriveled vegetable, and shriveled vegetable are different.
- the reflectance decreases abruptly in a wavelength range equal to or less than about 700 nm. This is because light absorption by chlorophyll occurs at a wavelength of 700 nm or less.
- the reflectance rises greatly in a wavelength range of 700 nm or less because chlorophyll has decreased.
- the spectrum for each sample is measured in step 2.
- the step 3 is a step of measuring the chlorophyll content, and is performed by the operator.
- the operator measures the chlorophyll content, which is the content of a target component in each sample, by chemically analyzing each of the plurality of samples prepared in step 1. Specifically, a predetermined portion is extracted from each sample, chlorophyll that is a target component is extracted from the predetermined portion, and the chlorophyll content is measured.
- the "predetermined portion” may be any portion of the sample, it is preferable that the "predetermined portion” be the same as the portion in which the spectrum has been measured in step 2.
- the step 4 is a pre-processing selection step, and is performed using a personal computer.
- Fig. 3A is an explanatory diagram showing a personal computer 100 and its peripheral devices that are used in step 4 and steps 5 to 7, which will be described later.
- the personal computer hereinafter, simply referred to as a "computer” 100 is electrically connected to a spectrometer 200 and a keyboard 300.
- the computer 100 is a known apparatus including a CPU 10 that executes various kinds of processes and control when executing a computer program (hereinafter, simply referred to as a "program"), a memory 20 (storage unit) that is a data storage location, a hard disk drive 30 that stores a program or data and information, an input interface (I/F) 50, and an output interface (I/F) 60.
- a computer program hereinafter, simply referred to as a "program”
- memory 20 storage unit
- hard disk drive 30 that stores a program or data and information
- I/F input interface
- I/F input interface
- I/F input interface
- I/F input interface
- Fig. 3B is a functional block diagram of an apparatus used in steps 4 to 6.
- This apparatus 400 includes a sample observation data acquisition unit 410, a sample target component amount acquisition unit 420, a pre-processing selection unit 430, a mixing coefficient estimation unit 440, a regression equation calculation unit 450, and an algorithm evaluation unit 460.
- the mixing coefficient estimation unit 440 includes an independent component matrix calculation section 442, an estimated mixing matrix calculation section 444, and a mixing coefficient selection section 446.
- the sample observation data acquisition unit 410 and the sample target component amount acquisition unit 420 are realized by the cooperation of the CPU 10 and the input I/F 50 and the memory 20 shown in Fig. 3A , for example.
- the pre-processing selection unit 430, the mixing coefficient estimation unit 440, the independent component matrix calculation section 442, the estimated mixing matrix calculation section 444, and the mixing coefficient selection section 446 are realized by the cooperation of the CPU 10 and the memory 20 shown in Fig. 3A , for example.
- the regression equation calculation unit 450 and the algorithm evaluation unit 460 are realized by the cooperation of the CPU 10 and the memory 20 shown in Fig. 3A , for example.
- each of these units or sections can be realized by other specific devices or hardware circuits excluding the personal computer shown in Fig. 3A .
- the step 4 is a step of selecting the combination of pre-processing, and is performed by a personal computer.
- a first pre-processing section 470 can select processing from variations of standard normal variate transformation (SNV) 472 and projection on null space (PNS) 474 and perform the pre-processing in combination.
- SNV standard normal variate transformation
- PPS projection on null space
- the SNV 472 is a process for obtaining normalized data, in which the average value is 0 and the standard deviation is 1, by subtracting the average value of data to be processed and dividing the result by the standard deviation.
- the PNS 474 is a process for removing a baseline variation included in the data to be processed.
- a baseline variation such as an increase or decrease in the average value of data, occurs in the measurement data due to various factors. For this reason, it is preferable to remove the variation factors before performing the independent component analysis.
- the PNS can be used as pre-processing that can remove any baseline variation.
- the PNS can remove the baseline variation of any combination thereof.
- PNS is described in Zeng-Ping Chen, Julian Morris, and Elaine Martin, "Extracting Chemical Information from Spectral Data with Multiplicative Light Scattering Effects by Optical Path-Length Estimation and Correction", 2006 , for example.
- the PNS is a method for removing the variation of the baseline whose influence changes algebraically functionally in the data length direction, it depends on target measurement data which-order algebraic function influence is to be removed. Therefore, there is a plurality of variations in the PNS depending on a method of selecting the baseline to be removed.
- the first pre-processing it is possible to perform processing other than the SNV or the PNS. In the first pre-processing, it is preferable to perform certain normalization processing, but the normalization processing may be omitted.
- the first pre-processing section 470 is also referred to as a "correction processing section" hereinbelow. Details of these two processes 472 and 474 will be further described later.
- a second pre-processing section 480 can perform pre-processing using either a principal component analysis (PCA) 482 or a factor analysis (FA) 484.
- PCA principal component analysis
- FA factor analysis
- the second pre-processing section 480 is also referred to as a "whitening processing section” hereinbelow.
- a general ICA method dimensional compression of data to be processed and decorrelation are performed as the second pre-processing. Since a transformation matrix to be calculated by the ICA is limited to an orthogonal transformation matrix by the second pre-processing, it is possible to reduce the amount of calculation in the ICA. Such second pre-processing is called "whitening", and the PCA is used in many cases.
- the second pre-processing section 480 shown in Fig. 3C can select either the PCA or the FA to perform the whitening. Details of these two processes 482 and 484 will be further described later. In addition, the whitening processing may be omitted.
- the pre-processing it is preferable to select an appropriate combination of processes from the above processes according to the characteristics of observation data and perform the selected combination of processes. In order to determine which combination of processes is appropriate, possible combinations of pre-processing are evaluated, and the most accurate combination is selected as the pre-processing. In order to find a combination of pre-processing that is optimal for the target sample observation data, the regression equation of the calibration curve is calculated for each combination, and the accuracy is evaluated.
- step 4 these combinations of pre-processing are selected sequentially from the start, and are executed for the observation data.
- the regression equation of the calibration curve is obtained through steps 5 and 6 to be described later. Then, the accuracy is evaluated in step 7. These steps are repeated to evaluate the accuracy for all combinations of pre-processing and select an optimal combination of pre-processing.
- pre-processing is evaluated to select pre-processing in the present embodiment, other methods may be used as a method of selecting pre-processing.
- the operator may select pre-processing from the list of pre-processing.
- the step 5 is a step of estimating a mixing coefficient, and is performed using a personal computer.
- Fig. 3C is a functional block diagram showing an example of the internal configuration of the independent component matrix calculation section 442.
- the independent component matrix calculation section 442 includes the first pre-processing section 470, the second pre-processing section 480, and an independent component analysis processing section 490.
- a plurality of pre-processing methods are prepared for the first pre-processing section 470 and the second pre-processing section 480. In actual processing, some of the plurality of pre-processing methods are selected and are performed in combination.
- the three processing sections 470, 480, and 490 calculate an independent component matrix (to be described later) by processing the data to be processed (absorbance spectrum in the present embodiment) in this order. Details of the processing of the respective sections will be described later.
- the spectrometer 200 shown in Fig. 3A is used in step 2.
- the computer 100 acquires the absorbance spectrum obtained from the spectral distribution measured by the spectrometer 200 in step 2, as spectral data, through the input I/F 50 (corresponding to the sample observation data acquisition unit 410 shown in Fig. 3B ).
- the computer 100 acquires the chlorophyll content measured in step 3 through the input I/F 50 in response to the operation of the keyboard 300 by the operator (corresponding to the sample target component amount acquisition unit 420 shown in Fig. 3B ).
- the chlorophyll content measured in step 3 may be input to the computer 100 as a mass of chlorophyll per unit mass (for example, per 100 g) of a predetermined portion in which chlorophyll has been measured.
- the chlorophyll content may be input as an absolute value of the mass.
- a data set including the spectral data and the chlorophyll content (hereinafter, referred to as a "measured data set") DS1 is stored in the hard disk drive 30 of the computer 100.
- Fig. 5 is an explanatory diagram schematically showing the measured data set DS1 stored in the hard disk drive 30.
- the measured data set DS1 is a data structure including sample numbers B1, B2, ..., Bn for identifying a plurality of samples prepared in step 1, chlorophyll content C1, C2, ..., Cn of each sample, and spectral data X 1 , X 2 , ..., X n of each sample.
- the chlorophyll content C1, C2, ..., Cn and the spectral data X 1 , X 2 , ..., X n are matched with the sample numbers B1, B2, ..., Bn so that the corresponding sample thereof can be seen.
- the CPU 10 loads a predetermined program stored in the hard disk drive 30 to the memory 20 and executes the program to perform a process for estimating the mixing coefficient that is the operation of step 4.
- the predetermined program can also be downloaded from the outside using a network, such as the Internet.
- the CPU 10 functions as the mixing coefficient estimation unit 440 shown in Fig. 3B .
- Fig. 6 is a flowchart showing the mixing coefficient estimation process executed by the CPU 10.
- the CPU 10 performs independent component analysis first (step S110).
- the independent component analysis is one of the multi-dimensional signal analysis methods, and is a technique for observing a mixed signal, in which independent signals overlap each other, in some different conditions and separating the original independent signals based on the result.
- the spectrum as an independent component can be estimated from the spectral data (observation data) obtained in step 2 by regarding the spectral data obtained in step 2 as mixed data of "m" (unknown) independent components including the spectrum due to chlorophyll.
- the independent component analysis is performed when the three processing sections 470, 480, and 490 shown in Fig. 3C perform their processes in this order.
- the independent component analysis processing of the independent component analysis processing section (ICA processing section) 490 is performed.
- the independent component analysis processing section (ICA processing section) 490 estimates the spectrum as an independent component by performing the ICA on the spectral data subjected to the first pre-processing and the second pre-processing.
- ICA independent component analysis processing section
- a high-order statistic indicating the independence of separated pieces of data is used as an indicator for the separation of independent components (independence indicator).
- kurtosis is a typical independence indicator.
- Subscript l is the number of wavelength ranges where the spectrum has been measured.
- the number of elements m of the spectrum S of unknown components is an integer of 1 or more, and is determined experimentally or empirically in advance according to the type (here, spinach) of sample.
- a in Expression (6) is a mixing matrix, and can be expressed as in the following Expression (7).
- the letter “A” needs to be expressed in bold as shown in Expression (7), the letter “A” is expressed in a normal letter herein from the limitation of letters used in the specification.
- other bold letters representing the matrix are also similarly expressed in normal letters.
- A a 11 ⁇ a 1 ⁇ m ⁇ ⁇ ⁇ a n ⁇ 1 ⁇ a nm
- the mixing matrix A When the mixing matrix A is known, the least square solution of the unknown component S can be easily calculated as A + ⁇ X by using a pseudo- inverse matrix A + of A. In the present embodiment, however, since the mixing matrix A is unknown, the unknown component S and the mixing matrix A should be estimated only from the observation data X. That is, as shown in the following Expression (8), a matrix showing the spectrum as an independent component (hereinafter, referred to as an "independent component matrix”) Y is calculated only from the observation data X using the separation matrix W (m x n).
- independent component matrix a matrix showing the spectrum as an independent component
- step S110 of Fig. 6 the CPU 10 performs up to the process for calculating the separation matrix W described above.
- the separation matrix W is calculated using one of the algorithms, such as Infomax, FastICA, and JADE described above, based on the input of the spectral data X of each sample obtained in step 2 and stored in advance in the hard disk drive 30.
- step S110 the CPU 10 performs processing for calculating the independent component matrix Y based on the separation matrix W and the spectral data X of each sample, which is obtained in step 2 and is stored in advance in the hard disk drive 30 (step S120).
- step S120 calculation is performed according to Expression (8) described above.
- the CPU 10 functions as the independent component matrix calculation section 442 shown in Fig. 3B .
- the CPU 10 performs processing for calculating the estimated mixing matrix AA based on the spectral data X of each sample stored in advance in the hard disk drive 30 and the independent component matrix Y calculated in step S120 (step S130).
- calculation is performed according to Expression (10) described above.
- Fig. 7 is an explanatory diagram for explaining the estimated mixing matrix AA.
- table TB has sample numbers B 1 , B 2 , ..., B n in a vertical direction and elements of the independent component matrix Y (hereinafter, referred to as "independent component elements") Y 1 , Y 2 , ..., Y m in a horizontal direction.
- the coefficient ⁇ a ij included in the estimated mixing matrix AA indicates the ratio of the independent component elements Y 1 , Y 2 , ..., Y m in each sample.
- a target component rank k illustrated in Fig. 7 will be described later.
- the CPU 10 functions as the estimated mixing matrix calculation section 444 shown in Fig. 3B .
- the estimated mixing matrix AA is obtained by the processing up to step S130. That is, the coefficient (estimated mixing coefficient) ⁇ a ij included in the estimated mixing matrix AA is obtained. Then, the process proceeds to step S140.
- step S140 CPU 10 calculates a correlation (degree of similarity) between the chlorophyll content C1, C2, ..., Cn measured in step 3 and components (hereinafter, referred to as a vector ⁇ ) of each column included in the estimated mixing matrix AA calculated in step S130.
- a correlation between the chlorophyll content C (C1, C2, ..., Cn) and the vector ⁇ 1 ( ⁇ a 11 , ⁇ a 21 , ..., ⁇ a n1 ) of the first column is calculated, and then a correlation between the chlorophyll content C (C1, C2, ..., Cn) and the vector ⁇ 2 ( ⁇ a 12 , ⁇ a 22 , ..., ⁇ a n2 ) of the second column is calculated.
- Such a correlation can be calculated by using a correlation coefficient R according to the following Expression (12).
- the correlation coefficient R is called a Pearson's product-moment correlation coefficient.
- C and ⁇ k are the chlorophyll content and the average value of the vector ⁇ k , respectively
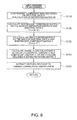
- Fig. 8 is a graph of the scatter plot.
- the vertical axis indicates the chlorophyll content C
- the horizontal axis indicates the coefficient (hereinafter, referred to as an "estimated mixing coefficient") ⁇ a of the estimated mixing matrix AA.
- plotted points are gathered relatively near the straight line L.
- the correlation between the chlorophyll content C and the estimated mixing coefficient ⁇ a is high.
- the correlation between the chlorophyll content C and the estimated mixing coefficient Aa is low, as shown in Fig. 9 , plotted points are not located linearly but spread. That is, the higher the correlation between the chlorophyll content C and the estimated mixing coefficient ⁇ a, the higher the tendency in which plotted points are gathered linearly.
- the correlation coefficient R shown in Expression (12) indicates the degree of tendency in which plotted points are gathered linearly.
- the CPU 10 specifies a correlation coefficient with the highest correlation, that is, a correlation coefficient with a value close to 1, from the correlation coefficient R j obtained in step S140.
- the correlation coefficient R j at which plotted points are gathered most linearly is specified.
- a column vector ⁇ when the highest correlation coefficient R is obtained is selected from the estimated mixing matrix AA (step S150).
- the selection in step S150 means selecting a column from a plurality of columns in the table TB shown in Fig. 7 . Elements of the selected column are mixing coefficients of the independent component corresponding to chlorophyll that is a target component.
- a vector ⁇ k ( ⁇ a 1k , ⁇ a 2k , ..., ⁇ a nk ) is obtained.
- k is assumed to be an integer of 1 to m.
- the value of k is temporarily stored in the memory 20 as a target component rank indicating which number of independent component corresponds to the target component. ⁇ a 1k , ⁇ a 2k , ...
- ⁇ a nk included in the vector ⁇ k correspond to the "mixing coefficient corresponding to the target component" in Application Example 1.
- the term “rank” is used to mean a "value indicating the position within the matrix”.
- the step 6 is a step of calculating the regression equation, and is performed using the computer 100 in the same manner as when performing step 5.
- the computer 100 performs processing for calculating the regression equation of the calibration curve.
- data up to step 5 may be transferred to another computer to perform step 6.
- Fig. 10 is a flowchart showing the regression equation calculation process executed by the CPU 10 of the computer 100.
- CPU 10 calculates a regression equation F first based on the chlorophyll content C (C1, C2, ... , Cn) measured in step 3 and the vector ⁇ k ( ⁇ a 1k , ⁇ a 2k , ..., ⁇ a nk ) selected in step S150 (step S210).
- the scatter plot shown in Fig. 8 has a highest correlation
- the straight line L in Fig. 8 corresponds to the regression equation F. Since a method of calculating the regression equation is known, detailed explanation thereof will not be given.
- the straight line L is calculated using the least square method so that the distance (residual) from the straight line L to each plotted point becomes close to 0.
- the regression equation F can be expressed as in the following Expression (13) .
- step S210 constants u and v in Expression (13) are calculated.
- F : C u ⁇ ⁇ ⁇ k + v
- step S210 the CPU 10 stores a combination method of the constants u and v of the regression equation F calculated in step S210, the target component rank k ( Fig. 7 ) obtained in step S150, the independent component matrix Y calculated in step S120 of the mixing coefficient calculation process ( Fig. 6 ), and the pre-processing selected in the pre-processing selection in the hard disk drive 30 as a data set for measurement DS2 (step S220). Then, the CPU 10 proceeds to "return" to temporarily end the process of calculating the regression equation. As a result, it is possible to obtain the regression line of the calibration curve, and the calibration curve creation method shown in Fig. 1 also ends. In the processing of steps S210 and S220, the CPU 10 functions as the regression equation calculation unit 450 shown in Fig. 3B .
- the step 7 is an algorithm evaluation step, and is performed using the computer 100 in the same manner as when performing steps 5 and 6.
- One of the combinations of pre-processing is selected in step 4, mixing coefficient calculation processing is performed, and the regression line of the calibration curve is calculated.
- the accuracy of the calibration curve in this case is evaluated, it is evaluated how much the combination of pre-processing selected in step 4 is effective for the observation data, and the combination of pre-processing selected in step 4 is compared with other combinations of pre-processing.
- a correlation coefficient between the mixing coefficient and the true value can be used for the evaluation.
- a result when calculating the measurement accuracy SEP by measuring the sample data using the calibration curve can be used.
- a combination of pre-processing with the highest accuracy among the combinations of pre-processing evaluated up to now is determined as a candidate of pre-processing.
- the process returns to step 4 to evaluate the next pre-processing.
- the evaluation of all pre-processing ends, the current pre-processing candidate is adopted as pre-processing for the target observation data.
- the target component measuring method will be described.
- a subject is assumed to contain the same components as a sample used when creating the calibration curve.
- the target component measuring method is performed using a computer.
- the computer herein may be the computer 100 used when creating the calibration curve, or may be a different computer.
- Fig. 11 is a functional block diagram of an apparatus used when measuring a target component.
- An apparatus 500 includes a subject observation data acquisition unit 510, a data-for-measurement acquisition unit 520, a mixing coefficient calculation unit 530, and a target component amount calculation unit 540.
- the mixing coefficient calculation unit 530 includes a pre-processing section 532. This pre-processing section 532 has functions of both the first pre-processing section 470 and second pre-processing section 480 shown in Fig. 3C , and performs pre-processing selected in the calibration curve creation.
- the subject observation data acquisition unit 510 is realized by the cooperation of the CPU 10 and the input I/F 50 and the memory 20 shown in Fig. 3A , for example.
- the data-for-measurement acquisition unit 520 is realized by the cooperation of the CPU 10 and the memory 20 and the hard disk drive 30 shown in Fig. 3A , for example.
- the mixing coefficient calculation unit 530 and the target component amount calculation unit 540 are realized by the cooperation of the CPU 10 and the memory 20 shown in Fig. 3A , for example.
- the computer to realize each function shown in Fig. 11 is assumed to be the computer 100 used when creating the calibration curve, and the data set for measurement DS2 described above is stored in a storage unit, such as a hard disk drive.
- Fig. 12 is a flowchart showing the target component measuring process executed by the CPU 10 of the computer 100.
- the target component measuring process is realized when the CPU 10 loads a predetermined program stored in the hard disk drive 30 to the memory 20 and executes the program.
- the CPU 10 first performs processing for imaging a green vegetable, which is a subject, using a spectrometer (step S310).
- the imaging in step S310 can be performed as in step 2.
- the absorbance spectrum Xp of the subject is obtained.
- the spectrometer used in the measurement process is preferably the same model as the spectrometer that is used in the creation of the calibration curve in order to suppress error.
- the spectrometer used in the measurement process be the same apparatus as the spectrometer used in the creation of the calibration curve.
- the spectrometer used in the measurement process instead of measuring the spectral reflectance spectrum or the absorbance spectrum using a spectroscope, it is possible to estimate these spectra from other measured values.
- the spectrum Xp of the absorbance of the subject obtained when imaging a subject once is expressed as a vector as in the following Expression (14).
- X p X p ⁇ 1 , X p ⁇ 2 , ... , X p ⁇ 1
- step S310 the CPU 10 functions as the subject observation data acquisition unit 510 shown in Fig. 11 . Then, the CPU 10 acquires the data set for measurement DS2 from the hard disk drive 30, and stores the data set for measurement DS2 in the memory 20 (step S315).
- step S315 the CPU 10 functions as the data-for-measurement acquisition unit 520 shown in Fig. 11 .
- pre-processing is performed on the absorbance spectrum Xp of the subj ect obtained in step S310 (step S325).
- the same processing as the pre-processing that is, the normalization processing of the first pre-processing section 470 and the whitening processing of the second pre-processing section 480 used in step 4 of Fig. 1 (more specifically, step S110 of Fig. 6 ) when creating the calibration curve is performed based on the combination of pre-processing included in the data set for measurement.
- the CPU 10 performs processing for calculating the estimated mixing matrix AA regarding the subject based on the independent component matrix Y included in the data set for measurement DS2 and the pre-processed spectrum obtained in step S325 (step S335). Specifically, arithmetic processing according to Expression (10) described above is performed.
- the estimated mixing matrix AA is obtained by calculating the inverse matrix (pseudo-inverse matrix) Y + of the independent component matrix Y included in the data set for measurement DS2 and multiplying the pre-processed spectrum obtained in step S325 by the pseudo-inverse matrix Y + .
- the estimated mixing matrix AA in the measurement process is a row vector ("1 x m" matrix) configured to include mixing coefficients corresponding to the respective independent components.
- the CPU 10 reads the target component rank k included in the data set for measurement DS2 from the hard disk drive 30, extracts the mixing coefficient ⁇ k of the k-th component corresponding to the target component rank k from the estimated mixing matrix ⁇ A calculated in step S335, and temporarily stores the mixing coefficient ⁇ k in the memory 20 as a mixing coefficient of chlorophyll that is a target component (step S340).
- the CPU 10 functions as the mixing coefficient calculation unit 530 shown in Fig. 11 .
- a ⁇ ⁇ ⁇ 1 ⁇ ⁇ ⁇ 2 ⁇ ⁇ ⁇ m
- the CPU 10 reads the constants u and v of the regression equation included in the data set for measurement DS2 from the hard disk drive 30, and calculates the content C of chlorophyll by substituting the constants u and v and the mixing coefficient ⁇ k of chlorophyll as a target component, which is obtained in step S340, into the right side of Expression (13) (step S350).
- the content C is calculated as a mass of chlorophyll per unit mass (for example, per 100 g) of the subject.
- the CPU 10 functions as the target component amount calculation unit 540 shown in Fig. 11 . Then, the process proceeds to "return" to end the target component measuring process.
- the content C (mass per unit mass) calculated in step S350 is used as the content of chlorophyll in the subject.
- the content C calculated in step S350 may be corrected using the normalization coefficient used in the normalization of step S325 and the corrected value may be used as the content to be calculated.
- the absolute value (gram) of the content may be calculated by multiplying the content C by the standard deviation. According to this configuration, it is possible to calculate the content C more accurately depending on the type of target component.
- the chlorophyll content can be accurately calculated from one spectrum that is an actual measurement value of the green vegetable as a subject.
- SNV normal variate transformation
- PPS projection on null space
- z is data after processing
- x is data to be processed (absorbance spectrum in the present embodiment)
- X ave is the average value of the data to be processed x
- ⁇ is a standard deviation of the data to be processed x.
- the PNS By performing the PNS, it is possible to reduce the baseline variation included in the data to be processed.
- a baseline variation such as an increase or decrease in the average value of data, occurs in the measurement data due to various factors. For this reason, it is preferable to remove the variation factors before performing the independent component analysis (ICA).
- ICA independent component analysis
- the PNS can be used as pre-processing that can reduce any baseline variation of the data to be processed.
- the advantage of applying the PNS is large since such a baseline variation occurs frequently.
- measurement data x data obtained by measurement
- the PNS The principle of removing the baseline variation, which is included in data obtained by measurement (simply referred to as "measurement data x"), by the PNS will be described below.
- the measurement data is an absorbed light spectrum or a reflected light spectrum including an infrared region
- the PNS can also be similarly applied for other types of measurement data (for example, sound data) .
- A is a matrix (mixing matrix) formed with the mixture ratio c i .
- b is a parameter indicating a variation in the amplitude direction of the spectrum
- a, d, and e are parameters indicating the amount of constant baseline variation E (also referred to as "average value variation"), the amount of variation ⁇ that linearly depends on the wavelength, and the amount of variation ⁇ 2 that depends on the square of the wavelength, respectively, and ⁇ is other variation components.
- N is the data length of the measurement data x.
- third-order or higher variations can also be taken into consideration. In general, it is possible to take into consideration up to the g-th order variation ⁇ g (g is an integer of 2 or more).
- P + is a pseudo-inverse matrix of P.
- k i is a result obtained by projecting the component s i of Expression (18) to the null space not including that does not include variation components.
- c* is a result obtained by projecting the variation component ⁇ of Expression (18) to the null space.
- An independent component obtained by performing the ICA on the data pre-processed by the PNS is an estimate of the component k i of Expression (19), which is different from the true component s i .
- the mixture ratio c i is not changed from the value in original Expression (18)
- the true component s i cannot be obtained by the ICA if the PNS is performed as pre-processing of the ICA, the idea of applying the PNS as pre-processing of the ICA is not possible normally. In the present embodiment, however, there is no influence on the measurement process even if the PNS is performed as pre-processing of the ICA. If the PNS is performed as the pre-processing, it is possible to perform measurement more accurately.
- the order of the variation to be removed by the PNS can be removed in any combination. Since these variations are error factors in the ICA or the measurement, removing the variations in advance is desirable in many cases. However, not only the variation components but also information required for the measurement may be removed together. Depending on the characteristics of the observation data, it may be better to leave the required information even if there are variations in order to improve the measurement accuracy. Therefore, as the processing of the PNS, when zero-order, first-order, and second-order variations are considered, it is possible to remove variation component combinations, such as [zero-order, first-order, second-order], [zero-order, first-order], [zero-order, second-order], and [zero-order], for example.
- PCA principal component analysis
- FA factor analysis
- a transformation matrix to be calculated by the ICA is limited to an orthogonal transformation matrix by this pre-processing, it is possible to reduce the amount of calculation in the ICA.
- Such pre-processing is called "whitening", and the PCA is used in many cases. The whitening using the PCA is described in detail in Chapter 6 of Aapo Hyvarinen, Juha Karhumen, Erkki Oja, "Independent Comonent Analysis", 2001, John Wiley & Sons, Inc. , for example.
- ⁇ is random noise
- the independent component s i and the random noise p follow the normal distribution N(0, Im) and N(0, E), respectively.
- the first parameter x1 of the normal distribution N(x1, x2) indicates an expected value
- the second parameter x2 indicates a standard deviation.
- the data to be processed x since the data to be processed x is a linear sum of the variable according to the normal distribution, the data to be processed x also follows the normal distribution.
- the covariance matrix of the data to be processed x is V[x]
- the normal distribution that the data to be processed x follow can be expressed as N(0, V[x]).
- the likelihood function regarding the covariance matrix V[x] of the data to be processed x can be calculated by the following procedure.
- V[x] of the data to be processed x is calculated by the following Expression (21).
- ⁇ is a covariance matrix of the noise p.
- the covariance matrix V[x] can be expressed by the mixing matrix A and the covariance matrix E of noise.
- the logarithmic likelihood function L(A, ⁇ ) is given as the following Expression.
- L A ⁇ ⁇ - n 2 tr ⁇ A ⁇ A T + ⁇ - 1 ⁇ C + log ⁇ det ⁇ A ⁇ A T + ⁇ + m ⁇ log ⁇ 2 ⁇ ⁇
- n is the number of pieces of data x
- m is the number of independent components
- an operator tr is a trace (sum of diagonal elements) of a matrix
- an operator det is a determinant.
- C is a sample covariance matrix obtained by sample calculation from the data x, and is calculated by the following Expression.
- the mixing matrix A and the covariance matrix ⁇ of noise can be calculated from the maximum likelihood method using the logarithmic likelihood function L (A, E) of the above Expression (22).
- L (A, E) logarithmic likelihood function of the above Expression (22).
- the mixing matrix A it is possible to obtain a matrix that is hardly influenced by the random noise ⁇ of the above Expression (20).
- the algorithm of the FA there are various algorithms using the algorithm other than the maximum likelihood method. Also in the present embodiment, it is possible to use such various kinds of FA.
- the estimate obtained by the FA is just the value of AA T .
- the mixing matrix A suitable for this value is determined, it is possible to de-correlate the data while reducing the influence of random noise.
- the degree of freedom of rotation remains, it is not possible to determine each of the plurality of components s i uniquely.
- the ICA is processing for reducing the degree of freedom of rotation of the plurality of components s i so that the plurality of components s i are perpendicular to each other.
- the value of the mixing matrix A calculated by the FA is used as a whitening matrix (matrix after whitening), and the arbitrary property with respect to the left rotation is specified by the ICA.
- the FA can be considered to be an extension corresponding to the noise of the PCA.
- the FA as a precondition for this extension, it is assumed that noise is normally distributed. This assumption is reasonable in many cases, and better performance can be expected. However, depending on the characteristics of the observation data, the accuracy may not be stable or may not be improved by the FA from the reason that the noise distribution deviates from the normal distribution, for example. In this case, it is appropriate to perform the known process using the PCA.
- ICA independent component analysis
- kurtosis is a typical independence indicator.
- the ICA using kurtosis as an independence indicator is described in detail in chapter 8 of Aapo Hyvarinen, Juha Karhumen, Erkki Oja, "Independent Comonent Analysis", 2001, John Wiley & Sons, Inc. , for example.
- Fig. 13 summarizes the results of accuracy evaluation when measuring one substance from a sample, in which three substances of sucrose, gelatin, and lard are mixed, for each selectable pre-processing.
- the subject observation data acquisition unit 510 acquires the independent component matrix Y including an independent component corresponding to the target component by acquiring the data set for measurement DS2 from the hard disk drive 30, and the mixing coefficient calculation unit 530 ( Fig. 11 ) calculates the estimated mixing matrix AA for the subj ect based on the independent component matrix Y and the absorbance spectrum of the subject and calculates the mixing coefficient of the target component for the subj ect by extracting the mixing coefficient ⁇ k of the k-th column corresponding to the target component rank k from the estimated mixing matrix AA.
- the invention is not limited to this. For example, it is possible to adopt the following configuration in which (i) and (ii) are performed in order.
- the data set for measurement DS2 stored in the hard disk drive 30 is read, and an element (independent component) Y k of the k-th column corresponding to the target component rank k is acquired from the independent component matrix Y included in the data set for measurement DS2.
- the independent component Y k has the highest correlation to the chlorophyll content, and corresponds to the chlorophyll content.
- the observation data is a linear sum of independent components, and it is assumed that the orthogonality of independent components is sufficiently high. Therefore, by calculating the inner product of the independent component matrix of the target component and the spectrum that is observation data, only the values of the independent components remain and all of the other components become 0. As a result, it becomes easy to calculate the mixing coefficient ⁇ k of the target component. However, when the orthogonality of independent components are not sufficiently high, it is preferable to calculate the estimated mixing matrix ⁇ of Expression (15) without using the calculation of Expression (27).
- the CPU 10 functions as a data-for-measurement acquisition unit.
- the CPU 10 functions as a mixing coefficient calculation unit.
- the data-for-measurement acquisition unit may be configured to acquire the independent component Y k from a storage unit, such as the hard disk drive 30 in which the element (independent component) Y k of the k-th column corresponding to the target component rank k in the independent component matrix Y is stored in advance. This is because only independent components corresponding to the target component are necessary and other independent components are not necessary when using the inner product. In this case, the independent component becomes a vector, and it is not necessary to store the target component rank.
- the chlorophyll content of a subject which is a green vegetable
- applications to various subjects and target components such as oleic acid in meat and collagen in the skin.
- target components such as oleic acid in meat and collagen in the skin.
- a sample having the same components as a subject is prepared to create a calibration curve, it is possible to correspond to various subjects and target components.
- a configuration is adopted in which measurement is performed with the absorbance spectrum as observation data.
- sound data in which sound emitted from a plurality of sound sources is mixed is used as the observation data instead of the absorbance spectrum, it is possible to measure the magnitude of the sound from the specific sound source with the same configuration.
- the invention can be applied to various kinds of observation data.
- an independent component matrix is calculated, an estimated mixing matrix is calculated, and a mixing coefficient corresponding to the target component is extracted from the estimated mixing matrix.
- this configuration does not necessarily need to be adopted.
- the content of the target component in each sample is measured.
- the number of elements m of the spectrum S of an unknown component is determined experimentally or empirically in advance.
- the number of elements m of the spectrum S of the unknown component may also be determined according to the information criteria known as Minimum Description Length (MDL) or Akaike Information Criteria (AIC) .
- MDL Minimum Description Length
- AIC Akaike Information Criteria
- the MDL or the like is used, the number of elements m of the spectrum S of the unknown component can be automatically determined by calculation from the observation data of the sample.
- the MDL is described in " Independent component analysis for noisy data - MEG data analysis, 2000 ", for example.
- a subject that is the target of the measurement process has the same components as a sample used when creating the calibration curve.
- an unknown component other than the same component as the sample used when creating the calibration curve may be contained in the subject. Since the inner product of independent components is assumed to be 0, the inner product of independent components corresponding to the unknown component can also be considered to be 0. Therefore, the influence of the unknown component can be neglected when calculating the mixing coefficient using an inner product.
- the computer used in the embodiment and each modification can be replaced with a dedicated apparatus instead of a personal computer.
- the personal computer to realize the target component measuring method can be replaced with a dedicated gauging apparatus.
- the input of the spectrum of the spectral reflectance of a sample or a subject is performed by inputting the spectrum measured by the spectrometer.
- the invention is not limited to this.
- the band images are obtained by imaging a sample or a subject using a multi-band camera including a filter capable of changing the transmission wavelength band.
- the function realized by software may also be realized by hardware.
- a pre-processing selection method a method of selecting the optimal pre-processing by repeating the selection of pre-processing in step 4 and the evaluation in step 7 is adopted.
- the operator may select pre-processing in step 4, and step 7 may not be performed.
Abstract
Description
- The present invention relates to a technique of creating a calibration curve, which is used to derive the content of a target component in a subject, from observation data of the subject, and a technique of calculating the content of the target component in the subject.
- A method has been proposed in which the concentration or the like of a target component is analyzed by performing independent component analysis of observation data, which is observed at a plurality of different positions of the subject, and expressing the observation data as a linear sum of a basic function with an independent component calculated by the independent component analysis as the basic function (refer to
JP-A-2007-44104 - In the known technique described above, however, there is a problem in that a plurality of different pieces of observation data for a subject are required whenever a target component of the subject is measured and the measurement can not be accurately performed from a piece of observation data.
- In addition, a variety of noises may be included in the observation data. In addition, depending on the subject, the observation data may be changed due to variations in the composition or the structure of the subject. In such a case, there is a problem in that the accuracy of independent component analysis or measurement using the same is reduced.
- On the other hand, in order to prevent the reduction in accuracy of independent component analysis or accuracy of measurement using the same, there is a method of performing pre-processing to reduce noise or the variation in observation data. However, there are many methods for pre-processing. For this reason, there has been a problem in that it is difficult to know which pre-processing is suitable for the observation data and which pre-processing should be selected to perform accurate measurement.
- An advantage of some aspects of the invention is that accurate measurement from a piece of observation data regarding a subject can be achieved when measuring a target component of the subject.
- The invention can be implemented as the following forms or application examples.
- This application example is directed to a calibration curve creation method of creating a calibration curve, which is used to derive a content of a target component in a subject, from observation data of the subject. The calibration curve creation method includes: (a) acquiring the observation data for a plurality of samples of the subject; (b) acquiring the content of the target component in each sample; (c) executing pre-processing for the observation data of each sample, a pre-processing method is selected from a plurality of options; (d) estimating a plurality of independent components when separating the pre-processed observation data of each sample into a plurality of independent components and calculating a mixing coefficient corresponding to the target component for each sample based on the plurality of independent components; and (e) calculating a regression equation of the calibration curve based on the content of the target component of each of the plurality of samples and the mixing coefficient of each sample. In the process (c), the pre-processing includes first pre-processing including processing for correcting the observation data and second pre-processing including whitening, and a plurality of processing methods are prepared as processing methods of each of the first pre-processing and the second pre-processing and the pre-processing method is set by combining one or more of the processing methods of each of the first pre-processing and the second pre-processing. The process (d) includes: (i) calculating an independent component matrix including the independent component of each sample; (ii) calculating an estimated mixing matrix, which indicates a set of vectors defining a ratio of an independent component element of each independent component in each sample, from the independent component matrix; and (iii) calculating a correlation between each of the vectors included in the estimated mixing matrix and the content of the target component of each of the plurality of samples and select the vector, which is determined to have the highest correlation, as a mixing coefficient corresponding to the target component. In the process (i), the first pre-processing, the second pre-processing, and independent component analysis processing are executed in this order using the pre-processing method selected in the process (c).
- According to the calibration curve creation method of Application Example 1, for a plurality of samples of the subject, the calibration curve for deriving the amount of target component included in the subject from the observation data of the subject is created from the content of the target component and the observation data acquired from each sample. For this reason, if this calibration curve is used, the content of the target component can be accurately calculated even if the number of pieces of observation data of the subject is one. Therefore, if the calibration curve is created in advance according to the calibration curve creation method of Application Example 1, it is sufficient to acquire a piece of observation data for the subject at the time of measurement. As a result, the amount of target component can be accurately calculated from a piece of observation data that is an actual measurement value. In addition, since an estimated mixing matrix is calculated and a vector highly correlated with the content of the target component of the sample is extracted from the estimated mixing matrix, it is possible to obtain the mixing coefficient with high estimation accuracy.
- In addition, since the appropriate pre-processing is selected and executed according to the characteristics of the observation data of the subject, information included in the observation data of the subject can be appropriately extracted. As a result, it is possible to improve the measurement accuracy.
- This application example is directed to the calibration curve creation method according to Application Example 1, wherein in the process (c), the processing methods of the first pre-processing includes a projection on null space.
- According to this configuration, it is possible to improve the measurement accuracy by reducing the baseline variation of the observation data by pre-processing based on the projection on null space.
- This application example is directed to the calibration curve creation method according to Application Example 1, wherein in the process (c), the processing methods of the first pre-processing includes centering.
- According to this configuration, since it is possible to align the baseline of the observation data by subtracting the average value of the observation data by pre-processing based on the centering, it is possible to improve the measurement accuracy.
- This application example is directed to the calibration curve creation method according to Application Example 1, wherein in the process (c), the processing methods of the first pre-processing includes normalization.
- According to this configuration, since it is possible to reduce the variation in the observation data due to changes in the measurement conditions by setting the average value of the observation data to 0 and the variance to 1 by pre-processing based on the normalization, it is possible to improve the measurement accuracy.
- This application example is directed to the calibration curve creation method according to Application Example 1, wherein in the process (c), the processing methods of the first pre-processing includes smoothing processing.
- According to this configuration, since it is possible to reduce unnecessary random noise included in the observation data by pre-processing based on the smoothing processing, it is possible to improve the measurement accuracy.
- This application example is directed to the calibration curve creation method according to Application Example 1, wherein in the process (c), the processing methods of the first pre-processing includes differential spectrum processing.
- According to this configuration, since it is possible to emphasize the variation component of the observation data by pre-processing based on the differential spectrum processing, it is possible to improve the measurement accuracy.
- This application example is directed to the calibration curve creation method according to Application Example 1, wherein in the process (c), the processing methods of the first pre-processing includes differential processing.
- According to this configuration, since it is possible to extract a variation portion of the observation data by pre-processing based on the differential processing, it is possible to improve the measurement accuracy.
- This application example is directed to the calibration curve creation method according to Application Example 1, wherein in the process (c), the processing methods of the second pre-processing includes a principal component analysis.
- According to this configuration, since it is possible to perform orthogonalization and dimensional reduction of the observation data by pre-processing based on the principal component analysis, the independent component analysis processing of the process (d) can be accurately performed at high speed.
- This application example is directed to the calibration curve creation method according to Application Example 1, wherein in the process (c), the processing methods of the second pre-processing includes a factor analysis.
- According to this configuration, since it is possible to perform orthogonalization and dimensional reduction considering the random noise included in the observation data by pre-processing based on the factor analysis, the independent component analysis processing of the process (d) can be accurately performed at high speed.
- This application example is directed to a calibration curve creation apparatus that creates a calibration curve, which is used to derive a content of a target component in a subject, from observation data of the subject. The calibration curve creation apparatus includes: a sample observation data acquisition unit that acquires the observation data for a plurality of samples of the subject; a sample target component amount acquisition unit that acquires the content of the target component in each sample; a pre-processing method selection unit that selects a processing method of a pre-processing of the observation data from a plurality of options, the pre-processing includes first pre-processing including correction processing and second pre-processing including whitening; a mixing coefficient estimation unit that estimates a plurality of independent components when separating the observation data of each sample into a plurality of independent components and calculates a mixing coefficient corresponding to the target component for each sample based on the plurality of independent components; and a regression equation calculation unit that calculates a regression equation of the calibration curve based on the content of the target component of each of the plurality of samples and the mixing coefficient of each sample. A plurality of processing methods are prepared as processing methods of each of the first pre-processing and the second pre-processing, and the pre-processing method selection unit combines one or more of the processing methods of each of the first pre-processing and the second pre-processing to set the pre-processing method having a plurality of options and selects an optimal combination from the set pre-processing method. The mixing coefficient estimation unit includes: an independent component matrix calculation section that calculates an independent component matrix including the independent component of each sample; an estimated mixing matrix calculation section that calculates an estimated mixing matrix, which indicates a set of vectors defining a ratio of an independent component element of each independent component in each sample, from the independent component matrix; and a mixing coefficient selection section that calculates a correlation between each of the vectors included in the estimated mixing matrix and the content of the target component of each of the plurality of samples and selects the vector, which is determined to have the highest correlation, as a mixing coefficient corresponding to the target component. The independent component matrix calculation section calculates the independent component matrix by executing the first pre-processing, the second pre-processing, and independent component analysis processing in this order using the pre-processing method selected by the pre-processing method selection unit.
- According to the calibration curve creation apparatus of Application Example 10, similar to the calibration curve creation method of Application Example 1, it is sufficient to acquire a piece of observation data for the subject at the time of measurement. Therefore, an effect that the amount of target component can be accurately calculated from a piece of observation data, which is an actual measurement value, is obtained. In addition, since the appropriate pre-processing is selected and executed according to the characteristics of the observation data by the pre-processing method selection unit, information included in the observation data can be appropriately extracted by the mixing coefficient estimation unit. As a result, it is possible to improve the measurement accuracy.
- This application example is directed to the calibration curve creation apparatus according to Application Example 10, wherein the pre-processing method selection unit includes a projection on null space as an option of the processing method of the first pre-processing.
- According to this configuration, it is possible to improve the measurement accuracy by reducing the baseline variation of the observation data by pre-processing based on the projection on null space.
- This application example is directed to the calibration curve creation apparatus according to Application Example 10, wherein the pre-processing method selection unit includes centering as an option of the processing method of the first pre-processing.
- According to this configuration, since it is possible to align the baseline of the observation data by subtracting the average value of the observation data by pre-processing based on centering, it is possible to improve the measurement accuracy.
- This application example is directed to the calibration curve creation apparatus according to Application Example 10, wherein the pre-processing method selection unit includes normalization as an option of the processing method of the first pre-processing.
- According to this configuration, since it is possible to reduce the variation in the observation data due to changes in the measurement conditions by setting the average value of the observation data to 0 and the variance to 1 by pre-processing based on normalization, it is possible to improve the measurement accuracy.
- This application example is directed to the calibration curve creation apparatus according to Application Example 10, wherein the pre-processing method selection unit includes smoothing processing as an option of the processing method of the first pre-processing.
- According to this configuration, since it is possible to reduce unnecessary random noise included in the observation data by pre-processing based on the smoothing processing, it is possible to improve the measurement accuracy.
- This application example is directed to the calibration curve creation apparatus according to Application Example 10, wherein the pre-processing method selection unit includes differential spectrum processing as an option of the processing method of the first pre-processing.
- According to this configuration, since it is possible to emphasize the variation component of the observation data by pre-processing based on the differential spectrum processing, it is possible to improve the measurement accuracy.
- This application example is directed to the calibration curve creation apparatus according to Application Example 10, wherein the pre-processing method selection unit includes differential processing as an option of the processing method of the first pre-processing.
- According to this configuration, since it is possible to extract a variation portion of the observation data by pre-processing based on the differential processing, it is possible to improve the measurement accuracy.
- This application example is directed to the calibration curve creation apparatus according to Application Example 10, wherein the pre-processing method selection unit includes a principal component analysis as an option of the processing method of the second pre-processing.
- According to this configuration, since it is possible to perform orthogonalization and dimensional reduction of the observation data by pre-processing based on the principal component analysis, the calculation of the independent component matrix calculation section can be accurately performed at high speed.
- This application example is directed to the calibration curve creation apparatus according to Application Example 10, wherein the pre-processing method selection unit includes a factor analysis as an option of the processing method of the second pre-processing.
- According to this configuration, since it is possible to perform orthogonalization and dimensional reduction considering the random noise included in the observation data by pre-processing based on the factor analysis, the calculation of the independent component matrix calculation section can be accurately performed at high speed.
- This application example is directed to the calibration curve creation apparatus according to Application Example 10, wherein the calibration curve creation apparatus further includes a storage unit that stores the independent component matrix calculated by the independent component matrix calculation section, a target component rank indicating at which position of the estimated mixing matrix the mixing coefficient selected by the mixing coefficient selection section is present, and a regression equation calculated by the regression equation calculation unit.
- According to this configuration, the calibration curve creation apparatus can store the independent component matrix, the target component rank, and the regression equation in the storage unit.
- This application example is directed to a target component gauging apparatus that calculates a content of a target component in a subject. The target component gauging apparatus includes: a subject observation data acquisition unit that acquires observation data of the subject; a data-for-measurement acquisition unit that acquires measurement data including at least an independent component corresponding to the target component; a mixing coefficient calculation unit that calculates a mixing coefficient with respect to the target component for the subject based on the measurement data and the observation data of the subject; and a target component amount calculation unit that calculates the content of the target component based on a constant of a regression equation indicating a relationship between a content and a mixing coefficient corresponding to the target component, which is prepared in advance, and the mixing coefficient calculated by the mixing coefficient calculation unit. The mixing coefficient calculation unit executes a pre-processing method, which is selected by a pre-processing method selection unit of a calibration curve creation apparatus that calculates the independent component, as first pre-processing including processing for correcting the observation data and second pre-processing including whitening, in this order.
- According to the target component gauging apparatus, the content of the target component in the subject can be accurately calculated just by acquiring a piece of observation data regarding the subject.
- This application example is directed to the target component gauging apparatus according to Application Example 20, wherein the data-for-measurement acquisition unit acquires an independent component, which corresponds to the target component and is calculated in advance, as the measurement data, and the mixing coefficient calculation unit calculates an inner product of the independent component and the observation data of the subject and sets an value of the inner product as the mixing coefficient.
- According to the target component gauging apparatus, a mixing coefficient highly correlated with the target component of the subject can be accurately and easily calculated.
- This application example is directed to the target component gauging apparatus according to Application Example 20, wherein the data-for-measurement acquisition unit acquires, as the data for measurement, a plurality of independent components when separating observation data of a plurality of samples into a plurality of independent components, and the mixing coefficient estimation unit calculates an estimated mixing matrix for the subject based on the observation data of the subject and the plurality of independent components, and extracts a mixing coefficient corresponding to the target component from the calculated estimated mixing matrix.
- According to the target component gauging apparatus, a mixing coefficient highly correlated with the target component of the subject can be accurately calculated.
- In addition, the invention can be realized in various forms other than those described above. For example, the invention can also be realized in a form as a target component gauging apparatus that stores the regression line calculated by the calibration curve creation method in a memory, a form as a computer program to realize as a function the configuration of each unit included in the target component gauging apparatus, and a storage medium (non-transitory storage medium) on which the computer program or the computer program is recorded.
- The invention will be described with reference to the accompanying drawings, wherein like numbers reference like elements.
-
Fig. 1 is a flowchart showing a calibration curve creation method as one embodiment. -
Fig. 2 is a graph showing the relationship between the wavelength of light and the spectral reflectance for green vegetables having different freshness. -
Fig. 3A is an explanatory diagram showing a personal computer and its peripheral devices that are used insteps -
Fig. 3B is a functional block diagram of an apparatus used insteps -
Fig. 3C is a functional block diagram showing an example of the internal configuration of an independent component matrix calculation section. -
Fig. 4 is an explanatory diagram showing an example of the combination of pre-processing that can be selected. -
Fig. 5 is an explanatory diagram schematically showing a measured data set stored in a hard disk drive. -
Fig. 6 is a flowchart showing the mixing coefficient estimation process executed by a CPU. -
Fig. 7 is an explanatory diagram for explaining an estimated mixing matrix. -
Fig. 8 is an explanatory diagram showing an example of a scatter plot with high correlation. -
Fig. 9 is an explanatory diagram showing an example of a graph of a scatter plot with low correlation. -
Fig. 10 is a flowchart showing the regression equation calculation process executed by the CPU of the computer. -
Fig. 11 is a functional block diagram of an apparatus used when measuring a target component. -
Fig. 12 is a flowchart showing the target component measuring process executed by the CPU of the computer. -
Fig. 13 is an explanatory diagram showing the measurement accuracy due to differences in pre-processing. - Hereinafter, embodiments of the invention will be described in the following order.
- A. Calibration curve creation method
- B. Target component measuring method
- C. Various algorithms and influences on the measurement accuracy
- D. Modification examples
- In the present embodiment, the following abbreviations are used.
- ICA: independent component analysis
- SNV: standard normal variate transformation
- PNS: projection on null space
- PCA: principal component analysis
- FA: factor analysis
- Hereinafter, embodiments of the invention will be described. An embodiment is related to a method of creating the calibration curve for deriving the chlorophyll content in green vegetables from the spectrum of the spectral reflectance of the green vegetables as observation data. The green vegetables are spinach, Chinese cabbage, and a green pepper, for example.
-
Fig. 1 is a flowchart showing a calibration curve creation method as an embodiment. As shown inFig. 1 , this calibration curve creation method includes seven steps ofsteps 1 to 7. Thesteps 1 to 7 are performed in this order. Thesteps 1 to 7 will be described in order. - The
step 1 is a preparatory step, and is performed by the operator. The operator prepares a plurality of green vegetables (for example, spinach) of the same type, which have different freshness, as samples. In the present embodiment, n (n is an integer of 2 or more) samples are used. - The
step 2 is a spectrum measurement step, and is performed by the operator using a spectrometer. The operator measures the spectrum of the spectral reflectance for each sample by imaging each of the plurality of samples prepared instep 1 using the spectrometer. The spectrometer is a known instrument that measures a spectrum by making light from a measured object be transmitted through a spectroscope and receiving the spectrum output from the spectroscope on the imaging surface of an imaging device. The relationship expressed as in the following Expression (1) is satisfied between the spectrum of the spectral reflectance and the spectrum of absorbance.
- The spectrum of the measured spectral reflectance is converted into the absorbance spectrum using Expression (1) . Conversion into the absorbance spectrum is performed because a linear combination needs to be established in the mixed signal analyzed in the independent component analysis, which will be described later, and the linear combination is established for the absorbance from the Lambert-Beer's law. Therefore, in
step 2, it is also possible to measure the absorbance spectrum instead of the spectral reflectance spectrum. As a measurement result, data of absorbance distribution showing the characteristics with respect to the wavelength of the measured object is output. The data of absorbance distribution is also referred to as spectral data. - Specifically, in
step 2, the operator images a predetermined portion for each sample, and measures the spectrum of the predetermined portion. The predetermined portion may be any portion in each sample, but a portion having freshness that is not greatly different from that of the entire sample is preferable. For example, when the freshness of a certain portion in a sample is extremely low, a portion excluding the portion with low freshness is set as a predetermined portion to be measured. -
Fig. 2 is a graph showing the relationship between the wavelength of light and the spectral reflectance for green vegetables having different freshness. As shown inFig. 2 , the spectrum waveforms of fresh vegetable, slightly shriveled vegetable, and shriveled vegetable are different. In the case of the fresh vegetable or the slightly shriveled vegetable, the reflectance decreases abruptly in a wavelength range equal to or less than about 700 nm. This is because light absorption by chlorophyll occurs at a wavelength of 700 nm or less. On the other hand, in the case of the shriveled vegetable, the reflectance rises greatly in a wavelength range of 700 nm or less because chlorophyll has decreased. Thus, since a spectrum waveform changes with the freshness of green vegetables, the spectrum for each sample is measured instep 2. - In addition, instead of measuring the spectral reflectance spectrum or the absorbance spectrum using a spectroscope, it is possible to estimate these spectra from other measured values. For example, it is also possible to measure a sample with a multi-band camera and estimate the spectral reflectance or the absorbance spectrum from the obtained multi-band image. As such an estimation method, for example, a method disclosed in
JP-A-2001-99710 - The
step 3 is a step of measuring the chlorophyll content, and is performed by the operator. The operator measures the chlorophyll content, which is the content of a target component in each sample, by chemically analyzing each of the plurality of samples prepared instep 1. Specifically, a predetermined portion is extracted from each sample, chlorophyll that is a target component is extracted from the predetermined portion, and the chlorophyll content is measured. Although the "predetermined portion" may be any portion of the sample, it is preferable that the "predetermined portion" be the same as the portion in which the spectrum has been measured instep 2. - The
step 4 is a pre-processing selection step, and is performed using a personal computer. -
Fig. 3A is an explanatory diagram showing apersonal computer 100 and its peripheral devices that are used instep 4 andsteps 5 to 7, which will be described later. As shown inFig. 3A , the personal computer (hereinafter, simply referred to as a "computer") 100 is electrically connected to aspectrometer 200 and akeyboard 300. - The
computer 100 is a known apparatus including aCPU 10 that executes various kinds of processes and control when executing a computer program (hereinafter, simply referred to as a "program"), a memory 20 (storage unit) that is a data storage location, ahard disk drive 30 that stores a program or data and information, an input interface (I/F) 50, and an output interface (I/F) 60. -
Fig. 3B is a functional block diagram of an apparatus used insteps 4 to 6. Thisapparatus 400 includes a sample observationdata acquisition unit 410, a sample target componentamount acquisition unit 420, apre-processing selection unit 430, a mixingcoefficient estimation unit 440, a regressionequation calculation unit 450, and analgorithm evaluation unit 460. The mixingcoefficient estimation unit 440 includes an independent componentmatrix calculation section 442, an estimated mixing matrix calculation section 444, and a mixingcoefficient selection section 446. In addition, the sample observationdata acquisition unit 410 and the sample target componentamount acquisition unit 420 are realized by the cooperation of theCPU 10 and the input I/F 50 and thememory 20 shown inFig. 3A , for example. Thepre-processing selection unit 430, the mixingcoefficient estimation unit 440, the independent componentmatrix calculation section 442, the estimated mixing matrix calculation section 444, and the mixingcoefficient selection section 446 are realized by the cooperation of theCPU 10 and thememory 20 shown inFig. 3A , for example. In addition, the regressionequation calculation unit 450 and thealgorithm evaluation unit 460 are realized by the cooperation of theCPU 10 and thememory 20 shown inFig. 3A , for example. In addition, each of these units or sections can be realized by other specific devices or hardware circuits excluding the personal computer shown inFig. 3A . - The
step 4 is a step of selecting the combination of pre-processing, and is performed by a personal computer. - A
first pre-processing section 470 can select processing from variations of standard normal variate transformation (SNV) 472 and projection on null space (PNS) 474 and perform the pre-processing in combination. - The
SNV 472 is a process for obtaining normalized data, in which the average value is 0 and the standard deviation is 1, by subtracting the average value of data to be processed and dividing the result by the standard deviation. - The
PNS 474 is a process for removing a baseline variation included in the data to be processed. In the measurement of the spectrum, a variation between data called a baseline variation, such as an increase or decrease in the average value of data, occurs in the measurement data due to various factors. For this reason, it is preferable to remove the variation factors before performing the independent component analysis. The PNS can be used as pre-processing that can remove any baseline variation. - Assuming that the order of the target baseline variation is zero-order, first-order, and second-order, the PNS can remove the baseline variation of any combination thereof.
- In addition, the PNS is described in Zeng-Ping Chen, Julian Morris, and Elaine Martin, "Extracting Chemical Information from Spectral Data with Multiplicative Light Scattering Effects by Optical Path-Length Estimation and Correction", 2006, for example.
- Although the PNS is a method for removing the variation of the baseline whose influence changes algebraically functionally in the data length direction, it depends on target measurement data which-order algebraic function influence is to be removed. Therefore, there is a plurality of variations in the PNS depending on a method of selecting the baseline to be removed.
- In addition, when performing the
SNV 472 on the spectral data obtained instep 2 ofFig. 1 , there is no need to perform the process by thePNS 474. On the other hand, when performing the process by thePNS 474, it is preferable to perform certain normalization processing (for example, the SNV 472) thereafter. - In addition, as the first pre-processing, it is possible to perform processing other than the SNV or the PNS. In the first pre-processing, it is preferable to perform certain normalization processing, but the normalization processing may be omitted. The
first pre-processing section 470 is also referred to as a "correction processing section" hereinbelow. Details of these twoprocesses - A
second pre-processing section 480 can perform pre-processing using either a principal component analysis (PCA) 482 or a factor analysis (FA) 484. In addition, as the second pre-processing, it is possible to use processing other than the PCA or the FA. Thesecond pre-processing section 480 is also referred to as a "whitening processing section" hereinbelow. In a general ICA method, dimensional compression of data to be processed and decorrelation are performed as the second pre-processing. Since a transformation matrix to be calculated by the ICA is limited to an orthogonal transformation matrix by the second pre-processing, it is possible to reduce the amount of calculation in the ICA. Such second pre-processing is called "whitening", and the PCA is used in many cases. In the PCA, however, when random noise is included in the data to be processed, an erroneous result may be obtained due to the influence. Therefore, in order to reduce the influence of random noise, it is preferable to perform the whitening using the FA, which has robustness against noise, instead of the PCA. Thesecond pre-processing section 480 shown inFig. 3C can select either the PCA or the FA to perform the whitening. Details of these twoprocesses 482 and 484 will be further described later. In addition, the whitening processing may be omitted. - As the pre-processing, it is preferable to select an appropriate combination of processes from the above processes according to the characteristics of observation data and perform the selected combination of processes. In order to determine which combination of processes is appropriate, possible combinations of pre-processing are evaluated, and the most accurate combination is selected as the pre-processing. In order to find a combination of pre-processing that is optimal for the target sample observation data, the regression equation of the calibration curve is calculated for each combination, and the accuracy is evaluated.
- When the SNV and the PNS are used in the first pre-processing and the PCA and the FA are used in the second pre-processing, examples of the combination of pre-processing shown in
Fig. 4 can be considered. - In
step 4, these combinations of pre-processing are selected sequentially from the start, and are executed for the observation data. For the pre-processed observation data, the regression equation of the calibration curve is obtained throughsteps step 7. These steps are repeated to evaluate the accuracy for all combinations of pre-processing and select an optimal combination of pre-processing. - Although the result of pre-processing is evaluated to select pre-processing in the present embodiment, other methods may be used as a method of selecting pre-processing. The operator may select pre-processing from the list of pre-processing.
- The
step 5 is a step of estimating a mixing coefficient, and is performed using a personal computer. -
Fig. 3C is a functional block diagram showing an example of the internal configuration of the independent componentmatrix calculation section 442. The independent componentmatrix calculation section 442 includes thefirst pre-processing section 470, thesecond pre-processing section 480, and an independent componentanalysis processing section 490. A plurality of pre-processing methods are prepared for thefirst pre-processing section 470 and thesecond pre-processing section 480. In actual processing, some of the plurality of pre-processing methods are selected and are performed in combination. The threeprocessing sections - The
spectrometer 200 shown inFig. 3A is used instep 2. Thecomputer 100 acquires the absorbance spectrum obtained from the spectral distribution measured by thespectrometer 200 instep 2, as spectral data, through the input I/F 50 (corresponding to the sample observationdata acquisition unit 410 shown inFig. 3B ). In addition, thecomputer 100 acquires the chlorophyll content measured instep 3 through the input I/F 50 in response to the operation of thekeyboard 300 by the operator (corresponding to the sample target componentamount acquisition unit 420 shown inFig. 3B ). In addition, the chlorophyll content measured instep 3 may be input to thecomputer 100 as a mass of chlorophyll per unit mass (for example, per 100 g) of a predetermined portion in which chlorophyll has been measured. Alternatively, the chlorophyll content may be input as an absolute value of the mass. - As a result of the acquisition of the spectral data and the chlorophyll content described above, a data set including the spectral data and the chlorophyll content (hereinafter, referred to as a "measured data set") DS1 is stored in the
hard disk drive 30 of thecomputer 100. -
Fig. 5 is an explanatory diagram schematically showing the measured data set DS1 stored in thehard disk drive 30. As shown inFig. 5 , the measured data set DS1 is a data structure including sample numbers B1, B2, ..., Bn for identifying a plurality of samples prepared instep 1, chlorophyll content C1, C2, ..., Cn of each sample, and spectral data X1, X2, ..., Xn of each sample. In the measured data set DS1, the chlorophyll content C1, C2, ..., Cn and the spectral data X1, X2, ..., Xn are matched with the sample numbers B1, B2, ..., Bn so that the corresponding sample thereof can be seen. - The
CPU 10 loads a predetermined program stored in thehard disk drive 30 to thememory 20 and executes the program to perform a process for estimating the mixing coefficient that is the operation ofstep 4. The predetermined program can also be downloaded from the outside using a network, such as the Internet. Instep 4, theCPU 10 functions as the mixingcoefficient estimation unit 440 shown inFig. 3B . -
Fig. 6 is a flowchart showing the mixing coefficient estimation process executed by theCPU 10. When the process starts, theCPU 10 performs independent component analysis first (step S110). - The independent component analysis (ICA) is one of the multi-dimensional signal analysis methods, and is a technique for observing a mixed signal, in which independent signals overlap each other, in some different conditions and separating the original independent signals based on the result. By using the independent component analysis, the spectrum as an independent component can be estimated from the spectral data (observation data) obtained in
step 2 by regarding the spectral data obtained instep 2 as mixed data of "m" (unknown) independent components including the spectrum due to chlorophyll. - In the present embodiment, the independent component analysis is performed when the three processing
sections Fig. 3C perform their processes in this order. - Subsequent to the first pre-processing of the
first pre-processing section 470 and the second pre-processing of thesecond pre-processing section 480, the independent component analysis processing of the independent component analysis processing section (ICA processing section) 490 is performed. - Although a plurality of methods are prepared for the first pre-processing and the second pre-processing, it depends on target measurement data which pre-processing is appropriate. Therefore, each process in each combination of pre-processing prepared is performed for evaluation, and pre-processing determined to have the highest performance is used eventually.
- The independent component analysis processing section (ICA processing section) 490 estimates the spectrum as an independent component by performing the ICA on the spectral data subjected to the first pre-processing and the second pre-processing. Generally, in the ICA, a high-order statistic indicating the independence of separated pieces of data is used as an indicator for the separation of independent components (independence indicator). For example, kurtosis is a typical independence indicator. In addition to kurtosis, it is also possible to use indicators, such as β divergence, as independence indicators of ICA.
- Next, the typical processing of independent component analysis will be described in detail. It is assumed that the spectrum S (hereinafter, this spectrum may be simply referred to as an "unknown component") of "m" unknown components (source) is given as a vector of the following Expression (2) and "n" spectral data X obtained in
step 2 is given as a vector of the following Expression (3). Each element (S1, S2, ..., Sm) included in Expression (2) is a vector (spectrum). That is, for example, an element S1 is expressed as in Expression (4). Elements (X1, X2, ..., Xn) included in Expression (3) are also vectors. For example, the element X1 is expressed as in Expression (5). Subscript l is the number of wavelength ranges where the spectrum has been measured. In addition, the number of elements m of the spectrum S of unknown components is an integer of 1 or more, and is determined experimentally or empirically in advance according to the type (here, spinach) of sample.


- Each unknown component is assumed to be statistically independent. The relationship of the following Expression (6) is satisfied between the unknown component S and the spectra data X.

- A in Expression (6) is a mixing matrix, and can be expressed as in the following Expression (7). Although the letter "A" needs to be expressed in bold as shown in Expression (7), the letter "A" is expressed in a normal letter herein from the limitation of letters used in the specification. Hereinafter, other bold letters representing the matrix are also similarly expressed in normal letters.

- The mixing coefficient aij included in the mixing matrix A indicates the degree of contribution of the unknown component Sj (j = 1 to m) to the spectral data Xi (i = 1 to n) that is observation data.
- When the mixing matrix A is known, the least square solution of the unknown component S can be easily calculated as A+·X by using a pseudo- inverse matrix A+ of A. In the present embodiment, however, since the mixing matrix A is unknown, the unknown component S and the mixing matrix A should be estimated only from the observation data X. That is, as shown in the following Expression (8), a matrix showing the spectrum as an independent component (hereinafter, referred to as an "independent component matrix") Y is calculated only from the observation data X using the separation matrix W (m x n). As an algorithm for calculating the separation matrix W in the following Expression (8), it is possible to adopt various algorithms, such as Infomax, Fast Independent Component Analysis (FastICA), and Joint Approximate Diagonalization of Eigenmatrices (JADE).

- The independent component matrix Y corresponds to the estimate of the unknown component S. Therefore, the following Expression (9) can be obtained, and the following Expression (10) can be obtained by transforming Expression (9).


- The estimated mixing matrix AA obtained by Expression (10) (written in this manner from the limitation of letters used in the specification, but means a signed letter on the left side of Expression (10) in practice. The same for the other letters) can be expressed as in the following Expression (11).

- In step S110 of
Fig. 6 , theCPU 10 performs up to the process for calculating the separation matrix W described above. Specifically, the separation matrix W is calculated using one of the algorithms, such as Infomax, FastICA, and JADE described above, based on the input of the spectral data X of each sample obtained instep 2 and stored in advance in thehard disk drive 30. In addition, as shown inFig. 3C described above, it is preferable to perform the normalization processing of thefirst pre-processing section 470 and the whitening processing of thesecond pre-processing section 480 as pre-processing of independent component analysis. - After the execution of step S110, the
CPU 10 performs processing for calculating the independent component matrix Y based on the separation matrix W and the spectral data X of each sample, which is obtained instep 2 and is stored in advance in the hard disk drive 30 (step S120). In this calculation processing, calculation is performed according to Expression (8) described above. In the processing of steps S110 and S120, theCPU 10 functions as the independent componentmatrix calculation section 442 shown inFig. 3B . - Then, the
CPU 10 performs processing for calculating the estimated mixing matrix AA based on the spectral data X of each sample stored in advance in thehard disk drive 30 and the independent component matrix Y calculated in step S120 (step S130). In this calculation processing, calculation is performed according to Expression (10) described above. -
Fig. 7 is an explanatory diagram for explaining the estimated mixing matrix AA. As shown inFig. 7 , table TB has sample numbers B1, B2, ..., Bn in a vertical direction and elements of the independent component matrix Y (hereinafter, referred to as "independent component elements") Y1, Y2, ..., Ym in a horizontal direction. The element in the table TB determined by the sample number Bi (i = 1 to n) and the independent component element Yj (j = 1 to m) is the same as the coefficient Λaij (refer to Expression (11)) included in the estimated mixing matrix AA. Also from the table TB, it can be seen that the coefficient Λaij included in the estimated mixing matrix AA indicates the ratio of the independent component elements Y1, Y2, ..., Ym in each sample. A target component rank k illustrated inFig. 7 will be described later. In the processing of step S130, theCPU 10 functions as the estimated mixing matrix calculation section 444 shown inFig. 3B . - The estimated mixing matrix AA is obtained by the processing up to step S130. That is, the coefficient (estimated mixing coefficient) Λaij included in the estimated mixing matrix AA is obtained. Then, the process proceeds to step S140.
- In step S140,
CPU 10 calculates a correlation (degree of similarity) between the chlorophyll content C1, C2, ..., Cn measured instep 3 and components (hereinafter, referred to as a vector Λα) of each column included in the estimated mixing matrix AA calculated in step S130. Specifically, a correlation between the chlorophyll content C (C1, C2, ..., Cn) and the vector Λα1 (Λa11, Λa21, ..., Λan1) of the first column is calculated, and then a correlation between the chlorophyll content C (C1, C2, ..., Cn) and the vector Λα2 (Λa12, Λa22, ..., Λan2) of the second column is calculated. In this manner, a correlation between the chlorophyll content C and the vector of each column is sequentially calculated, and a correlation between the chlorophyll content C (C1, C2, ..., Cn) and the vector Λαm (Λa1m, Λa2m, ..., Λanm) of the m-th column is finally calculated. - Such a correlation can be calculated by using a correlation coefficient R according to the following Expression (12). The correlation coefficient R is called a Pearson's product-moment correlation coefficient.

α̂ k are the chlorophyll content and the average value of the vector α̂k , respectively -
Fig. 8 is a graph of the scatter plot. In the scatter plot shown inFig. 8 , the vertical axis indicates the chlorophyll content C, and the horizontal axis indicates the coefficient (hereinafter, referred to as an "estimated mixing coefficient") Λa of the estimated mixing matrix AA. The scatter plot shown inFig. 8 is obtained by plotted points determined from the elements C1, C2, ..., Cn of the chlorophyll content C and estimated mixing coefficients Λa1j, Λa2j, ..., Λanj (j = 1 to m) included in the vector Λα of the estimated mixing matrix AA in the vertical direction. In the example shown inFig. 8 , plotted points are gathered relatively near the straight line L. In this case, the correlation between the chlorophyll content C and the estimated mixing coefficient Λa is high. In contrast, if the correlation between the chlorophyll content C and the estimated mixing coefficient Aa is low, as shown inFig. 9 , plotted points are not located linearly but spread. That is, the higher the correlation between the chlorophyll content C and the estimated mixing coefficient Λa, the higher the tendency in which plotted points are gathered linearly. The correlation coefficient R shown in Expression (12) indicates the degree of tendency in which plotted points are gathered linearly. - As a result of step S140 of
Fig. 6 , a correlation coefficient Rj (j = 1, 2, ..., m) for each independent component (independent component spectrum) Yj is obtained. Then, theCPU 10 specifies a correlation coefficient with the highest correlation, that is, a correlation coefficient with a value close to 1, from the correlation coefficient Rj obtained in step S140. In the scatter plot described above, the correlation coefficient Rj at which plotted points are gathered most linearly is specified. Then, a column vector Λα when the highest correlation coefficient R is obtained is selected from the estimated mixing matrix AA (step S150). - The selection in step S150 means selecting a column from a plurality of columns in the table TB shown in
Fig. 7 . Elements of the selected column are mixing coefficients of the independent component corresponding to chlorophyll that is a target component. As a result of the selection, a vector Λαk (Λa1k, Λa2k, ..., Λank) is obtained. Here, k is assumed to be an integer of 1 to m. In addition, the value of k is temporarily stored in thememory 20 as a target component rank indicating which number of independent component corresponds to the target component. Λa1k, Λa2k, ... , Λank included in the vector Λαk correspond to the "mixing coefficient corresponding to the target component" in Application Example 1. In addition, in the example shown inFig. 7 , the target component rank k = 2 indicates a column vector Λα2 = (Λa12, Λa22, ..., Λan2) corresponding to the independent component Y2. In this specification, the term "rank" is used to mean a "value indicating the position within the matrix". In processing of step S140 and S150, theCPU 10 functions as the mixingcoefficient selection section 446 shown inFig. 3B . After the execution of step S150, the CPU ends the process of calculating the mixing coefficient. As a result,step 5 is completed, and the process proceeds to step 6. - The
step 6 is a step of calculating the regression equation, and is performed using thecomputer 100 in the same manner as when performingstep 5. Instep 6, thecomputer 100 performs processing for calculating the regression equation of the calibration curve. In addition, data up to step 5 may be transferred to another computer to performstep 6. -
Fig. 10 is a flowchart showing the regression equation calculation process executed by theCPU 10 of thecomputer 100. When the processing starts,CPU 10 calculates a regression equation F first based on the chlorophyll content C (C1, C2, ... , Cn) measured instep 3 and the vector Λαk (Λa1k, Λa2k, ..., Λank) selected in step S150 (step S210). When the scatter plot shown inFig. 8 has a highest correlation, the straight line L inFig. 8 corresponds to the regression equation F. Since a method of calculating the regression equation is known, detailed explanation thereof will not be given. For example, the straight line L is calculated using the least square method so that the distance (residual) from the straight line L to each plotted point becomes close to 0. The regression equation F can be expressed as in the following Expression (13) . In step S210, constants u and v in Expression (13) are calculated.
- After the execution of step S210, the
CPU 10 stores a combination method of the constants u and v of the regression equation F calculated in step S210, the target component rank k (Fig. 7 ) obtained in step S150, the independent component matrix Y calculated in step S120 of the mixing coefficient calculation process (Fig. 6 ), and the pre-processing selected in the pre-processing selection in thehard disk drive 30 as a data set for measurement DS2 (step S220). Then, theCPU 10 proceeds to "return" to temporarily end the process of calculating the regression equation. As a result, it is possible to obtain the regression line of the calibration curve, and the calibration curve creation method shown inFig. 1 also ends. In the processing of steps S210 and S220, theCPU 10 functions as the regressionequation calculation unit 450 shown inFig. 3B . - The
step 7 is an algorithm evaluation step, and is performed using thecomputer 100 in the same manner as when performingsteps - One of the combinations of pre-processing is selected in
step 4, mixing coefficient calculation processing is performed, and the regression line of the calibration curve is calculated. The accuracy of the calibration curve in this case is evaluated, it is evaluated how much the combination of pre-processing selected instep 4 is effective for the observation data, and the combination of pre-processing selected instep 4 is compared with other combinations of pre-processing. A correlation coefficient between the mixing coefficient and the true value can be used for the evaluation. A result when calculating the measurement accuracy SEP by measuring the sample data using the calibration curve can be used. - Based on the evaluation result, a combination of pre-processing with the highest accuracy among the combinations of pre-processing evaluated up to now is determined as a candidate of pre-processing. When there is a combination of pre-processing that has not been evaluated yet, the process returns to step 4 to evaluate the next pre-processing. When the evaluation of all pre-processing ends, the current pre-processing candidate is adopted as pre-processing for the target observation data.
- Next, the target component measuring method will be described. A subject is assumed to contain the same components as a sample used when creating the calibration curve. Specifically, the target component measuring method is performed using a computer. In addition, the computer herein may be the
computer 100 used when creating the calibration curve, or may be a different computer. -
Fig. 11 is a functional block diagram of an apparatus used when measuring a target component. Anapparatus 500 includes a subject observationdata acquisition unit 510, a data-for-measurement acquisition unit 520, a mixingcoefficient calculation unit 530, and a target componentamount calculation unit 540. The mixingcoefficient calculation unit 530 includes a pre-processing section 532. This pre-processing section 532 has functions of both thefirst pre-processing section 470 andsecond pre-processing section 480 shown inFig. 3C , and performs pre-processing selected in the calibration curve creation. The subject observationdata acquisition unit 510 is realized by the cooperation of theCPU 10 and the input I/F 50 and thememory 20 shown inFig. 3A , for example. The data-for-measurement acquisition unit 520 is realized by the cooperation of theCPU 10 and thememory 20 and thehard disk drive 30 shown inFig. 3A , for example. The mixingcoefficient calculation unit 530 and the target componentamount calculation unit 540 are realized by the cooperation of theCPU 10 and thememory 20 shown inFig. 3A , for example. The computer to realize each function shown inFig. 11 is assumed to be thecomputer 100 used when creating the calibration curve, and the data set for measurement DS2 described above is stored in a storage unit, such as a hard disk drive. -
Fig. 12 is a flowchart showing the target component measuring process executed by theCPU 10 of thecomputer 100. The target component measuring process is realized when theCPU 10 loads a predetermined program stored in thehard disk drive 30 to thememory 20 and executes the program. As shown inFig. 12 , when the process starts, theCPU 10 first performs processing for imaging a green vegetable, which is a subject, using a spectrometer (step S310). The imaging in step S310 can be performed as instep 2. As a result, the absorbance spectrum Xp of the subject is obtained. The spectrometer used in the measurement process is preferably the same model as the spectrometer that is used in the creation of the calibration curve in order to suppress error. In order to further suppress the error, it is more preferable that the spectrometer used in the measurement process be the same apparatus as the spectrometer used in the creation of the calibration curve. In addition, as instep 2 ofFig. 1 , instead of measuring the spectral reflectance spectrum or the absorbance spectrum using a spectroscope, it is possible to estimate these spectra from other measured values. The spectrum Xp of the absorbance of the subject obtained when imaging a subject once is expressed as a vector as in the following Expression (14).
- In the processing of step S310, the
CPU 10 functions as the subject observationdata acquisition unit 510 shown inFig. 11 . Then, theCPU 10 acquires the data set for measurement DS2 from thehard disk drive 30, and stores the data set for measurement DS2 in the memory 20 (step S315). - In the processing of step S315, the
CPU 10 functions as the data-for-measurement acquisition unit 520 shown inFig. 11 . - After the execution of step S315, pre-processing is performed on the absorbance spectrum Xp of the subj ect obtained in step S310 (step S325). As this pre-processing, the same processing as the pre-processing (that is, the normalization processing of the
first pre-processing section 470 and the whitening processing of the second pre-processing section 480) used instep 4 ofFig. 1 (more specifically, step S110 ofFig. 6 ) when creating the calibration curve is performed based on the combination of pre-processing included in the data set for measurement. - Then, the
CPU 10 performs processing for calculating the estimated mixing matrix AA regarding the subject based on the independent component matrix Y included in the data set for measurement DS2 and the pre-processed spectrum obtained in step S325 (step S335). Specifically, arithmetic processing according to Expression (10) described above is performed. The estimated mixing matrix AA is obtained by calculating the inverse matrix (pseudo-inverse matrix) Y+ of the independent component matrix Y included in the data set for measurement DS2 and multiplying the pre-processed spectrum obtained in step S325 by the pseudo-inverse matrix Y+. - As shown in the following Expression (15), the estimated mixing matrix AA in the measurement process is a row vector ("1 x m" matrix) configured to include mixing coefficients corresponding to the respective independent components. After the execution of step S335, the
CPU 10 reads the target component rank k included in the data set for measurement DS2 from thehard disk drive 30, extracts the mixing coefficient Λαk of the k-th component corresponding to the target component rank k from the estimated mixing matrix ΛA calculated in step S335, and temporarily stores the mixing coefficient Λαk in thememory 20 as a mixing coefficient of chlorophyll that is a target component (step S340). In the processing of steps S325, S335, and S340, theCPU 10 functions as the mixingcoefficient calculation unit 530 shown inFig. 11 .
- Then, the
CPU 10 reads the constants u and v of the regression equation included in the data set for measurement DS2 from thehard disk drive 30, and calculates the content C of chlorophyll by substituting the constants u and v and the mixing coefficient Λαk of chlorophyll as a target component, which is obtained in step S340, into the right side of Expression (13) (step S350). The content C is calculated as a mass of chlorophyll per unit mass (for example, per 100 g) of the subject. In the processing of step S350, theCPU 10 functions as the target componentamount calculation unit 540 shown inFig. 11 . Then, the process proceeds to "return" to end the target component measuring process. - In the present embodiment, the content C (mass per unit mass) calculated in step S350 is used as the content of chlorophyll in the subject. However, instead of this, the content C calculated in step S350 may be corrected using the normalization coefficient used in the normalization of step S325 and the corrected value may be used as the content to be calculated. Specifically, the absolute value (gram) of the content may be calculated by multiplying the content C by the standard deviation. According to this configuration, it is possible to calculate the content C more accurately depending on the type of target component.
- According to the calibration curve creation method of the embodiment configured as described above, the chlorophyll content can be accurately calculated from one spectrum that is an actual measurement value of the green vegetable as a subject.
- Hereinafter, various algorithms used in the
first pre-processing section 470, thesecond pre-processing section 480, and the independent componentanalysis processing section 490 shown inFig. 3C and the influences on the measurement accuracy will be described in order. - The difference in accuracy by the combination of pre-processing is shown using actual observation data as an example. Food data is used as a target.
- As the first pre-processing performed by the
first pre-processing section 470, standard normal variate transformation (SNV) and projection on null space (PNS) can be used. - The SNV is given as the following Expression (16).

- Here, z is data after processing, x is data to be processed (absorbance spectrum in the present embodiment), Xave is the average value of the data to be processed x, and σ is a standard deviation of the data to be processed x. As a result of standard normal variate transformation, the normalized data z whose average value is 0 and standard deviation is 1 is obtained.
- By performing the PNS, it is possible to reduce the baseline variation included in the data to be processed. In the measurement of data to be processed (absorbance spectrum in the present embodiment), a variation between data called a baseline variation, such as an increase or decrease in the average value of data, occurs in the measurement data due to various factors. For this reason, it is preferable to remove the variation factors before performing the independent component analysis (ICA). The PNS can be used as pre-processing that can reduce any baseline variation of the data to be processed. In particular, for the measurement data of the absorbed light spectrum or the reflected light spectrum including an infrared region, the advantage of applying the PNS is large since such a baseline variation occurs frequently. The principle of removing the baseline variation, which is included in data obtained by measurement (simply referred to as "measurement data x"), by the PNS will be described below. In addition, as a typical example, a case will be described in which the measurement data is an absorbed light spectrum or a reflected light spectrum including an infrared region will be described. However, the PNS can also be similarly applied for other types of measurement data (for example, sound data) .
- Generally, in an ideal system, the measurement data x (data to be processed x) is expressed as in the following Expression (17) using "m" (m is an integer of 2 or more) independent components si (i = 1 to m) and each mixture ratio Ci.

- Here, A is a matrix (mixing matrix) formed with the mixture ratio ci.
- Also in the independent component analysis (ICA), processing is performed on the assumption that this model is used. However, there are various variation factors (condition of a sample, changes in the measurement environment, and the like) in actual measurement data. Therefore, as a model that takes these variation factors into consideration, a model that expresses the measurement data x as in the following Expression (18) can be considered.

- Here, b is a parameter indicating a variation in the amplitude direction of the spectrum, a, d, and e are parameters indicating the amount of constant baseline variation E (also referred to as "average value variation"), the amount of variation λ that linearly depends on the wavelength, and the amount of variation λ2 that depends on the square of the wavelength, respectively, and ε is other variation components. In addition, the constant baseline variation E is given as E = {1, 1, 1, ..., 1} T, and is a constant vector whose data length is equal to the data length (the number of segments of the wavelength range) of the measurement data x. The variations λ and λ2 depending on the wavelength are given as λ = {λ1, λ2, ..., λN} T and λ2 = {λ12, λ22, ..., λN2}T, respectively. Here, N is the data length of the measurement data x. In addition, as a variation depending on the wavelength, third-order or higher variations can also be taken into consideration. In general, it is possible to take into consideration up to the g-th order variation λg (g is an integer of 2 or more).
- In the PNS, data in which the baseline variation components E, λ, λ2, ..., λg (g is an integer of 2 or more) have been reduced can be obtained by considering the space including the baseline variation components E, λ, λ2, ... , λg and projecting the measurement distance x to the space (null space) that does not include these variation components. As specific calculation, the data z after processing of the PNS is calculated by the following Expression (19).

- Here, P+ is a pseudo-inverse matrix of P. ki is a result obtained by projecting the component si of Expression (18) to the null space not including that does not include variation components. In addition, c* is a result obtained by projecting the variation component ε of Expression (18) to the null space.
- In addition, by performing normalization (for example, the SNV) after processing of the PNS, it is also possible to eliminate the influence of the variation b in the amplitude direction of the spectrum in Expression (18).
- An independent component obtained by performing the ICA on the data pre-processed by the PNS is an estimate of the component ki of Expression (19), which is different from the true component si. However, since the mixture ratio ci is not changed from the value in original Expression (18), there is no influence on the measurement process (
Fig. 12 ) that uses the mixture ratio ci. Thus, since the true component si cannot be obtained by the ICA if the PNS is performed as pre-processing of the ICA, the idea of applying the PNS as pre-processing of the ICA is not possible normally. In the present embodiment, however, there is no influence on the measurement process even if the PNS is performed as pre-processing of the ICA. If the PNS is performed as the pre-processing, it is possible to perform measurement more accurately. - The order of the variation to be removed by the PNS can be removed in any combination. Since these variations are error factors in the ICA or the measurement, removing the variations in advance is desirable in many cases. However, not only the variation components but also information required for the measurement may be removed together. Depending on the characteristics of the observation data, it may be better to leave the required information even if there are variations in order to improve the measurement accuracy. Therefore, as the processing of the PNS, when zero-order, first-order, and second-order variations are considered, it is possible to remove variation component combinations, such as [zero-order, first-order, second-order], [zero-order, first-order], [zero-order, second-order], and [zero-order], for example.
- In addition, details of the PNS is described in Zeng-Ping Chen, Julian Morris, and Elaine Martin, "Extracting Chemical Information from Spectral Data with Multiplicative Light Scattering Effects by Optical Path-Length Estimation and Correction", 2006, for example.
- As second pre-processing performed by the
second pre-processing section 480, principal component analysis (PCA) and factor analysis (FA) can be used. - In a general ICA method, dimensional compression of data to be processed and decorrelation are performed as pre-processing. Since a transformation matrix to be calculated by the ICA is limited to an orthogonal transformation matrix by this pre-processing, it is possible to reduce the amount of calculation in the ICA. Such pre-processing is called "whitening", and the PCA is used in many cases. The whitening using the PCA is described in detail in
Chapter 6 of Aapo Hyvarinen, Juha Karhumen, Erkki Oja, "Independent Comonent Analysis", 2001, John Wiley & Sons, Inc. - In the PCA, however, when random noise is included in the data to be processed, an erroneous result may be obtained due to the influence of the random noise. Then, in order to reduce the influence of random noise, it is preferable to perform the whitening using the factor analysis (FA), which has robustness against noise, instead of the PCA. Hereinafter, the principle of the whitening using the FA will be described.
- As described above, generally, in the ICA, a linear mixture model (above Expression (17)) that expresses the data to be processed x as a linear sum of the component si is assumed, and the mixture ratio ci and the component si are calculated. However, random noise as well as the component si is added to actual data in many cases. Therefore, as a model that takes random noise into consideration, a model that expresses the measurement data x as in the following Expression (20) can be considered.

- Here, ρ is random noise.
- In addition, it is possible to obtain an estimation of the mixing matrix A and the independent component si by performing whitening considering the noise mixture model and then performing the ICA.
- In the FA of the present embodiment, it is assumed that the independent component si and the random noise p follow the normal distribution N(0, Im) and N(0, E), respectively. In addition, as is generally known, the first parameter x1 of the normal distribution N(x1, x2) indicates an expected value, and the second parameter x2 indicates a standard deviation. In this case, since the data to be processed x is a linear sum of the variable according to the normal distribution, the data to be processed x also follows the normal distribution. Here, assuming that the covariance matrix of the data to be processed x is V[x], the normal distribution that the data to be processed x follow can be expressed as N(0, V[x]). In this case, the likelihood function regarding the covariance matrix V[x] of the data to be processed x can be calculated by the following procedure.
- First, assuming that the independent components si are perpendicular to each other, the covariance matrix V[x] of the data to be processed x is calculated by the following Expression (21).

- Here, ∑ is a covariance matrix of the noise p.
- Thus, the covariance matrix V[x] can be expressed by the mixing matrix A and the covariance matrix E of noise. In this case, the logarithmic likelihood function L(A, ∑) is given as the following Expression.

- Here, n is the number of pieces of data x, m is the number of independent components, an operator tr is a trace (sum of diagonal elements) of a matrix, and an operator det is a determinant. In addition, C is a sample covariance matrix obtained by sample calculation from the data x, and is calculated by the following Expression.

- The mixing matrix A and the covariance matrix ∑ of noise can be calculated from the maximum likelihood method using the logarithmic likelihood function L (A, E) of the above Expression (22). As the mixing matrix A, it is possible to obtain a matrix that is hardly influenced by the random noise ρ of the above Expression (20). This is the basic principle of the FA. In addition, as the algorithm of the FA, there are various algorithms using the algorithm other than the maximum likelihood method. Also in the present embodiment, it is possible to use such various kinds of FA.
- Incidentally, the estimate obtained by the FA is just the value of AAT. When the mixing matrix A suitable for this value is determined, it is possible to de-correlate the data while reducing the influence of random noise. However, since the degree of freedom of rotation remains, it is not possible to determine each of the plurality of components si uniquely. On the other hand, the ICA is processing for reducing the degree of freedom of rotation of the plurality of components si so that the plurality of components si are perpendicular to each other. In the present embodiment, therefore, the value of the mixing matrix A calculated by the FA is used as a whitening matrix (matrix after whitening), and the arbitrary property with respect to the left rotation is specified by the ICA. Thus, by performing the ICA after performing the whitening processing robust against noise, it is possible to determine the independent component si perpendicular to each other. In addition, as a result of such processing, it is possible to improve the measurement accuracy regarding the component si by reducing the influence of random noise.
- The FA can be considered to be an extension corresponding to the noise of the PCA. In the FA, as a precondition for this extension, it is assumed that noise is normally distributed. This assumption is reasonable in many cases, and better performance can be expected. However, depending on the characteristics of the observation data, the accuracy may not be stable or may not be improved by the FA from the reason that the noise distribution deviates from the normal distribution, for example. In this case, it is appropriate to perform the known process using the PCA.
- Generally, in the independent component analysis (ICA), a high-order statistic indicating the independence of separated pieces of data is used as an indicator for the separation of independent components (independence indicator). Kurtosis is a typical independence indicator. The ICA using kurtosis as an independence indicator is described in detail in
chapter 8 of Aapo Hyvarinen, Juha Karhumen, Erkki Oja, "Independent Comonent Analysis", 2001, John Wiley & Sons, Inc. -
Fig. 13 summarizes the results of accuracy evaluation when measuring one substance from a sample, in which three substances of sucrose, gelatin, and lard are mixed, for each selectable pre-processing. - The invention is not limited to the above-described embodiment or modification examples thereof, but various modifications may be made within the scope without departing from the subject matter or the spirit of the invention. For example, the following modification examples are also possible.
- In the embodiment described above, the subject observation data acquisition unit 510 (
Fig. 11 ) acquires the independent component matrix Y including an independent component corresponding to the target component by acquiring the data set for measurement DS2 from thehard disk drive 30, and the mixing coefficient calculation unit 530 (Fig. 11 ) calculates the estimated mixing matrix AA for the subj ect based on the independent component matrix Y and the absorbance spectrum of the subject and calculates the mixing coefficient of the target component for the subj ect by extracting the mixing coefficient αk of the k-th column corresponding to the target component rank k from the estimated mixing matrix AA. However, the invention is not limited to this. For example, it is possible to adopt the following configuration in which (i) and (ii) are performed in order. - (i) The data set for measurement DS2 stored in the
hard disk drive 30 is read, and an element (independent component) Yk of the k-th column corresponding to the target component rank k is acquired from the independent component matrix Y included in the data set for measurement DS2. The independent component Yk has the highest correlation to the chlorophyll content, and corresponds to the chlorophyll content. - (ii) Subsequently, an inner product of the extracted independent component Yk and the spectrum Xp (for example, the normalized spectrum obtained in step S320) of the subject that is observation data is calculated, and the inner product value is set as the mixing coefficient αk of the target component. That is, calculation according to the following Expression (24) is performed.

- Here, the observation data is a linear sum of independent components, and it is assumed that the orthogonality of independent components is sufficiently high. Therefore, by calculating the inner product of the independent component matrix of the target component and the spectrum that is observation data, only the values of the independent components remain and all of the other components become 0. As a result, it becomes easy to calculate the mixing coefficient αk of the target component. However, when the orthogonality of independent components are not sufficiently high, it is preferable to calculate the estimated mixing matrix ΛΔ of Expression (15) without using the calculation of Expression (27).
- In the process (i) described above, the
CPU 10 functions as a data-for-measurement acquisition unit. In the process (ii) described above, theCPU 10 functions as a mixing coefficient calculation unit. Instead of the configuration of the above (i), the data-for-measurement acquisition unit may be configured to acquire the independent component Yk from a storage unit, such as thehard disk drive 30 in which the element (independent component) Yk of the k-th column corresponding to the target component rank k in the independent component matrix Y is stored in advance. This is because only independent components corresponding to the target component are necessary and other independent components are not necessary when using the inner product. In this case, the independent component becomes a vector, and it is not necessary to store the target component rank. - In the embodiment and the modification example described above, the chlorophyll content of a subject, which is a green vegetable, is detected. However, instead of the chlorophyll content of the green vegetable, applications to various subjects and target components, such as oleic acid in meat and collagen in the skin. In short, if a sample having the same components as a subject is prepared to create a calibration curve, it is possible to correspond to various subjects and target components. In the embodiment and each modification example described above, a configuration is adopted in which measurement is performed with the absorbance spectrum as observation data. However, even if sound data in which sound emitted from a plurality of sound sources is mixed is used as the observation data instead of the absorbance spectrum, it is possible to measure the magnitude of the sound from the specific sound source with the same configuration. In short, in the case of a signal having a sufficient amount of information to know the statistical properties of the signal source, the invention can be applied to various kinds of observation data.
- In the embodiment and each modification example described above, in the mixing coefficient estimation step, an independent component matrix is calculated, an estimated mixing matrix is calculated, and a mixing coefficient corresponding to the target component is extracted from the estimated mixing matrix. However, this configuration does not necessarily need to be adopted. In short, it is possible to adopt any configuration in which each independent component, which is included in observation data of each sample, when dividing the observation data into a plurality of independent components is estimated and a mixing coefficient corresponding to the target component is calculated for each sample based on each independent component.
- In the calibration curve creation methods of the embodiment and each modification example described above, the content of the target component in each sample is measured. However, instead of this configuration, it is also possible to prepare a sample containing a target component whose content is known and input the content through a keyboard or the like.
- In the embodiment and each modification example described above, the number of elements m of the spectrum S of an unknown component is determined experimentally or empirically in advance. However, the number of elements m of the spectrum S of the unknown component may also be determined according to the information criteria known as Minimum Description Length (MDL) or Akaike Information Criteria (AIC) . When the MDL or the like is used, the number of elements m of the spectrum S of the unknown component can be automatically determined by calculation from the observation data of the sample. In addition, the MDL is described in "Independent component analysis for noisy data - MEG data analysis, 2000", for example.
- In the embodiment and each modification example described above, a subject that is the target of the measurement process has the same components as a sample used when creating the calibration curve. However, when calculating the mixing coefficient using an inner product as in the modification example 1, an unknown component other than the same component as the sample used when creating the calibration curve may be contained in the subject. Since the inner product of independent components is assumed to be 0, the inner product of independent components corresponding to the unknown component can also be considered to be 0. Therefore, the influence of the unknown component can be neglected when calculating the mixing coefficient using an inner product.
- The computer used in the embodiment and each modification can be replaced with a dedicated apparatus instead of a personal computer. For example, the personal computer to realize the target component measuring method can be replaced with a dedicated gauging apparatus.
- In the embodiment described above, the input of the spectrum of the spectral reflectance of a sample or a subject is performed by inputting the spectrum measured by the spectrometer. However, the invention is not limited to this. For example, it is also possible to estimate a spectrum from a plurality of band images having different wavelength bands and input this spectrum. The band images are obtained by imaging a sample or a subject using a multi-band camera including a filter capable of changing the transmission wavelength band.
- In the embodiment and each modification example described above, the function realized by software may also be realized by hardware.
- In addition, elements in the embodiment and each modification example described above, which are not elements mentioned in the appended independent claims, are additional elements, and may be appropriately omitted.
- In the embodiment described above, as a pre-processing selection method, a method of selecting the optimal pre-processing by repeating the selection of pre-processing in
step 4 and the evaluation instep 7 is adopted. However, it is possible to use other methods. For example, the operator may select pre-processing instep 4, andstep 7 may not be performed.
Claims (14)
- A calibration curve creation method of creating a calibration curve, which is used to derive a content of a target component in a subject, from observation data of the subject, comprising:(a) acquiring the observation data for a plurality of samples of the subject;(b) acquiring the content of the target component in each sample;(c) executing pre-processing for the observation data of each sample, a pre-processing method is selected from a plurality of options;(d) estimating a plurality of independent components when separating the pre-processed observation data of each sample into a plurality of independent components and calculating a mixing coefficient corresponding to the target component for each sample based on the plurality of independent components; and(e) calculating a regression equation of the calibration curve based on the content of the target component of each of the plurality of samples and the mixing coefficient of each sample,wherein, in the process (c), the pre-processing includes first pre-processing including processing for correcting the observation data and second pre-processing including whitening, and a plurality of processing methods are prepared as processing methods of each of the first pre-processing and the second pre-processing and the pre-processing method is set by combining one or more of the processing methods of each of the first pre-processing and the second pre-processing,
the process (d) includes:(i) calculating an independent component matrix including the independent component of each sample;(ii) calculating an estimated mixing matrix, which indicates a set of vectors defining a ratio of an independent component element of each independent component in each sample, from the independent component matrix ; and(iii) calculating a correlation between each of the vectors included in the estimated mixing matrix and the content of the target component of each of the plurality of samples and selecting the vector, which is determined to have the highest correlation, as a mixing coefficient corresponding to the target component, andin the process (i), the first pre-processing, the second pre-processing, and independent component analysis processing are excuted in this order using the pre-processing method selected in the process (c). - The calibration curve creation method according to claim 1,
wherein, in the process (c), the processing methods of the first pre-processing include a projection on null space. - The calibration curve creation method according to claim 1 or 2,
wherein, in the process (c), the processing methods of the first pre-processing include centering. - The calibration curve creation method according to any one of the preceding claims,
wherein, in the process (c), the processing methods of the first pre-processing include normalization. - The calibration curve creation method according to any one of the preceding claims,
wherein, in the process (c), the processing methods of the first pre-processing include smoothing processing. - The calibration curve creation method according to any one of the preceding claims ,
wherein, in the process (c), the processing methods of the first pre-processing include differential spectrum processing. - The calibration curve creation method according to any one of the preceding claims,
wherein, in the process (c), the processing methods of the first pre-processing include differential processing. - The calibration curve creation method according to any one of the preceding claims,
wherein, in the process (c), the processing methods of the second pre-processing include a principal component analysis. - The calibration curve creation method according to any one of the preceding claims,
wherein, in the process (c), the processing methods of the second pre-processing include a factor analysis. - A calibration curve creation apparatus that creates a calibration curve, which is used to derive a content of a target component in a subject, from observation data of the subject, comprising:a sample observation data acquisition unit that acquires the observation data for a plurality of samples of the subject;a sample target component amount acquisition unit that acquires the content of the target component in each sample;a pre-processing method selection unit that selects a processing method of a pre-processing of the observation data from a plurality of options, the pre-processing includes first pre-processing including correction processing and second pre-processing including whitening;a mixing coefficient estimation unit that estimates a plurality of independent components when separating the observation data of each sample into a plurality of independent components and calculates a mixing coefficient corresponding to the target component for each sample based on the plurality of independent components; anda regression equation calculation unit that calculates a regression equation of the calibration curve based on the content of the target component of each of the plurality of samples and the mixing coefficient of each sample,wherein a plurality of processing methods are prepared as processing methods of each of the first pre-processing and the second pre-processing, and the pre-processing method selection unit combines one or more of the processing methods of each of the first pre-processing and the second pre-processing to set the pre-processing method having a plurality of options and selects an optimal combination from the set pre-processing method,the mixing coefficient estimation unit includes:an independent component matrix calculation section that calculates an independent component matrix including the independent component of each sample;an estimated mixing matrix calculation section that calculates an estimated mixing matrix, which indicates a set of vectors defining a ratio of an independent component element of each independent component in each sample, from the independent component matrix; anda mixing coefficient selection section that calculates a correlation between each of the vectors included in the estimated mixing matrix and the content of the target component of each of the plurality of samples and selects the vector, which is determined to have the highest correlation, as a mixing coefficient corresponding to the target component, andthe independent component matrix calculation section calculates the independent component matrix by executing the first pre-processing, the second pre-processing, and independent component analysis processing in this order using the pre-processing method selected by the pre-processing method selection unit.
- The calibration curve creation apparatus according to claim 10, further comprising:a storage unit that stores the independent component matrix calculated by the independent component matrix calculation section, a target component rank indicating at which position of the estimated mixing matrix the mixing coefficient selected by the mixing coefficient selection section is present, and a regression equation calculated by the regression equation calculation unit.
- A target component gauging apparatus that calculates a content of a target component in a subject, comprising:a subject observation data acquisition unit that acquires observation data of the subject;a data-for-measurement acquisition unit that acquires data for measurement including an independent component corresponding to the target component;a mixing coefficient calculation unit that calculates a mixing coefficient with respect to the target component for the subject based on the data for measurement and the observation data of the subject; anda target component amount calculation unit that calculates the content of the target component based on a constant of a regression equation indicating a relationship between a content and a mixing coefficient corresponding to the target component, which is prepared in advance, and the mixing coefficient calculated by the mixing coefficient calculation unit,wherein the mixing coefficient calculation unit executes a pre-processing method, which is selected by a pre-processing method selection unit of a calibration curve creation apparatus that calculates the independent component, as first pre-processing including processing for correcting the observation data and second pre-processing including whitening, in this order.
- The target component gauging apparatus according to claim 12,
wherein the data-for-measurement acquisition unit acquires an independent component, which corresponds to the target component and is calculated in advance, as the data for measurement, and
the mixing coefficient calculation unit calculates an inner product of the independent component and the observation data of the subject and sets an value of the inner product as the mixing coefficient. - The target component gauging apparatus according to claim 12 or 13,
wherein the data-for-measurement acquisition unit acquires, as the data for measurement, a plurality of independent components when separating observation data of a plurality of samples into a plurality of independent components, and
a mixing coefficient estimation unit calculates an estimated mixing matrix for the subject based on the observation data of the subject and the plurality of independent components, and extracts a mixing coefficient corresponding to the target component from the calculated estimated mixing matrix.
Applications Claiming Priority (1)
| Application Number | Priority Date | Filing Date | Title |
|---|---|---|---|
| JP2013065763A JP6155746B2 (en) | 2013-03-27 | 2013-03-27 | Calibration curve creation method, calibration curve creation device, and target component calibration device |
Publications (2)
| Publication Number | Publication Date |
|---|---|
| EP2784484A1 true EP2784484A1 (en) | 2014-10-01 |
| EP2784484B1 EP2784484B1 (en) | 2017-09-27 |
Family
ID=50732763
Family Applications (1)
| Application Number | Title | Priority Date | Filing Date |
|---|---|---|---|
| EP14161517.9A Not-in-force EP2784484B1 (en) | 2013-03-27 | 2014-03-25 | Optimized calibration method for determining the content of chlorophyll using pre-processing and independent component analysis |
Country Status (3)
| Country | Link |
|---|---|
| US (1) | US20140297197A1 (en) |
| EP (1) | EP2784484B1 (en) |
| JP (1) | JP6155746B2 (en) |
Cited By (7)
| Publication number | Priority date | Publication date | Assignee | Title |
|---|---|---|---|---|
| CN105467078A (en) * | 2015-11-20 | 2016-04-06 | 山西农业大学 | A senescence characteristic detecting method for wheat flag leaves |
| CN105488326A (en) * | 2014-10-03 | 2016-04-13 | 精工爱普生株式会社 | Target component calibration device, electronic device, and target component calibration method |
| EP3007075A3 (en) * | 2014-09-25 | 2016-06-08 | Seiko Epson Corporation | Calibration curve creation method and device, target component calibration method and device, and electronic apparatus |
| EP3035206A1 (en) * | 2014-10-08 | 2016-06-22 | Seiko Epson Corporation | Calibration curve generation device, target component calibration device, electronic device, and glucose concentration calibration device |
| EP3037981A1 (en) * | 2014-10-08 | 2016-06-29 | Seiko Epson Corporation | Method and device for calibration curve generation, target component calibration and glucose concentration calibration, and electronic device |
| US20180088033A1 (en) * | 2016-09-26 | 2018-03-29 | Seiko Epson Corporation | Calibration apparatus and calibration curve creation method |
| US10852228B2 (en) | 2016-09-26 | 2020-12-01 | Seiko Epson Corporation | Calibration apparatus, calibration curve creation method, and independent component analysis method |
Families Citing this family (4)
| Publication number | Priority date | Publication date | Assignee | Title |
|---|---|---|---|---|
| JP2016080680A (en) * | 2014-10-15 | 2016-05-16 | セイコーエプソン株式会社 | Method for detecting signal, method for creating calibration curve, method for quantification, signal detector, and measurement device |
| JP2018054305A (en) * | 2016-09-26 | 2018-04-05 | セイコーエプソン株式会社 | Calibration device and calibration curve creation method |
| JP6862737B2 (en) * | 2016-09-26 | 2021-04-21 | セイコーエプソン株式会社 | Calibration curve, calibration curve creation method, and independent component analysis method |
| CN112651648B (en) * | 2020-12-30 | 2023-06-06 | 广东电网有限责任公司电力科学研究院 | Power distribution network reliability index preprocessing method based on data whitening |
Citations (3)
| Publication number | Priority date | Publication date | Assignee | Title |
|---|---|---|---|---|
| JP2001099710A (en) | 1999-09-28 | 2001-04-13 | Fuji Photo Film Co Ltd | Spectrum estimating method of spectral reflectance of multi-band image and spectrum estimating system |
| JP2007044104A (en) | 2005-08-08 | 2007-02-22 | Shimadzu Corp | Apparatus and method for signal analysis |
| JP2013036973A (en) * | 2011-07-12 | 2013-02-21 | Seiko Epson Corp | Method and device for generating calibration curve, and target component measurement device |
Family Cites Families (13)
| Publication number | Priority date | Publication date | Assignee | Title |
|---|---|---|---|---|
| US7689268B2 (en) * | 2002-08-05 | 2010-03-30 | Infraredx, Inc. | Spectroscopic unwanted signal filters for discrimination of vulnerable plaque and method therefor |
| US7620674B2 (en) * | 2003-03-07 | 2009-11-17 | Sensys Medical, Inc. | Method and apparatus for enhanced estimation of an analyte property through multiple region transformation |
| RU2266523C1 (en) * | 2004-07-27 | 2005-12-20 | Общество с ограниченной ответственностью ООО "ВИНТЕЛ" | Method of producing independent multidimensional calibration models |
| US7127372B2 (en) * | 2005-02-24 | 2006-10-24 | Itt Manufacturing Enterprises, Inc. | Retro-regression residual remediation for spectral/signal identification |
| EP1877756B1 (en) * | 2005-04-28 | 2019-04-17 | Koninklijke Philips N.V. | Spectroscopic method of determining the amount of an analyte in a mixture of analytes |
| US20070076001A1 (en) * | 2005-09-30 | 2007-04-05 | Brand Matthew E | Method for selecting a low dimensional model from a set of low dimensional models representing high dimensional data based on the high dimensional data |
| US20100056947A1 (en) * | 2008-08-27 | 2010-03-04 | Lifeline Biotechnologies, Inc. | Placeholder for collecting and analyzing thermal data based on breast surface temperature to determine suspect conditions |
| JP5604763B2 (en) * | 2010-09-03 | 2014-10-15 | 国立大学法人神戸大学 | Transmission near-infrared spectroscopy measurement apparatus and transmission near-infrared spectroscopy measurement method |
| US20140178348A1 (en) * | 2011-05-25 | 2014-06-26 | The Regents Of The University Of California | Methods using DNA methylation for identifying a cell or a mixture of cells for prognosis and diagnosis of diseases, and for cell remediation therapies |
| JP5817236B2 (en) * | 2011-06-17 | 2015-11-18 | 株式会社Sumco | Method for evaluating metal contamination in semiconductor sample and method for manufacturing semiconductor substrate |
| JP5884526B2 (en) * | 2012-02-03 | 2016-03-15 | セイコーエプソン株式会社 | Calibration curve creation method and apparatus, and target component calibration apparatus |
| JP5884524B2 (en) * | 2012-02-03 | 2016-03-15 | セイコーエプソン株式会社 | Calibration curve creation method and apparatus, and target component calibration apparatus |
| JP5884525B2 (en) * | 2012-02-03 | 2016-03-15 | セイコーエプソン株式会社 | Calibration curve creation method and apparatus, and target component calibration apparatus |
-
2013
- 2013-03-27 JP JP2013065763A patent/JP6155746B2/en not_active Expired - Fee Related
-
2014
- 2014-03-25 US US14/224,872 patent/US20140297197A1/en not_active Abandoned
- 2014-03-25 EP EP14161517.9A patent/EP2784484B1/en not_active Not-in-force
Patent Citations (3)
| Publication number | Priority date | Publication date | Assignee | Title |
|---|---|---|---|---|
| JP2001099710A (en) | 1999-09-28 | 2001-04-13 | Fuji Photo Film Co Ltd | Spectrum estimating method of spectral reflectance of multi-band image and spectrum estimating system |
| JP2007044104A (en) | 2005-08-08 | 2007-02-22 | Shimadzu Corp | Apparatus and method for signal analysis |
| JP2013036973A (en) * | 2011-07-12 | 2013-02-21 | Seiko Epson Corp | Method and device for generating calibration curve, and target component measurement device |
Non-Patent Citations (11)
| Title |
|---|
| AAPO HYVARINEN; JUHA KARHUMEN; ERKKI OJA: "Independent Comonent Analysis", 2001, JOHN WILEY & SONS, INC. |
| AAPO HYVARINEN; JUHA KARHUMEN; ERKKI OJA: "Independent Comonent Analysis", 2001, JOHNWILEY&SONS, INC. |
| DATABASE WPI Week 201316, Derwent World Patents Index; AN 2013-C56663, XP002726655 * |
| GOMEZ A H ET AL: "Non-destructive measurement of acidity, soluble solids and firmness of Satsuma mandarin using Vis/NIR-spectroscopy techniques", JOURNAL OF FOOD ENGINEERING, BARKING, ESSEX, GB, vol. 77, no. 2, 1 November 2006 (2006-11-01), pages 313 - 319, XP027891085, ISSN: 0260-8774, [retrieved on 20061101] * |
| HARITOPOULOS M ET AL: "Image denoising using self-organizing map-based nonlinear independent component analysis", NEURAL NETWORKS, ELSEVIER SCIENCE PUBLISHERS, BARKING, GB, vol. 15, no. 8-9, 1 October 2002 (2002-10-01), pages 1085 - 1098, XP004385873, ISSN: 0893-6080, DOI: 10.1016/S0893-6080(02)00081-3 * |
| INDEPENDENT COMPONENT ANALYSIS FOR NOISY DATA - MEG DATA ANALYSIS, 2000 |
| M. TOIVIAINEN ET AL: "Blind source separation in diffuse reflectance NIR spectroscopy using independent component analysis", JOURNAL OF CHEMOMETRICS, vol. 24, no. 7-8, 27 May 2010 (2010-05-27), pages 514 - 522, XP055126170, ISSN: 0886-9383, DOI: 10.1002/cem.1316 * |
| POLDER G ET AL: "Tomato sorting using independent component analysis on spectral images", REAL-TIME IMAGING, ACADEMIC PRESS LIMITED, GB, vol. 9, no. 4, 1 August 2003 (2003-08-01), pages 253 - 259, XP004473409, ISSN: 1077-2014, DOI: 10.1016/J.RTI.2003.09.008 * |
| R. M. JARVIS ET AL: "Genetic algorithm optimization for pre-processing and variable selection of spectroscopic data", BIOINFORMATICS, vol. 21, no. 7, 28 October 2004 (2004-10-28), pages 860 - 868, XP055126173, ISSN: 1367-4803, DOI: 10.1093/bioinformatics/bti102 * |
| VASQUES G M ET AL: "Comparison of multivariate methods for inferential modeling of soil carbon using visible/near-infrared spectra", GEODERMA, ELSEVIER SCIENCE, AMSTERDAM, NL, vol. 146, no. 1-2, 31 July 2008 (2008-07-31), pages 14 - 25, XP023440037, ISSN: 0016-7061, [retrieved on 20080610], DOI: 10.1016/J.GEODERMA.2008.04.007 * |
| ZENG-PING CHEN; JULIAN MORRIS; ELAINE MARTIN, EXTRACTING CHEMICAL INFORMATION FROM SPECTRAL DATA WITH MULTIPLICATIVE LIGHT SCATTERING EFFECTS BY OPTICAL PATH-LENGTH ESTIMATION AND CORRECTION, 2006 |
Cited By (9)
| Publication number | Priority date | Publication date | Assignee | Title |
|---|---|---|---|---|
| EP3007075A3 (en) * | 2014-09-25 | 2016-06-08 | Seiko Epson Corporation | Calibration curve creation method and device, target component calibration method and device, and electronic apparatus |
| CN105488326A (en) * | 2014-10-03 | 2016-04-13 | 精工爱普生株式会社 | Target component calibration device, electronic device, and target component calibration method |
| EP3032430A1 (en) * | 2014-10-03 | 2016-06-15 | Seiko Epson Corporation | Target component calibration device, electronic device, and target component calibration method |
| EP3035206A1 (en) * | 2014-10-08 | 2016-06-22 | Seiko Epson Corporation | Calibration curve generation device, target component calibration device, electronic device, and glucose concentration calibration device |
| EP3037981A1 (en) * | 2014-10-08 | 2016-06-29 | Seiko Epson Corporation | Method and device for calibration curve generation, target component calibration and glucose concentration calibration, and electronic device |
| CN105467078A (en) * | 2015-11-20 | 2016-04-06 | 山西农业大学 | A senescence characteristic detecting method for wheat flag leaves |
| US20180088033A1 (en) * | 2016-09-26 | 2018-03-29 | Seiko Epson Corporation | Calibration apparatus and calibration curve creation method |
| US10852228B2 (en) | 2016-09-26 | 2020-12-01 | Seiko Epson Corporation | Calibration apparatus, calibration curve creation method, and independent component analysis method |
| US11204314B2 (en) * | 2016-09-26 | 2021-12-21 | Seiko Epson Corporation | Calibration apparatus and calibration curve creation method |
Also Published As
| Publication number | Publication date |
|---|---|
| EP2784484B1 (en) | 2017-09-27 |
| JP6155746B2 (en) | 2017-07-05 |
| US20140297197A1 (en) | 2014-10-02 |
| JP2014190795A (en) | 2014-10-06 |
Similar Documents
| Publication | Publication Date | Title |
|---|---|---|
| EP2784484A1 (en) | Optimized calibration method for determining the content of chlorophyll using pre-processing and independent component analysis | |
| JP5884524B2 (en) | Calibration curve creation method and apparatus, and target component calibration apparatus | |
| JP5884526B2 (en) | Calibration curve creation method and apparatus, and target component calibration apparatus | |
| US9921201B2 (en) | Calibration curve creating method and calibration curve creation apparatus | |
| JP5887961B2 (en) | Calibration curve creation method, calibration curve creation device, target component calibration device, and computer program | |
| US20160103063A1 (en) | Calibration curve generation device, target component calibration device, electronic device, and glucose concentration calibration device | |
| EP3032430A1 (en) | Target component calibration device, electronic device, and target component calibration method | |
| JP5884525B2 (en) | Calibration curve creation method and apparatus, and target component calibration apparatus | |
| EP3007075A2 (en) | Calibration curve creation method and device, target component calibration method and device, and electronic apparatus | |
| JP6326732B2 (en) | Calibration curve creation method and apparatus, and blood component calibration apparatus | |
| EP3037981A1 (en) | Method and device for calibration curve generation, target component calibration and glucose concentration calibration, and electronic device | |
| US20190265161A1 (en) | Identifying presence of substances | |
| US20180088035A1 (en) | Calibration apparatus and calibration curve creation method | |
| US11204314B2 (en) | Calibration apparatus and calibration curve creation method | |
| US10852228B2 (en) | Calibration apparatus, calibration curve creation method, and independent component analysis method | |
| JP2017062138A (en) | Neutral fat concentration calibration device, electronic apparatus and calibration curve creation method | |
| JP2018132463A (en) | Calibration device and calibration curve creation method |
Legal Events
| Date | Code | Title | Description |
|---|---|---|---|
| 17P | Request for examination filed |
Effective date: 20140325 |
|
| AK | Designated contracting states |
Kind code of ref document: A1 Designated state(s): AL AT BE BG CH CY CZ DE DK EE ES FI FR GB GR HR HU IE IS IT LI LT LU LV MC MK MT NL NO PL PT RO RS SE SI SK SM TR |
|
| AX | Request for extension of the european patent |
Extension state: BA ME |
|
| PUAI | Public reference made under article 153(3) epc to a published international application that has entered the european phase |
Free format text: ORIGINAL CODE: 0009012 |
|
| R17P | Request for examination filed (corrected) |
Effective date: 20150313 |
|
| RBV | Designated contracting states (corrected) |
Designated state(s): AL AT BE BG CH CY CZ DE DK EE ES FI FR GB GR HR HU IE IS IT LI LT LU LV MC MK MT NL NO PL PT RO RS SE SI SK SM TR |
|
| GRAP | Despatch of communication of intention to grant a patent |
Free format text: ORIGINAL CODE: EPIDOSNIGR1 |
|
| INTG | Intention to grant announced |
Effective date: 20170509 |
|
| GRAS | Grant fee paid |
Free format text: ORIGINAL CODE: EPIDOSNIGR3 |
|
| GRAA | (expected) grant |
Free format text: ORIGINAL CODE: 0009210 |
|
| AK | Designated contracting states |
Kind code of ref document: B1 Designated state(s): AL AT BE BG CH CY CZ DE DK EE ES FI FR GB GR HR HU IE IS IT LI LT LU LV MC MK MT NL NO PL PT RO RS SE SI SK SM TR |
|
| REG | Reference to a national code |
Ref country code: GB Ref legal event code: FG4D |
|
| REG | Reference to a national code |
Ref country code: CH Ref legal event code: EP |
|
| REG | Reference to a national code |
Ref country code: AT Ref legal event code: REF Ref document number: 932395 Country of ref document: AT Kind code of ref document: T Effective date: 20171015 |
|
| REG | Reference to a national code |
Ref country code: IE Ref legal event code: FG4D |
|
| REG | Reference to a national code |
Ref country code: DE Ref legal event code: R096 Ref document number: 602014014963 Country of ref document: DE |
|
| PG25 | Lapsed in a contracting state [announced via postgrant information from national office to epo] |
Ref country code: NO Free format text: LAPSE BECAUSE OF FAILURE TO SUBMIT A TRANSLATION OF THE DESCRIPTION OR TO PAY THE FEE WITHIN THE PRESCRIBED TIME-LIMIT Effective date: 20171227 Ref country code: FI Free format text: LAPSE BECAUSE OF FAILURE TO SUBMIT A TRANSLATION OF THE DESCRIPTION OR TO PAY THE FEE WITHIN THE PRESCRIBED TIME-LIMIT Effective date: 20170927 Ref country code: SE Free format text: LAPSE BECAUSE OF FAILURE TO SUBMIT A TRANSLATION OF THE DESCRIPTION OR TO PAY THE FEE WITHIN THE PRESCRIBED TIME-LIMIT Effective date: 20170927 Ref country code: HR Free format text: LAPSE BECAUSE OF FAILURE TO SUBMIT A TRANSLATION OF THE DESCRIPTION OR TO PAY THE FEE WITHIN THE PRESCRIBED TIME-LIMIT Effective date: 20170927 Ref country code: LT Free format text: LAPSE BECAUSE OF FAILURE TO SUBMIT A TRANSLATION OF THE DESCRIPTION OR TO PAY THE FEE WITHIN THE PRESCRIBED TIME-LIMIT Effective date: 20170927 |
|
| REG | Reference to a national code |
Ref country code: NL Ref legal event code: MP Effective date: 20170927 |
|
| REG | Reference to a national code |
Ref country code: LT Ref legal event code: MG4D |
|
| REG | Reference to a national code |
Ref country code: AT Ref legal event code: MK05 Ref document number: 932395 Country of ref document: AT Kind code of ref document: T Effective date: 20170927 |
|
| PG25 | Lapsed in a contracting state [announced via postgrant information from national office to epo] |
Ref country code: RS Free format text: LAPSE BECAUSE OF FAILURE TO SUBMIT A TRANSLATION OF THE DESCRIPTION OR TO PAY THE FEE WITHIN THE PRESCRIBED TIME-LIMIT Effective date: 20170927 Ref country code: BG Free format text: LAPSE BECAUSE OF FAILURE TO SUBMIT A TRANSLATION OF THE DESCRIPTION OR TO PAY THE FEE WITHIN THE PRESCRIBED TIME-LIMIT Effective date: 20171227 Ref country code: GR Free format text: LAPSE BECAUSE OF FAILURE TO SUBMIT A TRANSLATION OF THE DESCRIPTION OR TO PAY THE FEE WITHIN THE PRESCRIBED TIME-LIMIT Effective date: 20171228 Ref country code: LV Free format text: LAPSE BECAUSE OF FAILURE TO SUBMIT A TRANSLATION OF THE DESCRIPTION OR TO PAY THE FEE WITHIN THE PRESCRIBED TIME-LIMIT Effective date: 20170927 |
|
| REG | Reference to a national code |
Ref country code: FR Ref legal event code: PLFP Year of fee payment: 5 |
|
| PG25 | Lapsed in a contracting state [announced via postgrant information from national office to epo] |
Ref country code: NL Free format text: LAPSE BECAUSE OF FAILURE TO SUBMIT A TRANSLATION OF THE DESCRIPTION OR TO PAY THE FEE WITHIN THE PRESCRIBED TIME-LIMIT Effective date: 20170927 |
|
| PG25 | Lapsed in a contracting state [announced via postgrant information from national office to epo] |
Ref country code: RO Free format text: LAPSE BECAUSE OF FAILURE TO SUBMIT A TRANSLATION OF THE DESCRIPTION OR TO PAY THE FEE WITHIN THE PRESCRIBED TIME-LIMIT Effective date: 20170927 Ref country code: ES Free format text: LAPSE BECAUSE OF FAILURE TO SUBMIT A TRANSLATION OF THE DESCRIPTION OR TO PAY THE FEE WITHIN THE PRESCRIBED TIME-LIMIT Effective date: 20170927 Ref country code: CZ Free format text: LAPSE BECAUSE OF FAILURE TO SUBMIT A TRANSLATION OF THE DESCRIPTION OR TO PAY THE FEE WITHIN THE PRESCRIBED TIME-LIMIT Effective date: 20170927 |
|
| PG25 | Lapsed in a contracting state [announced via postgrant information from national office to epo] |
Ref country code: IT Free format text: LAPSE BECAUSE OF FAILURE TO SUBMIT A TRANSLATION OF THE DESCRIPTION OR TO PAY THE FEE WITHIN THE PRESCRIBED TIME-LIMIT Effective date: 20170927 Ref country code: EE Free format text: LAPSE BECAUSE OF FAILURE TO SUBMIT A TRANSLATION OF THE DESCRIPTION OR TO PAY THE FEE WITHIN THE PRESCRIBED TIME-LIMIT Effective date: 20170927 Ref country code: SK Free format text: LAPSE BECAUSE OF FAILURE TO SUBMIT A TRANSLATION OF THE DESCRIPTION OR TO PAY THE FEE WITHIN THE PRESCRIBED TIME-LIMIT Effective date: 20170927 Ref country code: AT Free format text: LAPSE BECAUSE OF FAILURE TO SUBMIT A TRANSLATION OF THE DESCRIPTION OR TO PAY THE FEE WITHIN THE PRESCRIBED TIME-LIMIT Effective date: 20170927 Ref country code: SM Free format text: LAPSE BECAUSE OF FAILURE TO SUBMIT A TRANSLATION OF THE DESCRIPTION OR TO PAY THE FEE WITHIN THE PRESCRIBED TIME-LIMIT Effective date: 20170927 Ref country code: IS Free format text: LAPSE BECAUSE OF FAILURE TO SUBMIT A TRANSLATION OF THE DESCRIPTION OR TO PAY THE FEE WITHIN THE PRESCRIBED TIME-LIMIT Effective date: 20180127 |
|
| REG | Reference to a national code |
Ref country code: DE Ref legal event code: R097 Ref document number: 602014014963 Country of ref document: DE |
|
| PG25 | Lapsed in a contracting state [announced via postgrant information from national office to epo] |
Ref country code: DK Free format text: LAPSE BECAUSE OF FAILURE TO SUBMIT A TRANSLATION OF THE DESCRIPTION OR TO PAY THE FEE WITHIN THE PRESCRIBED TIME-LIMIT Effective date: 20170927 |
|
| PLBE | No opposition filed within time limit |
Free format text: ORIGINAL CODE: 0009261 |
|
| STAA | Information on the status of an ep patent application or granted ep patent |
Free format text: STATUS: NO OPPOSITION FILED WITHIN TIME LIMIT |
|
| PG25 | Lapsed in a contracting state [announced via postgrant information from national office to epo] |
Ref country code: PL Free format text: LAPSE BECAUSE OF FAILURE TO SUBMIT A TRANSLATION OF THE DESCRIPTION OR TO PAY THE FEE WITHIN THE PRESCRIBED TIME-LIMIT Effective date: 20170927 |
|
| 26N | No opposition filed |
Effective date: 20180628 |
|
| REG | Reference to a national code |
Ref country code: CH Ref legal event code: PL |
|
| PG25 | Lapsed in a contracting state [announced via postgrant information from national office to epo] |
Ref country code: MC Free format text: LAPSE BECAUSE OF FAILURE TO SUBMIT A TRANSLATION OF THE DESCRIPTION OR TO PAY THE FEE WITHIN THE PRESCRIBED TIME-LIMIT Effective date: 20170927 Ref country code: SI Free format text: LAPSE BECAUSE OF FAILURE TO SUBMIT A TRANSLATION OF THE DESCRIPTION OR TO PAY THE FEE WITHIN THE PRESCRIBED TIME-LIMIT Effective date: 20170927 |
|
| REG | Reference to a national code |
Ref country code: BE Ref legal event code: MM Effective date: 20180331 |
|
| REG | Reference to a national code |
Ref country code: IE Ref legal event code: MM4A |
|
| PG25 | Lapsed in a contracting state [announced via postgrant information from national office to epo] |
Ref country code: LU Free format text: LAPSE BECAUSE OF NON-PAYMENT OF DUE FEES Effective date: 20180325 |
|
| PG25 | Lapsed in a contracting state [announced via postgrant information from national office to epo] |
Ref country code: IE Free format text: LAPSE BECAUSE OF NON-PAYMENT OF DUE FEES Effective date: 20180325 |
|
| PG25 | Lapsed in a contracting state [announced via postgrant information from national office to epo] |
Ref country code: CH Free format text: LAPSE BECAUSE OF NON-PAYMENT OF DUE FEES Effective date: 20180331 Ref country code: LI Free format text: LAPSE BECAUSE OF NON-PAYMENT OF DUE FEES Effective date: 20180331 Ref country code: BE Free format text: LAPSE BECAUSE OF NON-PAYMENT OF DUE FEES Effective date: 20180331 |
|
| PGFP | Annual fee paid to national office [announced via postgrant information from national office to epo] |
Ref country code: DE Payment date: 20190312 Year of fee payment: 6 Ref country code: GB Payment date: 20190320 Year of fee payment: 6 |
|
| PGFP | Annual fee paid to national office [announced via postgrant information from national office to epo] |
Ref country code: FR Payment date: 20190213 Year of fee payment: 6 |
|
| PG25 | Lapsed in a contracting state [announced via postgrant information from national office to epo] |
Ref country code: MT Free format text: LAPSE BECAUSE OF NON-PAYMENT OF DUE FEES Effective date: 20180325 |
|
| PG25 | Lapsed in a contracting state [announced via postgrant information from national office to epo] |
Ref country code: TR Free format text: LAPSE BECAUSE OF FAILURE TO SUBMIT A TRANSLATION OF THE DESCRIPTION OR TO PAY THE FEE WITHIN THE PRESCRIBED TIME-LIMIT Effective date: 20170927 |
|
| PG25 | Lapsed in a contracting state [announced via postgrant information from national office to epo] |
Ref country code: PT Free format text: LAPSE BECAUSE OF FAILURE TO SUBMIT A TRANSLATION OF THE DESCRIPTION OR TO PAY THE FEE WITHIN THE PRESCRIBED TIME-LIMIT Effective date: 20170927 Ref country code: HU Free format text: LAPSE BECAUSE OF FAILURE TO SUBMIT A TRANSLATION OF THE DESCRIPTION OR TO PAY THE FEE WITHIN THE PRESCRIBED TIME-LIMIT; INVALID AB INITIO Effective date: 20140325 |
|
| PG25 | Lapsed in a contracting state [announced via postgrant information from national office to epo] |
Ref country code: MK Free format text: LAPSE BECAUSE OF NON-PAYMENT OF DUE FEES Effective date: 20170927 Ref country code: CY Free format text: LAPSE BECAUSE OF FAILURE TO SUBMIT A TRANSLATION OF THE DESCRIPTION OR TO PAY THE FEE WITHIN THE PRESCRIBED TIME-LIMIT Effective date: 20170927 |
|
| PG25 | Lapsed in a contracting state [announced via postgrant information from national office to epo] |
Ref country code: AL Free format text: LAPSE BECAUSE OF FAILURE TO SUBMIT A TRANSLATION OF THE DESCRIPTION OR TO PAY THE FEE WITHIN THE PRESCRIBED TIME-LIMIT Effective date: 20170927 |
|
| REG | Reference to a national code |
Ref country code: DE Ref legal event code: R119 Ref document number: 602014014963 Country of ref document: DE |
|
| PG25 | Lapsed in a contracting state [announced via postgrant information from national office to epo] |
Ref country code: DE Free format text: LAPSE BECAUSE OF NON-PAYMENT OF DUE FEES Effective date: 20201001 Ref country code: FR Free format text: LAPSE BECAUSE OF NON-PAYMENT OF DUE FEES Effective date: 20200331 |
|
| GBPC | Gb: european patent ceased through non-payment of renewal fee |
Effective date: 20200325 |
|
| PG25 | Lapsed in a contracting state [announced via postgrant information from national office to epo] |
Ref country code: GB Free format text: LAPSE BECAUSE OF NON-PAYMENT OF DUE FEES Effective date: 20200325 |