RU2678949C2 - System and method of measuring defects in ferromagnetic materials - Google Patents
System and method of measuring defects in ferromagnetic materials Download PDFInfo
- Publication number
- RU2678949C2 RU2678949C2 RU2016149454A RU2016149454A RU2678949C2 RU 2678949 C2 RU2678949 C2 RU 2678949C2 RU 2016149454 A RU2016149454 A RU 2016149454A RU 2016149454 A RU2016149454 A RU 2016149454A RU 2678949 C2 RU2678949 C2 RU 2678949C2
- Authority
- RU
- Russia
- Prior art keywords
- ferromagnetic material
- magnetic field
- data points
- magnetometers
- location
- Prior art date
Links
Images

Classifications
-
- G—PHYSICS
- G01—MEASURING; TESTING
- G01N—INVESTIGATING OR ANALYSING MATERIALS BY DETERMINING THEIR CHEMICAL OR PHYSICAL PROPERTIES
- G01N17/00—Investigating resistance of materials to the weather, to corrosion, or to light
-
- G—PHYSICS
- G01—MEASURING; TESTING
- G01N—INVESTIGATING OR ANALYSING MATERIALS BY DETERMINING THEIR CHEMICAL OR PHYSICAL PROPERTIES
- G01N27/00—Investigating or analysing materials by the use of electric, electrochemical, or magnetic means
- G01N27/72—Investigating or analysing materials by the use of electric, electrochemical, or magnetic means by investigating magnetic variables
- G01N27/82—Investigating or analysing materials by the use of electric, electrochemical, or magnetic means by investigating magnetic variables for investigating the presence of flaws
-
- G—PHYSICS
- G01—MEASURING; TESTING
- G01N—INVESTIGATING OR ANALYSING MATERIALS BY DETERMINING THEIR CHEMICAL OR PHYSICAL PROPERTIES
- G01N21/00—Investigating or analysing materials by the use of optical means, i.e. using sub-millimetre waves, infrared, visible or ultraviolet light
- G01N21/84—Systems specially adapted for particular applications
- G01N21/88—Investigating the presence of flaws or contamination
- G01N21/8851—Scan or image signal processing specially adapted therefor, e.g. for scan signal adjustment, for detecting different kinds of defects, for compensating for structures, markings, edges
- G01N2021/8854—Grading and classifying of flaws
- G01N2021/8861—Determining coordinates of flaws
- G01N2021/8864—Mapping zones of defects
Abstract
Description
[0001] Настоящая заявка испрашивает приоритет по предварительной патентной заявке США №61/994961, поданной 18 мая 2014, озаглавленной "Система и способ измерения дефектов в ферромагнитных материалах", полное содержание которой включено в качестве ссылки в настоящий документ для всех целей.[0001] This application claims priority to provisional patent application US No. 61/994961, filed May 18, 2014, entitled "System and method for measuring defects in ferromagnetic materials", the entire contents of which are incorporated by reference in this document for all purposes.
ОБЛАСТЬ ТЕХНИКИFIELD OF TECHNOLOGY
[0002] Настоящее изобретение относится к обнаружению дефектов в ферромагнитных материалах и, более конкретно, к обнаружению дефектов в ферромагнитных материалах с использованием магнитометра.[0002] The present invention relates to the detection of defects in ferromagnetic materials and, more particularly, to the detection of defects in ferromagnetic materials using a magnetometer.
УРОВЕНЬ ТЕХНИКИBACKGROUND
[0003] Ферромагнитные материалы, такие как железо, никель, сталь и другие материалы, используют для изготовления многих изделий, таких как, трубы, балки и корпуса океанских судов. При использовании в данном документе термин "ферромагнитный материал" включает в себя как ферромагнитный, так и ферримагнитный материал. Во многих случаях данные материалы подвержены коррозии и/или эрозии. При использовании в данном документе, коррозия означает потерю материала в результате химической реакции, чаще всего реакции окисления. При использовании в данном документе эрозия означает потерю материала в результате механического процесса, например абразивного износа. Например, песок, поступающий в нефтяную или газовую скважину, может истирать внутреннюю часть трубопровода, доставляющего нефть или газ из скважины. Потеря материала из-за коррозии и/или эрозии обобщенно упоминается в данном документе как "дефект". При использовании в данном документе термин дефект также включает в себя трещину или полость или включение инородного материала, которые могут появиться, например, во время или после изготовления. Если позволить коррозии или эрозии развиться за пределы критической точки, то это может нарушить структурную целостность элемента, что может привести к катастрофическим результатам, например разливу нефти, обрушению здания или затоплению судна.[0003] Ferromagnetic materials, such as iron, nickel, steel and other materials, are used for the manufacture of many products, such as pipes, beams and hulls of ocean vessels. As used herein, the term “ferromagnetic material” includes both ferromagnetic and ferrimagnetic material. In many cases, these materials are susceptible to corrosion and / or erosion. As used herein, corrosion means loss of material as a result of a chemical reaction, most often an oxidation reaction. As used herein, erosion means loss of material as a result of a mechanical process, such as abrasive wear. For example, sand entering an oil or gas well may abrade the interior of a pipeline delivering oil or gas from the well. Loss of material due to corrosion and / or erosion is collectively referred to herein as a “defect”. As used herein, the term defect also includes a crack or cavity or the inclusion of foreign material that may appear, for example, during or after manufacture. If corrosion or erosion is allowed to develop beyond a critical point, this can disrupt the structural integrity of the element, which can lead to catastrophic results, such as an oil spill, collapse of a building, or flooding of a ship.
[0004] В попытке обнаружить дефекты в ферромагнитных материалах и изделиях, изготовленных из ферромагнитных материалов, в уровне техники использовались различные устройства и способы. Для некоторых из данных устройств и способов требуется удаление теплоизоляции и очистка поверхности от антикоррозионного покрытия для получения прямого доступа к поверхности ферромагнитного материала. В некоторых случаях, поверхность должна быть отполирована для создания идеального взаимодействия с датчиком или распространения волн от датчика. Данные операции являются дорогостоящими, отнимают много времени и часто нарушают теплоизоляцию и/или покрытие поверхности.[0004] In an attempt to detect defects in ferromagnetic materials and products made from ferromagnetic materials, various devices and methods have been used in the art. Some of these devices and methods require the removal of thermal insulation and surface cleaning from anticorrosion coatings in order to gain direct access to the surface of the ferromagnetic material. In some cases, the surface must be polished to create the perfect interaction with the sensor or the propagation of waves from the sensor. These operations are expensive, time consuming and often interfere with thermal insulation and / or surface coverage.
[0005] Все известные изобретателям устройства и способы обнаружения дефектов в ферромагнитных материалах уровня техники включают в себя введение в материал энергии. Например, акустические датчики посылают в материал звуковую волну и измеряют возвращенный сигнал. Датчики направленных волн и топографические датчики аналогичным образом посылают в материал электромагнитные волны и регистрируют отражения или время прохождения волны. В отличие от подхода, связанного с передачей энергии в контролируемое изделие, компания Rohrback Cosasco Systems, Inc. выпускает линейку зондов для обнаружения эрозии от воздействия песка под торговой маркой "Quicksand". Данные зонды не выполняют непосредственного измерения эрозии труб и тому подобного. Вместо этого данные зонды являются расходными в том смысле, что они обнаруживают эрозию участков на самих зондах. Использование систем, основанных на таких зондах, предполагает, что трубы и другие изделия изнашиваются приблизительно с той же скоростью, что и расходные участки зондов. Кроме того, использование зондов зависит от потока текучей среды через трубу, вследствие чего требуется, чтобы в трубу подавали энергию в виде потока текучей среды. Данные системы могут обнаружить эрозию только внутри трубы. Данные системы не могут обнаружить дефекты где-либо еще, например, внутри стенки трубы или на внешней поверхности трубы, они также не могут определить состояние трубы вследствие эрозии до того, как датчик был установлен на место.[0005] All devices and methods for detecting defects in prior art ferromagnetic materials known to the inventors include introducing energy into the material. For example, acoustic sensors send a sound wave into the material and measure the returned signal. Directional wave sensors and topographic sensors similarly send electromagnetic waves into the material and record reflections or wave propagation time. In contrast to the approach of transferring energy to a controlled product, Rohrback Cosasco Systems, Inc. launches a line of probes for detecting sand erosion under the Quicksand trademark. These probes do not directly measure pipe erosion and the like. Instead, these probes are consumable in the sense that they detect erosion of areas on the probes themselves. The use of systems based on such probes suggests that pipes and other products wear out at approximately the same speed as the probe consumables. In addition, the use of the probes depends on the flow of fluid through the pipe, which requires that energy be supplied to the pipe in the form of a fluid stream. These systems can detect erosion only inside the pipe. These systems cannot detect defects elsewhere, for example, inside the pipe wall or on the outer surface of the pipe, nor can they determine the condition of the pipe due to erosion before the sensor was put in place.
[0006] В попытках обнаружить дефекты в ферромагнитных материалах некоторые устройства и способы уровня техники включают в себя магнитометрию. Например, патенты США №№8542127 и 8447532, принадлежащие Валериану Горошевскому и др., раскрывают использование обратного магнитострикционного эффекта Виллари. Обратный магнитострикционный эффект Виллари включает в себя изменения магнитной восприимчивости материала под воздействием приложенной механической нагрузки. Если труба содержит дефект, то когда материал трубы находится под воздействием механической нагрузки, например труба находится под воздействием избыточного давления, магнитная восприимчивость трубы отличается от той, когда труба не находится под воздействием механической нагрузки. Патенты Горошевского основаны на обнаружении данного изменения магнитной восприимчивости при изменении давления в трубе. Таким образом, трубе необходимо сообщить энергию в форме избыточного давления внутри трубы. Некоторые изделия, например трубы, остаются неиспользованными и, следовательно, без избыточного давления на протяжении периодов времени, в течение которых могут развиться дефекты. Другие конструкции, например корпуса судов или элементы конструкций, не поддаются воздействию известного циклического нагружения. Однако без создания избыточного давления устройство и способы Горошевского не могут обнаруживать данные дефекты. Кроме того, согласно Горошевскому можно определять местоположение дефекта только вдоль длины трубы; согласно Горошевскому нельзя определять местоположение дефекта по окружности вокруг трубы.[0006] In an attempt to detect defects in ferromagnetic materials, some prior art devices and methods include magnetometry. For example, US patents Nos. 8542127 and 8447532, owned by Valerian Goroshevsky et al., Disclose the use of the reverse magnetostrictive effect of Villari. The reverse magnetostrictive effect of Villari includes changes in the magnetic susceptibility of the material under the influence of an applied mechanical load. If the pipe contains a defect, then when the pipe material is exposed to mechanical stress, for example, the pipe is exposed to excessive pressure, the magnetic susceptibility of the pipe is different from when the pipe is not exposed to mechanical stress. Goroshevsky's patents are based on the detection of this change in magnetic susceptibility when the pressure in the pipe changes. Thus, the pipe needs to communicate energy in the form of overpressure inside the pipe. Some products, such as pipes, remain unused and, therefore, without excessive pressure for periods of time during which defects can develop. Other structures, such as ship hulls or structural elements, are not susceptible to known cyclic loading. However, without creating excessive pressure, the Goroshevsky device and methods cannot detect these defects. In addition, according to Goroshevsky, it is possible to determine the location of a defect only along the length of the pipe; according to Goroshevsky, it is impossible to determine the location of a defect in a circle around a pipe.
РАСКРЫТИЕ СУЩНОСТИ ИЗОБРЕТЕНИЯSUMMARY OF THE INVENTION
[0007] Вариант осуществления настоящего изобретения обеспечивает систему для обнаружения дефектов в ферромагнитном материале. Система включает в себя множество магнитометров. Множество магнитометров размещено вблизи поверхности ферромагнитного материала. Множество магнитометров выполнены с возможностью измерения магнитного поля, созданного ферромагнитным материалом. Множество магнитометров выполнены с возможностью генерации данных магнитного поля на основе измеренного магнитного поля. Каждый магнитометр из множества магнитометров неподвижно закреплен в положении относительно ферромагнитного материала. Система также включает в себя построитель карты магнитного поля. Построитель карты магнитного поля выполнен с возможностью генерации точек данных двумерной карты изданных магнитного поля. Каждая точка данных соответствует соответствующему местоположению на поверхности ферромагнитного материала. Каждая точка данных представляет напряженность измеренного магнитного поля вблизи местоположения. "Вблизи" в данном контексте означает достаточно близко, так что местоположение дефекта можно задать как в направлении х, так и в направлении у, то есть, продольно вдоль ферромагнитного материала и поперечно через материал. В некоторых вариантах осуществления "вблизи" означает в пределах около 5-10 дюймов. Система также включает в себя сопоставитель с образцом. Сопоставитель с образцом выполнен с возможностью распознавания на карте множества точек данных, соответствующих заданному пространственному образцу напряженности магнитного поля. Сопоставитель с образцом выполнен с возможностью выдачи местоположения вблизи поверхности ферромагнитного материала, которое соответствует множеству точек данных. Выданное местоположение является местоположением дефекта.[0007] An embodiment of the present invention provides a system for detecting defects in a ferromagnetic material. The system includes many magnetometers. Many magnetometers are located near the surface of the ferromagnetic material. Many magnetometers are configured to measure the magnetic field created by the ferromagnetic material. Many magnetometers are configured to generate magnetic field data based on the measured magnetic field. Each magnetometer from a plurality of magnetometers is fixedly fixed in position relative to the ferromagnetic material. The system also includes a magnetic field map builder. The magnetic field map builder is configured to generate data points of a two-dimensional map of the published magnetic field. Each data point corresponds to a corresponding location on the surface of the ferromagnetic material. Each data point represents a measured magnetic field near a location. “Close” in this context means close enough, so that the location of the defect can be set both in the x direction and in the y direction, that is, longitudinally along the ferromagnetic material and transversely through the material. In some embodiments, “near” means in the range of about 5-10 inches. The system also includes a pattern matching system. The comparator with the sample is configured to recognize on the map a plurality of data points corresponding to a given spatial sample of magnetic field strength. The sampler is configured to provide a location near the surface of the ferromagnetic material that corresponds to a plurality of data points. The issued location is the location of the defect.
[0008] Система может также включать в себя модуль оценки размера дефекта. Модуль оценки размера дефекта выполнен с возможностью оценки объема материала, отсутствующего в ферромагнитном материале в местоположении вблизи поверхности ферромагнитного материала. Оценка отсутствующего объема основана на амплитуде особенности, представленной данными во множестве точек данных.[0008] The system may also include a defect size estimation module. The defect size estimation module is configured to estimate the volume of material absent in the ferromagnetic material at a location near the surface of the ferromagnetic material. The estimate of the missing volume is based on the amplitude of the feature represented by the data at the set of data points.
[0009] Модуль оценки размера дефекта может оценивать площадь отсутствующего материала на основе длины особенности, представленной данными во множестве точек данных, в двух пространственных направлениях.[0009] The defect size estimation module may estimate the area of the missing material based on the length of the feature represented by the data in a plurality of data points in two spatial directions.
[0010] Модуль оценки размера дефекта может оценивать глубину отсутствующего материала на основе оцененного объема отсутствующего материала и длины особенности, представленной данными во множестве точек данных, в двух пространственных направлениях.[0010] The defect size estimation module may evaluate the depth of the missing material based on the estimated volume of the missing material and the length of the feature represented by the data at the plurality of data points in two spatial directions.
[0011] Система может также включать в себя вычислитель остаточной напряженности магнитного поля. Вычислитель остаточной напряженности магнитного поля выполнен с возможностью определения амплитуды магнитного поля, созданного ферромагнитным материалом на удалении от местоположения вблизи поверхности ферромагнитного материала. Амплитуда напряженности магнитного поля основана на по меньшей мере одной из точек данных карты. Система может также включать в себя модуль оценки размера дефекта. Модуль оценки размера дефекта выполнен с возможностью оценки объема материала, отсутствующего на ферромагнитном материале в местоположении вблизи поверхности ферромагнитного материала. Оценку объема выполняют в соответствии с амплитудой данных во множестве точек данных и амплитудой магнитного поля, созданного ферромагнитным материалом в местоположении на удалении от местоположения вблизи поверхности ферромагнитного материала.[0011] The system may also include a residual magnetic field strength calculator. The calculator of the residual magnetic field is configured to determine the amplitude of the magnetic field created by the ferromagnetic material at a distance from a location near the surface of the ferromagnetic material. The amplitude of the magnetic field is based on at least one of the map data points. The system may also include a defect size estimator. The defect size estimation module is configured to estimate the volume of material absent on the ferromagnetic material at a location near the surface of the ferromagnetic material. Volume estimation is performed in accordance with the amplitude of the data at a plurality of data points and the amplitude of the magnetic field generated by the ferromagnetic material at a location away from a location near the surface of the ferromagnetic material.
[0012] Модуль оценки размера дефекта может оценивать площадь отсутствующего материала на основе длины особенности, представленной данными во множестве точек данных, в двух пространственных направлениях.[0012] The defect size estimation module may estimate the area of the missing material based on the length of the feature represented by the data in a plurality of data points in two spatial directions.
[0013] Модуль оценки размера дефекта может выполнять оценку глубины отсутствующего материала на основе оцененного объема отсутствующего материала и длины особенности, представленной данными во множестве точек данных, в двух пространственных направлениях.[0013] The defect size estimation module may estimate the depth of the missing material based on the estimated volume of the missing material and the length of the feature represented by the data at the plurality of data points in two spatial directions.
[0014] Каждый магнитометр из множества магнитометров может включать в себя три ортогонально ориентированных магнитометра. Каждая точка данных карты может представлять напряженность измеренного магнитного поля в каждом из трех ортогональных направлений. Сопоставитель с образцом может распознать для каждого из трех ортогональных направлений множество точек данных, соответствующих заданному пространственному образцу напряженности магнитного поля, и местоположение вблизи поверхности ферромагнитного материала, которое соответствует множеству точек данных. Сопоставитель с образцом может, таким образом, распознать три местоположения вблизи поверхности ферромагнитного материала. Система может также включать в себя сумматор. Сумматор может рассчитать уточненное местоположение вблизи поверхности ферромагнитного материала, исходя из трех распознанных местоположений, и выдает уточненное местоположение.[0014] Each magnetometer of a plurality of magnetometers may include three orthogonally oriented magnetometers. Each map data point may represent a measured magnetic field in each of three orthogonal directions. The sampler can recognize for each of the three orthogonal directions a plurality of data points corresponding to a given spatial sample of magnetic field strength, and a location near the surface of a ferromagnetic material that corresponds to a plurality of data points. The sampler can thus recognize three locations near the surface of the ferromagnetic material. The system may also include an adder. The adder can calculate the specified location near the surface of the ferromagnetic material, based on the three recognized locations, and provides an updated location.
[0015] Сопоставитель с образцом может рассчитать множество значений пространственных производных, исходя из точек данных карты. Сопоставитель с образцом может распознать множество точек данных, соответствующих заданному пространственному образцу напряженности магнитного поля, исходя из множества значений пространственных производных.[0015] The pattern mapper can calculate a plurality of spatial derivative values based on map data points. The comparator with the sample can recognize many data points corresponding to a given spatial sample of magnetic field strength, based on the set of values of the spatial derivatives.
[0016] Множество точек данных, соответствующих заданному пространственному образцу напряженности магнитного поля, может соответствовать потере части ферромагнитного материала в результате коррозии или эрозии.[0016] A plurality of data points corresponding to a given spatial pattern of magnetic field strength may correspond to the loss of part of the ferromagnetic material as a result of corrosion or erosion.
[0017] Множество точек данных, соответствующих заданному пространственному образцу напряженности магнитного поля, соответствует трещине в ферромагнитном материале.[0017] A plurality of data points corresponding to a given spatial pattern of magnetic field strength corresponds to a crack in a ferromagnetic material.
[0018] Другой вариант осуществления настоящего изобретения обеспечивает способ обнаружения дефектов в ферромагнитном материале. Способ включает в себя измерение магнитного поля, созданного ферромагнитным материалом. Точки данных из двумерной карты генерируют, исходя из измеренного магнитного поля. Каждая точка данных соответствует соответствующему местоположению на поверхности ферромагнитного материала. Каждая точка данных представляет напряженность измеренного магнитного поля вблизи местоположения. На двумерной карте множество точек данных распознано. Множество точек данных соответствует заданному пространственному образцу напряженности магнитного поля. Выходом является местоположение вблизи поверхности ферромагнитного материала. Местоположение соответствует множеству точек данных. Местоположение соответствует дефекту.[0018] Another embodiment of the present invention provides a method for detecting defects in a ferromagnetic material. The method includes measuring a magnetic field created by a ferromagnetic material. Data points from a two-dimensional map are generated based on the measured magnetic field. Each data point corresponds to a corresponding location on the surface of the ferromagnetic material. Each data point represents a measured magnetic field near a location. On a two-dimensional map, many data points are recognized. Many data points correspond to a given spatial pattern of magnetic field strength. The solution is location near the surface of the ferromagnetic material. A location corresponds to multiple data points. Location corresponds to defect.
[0019] Измерение магнитного поля может включать в себя размещение множества магнитометров вблизи поверхности ферромагнитного материала. Каждый магнитометр из множества магнитометров неподвижно крепится в положении относительно ферромагнитного материала.[0019] The measurement of the magnetic field may include placing a plurality of magnetometers near the surface of the ferromagnetic material. Each magnetometer from a plurality of magnetometers is fixedly mounted in a position relative to the ferromagnetic material.
[0020] Измерение магнитного поля может включать в себя физическое сканирование ферромагнитного материала при помощи по меньшей мере одного магнитометра путем перемещения по меньшей мере одного магнитометра относительно ферромагнитного материала.[0020] The measurement of the magnetic field may include physical scanning of the ferromagnetic material using at least one magnetometer by moving at least one magnetometer relative to the ferromagnetic material.
[0021] Перемещение по меньшей мере одного магнитометра относительно ферромагнитного материала может включать размещение одномерной решетки из по меньшей мере двух магнитометров вдоль профиля, ориентированного по существу перпендикулярно оси ферромагнитного материала. Одномерную решетку из по меньшей мере двух магнитометров можно перемещать вдоль оси ферромагнитного материала.[0021] Moving the at least one magnetometer relative to the ferromagnetic material may include placing a one-dimensional array of at least two magnetometers along a profile oriented substantially perpendicular to the axis of the ferromagnetic material. A one-dimensional array of at least two magnetometers can be moved along the axis of the ferromagnetic material.
[0022] При необходимости объем материала, отсутствующего на ферромагнитном материале в местоположении вблизи поверхности ферромагнитного материала, можно оценить. Оценку можно выполнять на основе амплитуды особенности, представленной данными во множестве точек данных.[0022] If necessary, the amount of material missing from the ferromagnetic material at a location near the surface of the ferromagnetic material can be estimated. Evaluation can be performed based on the amplitude of the feature represented by the data at multiple data points.
[0023] При необходимости амплитуда напряженности магнитного поля, созданного ферромагнитным материалом в местоположении на удалении от местоположения вблизи поверхности ферромагнитного материала, может быть определена на основе по меньшей мере одной из точек данных карты. Объем материала, отсутствующего на ферромагнитном материале в месте, расположенном вблизи поверхности ферромагнитного материала, можно оценить в соответствии с амплитудой данных во множестве точек данных, и амплитуды магнитного поля, созданного ферромагнитным материалом в местоположении на удалении от местоположения вблизи поверхности ферромагнитного материала.[0023] If necessary, the amplitude of the magnetic field generated by the ferromagnetic material at a location away from a location near the surface of the ferromagnetic material can be determined based on at least one of the map data points. The amount of material absent on the ferromagnetic material at a location close to the surface of the ferromagnetic material can be estimated in accordance with the amplitude of the data at a plurality of data points and the amplitude of the magnetic field generated by the ferromagnetic material at a location away from a location near the surface of the ferromagnetic material.
[0024] При необходимости можно оценить площадь отсутствующего материала. Оценка может быть основана на длине особенности, представленной данными во множестве точек данных, в двух пространственных направлениях.[0024] If necessary, the area of the missing material can be estimated. The estimate may be based on the length of the feature represented by the data at multiple data points in two spatial directions.
[0025] Можно оценить глубину отсутствующего материала по окружности. Оценка может быть основана на объеме отсутствующего материала и длине особенности, представленной данными во множестве точек данных, в двух пространственных направлениях.[0025] The circumference of the missing material can be estimated. The estimate may be based on the volume of the missing material and the length of the feature represented by the data in the set of data points in two spatial directions.
[0026] Измерение магнитного поля может включать в себя измерение магнитного поля при помощи множества магнитометров. Каждый магнитометр из множества магнитометров может включать в себя три ортогонально ориентированных магнитометра. Генерирование точек данных может включать в себя генерирование точек данных таким образом, что каждая точка данных карты представляет напряженность измеренного магнитного поля в каждом из трех ортогональных направлений. Распознавание множества точек данных, соответствующих заданному пространственному образцу, для каждого из трех ортогональных направлений может включать в себя, распознавание множества точек данных, соответствующих заданному пространственному образцу напряженности магнитного поля, и местоположения вблизи поверхности ферромагнитного материала, соответствующего множеству точек данных, таким образом выполняя распознавание трех местоположений вблизи поверхности ферромагнитного материала. Дополнительно, уточненное местоположение вблизи поверхности ферромагнитного материала можно рассчитать исходя из трех распознанных местоположений. Выдача местоположения может включать в себя выдачу уточненного местоположения.[0026] Measuring a magnetic field may include measuring a magnetic field using a plurality of magnetometers. Each magnetometer from a plurality of magnetometers may include three orthogonally oriented magnetometers. The generation of data points may include generating data points such that each map data point represents a measured magnetic field strength in each of three orthogonal directions. Recognizing a plurality of data points corresponding to a given spatial pattern for each of the three orthogonal directions may include recognizing a plurality of data points corresponding to a given spatial pattern of magnetic field strength and a location near the surface of the ferromagnetic material corresponding to the plurality of data points, thereby performing recognition three locations near the surface of the ferromagnetic material. Additionally, the specified location near the surface of the ferromagnetic material can be calculated based on three recognized locations. Issuing a location may include issuing an updated location.
[0027] Множество значений пространственных производных можно рассчитать исходя из точек данных карты. Распознавание множества точек данных, соответствующих заданному пространственному образцу, может включать в себя распознавание множества точек данных, соответствующих заданному пространственному образцу напряженности магнитного поля, исходя из множества значений пространственных производных.[0027] A plurality of spatial derivative values can be calculated from map data points. Recognition of a plurality of data points corresponding to a given spatial pattern may include recognition of a plurality of data points corresponding to a given spatial pattern of magnetic field strength based on a plurality of spatial derivatives.
[0028] Распознавание множества точек данных, соответствующих заданному пространственному образцу, может включать в себя распознавание множества точек данных, которые соответствуют потере части ферромагнитного материала в результате коррозии или эрозии.[0028] Recognizing a plurality of data points corresponding to a given spatial pattern may include recognizing a plurality of data points that correspond to the loss of a portion of the ferromagnetic material as a result of corrosion or erosion.
[0029] Распознавание множества точек данных, соответствующих заданному пространственному образцу, может включать в себя распознавание множества точек данных, которые соответствуют трещине в ферромагнитном материале.[0029] Recognizing a plurality of data points corresponding to a given spatial pattern may include recognizing a plurality of data points that correspond to a crack in a ferromagnetic material.
[0030] Еще один вариант осуществления настоящего изобретения предусматривает компьютерный программный продукт для обнаружения дефектов в ферромагнитном материале. Компьютерный программный продукт включает в себя некратковременный компьютерочитаемый носитель. Компьютерочитаемый программный код хранится на носителе. Компьютерочитаемый программный код включает в себя измерительный модуль, модуль генерации точек данных, модуль распознавания дефекта и модуль выдачи местоположения дефекта.[0030] Another embodiment of the present invention provides a computer program product for detecting defects in ferromagnetic material. A computer program product includes a non-short-term computer-readable medium. Computer-readable program code is stored on the medium. The computer-readable program code includes a measurement module, a data point generation module, a defect recognition module, and a defect location issuing module.
[0031] Измерительный модуль выполнен с возможностью приема данных магнитного поля от множества магнитометров, размещенных вблизи поверхности ферромагнитного материала. Множество магнитометров выполнены с возможностью измерения магнитного поля, созданного ферромагнитным материалом. Множество магнитометров также выполнены с возможностью генерации данных магнитного поля. Данные магнитного поля базируются на измеренном магнитном поле. Каждый магнитометр из множества магнитометров неподвижно закреплен в положении относительно ферромагнитного материала.[0031] The measurement module is configured to receive magnetic field data from a plurality of magnetometers located near the surface of the ferromagnetic material. Many magnetometers are configured to measure the magnetic field created by the ferromagnetic material. Many magnetometers are also configured to generate magnetic field data. Magnetic field data is based on the measured magnetic field. Each magnetometer from a plurality of magnetometers is fixedly fixed in position relative to the ferromagnetic material.
[0032] Модуль генерации точек данных выполнен с возможностью генерации точек данных двумерной карты исходя из измеренного магнитного поля. Каждая точка данных соответствует соответствующему местоположению на поверхности ферромагнитного материала. Каждая точка данных представляет напряженность измеренного магнитного поля вблизи местоположения.[0032] The data point generation module is configured to generate data points of a two-dimensional map based on the measured magnetic field. Each data point corresponds to a corresponding location on the surface of the ferromagnetic material. Each data point represents a measured magnetic field near a location.
[0033] Модуль распознавания дефекта выполнен с возможностью распознавания множества точек данных, соответствующих заданному пространственному образцу напряженности магнитного поля на двумерной карте. Модуль выдачи местоположения дефекта выполнен с возможностью выдачи местоположения вблизи поверхности ферромагнитного материала, соответствующего множеству точек данных.[0033] The defect recognition module is configured to recognize a plurality of data points corresponding to a given spatial pattern of magnetic field strength on a two-dimensional map. The defect location issuing module is configured to provide a location near the surface of the ferromagnetic material corresponding to the plurality of data points.
КРАТКОЕ ОПИСАНИЕ ЧЕРТЕЖЕЙBRIEF DESCRIPTION OF THE DRAWINGS
[0034] Настоящее изобретение будет более понятным со ссылкой на следующее подробное описание конкретных вариантов осуществления изобретения в сочетании с чертежами, на которых:[0034] The present invention will be better understood with reference to the following detailed description of specific embodiments of the invention in combination with the drawings, in which:
[0035] На фиг. 1 представлен вид в перспективе гипотетической трубы и вид в поперечном сечении части трубы, как это известно из уровня техники.[0035] FIG. 1 is a perspective view of a hypothetical pipe and a cross-sectional view of a portion of the pipe, as is known in the art.
[0036] На фиг. 2 представлен вид в перспективе гипотетической изогнутой трубы, как это известно из уровня техники.[0036] FIG. 2 is a perspective view of a hypothetical bent pipe, as is known in the art.
[0037] На фиг. 3 схематически показано магнитное поле, созданное гипотетическим магнитным диполем, как это известно из уровня техники.[0037] FIG. Figure 3 schematically shows the magnetic field created by a hypothetical magnetic dipole, as is known in the art.
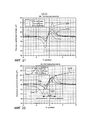
[0038] Фиг. 4 содержит графики гипотетических примерных напряженностей Вх, By и Bz поля, измеренного при помощи магнитометра вдоль трех осей вдоль линии по фиг. 3.[0038] FIG. 4 contains plots of hypothetical exemplary field strengths Bx, By, and Bz measured with a magnetometer along three axes along the line of FIG. 3.
[0039] На фиг. 5 схематически показана гипотетическая пластина из ферромагнитного материала, как это известно из уровня техники.[0039] FIG. 5 schematically shows a hypothetical plate of ferromagnetic material, as is known in the art.
[0040] На фиг. 6 схематически показана пластина по фиг. 5 в виде множества мелких выровненных магнитных диполей, как раскрывается согласно вариантам осуществления настоящего изобретения.[0040] FIG. 6 schematically shows the plate of FIG. 5 in the form of a plurality of small aligned magnetic dipoles, as disclosed according to embodiments of the present invention.
[0041] На фиг. 7 схематически показана пластина по фиг. 5 с дефектом на своей поверхности.[0041] FIG. 7 schematically shows the plate of FIG. 5 with a defect on its surface.
[0042] На фиг. 8 схематически показана гипотетическая труба, показывающая артефакт геликоидальной толщины в результате ее изготовлении, как это известно из уровня техники.[0042] FIG. 8 is a schematic illustration of a hypothetical pipe showing an artifact of a helicoidal thickness as a result of its manufacture, as is known in the art.
[0043] На фиг. 9 схематически показана труба по фиг. 8 после ее мысленного разрезания и развальцовки, как это известно из уровня техники.[0043] FIG. 9 schematically shows the pipe of FIG. 8 after its mental cutting and flaring, as is known from the prior art.
[0044] Фиг. 10 содержит график одной составляющей магнитного поля вокруг реальной трубы, имеющей дефект в своей наружной поверхности, согласно варианту осуществления настоящего изобретения.[0044] FIG. 10 contains a graph of one component of a magnetic field around a real pipe having a defect in its outer surface, according to an embodiment of the present invention.
[0045] На фиг. 11 представлен вид сбоку блока магнитометрических датчиков согласно варианту осуществления настоящего изобретения.[0045] FIG. 11 is a side view of a magnetometric sensor unit according to an embodiment of the present invention.
[0046] На фиг. 12 схематически показан комплект блоков магнитометрических датчиков, прикрепленных к трубе согласно варианту осуществления настоящего изобретения.[0046] FIG. 12 schematically shows a set of magnetometric sensor blocks attached to a pipe according to an embodiment of the present invention.
[0047] На фиг. 13 схематически показан комплект блоков магнитометрических датчиков, прикрепленных к трубе согласно варианту осуществления настоящего изобретения.[0047] FIG. 13 schematically shows a set of magnetometric sensor blocks attached to a pipe according to an embodiment of the present invention.
[0048] На фиг.14 представлен схематический вид в перспективе решетки магнитометрических датчиков, размещенных по окружности вокруг трубы согласно варианту осуществления настоящего изобретения.[0048] FIG. 14 is a schematic perspective view of an array of magnetometric sensors arranged circumferentially around a pipe according to an embodiment of the present invention.
[0049] На фиг. 15 представлен схематический вид в перспективе пары монтажных плат, удерживающих магнитометры, например, в каждом элементе решетки магнитометрических датчиков по фиг.14 согласно варианту осуществления настоящего изобретения.[0049] FIG. 15 is a schematic perspective view of a pair of circuit boards holding magnetometers, for example, in each array element of the magnetometric sensors of FIG. 14 according to an embodiment of the present invention.
[0050] На фиг. 16 представлен схематический вид в перспективе колец магнитометрических датчиков, размещенных около трубы согласно варианту осуществления настоящего изобретения.[0050] FIG. 16 is a schematic perspective view of rings of magnetometric sensors arranged near a pipe according to an embodiment of the present invention.
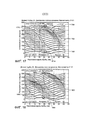
[0051] Фиг. 17 и 18 содержат графики магнитометрических данных вдоль двух соответствующих размеров реальной трубы согласно варианту осуществления настоящего изобретения.[0051] FIG. 17 and 18 contain graphs of magnetometric data along two corresponding dimensions of a real pipe according to an embodiment of the present invention.
[0052] Фиг. 19 и 20 содержат графики производных, рассчитанных исходя из графиков по фиг.17 и 18, соответственно, согласно варианту осуществления настоящего изобретения.[0052] FIG. 19 and 20 contain graphs of derivatives calculated from the graphs of FIGS. 17 and 18, respectively, according to an embodiment of the present invention.
[0053] На фиг. 21 представлен график напряженности магнитного поля для трех смоделированных дефектов одинакового диаметра, но имеющих различную глубину, согласно варианту осуществления настоящего изобретения.[0053] FIG. 21 is a graph of magnetic field strength for three simulated defects of the same diameter, but having different depths, according to an embodiment of the present invention.
[0054] На фиг. 22 представлен график напряженности магнитного поля для трех смоделированных дефектов, имеющих одинаковую глубину, но различные диаметры, согласно варианту осуществления настоящего изобретения.[0054] FIG. 22 is a graph of magnetic field strength for three simulated defects having the same depth but different diameters, according to an embodiment of the present invention.
[0055] На фиг. 23 представлен график напряженности магнитного поля вдоль оси х вблизи дефекта в трубе согласно варианту осуществления настоящего изобретения.[0055] In FIG. 23 is a graph of magnetic field along the x axis near a defect in a pipe according to an embodiment of the present invention.
[0056] На фиг. 24 представлен график напряженности магнитного поля вдоль оси z вблизи дефекта в трубе согласно варианту осуществления настоящего изобретения.[0056] FIG. 24 is a graph of magnetic field along the z axis near a defect in a pipe according to an embodiment of the present invention.
[0057] На фиг. 25 представлен график напряженности магнитного поля по фиг. 23 после нормализации согласно варианту осуществления настоящего изобретения.[0057] FIG. 25 is a graph of the magnetic field strength of FIG. 23 after normalization according to an embodiment of the present invention.
[0058] На фиг. 26 показан схематический вид в перспективе трубы и зазор между детектором или устройством обнаружения и дефектом в трубе согласно варианту осуществления настоящего изобретения.[0058] FIG. 26 is a schematic perspective view of a pipe and the gap between the detector or detection device and the defect in the pipe according to an embodiment of the present invention.
[0059] На фиг. 27 представлен график, показывающий различия мощности сигнала от дефекта на внутренней части трубы и мощности сигнала от дефекта на внешней части трубы согласно варианту осуществления настоящего изобретения.[0059] FIG. 27 is a graph showing differences in signal strength from a defect in an inner part of a pipe and signal strength from a defect in an outer part of a pipe according to an embodiment of the present invention.
[0060] На фиг. 28 представлен график поверхности, полученный в результате вычитания, показывающий одну ось магнитного поля в соответствии с анализом во времени, согласно варианту осуществления настоящего изобретения.[0060] FIG. 28 is a graph of the surface obtained by subtraction, showing one axis of the magnetic field in accordance with a time analysis according to an embodiment of the present invention.
[0061] На фиг. 29 и 30 схематически представлены виды в перспективе устройства для выполнения физического сканирования изделий в соответствии с соответствующими вариантами осуществления настоящего изобретения.[0061] FIG. 29 and 30 are schematic perspective views of a device for performing physical scanning of products in accordance with respective embodiments of the present invention.
[0062] На фиг. 31 представлена схематическая блок-схема удаленного магнитометрического датчика, осуществляющего беспроводную связь с базовой станцией согласно варианту осуществления настоящего изобретения.[0062] FIG. 31 is a schematic block diagram of a remote magnetometric sensor wirelessly communicating with a base station according to an embodiment of the present invention.
ОСУЩЕСТВЛЕНИЯ ИЗОБРЕТЕНИЯDETAILED DESCRIPTION OF THE INVENTION
[0063] Варианты осуществления настоящего изобретения позволяют обнаруживать дефекты в изделиях, содержащих ферромагнитные материалы, не требуя введения энергии в материалы и без необходимости удаления теплоизоляции, покрытий поверхности и тому подобного с материалов или изделий. Ферромагнитные материалы в изделиях создают магнитные поля. Варианты осуществления настоящего изобретения обнаруживают и определяют характеристики дефектов в изделиях путем анализа магнитных полей изделий с целью нахождения участков магнитных полей, которые характерным образом отличаются от остаточных магнитных полей, создаваемых участками изделий, не имеющими дефектов. Участки магнитных полей, которые отличаются характерным образом, соответствуют местоположениям дефектов. Остаточные магнитные поля соответствуют участкам изделий, находящимся на удалении от дефектов. Характеристика дефекта может включать в себя объем материала, потерянного из-за каждого дефекта, и/или ширину и/или глубину каждого дефекта. Проблема любого магнитометрического подхода состоит в том, что собственное остаточное магнитное поле изделия, как правило, является неоднородным и отражает отклонения материала и изготовления по всему изделию. Ключевой задачей для данных способов является выделение магнитной "регистрируемой характеристики" дефекта из собственного "шума" в остаточном поле изделия.[0063] Embodiments of the present invention make it possible to detect defects in products containing ferromagnetic materials without requiring the introduction of energy into the materials and without the need to remove thermal insulation, surface coatings, and the like from materials or products. Ferromagnetic materials in products create magnetic fields. Embodiments of the present invention detect and determine the characteristics of defects in products by analyzing the magnetic fields of the products in order to find areas of magnetic fields that are distinctively different from residual magnetic fields generated by areas of products that do not have defects. Areas of magnetic fields that differ in a characteristic manner correspond to the locations of the defects. Residual magnetic fields correspond to areas of products located at a distance from defects. A defect characteristic may include the amount of material lost due to each defect and / or the width and / or depth of each defect. The problem with any magnetometric approach is that the intrinsic residual magnetic field of the product is usually heterogeneous and reflects deviations of the material and workmanship throughout the product. The key task for these methods is the separation of the magnetic "recorded characteristic" of the defect from its own "noise" in the residual field of the product.
ОбзорOverview
[0064] В некоторых вариантах осуществления двумерную решетку магнитометрических датчиков размещают параллельно внешней поверхности изделия, подлежащего анализу. Решетка магнитометрических датчиков собирает данные, обеспечивающие возможность создания двумерной карты магнитометрических данных (карты магнитного поля). В данном контексте, "мат" из магнитометрических датчиков, обернутый вокруг круглого поперечного сечения трубы или другого непланарного изделия, считается двумерным.[0064] In some embodiments, a two-dimensional array of magnetometric sensors is arranged parallel to the outer surface of the article to be analyzed. The array of magnetometric sensors collects data that enables the creation of a two-dimensional map of magnetometric data (magnetic field maps). In this context, a “mat” of magnetometric sensors wrapped around a circular cross-section of a pipe or other non-planar product is considered two-dimensional.
[0065] В некоторых вариантах осуществления изделие физически сканируют вдоль одного размера при помощи одномерной решетки магнитометрических датчиков, тем самым создавая двумерную карту магнитометрических данных. В некоторых вариантах осуществления изделие подвергают растровому, спиральному или другому сканированию вдоль более чем одного линейного размера при помощи одного магнитометрического датчика или небольшой группы магнитометрических датчиков для создания двумерной карты магнитометрических данных.[0065] In some embodiments, the article is physically scanned along the same size using a one-dimensional array of magnetometric sensors, thereby creating a two-dimensional map of the magnetometric data. In some embodiments, the article is subjected to raster, spiral, or other scanning along more than one linear dimension using a single magnetometric sensor or a small group of magnetometric sensors to create a two-dimensional map of magnetometric data.
[0066] Ферромагнитный материал в изделии создает магнитное поле. Магнитные поля являются векторными величинами, характеризующимися как напряженностью, так и направлением. Карта магнитометрических данных (карта магнитного поля) представляет напряженность магнитного поля в каждой из множества точек над поверхностью изделия. Карта магнитного поля может отображать одну, две или три составляющие 3-мерного вектора напряженности магнитного поля.[0066] The ferromagnetic material in the product creates a magnetic field. Magnetic fields are vector quantities characterized by both intensity and direction. A magnetometric data map (magnetic field map) represents the magnetic field strength at each of a plurality of points above the surface of the product. A magnetic field map can display one, two or three components of a 3-dimensional magnetic field vector.
[0067] В некоторых вариантах осуществления поиск магнитометрических данных ведут по существу для любого из нескольких заданных образцов (форм). Область, в которой напряженность магнитного поля или любая из составляющих 3-мерного магнитного поля изменяется в пространстве в соответствии с одним из заданных образцов, соответствует местоположению дефекта. В соответствии с одним из данных заданных образцов, вдоль прямой линии магнитное поле начинается с остаточного уровня, и затем напряженность возрастает до пикового значения относительно остаточного, затем напряженность падает до впадины ниже остаточного, и затем возвращается на остаточный уровень, в некоторой степени напоминая по форме один цикл синусоиды.[0067] In some embodiments, magnetometric data searches are conducted for substantially any of several predetermined samples (forms). The area in which the magnetic field strength or any of the components of the 3-dimensional magnetic field varies in space in accordance with one of the specified samples corresponds to the location of the defect. According to one of the data of the given samples, along a straight line, the magnetic field begins with a residual level, and then the tension increases to a peak value relative to the residual, then the tension drops to a depression below the residual, and then returns to the residual level, somewhat resembling in shape one sine wave cycle.
[0068] В соответствии с другим одним из этих заданных образцов, вдоль прямой линии магнитное поле начинается с остаточного уровня, и затем напряженность возрастает до пикового значения относительно остаточного, затем напряженность падает до впадины ниже остаточного, и затем напряженность возрастает до второго пика относительно остаточного, и затем возвращается на остаточный уровень, в некоторой степени напоминая по форме один и половину циклов косинусоиды.[0068] According to another one of these predetermined patterns, along a straight line, the magnetic field starts from a residual level, and then the tension rises to a peak relative to the residual, then the tension drops to a depression below the residual, and then the tension rises to a second peak relative to the residual , and then returns to the residual level, somewhat resembling in shape one and half cycles of the cosine wave.
[0069] Как уже отмечалось, остаточное магнитное поле соответствует участкам изделия, находящимся на удалении от любого дефекта. Однако из-за того, что изделие не является абсолютно однородным, остаточное поле имеет множество параметров, которые могут маскировать наличие регистрируемой характеристики дефекта. Выполняя поиск регистрируемых характеристик дефекта при измерениях магнитного поля, можно распознать местоположение дефектов, выполняя сравнение с не дефектными признаками в остаточном поле. Данный тип анализа, в котором магнитные поля дефекта(-ов) отличают от остаточного поля, упоминается в качестве средства обнаружения дефектов, как "пространственный анализ."[0069] As already noted, the residual magnetic field corresponds to areas of the product located at a distance from any defect. However, due to the fact that the product is not completely homogeneous, the residual field has many parameters that can mask the presence of a detected defect characteristic. By searching for recorded defect characteristics during magnetic field measurements, one can recognize the location of defects by comparing them with non-defective features in the residual field. This type of analysis, in which the magnetic fields of the defect (s) are distinguished from the residual field, is referred to as a means of detecting defects as "spatial analysis."
[0070] В некоторых вариантах осуществления магнитометрические данные изделия собирают, когда изделие не было в употреблении или в какой-либо другой момент времени. Магнитометрические данные сохраняют, и впоследствии магнитометрические данные для того же участка изделия собирают снова и сравнивают два набора данных. Различия между двумя наборами данных представляют возможные дефекты. Данный тип анализа, в котором наборы данных собирают в различные моменты времени для определения разницы между наборами данных, упоминается как "анализ во времени". Тогда возможные дефекты можно анализировать на предмет регистрируемых характеристик дефектов, как в пространственном анализе.[0070] In some embodiments, the magnetometric data of the article is collected when the article was not in use or at some other point in time. The magnetometric data is stored, and subsequently the magnetometric data for the same section of the product is collected again and two sets of data are compared. The differences between the two datasets represent possible defects. This type of analysis, in which data sets are collected at different points in time to determine the difference between data sets, is referred to as "time analysis". Then possible defects can be analyzed for recorded characteristics of defects, as in spatial analysis.
[0071] В некоторых вариантах осуществления множество решеток магнитометрических датчиков прикрепляют к изделию, подлежащему анализу, и оставляют прикрепленными к изделию по существу на весь срок его эксплуатации или на другой длительный период времени. Каждая такая решетка зафиксирована на изделии дискретно. Каждая решетка может включать в себя источник электроэнергии, обеспечивающий электрическую энергию для работы решетки. Решетки могут соединяться между собой при помощи проводной или беспроводной сети. Сеть может использовать протокол обмена сообщениями, алгоритм маршрутизации, управление синхронизацией и другие аспекты, которые обеспечивают возможность работы линейной сети, включающей в себя сотни узлов с более чем десятью сетевыми сегментами, при этом потребляя очень мало энергии, то есть способной получать питание от источника аккумулированной электроэнергии.[0071] In some embodiments, a plurality of magnetometric sensor arrays are attached to the article to be analyzed and left attached to the article for substantially the entire life of the instrument or for another long period of time. Each such lattice is fixed on the product discretely. Each grating may include an electric power source providing electrical energy for the operation of the grating. The grilles can be interconnected using a wired or wireless network. A network can use a messaging protocol, routing algorithm, synchronization control, and other aspects that make it possible to operate a linear network that includes hundreds of nodes with more than ten network segments, while consuming very little energy, that is, it can receive power from an accumulated source electricity.
[0072] Решетки магнитометрических датчиков через сеть посылают данные на базовую станцию, которая анализирует данные с целью обнаружения дефектов. Базовая станция может быть соединена с распределенной управляющей системой, системой управления станцией или другой внешней системой. Внешняя система может запрашивать базовую станцию информацию о дефектах или подавать базовой станции команду на инициирование обнаружения дефектов. В случае необходимости или в качестве альтернативы, базовая станция может уведомить внешнюю систему о дефектах без запроса от внешней системы. Аналогичным образом базовая станция может подать сигнал тревоги, например, включить свет, включить звуковой сигнализатор, послать сообщение электронной почты или инициировать телефонный вызов и воспроизвести предварительно записанное или синтезированное голосовое сообщение, если она обнаруживает дефект.[0072] The array of magnetometric sensors through the network send data to the base station, which analyzes the data in order to detect defects. The base station may be connected to a distributed control system, a station control system, or other external system. The external system may request defect information from the base station or instruct the base station to initiate defect detection. If necessary or alternatively, the base station can notify the external system of defects without a request from the external system. Similarly, the base station can give an alarm, for example, turn on the light, turn on the buzzer, send an email message or initiate a phone call and play a pre-recorded or synthesized voice message if it detects a defect.
[0073] Как уже отмечалось, для сбора магнитометрических данных решетка магнитометрических датчиков может быть закреплена на изделии, либо изделия могут быть физически отсканированы путем перемещения магнитометрических датчиков относительно изделий с целью сбора магнитометрических данных. В любом случае, для обнаружения дефектов магнитометрические данные можно анализировать во времени или в пространстве.[0073] As already noted, to collect magnetometric data, the array of magnetometric sensors can be mounted on the product, or the products can be physically scanned by moving magnetometric sensors relative to the products in order to collect magnetometric data. In any case, to detect defects, the magnetometric data can be analyzed in time or in space.
ДефектыDefects
[0074] Как уже отмечалось, дефектами могут быть потери материала из-за коррозии и/или эрозии. Примеры и варианты осуществления описаны в данном документе применительно к трубам. Однако данные варианты осуществления и примеры подходят для других типов изделий, например, плоских листов, корпусов судов, резервуаров/сосудов для хранения, балок, колонн и тому подобного.[0074] As already noted, defects may be loss of material due to corrosion and / or erosion. Examples and embodiments are described herein with reference to pipes. However, these embodiments and examples are suitable for other types of products, for example, flat sheets, ship hulls, storage tanks / vessels, beams, columns, and the like.
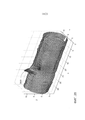
[0075] На фиг.1 представлен вид в перспективе гипотетической трубы 100 и поперечное сечение (сечение А-А) трубы 100. Почти любая труба подвержена развитию дефектов в результате коррозии или эрозии на внешней поверхности трубы, как проиллюстрировано на примере 102, например, в результате кислотного дождя, разлива химического вещества или случайного или преднамеренного физического повреждения. Большинство труб также подвержено развитию дефектов на внутренних поверхностях труб, как проиллюстрировано на примере 104, 106 и 108. Например, песок, поступающий из нефтяной или газовой скважины, обычно переносится вдоль нижней части трубы и может, вследствие этого, за счет трения изнашивать нижнюю часть трубы, как проиллюстрировано на примере 104. Области внутренних стенок трубы, где верхняя поверхность текучей среды внутри трубы встречается с внутренней стенкой трубы, как проиллюстрировано на примере 106 и 108, являются обычными местами коррозии. В трубе могут также развиваться дефекты в пределах толщины стенки трубы, как проиллюстрировано на примере 110.[0075] FIG. 1 is a perspective view of a
[0076] Эрозия часто происходит внутри и немного вниз по потоку от изгиба в трубе 200 в месте, обозначенном пунктирной линией 202 на фиг. 2. Турбулентность, связанная с изменением направления потока, создает возможные места для коррозии. Стрелки показывают направление потока внутри трубы 200. Расширения и сужения в трубопроводах (не показанные) не только создают возможные места для эрозии, но они также имеют тенденцию создавать турбулентность ниже по потоку и, следовательно, приводят к возникновению дефектов вблизи к областям турбулентности.[0076] Erosion often occurs inside and slightly downstream of the bend in
Магнитометры и обнаружение дефектовMagnetometers and defect detection
[0077] На фиг.3 схематически показано магнитное поле, созданное гипотетическим магнитным диполем 300. Силовые линии магнитного поля, проиллюстрированные линиями 302, представляют собой магнитное поле. Магнитный диполь 300 лежит в плоскости 304, и для простоты показаны только силовые линии магнитного поля 300 в плоскости 304.[0077] Fig. 3 schematically shows a magnetic field generated by a hypothetical
[0078] Векторные магнитометры измеряют составляющие вектора магнитного поля. То есть векторный магнитометр измеряет напряженность магнитного поля, направленную вдоль оси магнитометра. Трехосевой магнитометр 306 измеряет напряженность магнитного поля вдоль трех осей X, Y и Z. Если магнитометр 306 проходит вдоль линии 308 параллельно магнитному диполю 302, магнитометр 306 измеряет изменение магнитного поля вдоль линии 308. Например, датчик по оси X измеряет различные напряженности поля, которые представляют составляющие магнитных векторов по оси X, представленные стрелками А, В, С, D, Е, F, G и Н. Фиг. 4 содержит графики гипотетических примерных напряженностей Вх, By и Bz поля, измеренных при помощи магнитометра 306 вдоль трех осей вдоль линии 308. Необходимо отметить, что график Вх напоминает график косинусоиды, а график Bz напоминает график синусоиды. Данные формы являются характеристиками магнитного поля вблизи отдельного магнитного диполя.[0078] Vector magnetometers measure the components of a magnetic field vector. That is, a vector magnetometer measures the magnetic field directed along the axis of the magnetometer. A three-
[0079] На фиг. 5 схематически показана гипотетическая пластина из ферромагнитного материала 500. Пластину 500 можно рассматривать, как составленную из множества мелких выровненных магнитных диполей, проиллюстрированных магнитными диполями 602 и 604, как схематически показано на фиг.6. Силовые линии магнитного поля проходят от каждого маленького магнитного диполя к его соседям спереди и сзади, в основном по прямым линиям, и силовые линии магнитного поля выходят из пластины 500 на ее концах 502 и 504, по существу как проиллюстрировано на фиг. 3. Через верх, низ или боковую часть пластины 500 выходит лишь несколько линий магнитного поля или ни одна из них.[0079] FIG. 5, a hypothetical plate of
[0080] Однако, если пластина содержит дефект, некоторая часть материала потеряна, как проиллюстрировано на фиг. 7 на примере дефекта 700 на поверхности блока 702. Следовательно, один или более небольших магнитных диполей, таких как, магнитные диполи 602 или 604, потеряны, и полученное в результате асимметричное расположение остальных магнитных диполей приводит к тому, что некоторые силовые линии магнитного поля выходят из блока через верх, низ и/или боковые части блока 702. Соответственно, регистрируемая характеристика дефекта, то есть, отсутствующий объем ферромагнитного материала, может рассматриваться как аппроксимированный эквивалентным объемом противоположно ориентированных магнитных диполей. Даже если потеряны только внутренние, то есть, не поверхностные магнитные диполи, полученное в результате асимметричное расположение остальных магнитных диполей приводит к тому, что некоторые силовые линии магнитного поля выходят из блока через верх, низ и/или боковую часть блока 702.[0080] However, if the plate contains a defect, some of the material is lost, as illustrated in FIG. 7 by the example of a
[0081] Локальное магнитное поле вблизи потерянных магнитных диполей аналогично магнитному полю, описанному выше в отношении фиг. 3 и 4. Следовательно, местоположение дефекта можно найти, определив местоположение участка магнитного поля, созданного пластиной 702, имеющего форму, аналогичную форме графика Вх или By по фиг. 4. Таким образом, основные формы графиков Вх и By можно использовать в качестве магнитных регистрируемых характеристик дефектов.[0081] The local magnetic field near the lost magnetic dipoles is similar to the magnetic field described above with respect to FIG. 3 and 4. Therefore, the location of the defect can be found by locating the portion of the magnetic field created by the
Обнаружение дефектов трубыPipe defect detection
[0082] Трубу изготавливают различными способами. Каждый способ оставляет после себя признаки неоднородности, связанные либо с составом, толщиной, термической историей, либо с каким-либо другим артефактом. Все они обладают возможностью быть причиной неоднородности внутреннего остаточного магнитного поля изделия и иметь такие признаки в отношении размера и уровня сложности, что нахождение регистрируемой характеристики дефекта оказывается непростым. Обычным артефактом изготовления труб является спиральный (геликоидальный) рисунок толщины, проходящий вниз по длине трубы. На фиг.8 схематически показана труба 800, иллюстрирующая артефакт 802 геликоидальной толщины в результате ее изготовления. В принципе, трубу 800 можно разрезать вдоль линии 804, параллельной продольной оси, а затем раскатать в плоский лист 900, как это схематически проиллюстрировано на фиг. 9. Этот лист 900 можно анализировать, как описано выше со ссылкой на фиг.3-7.[0082] The pipe is manufactured in various ways. Each method leaves behind signs of heterogeneity associated either with the composition, thickness, thermal history, or with some other artifact. All of them have the ability to be the cause of the heterogeneity of the internal residual magnetic field of the product and to have such signs with respect to size and complexity that finding the registered characteristic of the defect is not easy. A common pipe manufacturing artifact is a spiral (helicoidal) thickness pattern extending down the length of the pipe. FIG. 8 schematically shows a
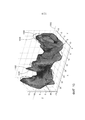
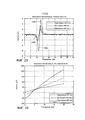
[0083] Фиг.10 содержит график х-составляющей магнитного поля трубы фактическим диаметром около 4,5 дюйма (114,3 мм), имеющей дефект размером 1 дюйм × 1 дюйм × 0,06 дюйма (25,4 мм × 25,4 мм × 1,5 мм) на своей наружной поверхности. График представлен в виде деформированной поверхности 1000. Радиальное расстояние до поверхности 1000 от продольной оси 1002 трубы показывает напряженность х-составляющей магнитного поля трубы.[0083] Figure 10 contains a graph of the x-component of the magnetic field of the pipe with an actual diameter of about 4.5 inches (114.3 mm) having a defect of
[0084] Процессы изготовления трубы оставляют после себя артефакты, отображенные в магнитном поле. Часто наблюдаемый в поле спиральный рисунок, обусловленный процессами изготовления в виде признака 802 (фиг. 8 и 9), очевиден по фиг. 10, где гребень напряженности магнитного поля в пространственном отношении соответствует спиральному признаку изготовления, как показано пунктирной спиральной линией 1004.[0084] Pipe manufacturing processes leave artifacts displayed in a magnetic field. The spiral pattern often observed in the field, due to the manufacturing processes in the form of feature 802 (FIGS. 8 and 9), is obvious from FIG. 10, where the crest of the magnetic field in spatial terms corresponds to a spiral feature of manufacture, as shown by the dashed
[0085] На фиг. 10 также ясно виден пик 1006 напряженности магнитного поля. Кроме того, как показано пунктирной линией 1008, форма поверхности вблизи пика 1006 аналогична форме кривой по фиг. 4 и является, вследствие этого, характеристикой дефекта.[0085] FIG. 10, the
[0086] Аналогичные виды анализов можно выполнять с использованием у-составляющей магнитного поля вокруг трубы и z-составляющей магнитного поля. Корреляция местоположений дефектов, измеренных с помощью трех анализов, обеспечивает более точное определение местоположения дефектов, чем анализ только одной составляющей магнитного поля.[0086] Similar types of analyzes can be performed using the y-component of the magnetic field around the pipe and the z-component of the magnetic field. Correlation of the location of defects measured using three analyzes provides a more accurate determination of the location of defects than analysis of only one component of the magnetic field.
Решетка датчиковSensor Grid
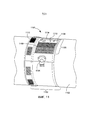
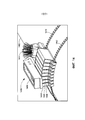
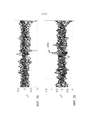
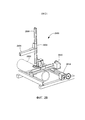
[0087] На фиг. 11 схематически показан один вариант осуществления настоящего изобретения. В данном варианте осуществления блок 1100 магнитометрических датчиков закреплен вокруг трубы 1102. Блок 1100 магнитометрических датчиков включает в себя два полукруглых участка (полукольца), шарнирно соединенных друг с другом. Шарнир расположен на обратной стороне блока 1100 магнитометрических датчиков и поэтому не виден на фиг. 11. Освобождаемая защелка 1104 механически скрепляет два полукольца друг с другом, таким образом зажимая блок 1100 магнитометрических датчиков вокруг трубы 1102. Защелка 1104 прикрепляет блок 1100 магнитометрических датчиков к трубе 1102 достаточно плотно, чтобы предотвратить вращение блока 1100 магнитометрических датчиков вокруг трубы 1102 или перемещение блока 1100 магнитометрических датчиков вдоль трубы 1102 в ответ на силы, которые, как ожидается, могут возникнуть при обычном использовании, например, в промышленной установке. Защелка 1104 может быть снабжена ключом для предотвращения несанкционированного удаления или вмешательства в работу блока 1100 магнитометрических датчиков. Блок 1100 магнитометрических датчиков может быть сконструирован так, чтобы удовлетворять требованиям стандартов ATEX/UL, касающихся взрывобезопасности, а также для защиты от атмосферных воздействий.[0087] FIG. 11 schematically shows one embodiment of the present invention. In this embodiment, the
[0088] Преимущество обеспечено тем, что поскольку блок 1100 магнитометрических датчиков не должен находиться в контакте с изделием, подлежащим измерению, он может быть прикреплен к трубе 1102 поверх любого существующего изоляционного слоя трубы, например, теплоизоляции или покрытия поверхности трубы без удаления изоляционного слоя трубы. При необходимости, дополнительную теплоизоляцию или другой изоляционный слой можно нанести поверх установленного блока 1100 магнитометрических датчиков.[0088] The advantage is that since the
[0089] Участок 1105 внешнего кожуха блока 1100 магнитометрических датчиков на фиг. 11 показан как удаленный, чтобы открыть решетку 1106 магнитометрических датчиков. Каждый магнитометрический датчик в решетке 1106 может быть трехосным магнитометрическим датчиком. Как можно видеть через отверстие 1105 во внешнем кожухе, магнитометрические датчики 1106 размещены вокруг трубы 1102 в виде колец. Каждое кольцо включает в себя несколько магнитометрических датчиков, регулярно расположенных вокруг кольца. Данные внутренние кольца находятся на расстоянии друг от друга в продольном направлении вдоль трубы 1102 через определенные интервалы, по существу, создавая регулярную двумерную решетку магнитометрических датчиков, расположенных параллельно внешней поверхности трубы 1102 и отстоящих от трубы 1102 на фиксированное расстояние, возможно равное нулю. Монтажная плата 1108 включает в себя антенну 1110 и сети связи, которые осуществляют управление магнитометрическими датчиками 1106, сбор данных от магнитометрических датчиков 1106 и осуществляет связь с другими блоками магнитометрических датчиков и/или базовой станцией (не показанной) посредством беспроводной сети передачи данных.[0089]
[0090] Комплект источников 1112 электроэнергии генерирует электричество за счет разницы температур между трубой 1102 и окружающей средой. При необходимости или в качестве альтернативы, источники 1112 электроэнергии могут включать в себя фотоэлектрические элементы и/или любую другую подходящую технологию аккумулирования энергии. При необходимости или в качестве альтернативы можно использовать батарею первичных источников тока с источником или без источника электроэнергии, если потребность в электроэнергии и продолжительность работы таковы, что это является равноценной альтернативой. Аккумуляторные батареи 1114 могут быть включены в состав для сохранения накопленной энергии до тех пор, пока она необходима для монтажной платы 1108. Источники 1112 электроэнергии могут располагаться в кольце, как показано.[0090] A set of
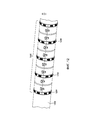
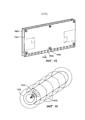
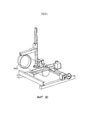
[0091] Расстояние между магнитометрами 1106 можно выбирать таким, чтобы достичь необходимой плотности магнитометров, например, расстояние между магнитометрами около 0,3 дюйма (7,6 мм), то есть, расстояние между смежными трехосевыми магнитометрическими датчиками. Расстояние между магнитометрами можно выбирать на основе минимального размера обнаруживаемого дефекта. Расстояние между магнитометрами должно выбираться так, чтобы наименьший обнаруживаемый дефект перекрывался достаточным количеством трехосевых магнитометрических датчиков, обеспечивая возможность обнаружить форму регистрируемой характеристики дефекта в карте магнитного поля.[0091] The distance between the
[0092] На фиг. 12 схематически показан комплект блоков 1200 магнитометрических датчиков, прикрепленных к трубе 1102. Как показано на фиг. 12, несколько блоков 1200 магнитометрических датчиков можно плотно разместить по всей длине или на участке трубы 1202. В данном варианте осуществления каждое кольцо источника электроэнергии, представленное в качестве примера кольцами 1204, 1206 и 1206 источников электроэнергии, питают электроэнергией два блока магнитометрических датчиков, по одному на каждой стороне кольца источника электроэнергии. Как схематически показано на фиг. 13, комплект блоков 1300 магнитометрических датчиков может быть прикреплен к трубе 1302 и располагаться на расстоянии друг от друга вдоль трубы 1302.[0092] FIG. 12 schematically shows a set of
[0093] На фиг. 14 в крупном масштабе представлен вид решетки 1400 магнитометрических датчиков, согласно другому варианту осуществления. В данном варианте осуществления решетка 1400 магнитометрических датчиков размещена по окружности или частично вокруг трубы 1402, как на фиг. 11-13. Решетка 1400 включает в себя несколько сеточных модулей, примерами которых являются сеточные модули 1404, 1406 и 1408. Однако для ясности на фиг. 14 показано только восемь сеточных модулей. Каждый сеточный модуль 1404-1408 может крепиться с возможностью снятия к паре периферических монтажных колец 1410 и 1412. При необходимости или в качестве альтернативы решетка модулей 1404-1408 может быть заключена внутрь защитного кожуха, как описано в отношении фиг.11-13. В некоторых вариантах осуществления дополнительные сеточные модули крепятся к монтажным кольцам 1410 и 1412, так что труба 1402 окружена сеточными модулями. Однако в других вариантах осуществления, сеточные модули 1404-1408 могут покрывать только участок окружности трубы 1402. В некоторых вариантах осуществления сеточные модули 1404-1408 могут крепиться при помощи электрических штекеров, которые облегчают замену сеточных модулей 1404-1408 в полевых условиях. В некоторых вариантах осуществления сеточные модули 1404-1408 обладают возможностью замены во время работы.[0093] FIG. 14 is a large scale view of the
[0094] Решетка 1400 может получать питание от источника 1414 электроэнергии и может включать в себя монтажную плату 1416. Решетка 1400 включает в себя беспроводной приемопередатчик и антенну (не показаны).[0094] The
[0095] В некоторых вариантах осуществления каждый сеточный модуль 1404-1408 включает в себя пару монтажных плат 1500 и 1502, как показано на фиг. 15. Каждая монтажная плата из пары монтажных плат 1500-1502 включает в себя ряд трехосевых магнитометров, примерами которых являются магнитометры 1504, 1506 и 1508. В некоторых вариантах осуществления, каждая монтажная плата включает в себя 16 трехосевых магнитометров 1504-1508.[0095] In some embodiments, each grid module 1404-1408 includes a pair of
[0096] Каждый магнитометрический датчик 1504-1508 внутри антенного модуля 1500-1502 включает в себя три магнитометра (что является тем же самым, что трехосевой магнитометрический датчик). Три магнитометра могут быть ориентированы взаимно ортогонально, либо они могут быть ориентированы в соответствии с каким-либо другим известным расположением. В данном случае ориентация магнитометра относится к оси основной чувствительности магнитометра. В некоторых вариантах осуществления каждый сеточный модуль 1404-1408 (фиг. 14) включает в себя решетку, например, решетку 16×1 (как на фиг. 15) или решетку 16×16 трехосевых магнитометрических датчиков.[0096] Each magnetometric sensor 1504-1508 inside the antenna module 1500-1502 includes three magnetometers (which is the same as a three-axis magnetometric sensor). The three magnetometers may be oriented mutually orthogonally, or they may be oriented in accordance with some other known arrangement. In this case, the orientation of the magnetometer refers to the axis of the main sensitivity of the magnetometer. In some embodiments, each grid module 1404-1408 (FIG. 14) includes a grid, such as a 16 × 1 grid (as in FIG. 15) or a 16 × 16 grid of three-axis magnetometric sensors.
Поиск по образцу для определения расположения регистрируемых характеристик дефектовSearch by sample to determine the location of the recorded defect characteristics
[0097] Как уже отмечалось, в некоторых вариантах осуществления производится поиск магнитометрических данных любого из нескольких заранее заданных пространственных образцов (регистрируемых характеристик), указывающих на дефект. Образы могут иметь синусоидальную форму и длина (длина волны) синусоиды может быть пропорциональна размеру дефекта. В этом смысле длины волн синусоид в основном априори неизвестны. Как описано выше, кольца1600 магнитометрических датчиков размещены по окружности трубы 1602, создавая регулярную двумерную решетку магнитометрических датчиков, размещенных параллельно внешней поверхности трубы 1602, как схематически показано на фиг. 16. Данная решетка магнитометрических датчиков выдает магнитометрические данные. На фиг. 17 показан график таких магнитометрических данных для реальной трубы. Данные на фиг. 17 изображают составляющие напряженности магнитного поля, измеренные магнитометрами, ориентированными по оси х, то есть, вдоль длины трубы. На фиг. 18 изображены составляющие напряженности магнитного поля, измеренные магнитометрами, ориентированными по оси z, то есть, перпендикулярными (или почти перпендикулярными) к поверхности трубы. График (не показан) изображает составляющие напряженности магнитного поля, измеренные магнитометрами, ориентированными по оси у, то есть, перпендикулярными магнитометрами, ориентированными по оси х и у.[0097] As already noted, in some embodiments, the magnetometric data of any of several predetermined spatial samples (recorded characteristics) indicating a defect is searched. The images can have a sinusoidal shape and the length (wavelength) of the sinusoid can be proportional to the size of the defect. In this sense, the wavelengths of the sine waves are mostly a priori unknown. As described above, magnetometer sensor rings 1600 are arranged around the circumference of the
[0098] Каждый магнитометрический датчик (внутри блока 1100 датчиков) (фиг. 11) размещен в заданном угловом положении ("положении часов"), представленном в качестве примера как 1604 (фиг. 16), вокруг кольца 1600. В варианте осуществления, который генерирует данные для фиг. 17 и 18, каждое кольцо включает в себя 18 магнитометрических датчиков. Однако можно использовать другое количество датчиков. Каждая, в основном горизонтальная, линия, представленная в качестве примера линиями 1700, 1702 и 1704, представляет данные от магнитометра, измеряющего составляющую х в отдельном угловом положении вокруг трубы. Таким образом, вертикальная ось представляет угловое положение вокруг трубы. Горизонтальная ось представляет расстояние вдоль длины трубы. Таким образом, точки вдоль каждой линии 1700-1704 представляют напряженности магнитного поля вдоль длины трубы. Аналогично, на фиг. 18 показана составляющая z магнитного поля в положениях, соотнесенных с данными на фиг. 7. Геликоидальные изменения магнитного поля, обусловленные процессами изготовления труб, очевидны, что отражено в 1710, 1712, 1800 и 1802. Характерные особенности дефекта представлены в 1714, 1716, 1804 и 1806. То, как обнаружен данный дефект, описано ниже.[0098] Each magnetometric sensor (inside the sensor block 1100) (FIG. 11) is placed at a predetermined angular position (“clock position”), exemplified as 1604 (FIG. 16), around the
[0099] Данные, полученные от магнитометров, нуждаются в такой обработке, при которой их непрерывно дифференцируют по пространственным измерениям вдоль трубы и вокруг трубы. Для заполнения пропусков в данных от датчиков, сглаживания и интерполяции данных применяют стандартные подходы, так чтобы можно было рассчитать пространственные частные производные.[0099] The data obtained from the magnetometers needs to be processed in such a way that they are continuously differentiated by spatial measurements along the pipe and around the pipe. To fill in the gaps in the data from the sensors, smoothing and interpolating the data, standard approaches are used so that spatial partial derivatives can be calculated.
[00100] Вдоль каждой линии 1700-1704 на графике на фиг. 17 и аналогично вдоль каждой линии в других двух направлениях составляющей (например, на фиг. 18, которая показывает еще одну из составляющих вектора магнитного поля), рассчитаны пространственные производные (наклоны или скорости изменения). На фиг. 19 и 20 представлены графики производных, рассчитанных на основании графиков на фиг. 17 и 18, соответственно. Стимулом для вычисления производных является то, что, когда регистрируемая характеристика дефекта и остаточное магнитное поле близки по величине, дефекты как правило, имеют меньшую протяженность и они имеют более крутые подъемы и спады. Следовательно, производная обычно усиливает данное более высоко частотное поведение, и дефект отличается как по амплитуде, так и по длине волны, при сравнении с признаками производной остаточного поля. Как видно на фиг. 20, например, большинство кривых имеет умеренную амплитуду (следовательно, умеренные наклоны в сигнале магнитного поля). Это кривые, относящиеся к не дефектным областям. Светло-серые кривые 2000 в центре на фиг. 20 представляют собой две кривые, которые пересекают дефект. Видно, что на данном графике производной данные кривые выделяются по величине от не дефектных (остаточных) областей, обеспечивая дополнительную информацию для алгоритма обнаружения для продолжения работы.[00100] Along each line 1700-1704 in the graph of FIG. 17 and similarly along each line in the other two directions of the component (for example, in FIG. 18, which shows another component of the magnetic field vector), spatial derivatives (slopes or rates of change) are calculated. In FIG. 19 and 20 are graphs of derivatives calculated based on the graphs in FIG. 17 and 18, respectively. The incentive for calculating the derivatives is that when the recorded defect characteristic and residual magnetic field are close in magnitude, the defects tend to have a smaller extent and they have more abrupt rises and falls. Consequently, the derivative usually enhances this higher frequency behavior, and the defect differs in both amplitude and wavelength when compared with the features of the derivative of the residual field. As seen in FIG. 20, for example, most curves have a moderate amplitude (hence moderate slopes in the magnetic field signal). These are curves related to non-defective areas. The light
[00101] Автоматический сопоставитель с образцом осуществляет поиск полученных производных для участков, соответствующих одному из нескольких синусоидальных или косинусоидальных образцов. Каждый образец соответствует различной пространственной длине волны. Используют множество образцов, поскольку, как уже отмечалось, пространственная протяженность дефекта, следовательно, пространственная длина волны синуса и косинуса дефекта априори неизвестны. Образец с длиной волны, которая имеет самую сильную корреляцию с данными магнитного поля, используют для обнаружения и определения характеристик дефекта.[00101] An automatic pattern matching tool searches for derived derivatives for regions corresponding to one of several sinusoidal or cosine samples. Each sample corresponds to a different spatial wavelength. Many samples are used, because, as already noted, the spatial extent of the defect, therefore, the spatial wavelength of the sine and cosine of the defect is a priori unknown. A sample with a wavelength that has the strongest correlation with magnetic field data is used to detect and characterize the defect.
[00102] Местоположения дефектов, определенных в процессе трех отдельных анализов, то есть, для х-, у- и z-составляющих магнитного поля, объединяются для определения окончательного местоположения дефектов и доверительного уровня.[00102] The locations of the defects identified during three separate analyzes, that is, for the x-, y- and z-components of the magnetic field, are combined to determine the final location of the defects and confidence level.
Определение характеристик дефектаDefect Characterization
[00103] После того, как местоположение дефекта обнаружено, дефект может быть охарактеризован с точки зрения объема (количества потерянного материала) и протяженности поверхности (на поверхности трубы или параллельно поверхности трубы, если дефект находится внутри трубы). В некоторых случаях делают предположения об общей форме дефекта. Например, можно считать, что дефект в основном круглый или эллиптический на поверхности трубы или имеет вертикальный профиль некоторого вида. С помощью такого рода предположений можно аппроксимировать площадь и глубину дефекта.[00103] After the location of the defect is found, the defect can be characterized in terms of volume (amount of lost material) and surface extent (on the pipe surface or parallel to the pipe surface if the defect is inside the pipe). In some cases, make assumptions about the general form of the defect. For example, we can assume that the defect is mainly round or elliptical on the surface of the pipe or has a vertical profile of some kind. Using such assumptions, the area and depth of the defect can be approximated.
[00104] Z-составляющая измеренного магнитного поля перпендикулярна поверхности ферромагнитного материала, которую подвергают измерению, как показано на фиг. 21 для трубы. Амплитуда z-составляющей магнитного поля пропорциональна количеству ферромагнитного материала, потерянного в результате дефекта. Таким образом для дефектов, имеющих идентичные диаметры, z-составляющая магнитного поля также пропорциональна глубине дефекта. График на фиг.21 представляет три смоделированных дефекта, все из которых имеют одинаковый диаметр на поверхности трубы (четыре толщины стенки трубы). Кривая 2100 представляет дефект, глубина которого составляет 30% от толщины стенки трубы. Кривая 2102 представляет дефект, глубина которого составляет 15% от толщины стенки трубы. Кривая 2104 представляет дефект, глубина которого составляет 7% от толщины стенки трубы. Как видно из графика, амплитуда z-составляющей магнитного поля связана с глубиной дефекта. Амплитуда z-составляющей в большей степени пропорциональна объему отсутствующего материала и глубина дефекта может быть выведена для набора предположений о типичных формах роста дефекта. Данный результат можно видеть на всех трех осях магнитного поля. Таким образом, с учетом амплитуды составляющих магнитного поля можно определить объем дефекта, предполагая, что известна намагниченность материала, как дополнительно описано ниже. Данная информация, в сочетании с площадью дефекта и профилем глубины, позволяет определить приблизительную глубину дефекта.[00104] The Z component of the measured magnetic field is perpendicular to the surface of the ferromagnetic material, which is measured, as shown in FIG. 21 for the pipe. The amplitude of the z-component of the magnetic field is proportional to the amount of ferromagnetic material lost as a result of the defect. Thus, for defects having identical diameters, the z component of the magnetic field is also proportional to the depth of the defect. The graph in FIG. 21 represents three simulated defects, all of which have the same diameter on the pipe surface (four pipe wall thicknesses).
[00105] Однако, для данной глубины дефекта амплитуда любой из составляющих магнитного поля увеличивается с увеличением площади поверхности дефекта. Следует ожидать, что амплитуда сигнала пропорциональна объему дефекта, и когда площадь поверхности увеличивается на определенную глубину, объем дефекта также увеличивается. На фиг. 22 график представляет z-составляющую магнитного поля для трех смоделированных дефектов, все из которых имеют одинаковую глубину (15% от толщины стенки трубы). Кривая 2200 представляет дефект, диаметр которого составляет 2 дюйма (50,8 мм). Кривая 2202 представляет дефект, диаметр которого составляет 1 дюйм (25,4 мм). Кривая 2204 представляет дефект, диаметр которого составляет 0,5 дюйма (12,7 мм). Как можно видеть, при постоянной глубине дефекта амплитуда z-составляющей магнитного поля увеличивается с увеличением площади поверхности дефекта вследствие увеличения объема дефекта. Однако увеличение следует по предсказуемой кривой (поскольку оно представляет собой объем), как показано на 2206. Следовательно, данное увеличение может быть учтено в математической модели. Расстояние от впадины на графике до пикового значения на графике, обозначенное как "протяженность" 2208, пропорционально протяженности дефекта вдоль направления магнитометров, которые создали данный график.[00105] However, for a given defect depth, the amplitude of any of the components of the magnetic field increases with increasing surface area of the defect. It should be expected that the amplitude of the signal is proportional to the volume of the defect, and when the surface area increases by a certain depth, the volume of the defect also increases. In FIG. 22, the graph represents the z component of the magnetic field for the three simulated defects, all of which have the same depth (15% of the pipe wall thickness).
[00106] Мощность сигналов дефекта пропорциональна как объему отсутствующего материала, так и степени намагничивания материала. Таким образом, определение намагниченности труб полезно для определения объема отсутствующего материала, и, следовательно, полезно для определения характеристик площади и глубины дефекта. Определение магнитного поля не должно выполняться на месте дефекта, но должно выполняться на соседнем, не дефектном месте. Данное измерение локальной "остаточной" намагниченности трубы обеспечивает возможность нормализации сигналов от дефектов, тем самым эффективную калибровку вычислений объема и глубины дефекта. Определив местоположение дефектов, как описано выше, система обнаружения дефектов измеряет уровень остаточной намагниченности трубы, то есть, степень ее намагниченности в области, которая не содержит дефект.[00106] The power of the defect signals is proportional to both the volume of the missing material and the degree of magnetization of the material. Thus, the determination of the magnetization of the pipes is useful for determining the volume of the missing material, and, therefore, is useful for determining the characteristics of the area and depth of the defect. The determination of the magnetic field should not be performed at the location of the defect, but should be performed at an adjacent, non-defective location. This measurement of the local "residual" magnetization of the pipe provides the ability to normalize signals from defects, thereby effectively calibrating the calculation of the volume and depth of the defect. Having determined the location of defects, as described above, the defect detection system measures the level of residual magnetization of the pipe, that is, the degree of its magnetization in the region that does not contain the defect.
[00107] На фиг. 23 представлен график напряженности магнитного поля вдоль оси х (продольно вниз по трубе) вблизи дефекта в трубе. Все три кривые представляют один и тот же дефект трубы и все три кривые показывают регистрируемую характеристику дефекта. Однако прежде чем были получены данные для каждой кривой, трубу намагнитили в разной степени. Для кривой 2300 трубу намагнитили при помощи катушки, работающей при напряженности 690 А/м (ампер/метр). Для кривом 2302 трубу намагнитили при 460 А/м. Для кривой 2304 трубу намагнитили при 230 А/м. Как можно видеть на кривых, сигналы от дефектов увеличиваются прямо пропорционально от намагниченности трубы.[00107] In FIG. 23 is a graph of the magnetic field along the x axis (longitudinally down the pipe) near the defect in the pipe. All three curves represent the same pipe defect and all three curves show the recorded defect characteristic. However, before the data for each curve were obtained, the pipe was magnetized to varying degrees. For
[00108] Один вариант осуществления для измерения напряженности локального остаточного поля в трубе показан графически на фиг. 24. Для труб, имеющих пути утечки (часто из-за неоднородностей, обусловленных процессами изготовления), магнитное поле по оси z (радиальное относительно центральной оси трубы) имеет по длине трубы наклон вниз. Данный наклон пропорционален напряженности магнитного поля. Наклонные кривые на фиг. 24 соответствуют случаям намагниченности, показанным на фиг. 23, с наименьшим наклоном, соответствующим случаю 230 А/м и наибольшим наклоном, соответствующим случаю 690 А/м. В данных условиях z-составляющая магнитного поля обеспечивает независимое измерение остаточной напряженности магнитного поля в трубе.[00108] One embodiment for measuring local residual field strength in a pipe is shown graphically in FIG. 24. For pipes with creepage distances (often due to inhomogeneities caused by manufacturing processes), the magnetic field along the z axis (radial relative to the central axis of the pipe) has a downward inclination along the length of the pipe. This slope is proportional to the magnetic field strength. The oblique curves in FIG. 24 correspond to the magnetization cases shown in FIG. 23, with the smallest slope corresponding to the case of 230 A / m and the largest slope corresponding to the case of 690 A / m. Under these conditions, the z-component of the magnetic field provides an independent measurement of the residual magnetic field strength in the pipe.
[00109] Кривые на фиг. 23 были нормализованы в соответствии со степенью остаточной намагниченности, давая кривые на фиг. 25, которые пронумерованы в соответствии с кривыми на фиг. 23. Как можно видеть из сравнения фиг.23 и 25, амплитуду сигнала можно сделать в значительной мере независимой от степени намагниченности трубы путем нормализации в соответствии со степенью остаточной намагниченности трубы. Таким образом, измеренные магнитные амплитуды могут быть преобразованы в объем и площадь, с последующим расчетом глубины.[00109] The curves in FIG. 23 were normalized according to the degree of remanence, giving the curves in FIG. 25, which are numbered in accordance with the curves of FIG. 23. As can be seen from the comparison of FIGS. 23 and 25, the signal amplitude can be made largely independent of the degree of magnetization of the pipe by normalizing in accordance with the degree of remanent magnetization of the pipe. Thus, the measured magnetic amplitudes can be converted into volume and area, followed by depth calculations.
[00110] Предусмотрены другие способы определение уровня остаточного магнетизма трубы. Например, трубу можно намагнитить до известного уровня, если труба установлена, либо трубу можно намагнитить до произвольного уровня и можно измерить уровень намагниченности. В любом случае, данный уровень намагниченности может быть сохранен в памяти, доступной для базовой станции, и использован в дальнейшем, когда дефекты обнаружены и требуется информация об объеме и глубине. При необходимости или в качестве альтернативы, даже если информация о предыдущем уровне намагниченности трубы не сохранена, то, когда дефекты обнаружены, магнитометрические датчики можно использовать для измерения остаточной намагниченности трубы в одной или более областях вдали от всех обнаруженных дефектов, используя способ наклона, описанный выше, или другие независимые подходы к измерению.[00110] Other methods are provided for determining the level of residual magnetism of the pipe. For example, a pipe can be magnetized to a known level if the pipe is installed, or the pipe can be magnetized to an arbitrary level and the level of magnetization can be measured. In any case, this level of magnetization can be stored in the memory available for the base station and used later when defects are detected and information about the volume and depth is required. If necessary or as an alternative, even if information on the previous level of magnetization of the pipe is not saved, then when defects are detected, magnetometric sensors can be used to measure the residual magnetization of the pipe in one or more areas away from all detected defects using the tilt method described above , or other independent approaches to measurement.
[00111] При использовании в данном документе, "зазор" означает расстояние между дефектом и магнитометром, как схематически показано на фиг. 26. Теория и испытания показывают, что вблизи магнитного диполя мощность сигнала падает согласно закону обратных квадратов. Если датчик имеет зазор, сходный по расстоянию с характерной длиной диполя, диполь выглядит как два независимых полюса и мощность сигнала падает обратно пропорционально расстоянию. По мере увеличения зазора оказывается, что протяженность диполя уменьшается, и он становится точечным источником. В таких условиях теория и испытания показывают, что мощность сигнала снижается согласно закону обратных кубов. Таким образом, небольшие дефекты имеют большие потери сигнала, когда зазор перемещается за пределы размера дефекта, в то время как большой дефект по-прежнему "с выгодой использует" ослабление сигнала по обратному квадрату для больших зазоров. Например, для дефекта квадратной формы со стороной 1 дюйм (25,4 мм) потеря сигнала при увеличении зазора от 0,25 дюйма (6,4 мм) до 2,25 дюйма (51,2 мм) превышает более чем почти на порядок величину амплитуды. Параметры напряженности остаточной намагниченности трубы снижаются медленнее благодаря их большей пространственной протяженности. Тем не менее, устройство и способы, описанные в данном документе, надежно обнаруживают дефекты, которые могут появиться в обычной трубе, например, дефекты в нефте- и газопроводах, на нефтеперерабатывающих заводах и т.п.[00111] As used herein, “clearance” means the distance between the defect and the magnetometer, as schematically shown in FIG. 26. Theory and tests show that near a magnetic dipole the signal power decreases according to the inverse square law. If the sensor has a gap similar in distance to the characteristic length of the dipole, the dipole looks like two independent poles and the signal power decreases inversely with the distance. As the gap increases, it turns out that the length of the dipole decreases, and it becomes a point source. Under such conditions, theory and testing show that the signal power decreases according to the law of inverse cubes. Thus, small defects have large signal losses when the gap moves beyond the size of the defect, while a large defect still “takes advantage” of the squared signal attenuation for large gaps. For example, for a square defect with a side of 1 inch (25.4 mm), the signal loss when the gap increases from 0.25 inch (6.4 mm) to 2.25 inch (51.2 mm) exceeds by more than an order of magnitude amplitudes. The parameters of the residual magnetization of the pipe decrease slower due to their greater spatial extent. However, the device and methods described herein reliably detect defects that may appear in a conventional pipe, for example, defects in oil and gas pipelines, refineries, and the like.
[00112] Дефекты в пределах толщины стенки трубы или на внутренней стенке всегда находятся дальше от магнитометров, чем дефекты на внешней стенке трубы. Однако моделирование и испытания показывают лишь незначительную потерю сигнала от внутреннего дефекта по сравнению с внешним дефектом, как показано на графиках на рис. 27. Большая часть снижения амплитуды сигнала происходит из-за предполагаемого большего зазора для внутреннего дефекта, чем для внешнего дефекта. График 2700 представлен для внешнего дефекта, и график 2702 представлен для внутреннего дефекта.[00112] Defects within the thickness of the pipe wall or on the inner wall are always further from the magnetometers than defects on the outer wall of the pipe. However, simulations and tests show only a slight signal loss from an internal defect compared to an external defect, as shown in the graphs in Fig. 27. Most of the reduction in signal amplitude is due to the supposed greater clearance for the internal defect than for the external defect.
[00113] Как было показано в предыдущем обсуждении, многие из параметров в обнаруженных сигналах имеют множественные, зависимые источники. Эти зависимости следует понимать и управлять ими при выполнении обнаружения и определения характеристик дефекта. Это связано с расстоянием между датчиками. Как следует из фиг. 14 и 15, представляет интерес близкое расположение магнитометрических датчиков (магнитометров). Расстояние между магнитометрами связано с тем, насколько маленький дефект (при измерении вдоль поверхности) может быть обнаружен и охарактеризован. Поскольку способ обнаружения основан на нахождении корреляции между синусоидой и косинусоидой, необходимо, чтобы вдоль синусоиды было достаточное количество магнитометров для определения того, что это действительно синусоида. На практике, датчики, расположенные на расстоянии от 0,3 дюйма до 0,4 дюйма (от 7,6 до 10,2 мм) друг от друга, можно использовать для обнаружения дефектов размером около 1 дюйма (25,4 мм) при близком (1 дюйм (25,4 мм) или менее) зазоре. По мере увеличения зазора или уменьшения размеров поверхности способность надежного обнаружения дефекта уменьшается с увеличением вероятности пропуска обнаружений или ложных срабатываний.[00113] As shown in the previous discussion, many of the parameters in the detected signals have multiple, dependent sources. These dependencies should be understood and managed during the detection and characterization of the defect. This is due to the distance between the sensors. As follows from FIG. 14 and 15, the proximity of magnetometric sensors (magnetometers) is of interest. The distance between the magnetometers is related to how small a defect (when measured along the surface) can be detected and characterized. Since the detection method is based on finding a correlation between the sine wave and the cosine wave, it is necessary that there are enough magnetometers along the sine wave to determine that it is really a sine wave. In practice, sensors located between 0.3 inches to 0.4 inches (7.6 to 10.2 mm) apart can be used to detect defects about 1 inch (25.4 mm) in size when (1 inch (25.4 mm) or less) clearance. As the clearance increases or the size of the surface decreases, the ability to reliably detect a defect decreases with an increase in the probability of skipping detections or false alarms.
Обнаружение дефектов во времениTime Defect Detection
[00114] Как уже отмечалось, в некоторых вариантах осуществления настоящего изобретения вместо поиска магнитометрических данных для регистрируемых характеристик дефектов, с целью обнаружения дефектов производят сравнение двух наборов данных, полученных в различное время. Например, один набор данных может быть получен, когда изделие является вновь изготовленным или в какой-то другой момент времени. Второй набор данных получают позже. Эти два набора данных пространственно коррелируют, а затем напряженности магнитного поля во втором наборе данных вычитают из пространственно соответствующих напряженностей магнитного поля в первом наборе данных. Данные вычитания производят по каждой оси. На фиг. 28 представлен график поверхности, полученной в результате такого вычитания, показывающий ось х магнитного поля. Регистрируемая характеристика дефекта отчетливо видна, поскольку выделена пунктирной линией 2800. Форма линии 2800 подобна форме кривой By на рис. 4 и, следовательно, является характеристикой дефекта. На практике дефект обнаруживают после данного вычитания во времени при помощи основного метода пространственного анализа - подгонки волн синуса и косинуса для подтверждения того, что оставшийся сигнал является регистрируемой характеристикой дефекта. Как было описано выше в отношении пространственного обнаружения дефектов, пространственную информацию о дефектах, обнаруженных по каждой из трех осей, можно объединить для получения более точной информации об обнаружении дефектов. Вышеописанные подходы для определения характеристик дефекта (объема, площади и глубины) могут применяться после выполнения данного временного способа.[00114] As already noted, in some embodiments of the present invention, instead of searching for magnetometric data for the recorded characteristics of the defects, in order to detect defects, two sets of data obtained at different times are compared. For example, one data set can be obtained when the product is newly manufactured or at some other point in time. The second data set is received later. These two data sets are spatially correlated, and then the magnetic field strengths in the second data set are subtracted from the spatially corresponding magnetic field strengths in the first data set. Subtraction data is produced on each axis. In FIG. 28 is a graph of the surface obtained by such subtraction, showing the x-axis of the magnetic field. The recorded defect characteristic is clearly visible because it is indicated by the dashed
Физическое сканирование изделия на дефектыPhysical scanning of the product for defects
[00115] Как уже отмечалось, магнитометрические данные об изделии можно получить при помощи фиксированного набора магнитометрических датчиков, размещенных вокруг изделия. По желанию или в качестве альтернативы, изделие может быть физически отсканировано при помощи меньшего набора магнитометрических датчиков, чем было бы необходимо для получения магнитометрических данных без сканирования. Изделие может быть отсканировано вдоль его продольной оси или вдоль любого другого подходящего направления. На фиг. 29 представлен вид в перспективе физического сканера 2900. Изделие 2902, например, труба, может быть отсканировано при помощи сканера 2900. Один магнитометрический датчик, небольшая группа магнитометрических датчиков или одномерная решетка магнитометрических датчиков 2904 поддерживается манипулятором сканера 2906, имеющим одну, две или три степени свободы. Первый линейный двигатель 2908 располагает решетку магнитометрических датчиков 2904 вертикально на подходящем расстоянии от изделия 2902. Второй линейный двигатель 2910 располагает решетку магнитометрических датчиков 2904 вдоль оси, перпендикулярной к оси сканирования. Третий линейный двигатель 2912 переносит решетку магнитометрических датчиков 2904 вдоль оси сканирования. После того, как сканирование завершено, изделие может быть повернуто вокруг оси сканирования, и может быть выполнено еще одно сканирование. Данный процесс можно повторять до тех пор, пока все желаемые части изделия не будут отсканированы.[00115] As already noted, the magnetometric data on the product can be obtained using a fixed set of magnetometric sensors located around the product. Optionally or alternatively, the product can be physically scanned using a smaller set of magnetometric sensors than would be necessary to obtain magnetometric data without scanning. The product can be scanned along its longitudinal axis or along any other suitable direction. In FIG. 29 is a perspective view of a
[00116] В другом варианте осуществления, показанном на фиг. 30 на виде в перспективе, кольцо магнитометрических датчиков переносится физическим сканером 3002. В других вариантах осуществления настоящего изобретения сканирование может быть двумерным. Например, при помощи соответствующего физического сканера изделие можно отсканировать по спирали, по растру или отсканировать в соответствии с другим проходом.[00116] In another embodiment shown in FIG. 30, in a perspective view, the magnetometric sensor ring is carried by a physical scanner 3002. In other embodiments of the present invention, the scan may be two-dimensional. For example, using an appropriate physical scanner, a product can be scanned in a spiral, raster, or scan according to another pass.
[00117] Сбор данных от магнитометров, построитель карты магнитного поля, сопоставитель с образцом, и функции управления базовой станцией и другие функции, описанные в данном документе, могут выполняться с помощью процессора, выполняющего команды, хранящиеся в памяти, как схематически показано на фиг. 31.[00117] Data collection from magnetometers, a magnetic field map builder, a pattern correlator, and base station control functions and other functions described herein can be performed by a processor executing instructions stored in memory, as schematically shown in FIG. 31.
[00118] Несмотря на то, что изобретение описано с помощью описанных выше примерных вариантов осуществления, модификации и вариации показанных вариантов, могут быть сделаны без отхода от концепций изобретения, раскрытых в настоящем описании. Кроме того, раскрытые аспекты или их части, могут быть объединены способами, не перечисленными выше и/или явно не указанными. Соответственно, изобретение не следует рассматривать как ограниченное описанными вариантами осуществления.[00118] Although the invention has been described using the exemplary embodiments described above, modifications and variations of the options shown may be made without departing from the concepts of the invention disclosed herein. In addition, the disclosed aspects or parts thereof may be combined by methods not listed above and / or not explicitly indicated. Accordingly, the invention should not be construed as limited to the described embodiments.
[00119] Хотя аспекты вариантов осуществления могут быть описаны со ссылкой на блок-схемы и/или технологические карты, функции, операции, решения и т.д., все или части каждого блока или комбинации блоков, могут быть объединены, разделены на отдельные операции или выполнены в другом порядке. Все или часть каждого блока или комбинации блоков могут быть реализованы в виде команд компьютерной программы (например, программного обеспечения), аппаратных средств (таких как комбинаторная логика, специализированные интегральные схемы (ASIC), программируемые пользователем вентильные решетки (FPGA) или другое оборудование), программно-аппаратных средств или их комбинации. Варианты осуществления могут быть реализованы с помощью процессора, выполняющего или управляемого командами, сохраненными в памяти. Память может быть оперативным запоминающим устройством (ОЗУ), постоянным запоминающим устройством (ПЗУ), флэш-памятью или любой другой памятью или их сочетанием, подходящим для хранения управляющего программного обеспечения или других команд и данных. Команды, определяющие функции настоящего изобретения, можно передавать процессору во множестве форм, в том числе, но не ограничиваясь этим, в форме информации, постоянно хранящейся на материальных не записывающих носителях (например, постоянно запоминающих устройствах внутри компьютера, например, ПЗУ или устройствах, считываемых компьютерным устройством ввода/вывода, таким как CD-ROM или DVD-диском), информации, хранимой с возможностью изменения на материальном записываемом носителе (например, дискетах, съемной флэш-памяти и жестких дисках) или информации, передаваемой на компьютер через среду передачи данных, включая в себя проводные или беспроводные компьютерные сети. Кроме того, хотя варианты осуществления могут быть описаны в связи с различными иллюстративными структурами данных, системы могут быть реализованы с использованием различных структур данных.[00119] Although aspects of embodiments may be described with reference to flowcharts and / or routings, functions, operations, solutions, etc., all or parts of each block or combination of blocks may be combined, divided into separate operations or executed in a different order. All or part of each block or combination of blocks can be implemented in the form of computer program commands (for example, software), hardware (such as combinatorial logic, specialized integrated circuits (ASIC), user-programmable gate arrays (FPGAs) or other equipment), firmware or a combination thereof. Embodiments may be implemented using a processor executing or controlled by instructions stored in memory. The memory may be random access memory (RAM), read-only memory (ROM), flash memory or any other memory, or a combination thereof, suitable for storing control software or other commands and data. The commands defining the functions of the present invention can be transmitted to the processor in a variety of forms, including, but not limited to, in the form of information permanently stored on tangible non-recording media (for example, read-only memory devices inside a computer, for example, ROM or readable devices computer input / output device, such as a CD-ROM or DVD-ROM), information stored with the possibility of change on a tangible recordable medium (for example, floppy disks, removable flash memory and hard drives) or information transmitted to a computer via a data medium, including wired or wireless computer networks. In addition, although embodiments may be described in connection with various illustrative data structures, systems may be implemented using various data structures.
Claims (45)
Applications Claiming Priority (3)
| Application Number | Priority Date | Filing Date | Title |
|---|---|---|---|
| US201461994961P | 2014-05-18 | 2014-05-18 | |
| US61/994,961 | 2014-05-18 | ||
| PCT/US2015/031092 WO2015179237A1 (en) | 2014-05-18 | 2015-05-15 | System and method of measuring defects in ferromagnetic materials |
Related Child Applications (1)
| Application Number | Title | Priority Date | Filing Date |
|---|---|---|---|
| RU2018120007A Division RU2680104C2 (en) | 2014-05-18 | 2015-05-15 | System and method of measuring defects in ferromagnetic materials |
Publications (3)
| Publication Number | Publication Date |
|---|---|
| RU2016149454A RU2016149454A (en) | 2018-06-20 |
| RU2016149454A3 RU2016149454A3 (en) | 2018-11-28 |
| RU2678949C2 true RU2678949C2 (en) | 2019-02-04 |
Family
ID=53366261
Family Applications (2)
| Application Number | Title | Priority Date | Filing Date |
|---|---|---|---|
| RU2016149454A RU2678949C2 (en) | 2014-05-18 | 2015-05-15 | System and method of measuring defects in ferromagnetic materials |
| RU2018120007A RU2680104C2 (en) | 2014-05-18 | 2015-05-15 | System and method of measuring defects in ferromagnetic materials |
Family Applications After (1)
| Application Number | Title | Priority Date | Filing Date |
|---|---|---|---|
| RU2018120007A RU2680104C2 (en) | 2014-05-18 | 2015-05-15 | System and method of measuring defects in ferromagnetic materials |
Country Status (12)
| Country | Link |
|---|---|
| US (2) | US9651471B2 (en) |
| EP (2) | EP3146323B1 (en) |
| JP (2) | JP6637908B2 (en) |
| KR (3) | KR102022955B1 (en) |
| CN (2) | CN106537134B (en) |
| AU (2) | AU2015264529B2 (en) |
| BR (2) | BR122018009767B1 (en) |
| CA (1) | CA2949220C (en) |
| MX (1) | MX358987B (en) |
| RU (2) | RU2678949C2 (en) |
| SG (3) | SG10201803085QA (en) |
| WO (1) | WO2015179237A1 (en) |
Families Citing this family (30)
| Publication number | Priority date | Publication date | Assignee | Title |
|---|---|---|---|---|
| AU2015264529B2 (en) | 2014-05-18 | 2019-07-04 | The Charles Stark Draper Laboratory, Inc. | System and method of measuring defects in ferromagnetic materials |
| US9743370B2 (en) | 2015-04-28 | 2017-08-22 | The Charles Stark Draper Laboratory, Inc. | Wireless network for sensor array |
| EP3314247A4 (en) | 2015-06-29 | 2019-01-23 | The Charles Stark Draper Laboratory, Inc. | System and method for characterizing ferromagnetic material |
| US10845432B2 (en) | 2016-06-30 | 2020-11-24 | The Charles Stark Draper Laboratory, Inc. | Calibration and monitoring for 3-axis magnetometer arrays of arbitrary geometry |
| RU2637376C1 (en) * | 2016-07-28 | 2017-12-04 | федеральное государственное бюджетное образовательное учреждение высшего образования "Национальный исследовательский университет "МЭИ" (ФГБОУ ВО "НИУ "МЭИ") | Approximation method for definition of geometric sizes of discontinuities in ferromagnetic products and device for its implementation |
| US10551349B2 (en) | 2016-08-08 | 2020-02-04 | The Charles Stark Draper Laboratory, Inc. | Method for determining defect depth in ferromagnetic structures based on magnetic flux leakage direction |
| US10267693B2 (en) | 2016-08-26 | 2019-04-23 | General Electric Company | System and method for measuring torque on a rotating component |
| US11215584B2 (en) | 2016-11-04 | 2022-01-04 | Yokogawa Electric Corporation | Material defect detection device, material defect detection system, material defect detection method, and non-transitory computer readable storage medium |
| JP6447641B2 (en) * | 2016-11-04 | 2019-01-09 | 横河電機株式会社 | Thinning detection device, thinning detection system, thinning detection method and program |
| WO2018132258A1 (en) * | 2017-01-10 | 2018-07-19 | Sunspring America, Inc. | Technologies for identifying defects |
| JP2020510198A (en) * | 2017-03-07 | 2020-04-02 | ザ・チャールズ・スターク・ドレイパ・ラボラトリー・インコーポレイテッド | Augmented reality visualization for pipe inspection |
| US10222350B2 (en) * | 2017-07-12 | 2019-03-05 | International Business Machines Corporation | High sensitivity force gauge with parallel dipole line trap system |
| CA2979118A1 (en) * | 2017-09-12 | 2019-03-12 | Kal Tire | Method of and apparatus for inspecting a ferromagnetic object |
| WO2019083923A1 (en) | 2017-10-23 | 2019-05-02 | Tech4Imaging Llc | Differential magnetic field tomography |
| US10823701B2 (en) * | 2017-11-13 | 2020-11-03 | Exxonmobil Research And Engineering Company | Methods and systems for nondestructive material inspection |
| US10883965B2 (en) * | 2017-11-13 | 2021-01-05 | Exxonmobil Research And Engineering Company | Methods of using nondestructive material inspection systems |
| KR102312443B1 (en) | 2018-06-12 | 2021-10-12 | 주식회사 엘지에너지솔루션 | Connector with surge protection and Printed circuit borad including the same |
| CN109668956A (en) * | 2019-01-22 | 2019-04-23 | 中国海洋石油集团有限公司 | Marine riser weld defect ac magnetic field array detection probe |
| CN111665342B (en) * | 2019-03-07 | 2023-07-04 | 中国石油化工股份有限公司 | Pipeline internal detection data analysis system |
| JP6988854B2 (en) * | 2019-03-28 | 2022-01-05 | 横河電機株式会社 | Sensor device, arithmetic unit, pipeline monitoring system, arithmetic method and program |
| PE20220847A1 (en) * | 2019-06-28 | 2022-05-24 | Solmax Int Inc | INSPECTION METHOD OF A MEMBRANE BASED ON THE DETECTION OF ITS MAGNETIC FIELD |
| EP4024044A4 (en) * | 2019-08-28 | 2022-09-21 | Konica Minolta, Inc. | Information processing system for nondestructive inspection and nondestructive inspection method |
| CN111161243B (en) * | 2019-12-30 | 2023-04-07 | 华南理工大学 | Industrial product surface defect detection method based on sample enhancement |
| JP7147801B2 (en) | 2020-03-13 | 2022-10-05 | 横河電機株式会社 | Magnetic flaw detection method, magnetic field measurement processing device, and magnetic flaw detection device |
| EP3910327A1 (en) * | 2020-05-11 | 2021-11-17 | Villari Holding B.V. | Sensor for detection and/or monitoring the growth of defects |
| GB2598537A (en) * | 2020-05-22 | 2022-03-09 | Speir Hunter Ltd | Stress concentration mapping in insulated pipework |
| JP7298637B2 (en) | 2021-03-10 | 2023-06-27 | 横河電機株式会社 | REDUCTION DETECTION SYSTEM, REDUCTION DETECTION METHOD AND PROGRAM |
| WO2022214694A1 (en) | 2021-04-09 | 2022-10-13 | Villari Holding B.V. | Method of and system for detecting and/or monitoring the growth of defects |
| US11346811B1 (en) * | 2021-09-30 | 2022-05-31 | United States Pipe And Foundry Company, Llc | Method and apparatus for identifying discontinuity in wall of ferrous object |
| DE102022206680A1 (en) | 2022-06-30 | 2024-01-04 | Institut Dr. Foerster Gmbh & Co. Kg | Method and device for leakage flux testing |
Citations (4)
| Publication number | Priority date | Publication date | Assignee | Title |
|---|---|---|---|---|
| US6320820B1 (en) * | 1999-09-20 | 2001-11-20 | Halliburton Energy Services, Inc. | High data rate acoustic telemetry system |
| US20020116980A1 (en) * | 2000-12-21 | 2002-08-29 | Ted Kerr | Roll defect management process |
| RU119117U1 (en) * | 2012-02-22 | 2012-08-10 | Федеральное государственное бюджетное образовательное учреждение высшего профессионального образования "Волгоградский государственный университет" | SENSOR FOR DEFECTOSCOPY OF STEEL BARS |
| WO2013128210A1 (en) * | 2012-03-02 | 2013-09-06 | Speir Hunter Ltd | Fault detection for pipelines |
Family Cites Families (26)
| Publication number | Priority date | Publication date | Assignee | Title |
|---|---|---|---|---|
| JPS51131280U (en) * | 1975-04-15 | 1976-10-22 | ||
| JPH0772122A (en) * | 1993-09-06 | 1995-03-17 | Babcock Hitachi Kk | Leak flux flaw detection method and apparatus for internal defect of magnetic material |
| US8140658B1 (en) | 1999-10-06 | 2012-03-20 | Borgia/Cummins, Llc | Apparatus for internetworked wireless integrated network sensors (WINS) |
| RU2264617C2 (en) | 2001-05-23 | 2005-11-20 | Горошевский Валерий Павлович | Method for non-contact detection of position and type of defects of metallic structures and device for realization of said method |
| US7305467B2 (en) | 2002-01-02 | 2007-12-04 | Borgia/Cummins, Llc | Autonomous tracking wireless imaging sensor network including an articulating sensor and automatically organizing network nodes |
| JP2004037216A (en) * | 2002-07-03 | 2004-02-05 | Jfe Steel Kk | Leakage flux flaw detecting method |
| US7423931B2 (en) | 2003-07-08 | 2008-09-09 | Lawrence Livermore National Security, Llc | Acoustic system for communication in pipelines |
| JP4087312B2 (en) * | 2003-08-06 | 2008-05-21 | 東北電力株式会社 | Inspection method and apparatus for deterioration of metal using high sensitivity magnetic sensor |
| US7941188B2 (en) | 2004-03-31 | 2011-05-10 | The Invention Science Fund I, Llc | Occurrence data detection and storage for generalized sensor networks |
| US20070115821A1 (en) * | 2005-10-26 | 2007-05-24 | Samsung Electro-Mechanics Co., Ltd. | Method for transmitting wireless data using piggyback |
| US7835226B2 (en) | 2005-12-20 | 2010-11-16 | Massachusetts Institute Of Technology | Communications and power harvesting system for in-pipe wireless sensor networks |
| FR2901611B1 (en) * | 2006-05-24 | 2009-01-16 | Airbus France Sas | DEVICE FOR NON-DESTRUCTIVE CONTROL OF A PART BY ANALYSIS OF DISTRIBUTION OF THE MAGNETIC LEAKAGE FIELD |
| US20090195401A1 (en) | 2008-01-31 | 2009-08-06 | Andrew Maroney | Apparatus and method for surveillance system using sensor arrays |
| FR2929008B1 (en) * | 2008-03-20 | 2010-04-02 | Eads Europ Aeronautic Defence | DEVICE FOR MONITORING THE STRUCTURE OF A VEHICLE |
| GB2487572A (en) * | 2011-01-28 | 2012-08-01 | Ge Inspection Technologies Ltd | A non-destructive test method for automatic fastener inspection |
| CA2843394C (en) | 2011-07-29 | 2018-08-21 | Petroliam Nasional Berhard (Petronas) | System and method for inspecting a subsea pipeline |
| US8841901B2 (en) | 2011-07-29 | 2014-09-23 | Valerian Goroshevskiy | System and method for inspecting a subsea pipeline |
| US8547982B2 (en) | 2011-11-23 | 2013-10-01 | King Fahd University Of Petroleum And Minerals | Wireless sensor network with energy efficient protocols |
| EP2607621A1 (en) * | 2011-12-21 | 2013-06-26 | Welltec A/S | Downhole mapping system |
| CN102706955B (en) * | 2012-05-31 | 2015-04-22 | 东北大学 | Pipeline defect characteristic extraction method and device based on uniaxial magnetic leakage data |
| JP2013250114A (en) * | 2012-05-31 | 2013-12-12 | Mie Univ | Method to evaluate amount of plastic deformation from some time point of structure or material including ferromagnetic substance |
| US8447532B1 (en) | 2012-10-27 | 2013-05-21 | Valerian Goroshevskiy | Metallic constructions integrity assessment and maintenance planning method |
| EP2808677B1 (en) | 2012-10-27 | 2021-09-22 | Valerian Goroshevskiy | Method for non-contact metallic constructions assessment |
| US8542127B1 (en) | 2012-11-12 | 2013-09-24 | Valerian Goroshevskiy | Apparatus for the non-contact metallic constructions assessment |
| US8953547B2 (en) | 2013-03-29 | 2015-02-10 | Olympus Corporation | Power-saving TDMA MAC for wireless body area networks |
| AU2015264529B2 (en) | 2014-05-18 | 2019-07-04 | The Charles Stark Draper Laboratory, Inc. | System and method of measuring defects in ferromagnetic materials |
-
2015
- 2015-05-15 AU AU2015264529A patent/AU2015264529B2/en active Active
- 2015-05-15 CA CA2949220A patent/CA2949220C/en active Active
- 2015-05-15 CN CN201580025745.6A patent/CN106537134B/en active Active
- 2015-05-15 US US14/713,503 patent/US9651471B2/en active Active
- 2015-05-15 RU RU2016149454A patent/RU2678949C2/en active
- 2015-05-15 CN CN201810570326.6A patent/CN108663431B/en active Active
- 2015-05-15 SG SG10201803085QA patent/SG10201803085QA/en unknown
- 2015-05-15 KR KR1020187016806A patent/KR102022955B1/en active IP Right Grant
- 2015-05-15 EP EP15727761.7A patent/EP3146323B1/en active Active
- 2015-05-15 RU RU2018120007A patent/RU2680104C2/en active
- 2015-05-15 SG SG10201803084VA patent/SG10201803084VA/en unknown
- 2015-05-15 EP EP18182385.7A patent/EP3413040B1/en active Active
- 2015-05-15 BR BR122018009767-1A patent/BR122018009767B1/en active IP Right Grant
- 2015-05-15 MX MX2016015157A patent/MX358987B/en active IP Right Grant
- 2015-05-15 KR KR1020167035533A patent/KR20170012335A/en active Application Filing
- 2015-05-15 SG SG11201609631WA patent/SG11201609631WA/en unknown
- 2015-05-15 WO PCT/US2015/031092 patent/WO2015179237A1/en active Application Filing
- 2015-05-15 KR KR1020197009027A patent/KR102085752B1/en active IP Right Grant
- 2015-05-15 JP JP2016568883A patent/JP6637908B2/en active Active
- 2015-05-15 BR BR112016026957-8A patent/BR112016026957B1/en active IP Right Grant
-
2016
- 2016-04-29 US US15/142,842 patent/US9651472B2/en active Active
-
2018
- 2018-05-14 JP JP2018093051A patent/JP6640273B2/en active Active
- 2018-05-22 AU AU2018203605A patent/AU2018203605B2/en active Active
Patent Citations (4)
| Publication number | Priority date | Publication date | Assignee | Title |
|---|---|---|---|---|
| US6320820B1 (en) * | 1999-09-20 | 2001-11-20 | Halliburton Energy Services, Inc. | High data rate acoustic telemetry system |
| US20020116980A1 (en) * | 2000-12-21 | 2002-08-29 | Ted Kerr | Roll defect management process |
| RU119117U1 (en) * | 2012-02-22 | 2012-08-10 | Федеральное государственное бюджетное образовательное учреждение высшего профессионального образования "Волгоградский государственный университет" | SENSOR FOR DEFECTOSCOPY OF STEEL BARS |
| WO2013128210A1 (en) * | 2012-03-02 | 2013-09-06 | Speir Hunter Ltd | Fault detection for pipelines |
Also Published As
Similar Documents
| Publication | Publication Date | Title |
|---|---|---|
| RU2678949C2 (en) | System and method of measuring defects in ferromagnetic materials | |
| Baroudi et al. | Pipeline leak detection systems and data fusion: A survey | |
| Liu et al. | State-of-the-art review of technologies for pipe structural health monitoring | |
| US9581567B2 (en) | System and method for inspecting subsea vertical pipeline | |
| RU2419787C2 (en) | System and method to control pipelines by pulsed eddy currents | |
| CN110988144B (en) | Method and device for detecting structural hidden cracks of concrete member | |
| CN113390955B (en) | Visual monitoring and evaluation method for cracks of alternating current magnetic field | |
| Jarvis et al. | Performance evaluation of a magnetic field measurement NDE technique using a model assisted Probability of Detection framework | |
| Zárate et al. | Structural health monitoring of liquid-filled tanks: a Bayesian approach for location of acoustic emission sources | |
| RU2538069C2 (en) | Method and apparatus for determining direction of defect within mechanical structural component | |
| Zhao et al. | Collaborative detection and on-line monitoring of pipeline stress in oil and gas stations | |
| CN109490410B (en) | Multi-frequency eddy current quantitative evaluation method for stress corrosion cracks under residual stress action | |
| WO2022214694A1 (en) | Method of and system for detecting and/or monitoring the growth of defects | |
| CN115290746A (en) | Pulse eddy current probe construction method based on finite element analysis and storage medium | |
| Bakhtiari | Task 1. Monitoring real time materials degradation. NRC extended In-situ and real-time Monitoring |