JP7619829B2 - Ignition delay time monitoring device, ignition delay time monitoring program, and ignition delay time monitoring method - Google Patents
Ignition delay time monitoring device, ignition delay time monitoring program, and ignition delay time monitoring method Download PDFInfo
- Publication number
- JP7619829B2 JP7619829B2 JP2021030605A JP2021030605A JP7619829B2 JP 7619829 B2 JP7619829 B2 JP 7619829B2 JP 2021030605 A JP2021030605 A JP 2021030605A JP 2021030605 A JP2021030605 A JP 2021030605A JP 7619829 B2 JP7619829 B2 JP 7619829B2
- Authority
- JP
- Japan
- Prior art keywords
- ignition
- statistical data
- ignition delay
- delay time
- statistical
- Prior art date
- Legal status (The legal status is an assumption and is not a legal conclusion. Google has not performed a legal analysis and makes no representation as to the accuracy of the status listed.)
- Active
Links
Images


Classifications
-
- Y—GENERAL TAGGING OF NEW TECHNOLOGICAL DEVELOPMENTS; GENERAL TAGGING OF CROSS-SECTIONAL TECHNOLOGIES SPANNING OVER SEVERAL SECTIONS OF THE IPC; TECHNICAL SUBJECTS COVERED BY FORMER USPC CROSS-REFERENCE ART COLLECTIONS [XRACs] AND DIGESTS
- Y02—TECHNOLOGIES OR APPLICATIONS FOR MITIGATION OR ADAPTATION AGAINST CLIMATE CHANGE
- Y02T—CLIMATE CHANGE MITIGATION TECHNOLOGIES RELATED TO TRANSPORTATION
- Y02T10/00—Road transport of goods or passengers
- Y02T10/10—Internal combustion engine [ICE] based vehicles
- Y02T10/40—Engine management systems
Landscapes
- Regulation And Control Of Combustion (AREA)
Description
本発明は、バーナを着火する着火トライアルの着火指示から着火検出までの着火遅れ時間を監視する、着火遅れ時間監視装置、着火遅れ時間監視プログラム、及び、着火遅れ時間監視方法に関する。 The present invention relates to an ignition delay time monitoring device, an ignition delay time monitoring program, and an ignition delay time monitoring method that monitor the ignition delay time from an ignition command to ignition detection in an ignition trial that ignites a burner.
燃焼装置等では、バーナを着火する着火トライアルが実行される。特許文献1には、この着火トライアルの着火指示から着火検出までの着火遅れ時間を計測し、計測した着火遅れ時間が所定範囲から外れたときに、燃焼装置が不調であると判定する技術が開示されている。
In combustion devices, an ignition trial is performed to ignite a burner.
上記特許文献1に記載の技術も有用であるが、例えば、ユーザが燃焼装置の不調の傾向(不調が発生する傾向にある旨など)を適切に把握することは困難である。また、この技術では、例えば、不調に由来しない突発的な事象により着火遅れ時間が所定範囲から外れたにも、燃焼装置が不調と判定されてしまう。以上のように、上記特許文献1に記載の技術では、ユーザが燃焼装置の不調を適切に把握できるとは言い難い。
The technology described in
本発明は、ユーザが燃焼装置の不調を適切に把握できる、着火遅れ時間監視装置、着火遅れ時間監視プログラム、及び、着火遅れ時間監視方法を提供することを目的とする。 The present invention aims to provide an ignition delay time monitoring device, an ignition delay time monitoring program, and an ignition delay time monitoring method that allow users to properly understand malfunctions in a combustion device.
上記課題を解決するため、本発明の第1の観点に係る着火遅れ時間監視装置は、バーナを着火する着火トライアルの着火指示から着火検出までの着火遅れ時間を収集するように構成された収集部と、前記収集部により収集された所定回数分の前記着火トライアルそれぞれの前記着火遅れ時間の集合を統計的に解析し、当該集合の統計データを第1統計データとして得るように構成された解析部と、前記第1統計データと、着火トライアルが前記所定回数分行われたときの着火遅れ時間の集合の統計データとして用意される、上記第1統計データとは異なりかつ基準となる第2統計データとを比較し、比較結果を出力するように構成された比較部と、を備える。 In order to solve the above problem, the ignition delay time monitoring device according to a first aspect of the present invention includes a collection unit configured to collect the ignition delay time from the ignition instruction to ignite the burner in an ignition trial to the detection of ignition, an analysis unit configured to statistically analyze the set of ignition delay times for each of a predetermined number of ignition trials collected by the collection unit and obtain statistical data of the set as first statistical data, and a comparison unit configured to compare the first statistical data with second statistical data, which is different from the first statistical data and serves as a reference and is prepared as statistical data of the set of ignition delay times when the ignition trials are performed the predetermined number of times, and output the comparison result.
前記解析部は、前記収集部により収集された、前記燃焼装置の初期の前記所定回数分の前記着火トライアルそれぞれの前記着火遅れ時間の集合を、前記第1統計データを得るときと同じ手法で統計的に解析し、当該集合の統計データを前記第2統計データとして得るように構成されている、ようにしてもよい。 The analysis unit may be configured to statistically analyze a set of the ignition delay times for each of the initial predetermined number of ignition trials of the combustion device, collected by the collection unit, using the same method as used to obtain the first statistical data, and to obtain the statistical data of the set as the second statistical data.
前記第1統計データは、前記着火遅れ時間ごとにその着火遅れ時間となった前記着火トライアルの回数の分布を示す第1分布データを含み、前記第2統計データは、前記着火遅れ時間ごとにその着火遅れ時間となった前記着火トライアルの回数の分布を示す第2分布データを含む、ようにしてもよい。 The first statistical data may include first distribution data indicating a distribution of the number of ignition trials that resulted in each ignition delay time for each ignition delay time, and the second statistical data may include second distribution data indicating a distribution of the number of ignition trials that resulted in each ignition delay time for each ignition delay time.
前記比較部は、第1軸を着火遅れ時間とし、第2軸を着火トライアルの回数として、前記第1分布データと前記第2分布データとを互いに関連付けてグラフ化することで、前記第1統計データと前記第2統計データとを比較し、互いに関連付けられてグラフ化された前記第1分布データ及び前記第2分布データの各グラフを前記比較結果として出力する、ように構成されている、ようにしてもよい。 The comparison unit may be configured to compare the first statistical data with the second statistical data by graphing the first distribution data and the second distribution data in association with each other, with a first axis representing the ignition delay time and a second axis representing the number of ignition trials, and to output, as the comparison result, each graph of the first distribution data and the second distribution data in association with each other and graphed.
前記第1統計データと前記第2統計データとは、前記着火遅れ時間の分布を表す統計量を含み、前記比較部は、前記第1統計データに含まれる前記統計量と前記第2統計データに含まれる前記統計量とを比較することで前記燃焼装置の不調の有無及び不調があった場合のその不調の種類を推定し、推定の結果を前記比較結果として出力するように構成されている、ようにしてもよい。 The first statistical data and the second statistical data may include a statistical quantity representing a distribution of the ignition delay time, and the comparison unit may be configured to estimate the presence or absence of a malfunction of the combustion device and, if a malfunction occurs, the type of the malfunction by comparing the statistical quantity included in the first statistical data with the statistical quantity included in the second statistical data, and to output the result of the estimation as the comparison result.
前記燃焼装置は、前記バーナを着火するときに使用される点火装置を備え、前記統計量は、前記着火遅れ時間の平均値と、前記着火遅れ時間ごとにその着火遅れ時間となった前記着火トライアルの回数分布の最頻値と、前記回数分布の標準偏差と、を含み、前記比較部は、前記第1統計データの方が前記第2統計データよりも、前記平均値が長く、前記最頻値が小さく、かつ、前記標準偏差が大きい場合に、前記バーナに供給される空気と燃料との比率である空燃比の乱れ、及び、前記点火装置のスパーク発生部の不具合の少なくとも一方を前記不調の種類と推定する、ように構成されている、ようにしてもよい。 The combustion device may be equipped with an ignition device used to ignite the burner, and the statistics may include an average value of the ignition delay time, a mode of the distribution of the number of ignition trials that resulted in that ignition delay time for each ignition delay time, and a standard deviation of the distribution of the number of times, and the comparison unit may be configured to estimate that the type of malfunction is at least one of a disturbance in the air-fuel ratio, which is the ratio of air to fuel supplied to the burner, and a malfunction of a spark generating unit of the ignition device, when the average value is longer, the mode is smaller, and the standard deviation is larger in the first statistical data than in the second statistical data.
前記燃焼装置は、前記バーナを着火するときに使用される点火装置を備え、前記統計量は、前記着火遅れ時間ごとにその着火遅れ時間となった前記着火トライアルの回数分布の標準偏差と、前記回数分布のピークの数と、を含み、前記基準統計データに含まれる前記ピークの数は、1つであり、前記比較部は、前記第1統計データの方が前記第2統計データよりも前記標準偏差が大きく、前記第1統計データに含まれる前記ピークの数が複数である場合に、前記点火装置のスパーク発生部の不具合を前記不調の前記種類と推定する、ように構成されている、ようにしてもよい。 The combustion device may include an ignition device used when igniting the burner, the statistical amount may include a standard deviation of a distribution of the number of ignition trials that reached the ignition delay time for each ignition delay time and the number of peaks in the distribution of the number of times, the number of peaks included in the reference statistical data is one, and the comparison unit may be configured to estimate that the type of malfunction is a malfunction of a spark generating unit of the ignition device when the standard deviation of the first statistical data is larger than that of the second statistical data and the number of peaks included in the first statistical data is multiple.
前記燃焼装置は、前記着火検出に使用される火炎検出器を備え、前記統計量は、前記着火遅れ時間の平均値を含み、前記比較部は、前記第1統計データの方が前記第2統計データよりも前記平均値が短い場合に、前記火炎検出器の配置不良、及び、前記火炎検出器の不具合及び空燃比の乱れ(ガスリッチ)、の少なくとも一方を前記不調の前記種類と推定する、ように構成されている、ようにしてもよい。 The combustion device may be configured to include a flame detector used for the ignition detection, the statistical amount includes an average value of the ignition delay time, and the comparison unit is configured to estimate that the type of malfunction is at least one of a misalignment of the flame detector, a malfunction of the flame detector, and an air-fuel ratio disturbance (gas rich) when the average value of the first statistical data is shorter than that of the second statistical data.
本発明の第2の観点に係る着火遅れ時間監視プログラムは、コンピュータに、バーナを着火する着火トライアルの着火指示から着火検出までの着火遅れ時間を収集するように構成された収集ステップと、前記収集ステップにより収集された所定回数分の前記着火トライアルそれぞれの前記着火遅れ時間の集合を統計的に解析し、当該集合の統計データを第1統計データとして得るように構成された解析ステップと、前記第1統計データと、着火トライアルが前記所定回数分行われたときの着火遅れ時間の集合の統計データとして用意される、上記第1統計データとは異なりかつ基準となる第2統計データとを比較し、比較結果を出力するように構成された比較ステップと、を実行させる。 The ignition delay time monitoring program according to the second aspect of the present invention causes a computer to execute a collection step configured to collect ignition delay times from an ignition instruction to ignite a burner to ignition detection in an ignition trial, an analysis step configured to statistically analyze a set of ignition delay times for each of a predetermined number of ignition trials collected by the collection step and obtain statistical data of the set as first statistical data, and a comparison step configured to compare the first statistical data with second statistical data, which is different from the first statistical data and serves as a reference and is prepared as statistical data of a set of ignition delay times when the ignition trials are performed the predetermined number of times, and output the comparison result.
本発明の第3の観点に係る着火遅れ時間監視方法は、バーナを着火する所定回数分の着火トライアルそれぞれの着火指示から着火検出までの着火遅れ時間の集合を統計的に解析し、当該集合の統計データを第1統計データとして得る解析ステップと、前記第1統計データと、着火トライアルが前記所定回数分行われたときの着火遅れ時間の集合の統計データとして用意される、上記第1統計データとは異なりかつ基準となる第2統計データとを比較し、比較結果を得る比較ステップと、を備える。 The ignition delay time monitoring method according to the third aspect of the present invention includes an analysis step of statistically analyzing a set of ignition delay times from an ignition command to ignition detection for each of a predetermined number of ignition trials for igniting a burner, and obtaining statistical data of the set as first statistical data, and a comparison step of comparing the first statistical data with second statistical data, which is different from the first statistical data and serves as a reference and is prepared as statistical data of a set of ignition delay times when the ignition trials are performed the predetermined number of times, and obtaining a comparison result.
本発明によれば、ユーザが燃焼装置の不調を適切に把握できる。 The present invention allows users to properly understand malfunctions in the combustion device.
以下、本発明の実施形態及びその変形例について、図面を参照して説明する。 The following describes an embodiment of the present invention and its variations with reference to the drawings.
(実施形態)
図1に示すように、本発明の一実施形態に係る着火遅れ時間監視装置20は、燃焼システム10に使用され、燃焼システム10における後述の着火遅れ時間Tdを監視する。燃焼システム10は、着火遅れ時間監視装置20の他、燃焼を行う燃焼装置30と、燃焼装置30を制御する燃焼制御装置70と、を備えている。この実施の形態では、着火遅れ時間Tdの変化をユーザに把握させることで、ユーザに燃焼装置30の不調を適切に把握させるために、着火遅れ時間Tdが監視される。「不調」とは、燃焼装置30が運転不可となる前の燃焼装置30が動作可能な程度の異常つまり軽度の異常をいう。以下、燃焼装置30及び燃焼制御装置70を先に説明してから着火遅れ時間監視装置20について説明する。
(Embodiment)
As shown in Fig. 1, an ignition delay
燃焼装置30は、燃焼機器40と、燃料供給系統50と、空気供給系統60と、制御モータMと、高開度位置センサHSと、低開度位置センサLSと、を備えている。
The
燃焼機器40は、燃焼室R内で燃料ガスを燃焼させる。燃焼機器40は、燃焼室Rを形成する燃焼炉41と、燃料ガスを燃焼させて燃焼室R内を加熱するメインバーナ42と、燃料ガスを燃焼させてメインバーナ42を点火するパイロットバーナ43と、パイロットバーナ43を点火する点火装置(イグナイター)44と、を備えている。点火装置44により点火されたパイロットバーナ43は、メインバーナ42の着火に使用される。このため、点火装置44は、メインバーナ42を着火するときに使用される装置ともいえる。点火装置44は、放電電極等のスパーク発生部44Aを備える。燃焼機器40は、さらに、バーナより具体的にはメインバーナ42及びパイロットバーナ43の火炎の活発度を検出する火炎検出器45と、燃焼室R内の温度を検出する温度センサ46と、を備えている。火炎の活発度は、火炎がどの程度活発に発生しているかを示す度合いであり、ここでは、火炎の強度である。
The
燃料供給系統50は、外部からの燃料ガスを燃焼機器40に供給する。燃料供給系統50は、燃焼機器40に供給される燃料ガスが流れる燃料流路51を備えている。燃料流路51は、外部から燃料ガスが供給される主流路51Aと、主流路51Aが分岐した第1流路51Bおよび第2流路51Cと、を含む。第1流路51Bはメインバーナ42に接続され、第2流路51Cはパイロットバーナ43に接続されている。
The
燃料供給系統50は、さらに、主流路51Aに設けられたガス圧スイッチ52と、第1流路51Bに設けられた安全遮断弁であるメインバルブ54A及び54Bと、第2流路51Cに設けられた安全遮断弁であるパイロットバルブ54C及び54Dと、を備える。ガス圧スイッチ52は、外部から供給される燃料ガスの圧力が所定の圧力以上であるときにONとなる。メインバルブ54A及び54Bは、第1流路51Bを開閉する。パイロットバルブ54C及び54Dは、第2流路51Cを開閉する。燃料供給系統50は、主流路51Aに設けられた燃料流量調整用のダンパ55も備える。
The
空気供給系統60は、燃焼機器40に空気を供給する。空気供給系統60は、燃焼機器40に供給される空気が流れる空気流路61と、空気流路61に空気を供給するブロワ62と、を備えている。空気流路61は、ブロワ62に接続された主流路61Aと、主流路61Aが分岐した第1流路61B及び第2流路61Cと、を備える。第1流路61Bは、メインバーナ42に接続されている。第2流路61Cは、パイロットバーナ43に接続されている。
The
空気供給系統60は、さらに、主流路61Aに設けられ、ブロワ62からの空気の風圧が所定の風圧以上であるときにONとなる風圧スイッチ63も備える。空気供給系統60は、さらに、主流路61Aに設けられた空気流量調整用のダンパ65を備える。
The
燃料又は空気流量調整用のダンパ55及び65は、制御モータMにより、リンケージして駆動され、燃料流路51及び空気流路61の開度を制御する。リンケージによる駆動により、ダンパ55及び65の各開度は、メインバーナ42に供給される燃料と空気との比である空燃比が所望の比率(燃焼に理想的な比率)を維持するように制御される。ダンパ55及び65の各開度によって、メインバーナ42に供給される燃料及び空気の量が調整され、これにより、各バーナの火炎の活発度が調整され、それにより燃焼室Rを加熱する加熱温度が制御される。
The
高開度位置センサHSは、ダンパ55及び65の開度位置が所定の高開度位置へ達したことを検出する。低開度位置センサLSは、ダンパ55及び65の開度位置が所定の低開度位置へ達したことを検出する。各センサHS及びLSは、ダンパ55及び65の開度位置が高開度位置又は低開度位置に達したときにONとなる。
The high opening position sensor HS detects when the opening positions of the
燃焼制御装置70は、PLC(Programmable Logic Controller)、パーソナルコンピュータ等の各種のコンピュータからなる。燃焼制御装置70は、バーナコントローラとも呼ばれる。燃焼制御装置70は、ガス圧スイッチ52、風圧スイッチ63、高開度位置センサHS、及び、低開度位置センサLSなどの状態(ON/OFF)を監視する。燃焼制御装置70には、火炎検出器45及び温度センサ46などからの各種信号が入力される。燃焼制御装置70は、監視結果及び各種信号に基づいて、点火装置44、メインバルブ54A及び54B、パイロットバルブ54C及び54D、ブロワ62、及び、ダンパ55及び65などを制御する。
The
燃焼制御装置70は、予め定められた燃焼シーケンスに沿って燃焼装置30の運転を制御する。この燃焼シーケンスは、「スタートチェック」、「プレパージ」、「点火待ち」、「パイロット点火」、「パイロットオンリー」、「メイン着火」、「メインオンリー」(「メイン安定」ともいう。)、「定常燃焼」といった段階を含む。
The
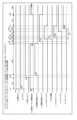
図2に、燃焼装置30の起動から定常燃焼に至るまでの燃焼シーケンスのタイムチャートを示す。燃焼制御装置70は、外部から起動入力(チャートAのt1点)があると、ブロワ62を制御して空気流路61への空気の送風を開始し(チャートBのt1点)、制御モータMに対して開方向への駆動指令を送る(チャートDのt1点)。開方向への駆動指令によりダンパ55及び65が開かれる。
Figure 2 shows a time chart of the combustion sequence from start-up of the
そして、ブロワ62からの空気の供給による風圧が所定の風圧に達すると、風圧スイッチ63がONとなる(チャートCのt2点)。t1点からt2点までの期間P1が「スタートチェック」の時間帯である。
When the wind pressure caused by the air supply from the
燃焼制御装置70は、風圧スイッチ63がONとなり、かつ、高開度位置センサHSがダンパ55及び65の開度位置が高開度位置に達したことを検出してONとなると(チャートEのt3点)、この時点を起点としてプレパージ時間の計時を開始する。
When the
燃焼制御装置70は、プレパージ時間の経過後、制御モータMへ閉方向への駆動指令を送る(チャートDのt4点)。これにより、ダンパ55及び65が閉じる方向に動作する。t3点からt4点までの期間P2が「プレパージ」の時間帯である。
After the pre-purge time has elapsed, the
燃焼制御装置70は、低開度位置センサLSがダンパ55及び65の開度位置が低開度位置に達したことを検出してONになると(チャートFのt5点)、所定の待ち時間の経過後、パイロットバルブ54C及び54Dを開とし(チャートGのt6点)、点火装置44を作動させる(チャートHのt6点)。所定の待ち時間は、例えば、低開度位置の検出後、燃料ガスの供給が開始されて、ガス圧スイッチ52がONとなるまでの時間などである。t4点からt6点までの期間P3が「点火待ち」の時間帯である。
When the low opening position sensor LS detects that the
パイロットバルブ54C及び54Dが開となることで、パイロットバーナ43に燃料供給系統50から燃料ガスが供給され、パイロットバーナ43は燃料ガスを噴出する。この状態で、点火装置44が作動すると、点火装置44のスパーク発生部44Aから点火スパークが発生し、この点火スパークがパイロットバーナ43から噴出する燃料を点火する。これにより、パイロットバーナ43が点火される。この実施の形態では、空気供給系統60から燃料ガスの燃焼に必要な空気もパイロットバーナ43に供給され、パイロットバーナ43から噴射される。燃料供給系統50及び空気供給系統60は、上記のようにダンパ55及び65が低開度位置であるときに、パイロットバーナ43に供給される燃料及び空気の空燃比が前記所望の比率(燃焼に理想的な比率)となるように構成されている。パイロットバーナ43は、周囲の空気により点火するように構成されてもよい。
When the
パイロットバーナ43の点火は、火炎検出器45により検出される。火炎検出器45は、パイロットバーナ43の火炎の活発度を示す検出信号を燃焼制御装置70に出力する。燃焼制御装置70は、検出信号が示す火炎の活発度が所定の第1閾値を超えたと判別したときに、パイロットバーナ43の点火を検出する。ここでは、チャートIに示すように、t7点でパイロットバーナ43が点火され、この点火が検出されたものとする。
The ignition of the
燃焼制御装置70は、パイロットバーナ43の点火を検出した場合、点火装置44の作動つまり点火スパークの発生を終了させる(チャートHのt8点)。点火装置44を差動させているt6点からt8点までの期間P4が「パイロット点火」の時間帯である。燃焼制御装置70は、パイロットバーナ43の点火を所定期間検出できなかった場合には、タイムオーバーとして当該燃焼シーケンスを中止する。
When the
燃焼制御装置70は、パイロットバーナ43の点火を検出して点火装置44の作動を終了させたあと、t9点までの所定期間の間待機する。この所定期間つまりt8点からt9点までの期間P5がパイロットバーナ43を単独で燃焼させる「パイロットオンリー」の時間帯である。「パイロットオンリー」において、燃焼制御装置70は、火炎検出器45からの検出信号に基づいてパイロットバーナ43の火炎の活発度を監視する。燃焼制御装置70は、上記所定期間中に、火炎の活発度が所定の強さ以下となったときに、パイロットバーナ43が失火したとして燃焼シーケンスを中止する。
After detecting the ignition of the
上記所定期間の経過後、燃焼制御装置70は、メインバルブ54A及び54Bを開とする(チャートJのt9点)。メインバルブ54A及び54Bが開となることで、メインバーナ42への燃料の供給が開始される。メインバーナ42には、空気供給系統60から空気も供給される。空気及び燃料が供給された状態のメインバーナ42は、燃料及び空気を噴出し、パイロットバーナ43の火炎を種火として着火する。火炎検出器45は、メインバーナ42及びパイロットバーナ43の各火炎の活発度の和を示す検出信号を燃焼制御装置70に出力する。燃焼制御装置70は、検出信号が示す火炎の活発度の和が所定の第2閾値を超えたと判別したときに、メインバーナ42が着火したと判別する。ここでは、チャートKに示すように、t10点でメインバーナ42が着火され、この着火が検出されたものとする。
After the above-mentioned predetermined period has elapsed, the
燃焼制御装置70は、メインバーナ42の着火を検出すると、パイロットバルブ54C及び54Dを閉じて、パイロットバーナ54の燃焼を終了させる(チャートG及びIのt11点参照)。t9点からt11点までの期間P6がメインバーナ42を着火する「メイン着火」の時間帯である。
When the
燃焼制御装置70は、メインバーナ42の着火を検出してパイロットバルブ54C及び54Dを閉じたあと、t12点までの所定期間の間待機する。この所定期間つまりt11点からt12点までの期間P7がメインバーナ42を単独で燃焼させる「メインオンリー」の時間帯である。「メインオンリー」において、燃焼制御装置70は、火炎検出器45からの検出信号に基づいてメインバーナ42の火炎の活発度を監視する。燃焼制御装置70は、前記の所定期間中に、火炎の活発度が所定の強さ以下となったときに、メインバーナ42が失火したとして燃焼シーケンスを中止する。
After detecting the ignition of the
燃焼制御装置70は、上記の所定期間の待機後、温度センサ46から供給される検出信号が示す燃焼室R内の温度をフィードバック値として、当該温度が目標値となるように、制御モータMをフィードバック制御することを開始する(チャートDのt12点)。t12点以降は、メインバーナ42を定常燃焼させる「定常燃焼」の期間である。定常燃焼でのフィードバック制御の具体的方法は任意であるが、例えば、比例制御(P制御)、比例・積分制御(PI制御)、又は、比例・積分・微分制御(PID制御)が採用される。燃焼制御装置70は、定常燃焼中、ガス圧スイッチ52又は風圧スイッチ63がOFFとなったときには、異常が発生したとして、定常燃焼を中止する。
After waiting for the above-mentioned predetermined period, the
燃焼シーケンスにおける、「パイロット点火」から「メインオンリー」までの各段階を少なくとも含むシーケンスを着火トライアルともいう。燃焼制御装置70は、このような着火トライアルで要した着火遅れ時間Tdを計測する。着火遅れ時間Tdは、点火装置44を差動させる信号を燃焼制御装置70から点火装置44に供給したタイミングつまり着火指示のタイミングであるt6点を始点とする。着火遅れ時間Tdは、メインバーナ42の着火を火炎検出器45からの検出信号に基づいて検出したタイミングつまり着火検出のタイミングであるt10点を終点とする。着火遅れ時間Tdは、着火トライアルが実行されるごとに燃焼制御装置70により計測され、着火遅れ時間監視装置20に出力される。
A combustion sequence that includes at least each stage from "pilot ignition" to "main only" is also called an ignition trial. The
さらに、燃焼制御装置70は、燃焼シーケンスにおける、火炎検出器45からの検出信号が示す火炎の活発度の時間変化も記憶する。検出信号は、ここでは、火炎の活発度に応じて電圧値が変化する電圧信号とするが、火炎の活発度に応じて電流値が変化する電流信号であってもよい。また、火炎検出器45が、火炎からの紫外線等の電磁波を受光したときに放電することで火炎の活発度を検出する場合、当該火炎の活発度は、火炎検出器45における単位時間当たりの放電回数によりあらわされてもよい。前記の電圧信号をフレーム電圧VFともいい、前記の電流信号をフレーム電流IFともいう。以下の説明でのフレーム電圧VF及びその電圧値は、フレーム電流IF及びその電流値に変更することができる。燃焼制御装置70は、火炎検出器45からの検出信号をアナログデジタル変換し、フレーム電圧VFの電圧値の時間変化を火炎活発度データとして記憶する。火炎活発度データにおける前記の電圧値が、火炎の活発度を表している。燃焼制御装置70は、記憶した火炎活発度データを着火遅れ時間監視装置20に出力する。
Furthermore, the
次に着火遅れ時間監視装置20について説明する。着火遅れ時間監視装置20は、着火遅れ時間を監視する処理を行うパーソナルコンピュータ等の各種のコンピュータを含んで構成されている。着火遅れ時間監視装置20は、図3に示すように、CPU(Central Processing Unit)等のプロセッサ21と、プロセッサ21のメインメモリとして機能するRAM(Random Access Memory)22と、プロセッサ21により実行するプログラムを記憶する記憶装置23と、を備える。記憶装置23には、後述の着火遅れ時間データ群、基準統計データ、直近統計データ、及び、火炎活発度データ群も記憶する。着火遅れ時間監視装置20は、さらに、後述の各種画面を表示するディスプレイ24と、ユーザにより操作される操作装置25と、プロセッサ21が燃焼制御装置70と通信を行うための通信モジュール26と、を備える。
Next, the ignition delay
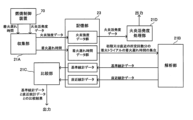
この実施の形態では、プロセッサ21は、記憶装置23に記憶されたプログラムを実行することにより、図4に示す、収集部21A、解析部21B、比較部21C、及び、火炎活発度処理部21Dとして動作する。
In this embodiment, the processor 21 executes a program stored in the
収集部21Aは、燃焼制御装置70と通信モジュール26を介して通信し、燃焼制御装置70が順次出力する着火遅れ時間Td及び火炎活発度データを順次取得することで着火遅れ時間Td及び火炎活発度データを収集する。収集部21Aは、順次取得した着火遅れ時間Td及び火炎活発度データを、取得順序つまりその着火トライアルの実行順序を特定可能に記憶装置23に格納する。収集部21Aにより収集されて記憶装置23に格納された着火遅れ時間Tdの集合が、図3の着火遅れ時間データ群である。また、記憶装置23に格納された火炎活発度データの集合が火炎活発度データ群である。
The
図4に示す解析部21Bは、燃焼装置30の初期に行われた所定回数分の着火トライアルそれぞれの着火遅れ時間Tdの集合を記憶装置23の着火遅れ時間データ群から取得する。解析部21Bは、取得した着火遅れ時間Tdの集合を統計的に解析する。解析部21Bは、この解析により得られる、この集合の統計データを後述の直近統計データと比較される基準となる基準統計データとして記憶装置23に格納する。
The
前記の所定回数は、統計的な解析に必要な、予め定められた任意の複数回数であればよいが、ここでは、50回とする。初期の所定回数とは、例えば、燃焼装置30が製造されたあと最初に行われる着火トライアルを1回目とした1~50回目をいう。製造は、燃焼装置30を補修、修理、改造、交換することで、当該燃焼装置30が新しくなることも含む。この1~50回目の着火トライアルは、燃焼装置30の製造後の動作テストにおける着火トライルを含んでもよい。また、初期の所定回数は、燃焼装置30が販売され、ユーザが指定する箇所に設置したあと最初に行われる着火トライアルを1回目とした1~50回目でもよい。前記所定回数の1回目等の基準統計データの登録のタイミング等は、ユーザにより指定されてもよい。基準統計データは、燃焼装置30に不調が発生する前に行われた着火トライアルの複数個の着火遅れ時間Tdに基づいて生成されればよい。
The predetermined number of times may be any predetermined number of times necessary for statistical analysis, but here, it is set to 50 times. The initial predetermined number of times refers to, for example, the first to 50th ignition trials, with the first trial being the first ignition trial performed after the
解析部21Bによる統計的解析では、予め設定された同じ階級に属する着火遅れ時間Tdの個数を度数としてカウントする。基準統計データは、図5に示すような、着火遅れ時間Tdの階級それぞれに属する着火遅れ時間Tdの個数の分布を示す分布データを含む。当該分布データを、以下では基準分布データともいう。前記の階級は、着火遅れ時間Tdの値そのものであってもよい。例えば、着火遅れ時間Tdが、1秒単位で特定され、小数点以下は四捨五入される場合、着火遅れ時間Tdがとることができる、1秒,2秒,3秒・・・の各数値を、着火遅れ時間Tdの階級として扱ってもよい。この場合、正確には、1秒に対して、0.5秒以上1.5秒未満の範囲が階級といえ、前記の1,2,3・・・の各秒は階級値ともいえる。
In the statistical analysis by the
図5に示す分布データを、横軸を着火遅れ時間Tdの階級、縦軸を着火遅れ時間Tdの個数(度数)としてグラフ化すると、図6に示すようなグラフ(度数折れ線)となる。なお、図6のグラフの黒丸は階級の階級値に付されている。図6のように、基準分布データのグラフは、横軸方向の幅の狭いつまり標準偏差の小さいガウシアン分布を有する。 When the distribution data shown in FIG. 5 is graphed with the horizontal axis representing the class of ignition delay time Td and the vertical axis representing the number (frequency) of ignition delay times Td, a graph (frequency line) like that shown in FIG. 6 is obtained. Note that the black circles in the graph in FIG. 6 represent the class values. As shown in FIG. 6, the graph of the reference distribution data has a Gaussian distribution with a narrow width in the horizontal axis direction, i.e., a small standard deviation.
解析部21Bは、基準分布データの生成後、着火遅れ時間データ群を構成する着火遅れ時間のうち直近に行われた前記所定回数分(上述のように50回分)の着火トライアルそれぞれの着火遅れ時間Tdの集合を統計的に解析する。解析部21Bは、この解析により得られる、この集合の統計データを直近統計データとして記憶装置23に格納する。直近の所定回数分の着火トライアルは、最新~50回前まで遡った50回分の着火トライアルである。解析は、基準統計データを得るときに行われる手法と同じ手法で行われる。
After generating the reference distribution data, the
前記の解析により得られる直近統計データは、基準統計データと同様に、着火遅れ時間Tdの階級それぞれに属する着火遅れ時間Tdの個数の分布を示す分布データを含む。当該分布データは、直近分布データともいう。直近の所定回数分の着火トライアルがすべてで不調が生じていない場合、横軸を着火遅れ時間、縦軸を着火トライアルの回数とした直近分布データのグラフは、基準分布データのグラフと同様の形状となる。 The most recent statistical data obtained by the above analysis includes distribution data that indicates the distribution of the number of ignition delay times Td that belong to each class of ignition delay times Td, similar to the reference statistical data. This distribution data is also called most recent distribution data. If no malfunctions have occurred in any of the most recent predetermined number of ignition trials, a graph of the most recent distribution data with the ignition delay time on the horizontal axis and the number of ignition trials on the vertical axis will have the same shape as the graph of the reference distribution data.
なお、記憶部23には、最新50個の着火遅れ時間Tdのみが格納され、新しい着火遅れ時間Tdは、古い着火遅れ時間Tdに上書きされてもよい。この場合、着火遅れ時間が50個溜まった任意のタイミングで、基準統計データが生成され、その後、ユーザが指定したタイミング(例えば、後述の比較結果が欲しいとき)で直近統計データが生成されてもよい。
In addition, only the most recent 50 ignition delay times Td are stored in the
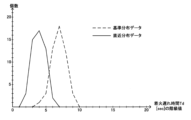
比較部21Cは、解析部21Bにより得られた、直近統計データと基準統計データとを比較し、比較結果を出力する。比較部21Cは、ここでは、図7~図9に模式的に示すように、横軸を着火遅れ時間Tdの階級、縦軸を着火遅れ時間Tdの個数(度数)として、直近統計データの直近分布データと、基準統計データの基準分布データと、を互いに関連付けてグラフ化することで直近統計データと基準統計データとを比較する。なお、詳細は後述するが、図7~図9は、燃焼装置30に不調が生じたときのグラフを示している。図7~図9では、共通の座標平面に各分布データをグラフ化することで、各分布データが互いに関連付けられている。比較部21Cは、グラフ化した直近分布データ及び基準分布データのグラフを、直近統計データと基準統計データとの比較結果としてディスプレイ24に出力し、当該グラフをディスプレイ24に表示する。
The comparison unit 21C compares the most recent statistical data obtained by the
燃焼装置30の使用期間が長くなると経年劣化等で燃焼装置30に不調が生じることがある。この不調は、着火遅れ時間Tdの変化となって現れ、直近分布データのグラフの形が、基準分布データのグラフの形と異なってくる。
When the
燃焼装置30に不調が生じると、直近分布データのグラフの形状は、不調の種類に応じて図7~図9に示すように変化する。
When a malfunction occurs in the
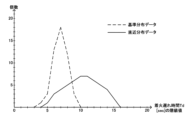
図7では、直近分布データのグラフが、基準分布データのグラフに比べて、全体的に着火遅れ時間Tdが長い方向にシフトしており、かつ、大きな標準偏差を有する。このような不調としては、(1)メインバーナ42及びパイロットバーナ43に供給される空気と燃料ガスとの比率つまり空燃比の乱れ、及び、(2)点火装置44のスパーク発生部44Aが曲がるなどするスパーク発生部44Aの不具合が挙げられる。上記(1)では、メインバーナ42及び又はパイロットバーナ43で空燃比がガスリッチ又は空気リッチになる。これにより、各バーナ42又は43の点火又は着火のタイミングが安定せず、着火遅れ時間Tdが長くなる傾向となる。また、上記(2)では、点火スパークのエネルギーが小さくなることによりパイロットバーナ43の点火のタイミングが遅れ、結果的にメインバーナ42の着火のタイミングが遅れる。また、上記(1)ほどでない空燃比のわずかな乱れも着火遅れに繋がる。このように、直近分布データのグラフは、不調が上記(1)又は(2)である場合には、図7のようになる。図7のような比較結果を確認したユーザは、上記(1)又は(2)のいずれかが生じていると推定することができる。
7, the graph of the most recent distribution data is generally shifted to the direction of longer ignition delay time Td compared to the graph of the reference distribution data, and has a large standard deviation. Such malfunctions include (1) disturbances in the ratio of air and fuel gas supplied to the
上記(1)と(2)のうち、(1)では、空燃比の乱れにより、メインバーナ42での燃焼が完全ではない。従って、メインバーナ42の火炎が正常時に比べて弱くなる。他方、上記(2)では、空燃比の乱れはないので、火炎自体が弱くなるようなことはない。そこで、ユーザは、図7のような比較結果を得た場合、操作装置25(図3)を操作して火炎活発度データの読み出しを指示する。このような場合、図4に示す火炎活発度処理部21Dは、初期の着火トライアルで得られた火炎活発度データと、直近の着火トライアルで得られた火炎活発度データとに基づいて、各火炎活発度データにおける任意の時点での火炎の活発度をディスプレイ24に表示する。ユーザは、この電圧値が初期に比べて直近の方が低ければ、不調の原因が上記(1)の空燃比の乱れにあると推定できる。空燃比の乱れは、ダンパ55及び65の不調、ブロワ62の不調などを原因として発生する。ユーザは、前記の推定に基づいてダンパ55及び65、ブロワ62などを点検することができる。
Of the above (1) and (2), in (1), the combustion in the
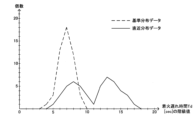
図8の直近分布データのグラフと基準分布データのグラフとを比べると、基準分布データのグラフの山のピークの数は1つであるが、直近分布データのピークの数は複数である。さらに、直近分布データの方が、標準偏差が大きい。このような不調としては、(3)点火装置44のスパーク発生部44Aに煤が付着したことなどによる絶縁不良といったスパーク発生部44Aの不具合が挙げられる。このような不調があると、点火装置44のスパーク発生部44Aの放電タイミングが安定せず点火が遅れ気味となり、グラフの標準偏差が広がり、グラフの山のピークが複数現れる。このような比較結果を確認したユーザは、図8のような比較結果を確認したユーザは、上記(3)の不調が生じていると推定することができる。
Comparing the graph of the most recent distribution data in FIG. 8 with the graph of the reference distribution data, the graph of the reference distribution data has one mountain peak, but the most recent distribution data has multiple peaks. Furthermore, the standard deviation is larger for the most recent distribution data. An example of such a malfunction is (3) a malfunction of the
図9では、直近分布データのグラフが、基準分布データのグラフに比べて、全体的に着火遅れ時間Tdが短い方にシフトしている。このような不調の原因としては、(4)火炎検出器45の配置不良、(5)偽放電などの火炎検出器45の不具合、(6)空燃比の乱れ(ガスリッチ)が挙げられる。偽放電は、火炎検出器45が火炎からの電磁波(例えば、紫外線)を検出する放電管を有する場合に生じる。放電管は、電磁波が入射されると放電を生じさせるが、経年劣化等により、電磁波が入射されないときも放電を生じることがある。この放電を偽放電という。上記(4)は、火炎検出器45の位置及び向きが悪く、点火スパークを検出しているケースなどが挙げられる。上記(6)は、空燃比において、燃焼ガスの比率が高まったときの乱れである。図9のような比較結果を確認したユーザは、上記(4)(5)、又は(6)のいずれかの不調が生じていると推定することができる。
In FIG. 9, the graph of the most recent distribution data is generally shifted to the shorter ignition delay time Td compared to the graph of the reference distribution data. The causes of such malfunction include (4) improper placement of the
なお、上記の偽放電では、火炎検出器45が検出した火炎の活発度が時間変化に伴って振幅する。他方、上記(4)の配置不良ではそのような振幅は生じない。そこで、ユーザは、図9のような比較結果を得た場合、操作装置25を操作して火炎活発度データの読み出しを指示する。このような場合、図4に示す火炎活発度処理部21Dは、直近の着火トライアルで得られた火炎活発度データに基づいて、フレーム電圧VFの電圧値の時間変化を火炎の活発度の時間変化としてディスプレイ24に表示する。ユーザは、この火炎の活発度が大きく振幅していれば、不調の原因が上記(5)にあると推定できる。
In the above false discharge, the flame activity detected by the
以上の通り、本実施の形態では、着火遅れ時間Tdの集合を統計的に解析して得られた直近統計データ(第1統計データ)と、基準となる基準統計データ(第2統計データ)との比較結果として、直近統計データと基準統計データとのそれぞれが含む直近分布データ及び基準分布データの各グラフを横軸及び縦軸を共通とした形で重畳して表示する。これにより、ユーザは、両グラフの形状を確認することで、燃焼装置30の不調の有無といった不調の傾向を把握することができる。ここで、この実施の形態では、複数回の着火トライアルそれぞれの着火遅れ時間Tdの集合を統計的に解析して得られる統計データを用いた比較が行われるので、着火遅れ時間Tdの変化の傾向が比較結果に反映されやすい。従って、ユーザは、比較結果を確認することで、燃焼装置30に不調が生じ始めていることつまり不調が発生する傾向にある旨といった不調の傾向を素早く把握できる。また、燃焼装置30の不調に由来しない突発的な事象により着火遅れ時間Tdが大きく変化したとしても、この影響が統計的解析により軽減されるので、ユーザは、燃焼装置30の不調の有無を高い確度で把握できる。以上のように、本実施の形態によれば、ユーザは、比較結果つまり、直近分布データ及び基準分布データの各グラフを見ることにより、燃焼装置30の不調を適切に把握することができる。
As described above, in this embodiment, as a comparison result between the most recent statistical data (first statistical data) obtained by statistically analyzing a set of ignition delay times Td and the reference statistical data (second statistical data) serving as a reference, the graphs of the most recent distribution data and the reference distribution data contained in the most recent statistical data and the reference statistical data are displayed superimposed with the horizontal and vertical axes common to each other. This allows the user to grasp the tendency of malfunction, such as the presence or absence of malfunction in the
燃焼装置30の不着火又は断火などの異常からの復旧は、メインバーナ42周辺の機器などが複雑であることなどから、時間がかかる。この実施の形態では、燃焼装置30の異常の予兆となる燃焼装置30の不調をユーザが把握できるので、異常発生前の対処が可能となる。
Recovery from an abnormality such as misfire or flame failure of the
さらに、上記実施の形態では、比較結果として、直近分布データ及び基準分布データの各グラフを表示することにより、ユーザは、直近分布データの形状の変化等から、不調の種類を推定できる。このため、燃焼装置30のメンテンナンスの効率化、及び、仮に燃焼装置30に異常が発生したときの異常箇所の特定の容易化が図られる。
Furthermore, in the above embodiment, by displaying graphs of the most recent distribution data and the reference distribution data as the comparison results, the user can infer the type of malfunction from changes in the shape of the most recent distribution data, etc. This improves the efficiency of maintenance of the
直近統計データと比較される基準統計データは、燃焼装置30と同型の燃焼装置を用いた実験の結果などから求められ予め用意されていてもよいが、この実施の形態では、燃焼装置30で実際に実行された着火トライアルで測定された着火遅れ時間Tdに基づいて基準統計データが生成されることで、基準統計データが用意されている。これにより、複数生産させる燃焼装置30の個々の癖を反映した基準統計データが得られるので、ユーザは、燃焼装置30の不調をより適切に把握できる。
The reference statistical data to be compared with the most recent statistical data may be prepared in advance based on the results of an experiment using a combustion device of the same type as the
解析部21Bは、例えば、複数回分の着火トライアルそれぞれの着火遅れ時間Tdの集合を統計的に解析し、当該集合の統計データを第1統計データ(上記では直近統計データ)として得るように構成されていればよく、その解析方法は任意である。さらに、比較部21Cは、例えば、第1統計データと、着火トライアルが複数回行われたときの着火遅れ時間の集合の統計データとして用意された基準となる第2統計データ(上記では基準統計データ)とを比較し、比較結果を出力するように構成されていればよい。比較方法及び比較結果は任意である。これら構成によれば、統計的な解析により、着火遅れ時間Tdの変化の傾向つまり不調が発生する傾向にある旨などの不調の傾向の把握が可能となり、さらに、燃焼装置30の不調に由来しない、着火遅れ時間Tdを大きく変化させる突発的な事象の発生の影響の軽減も可能となる。従って、ユーザは、燃焼装置30に不調が発生したか否かを高い確度で把握することができ、これにより、燃焼装置30の不調を適切に把握できる。
The
(変形例)
上記実施の形態の構成は、任意に変更可能である。以下変形例を例示する。各変形例は、少なくとも一部同士組み合わせることもできる。
(Modification)
The configuration of the above embodiment can be modified as desired. Modifications are shown below as examples. Each modification can be combined with at least a portion of the others.
(変形例1)
燃焼装置30の構成は、任意である。例えば、燃焼装置30は、パイロットバーナ43がないメインバーナ42のみを有するタイプであってもよい。また、燃焼装置30は、パイロットバーナ43を常時点火させた状態としてもよい。この場合、メインバーナ42用の火炎検出器と、パイロットバーナ43用の火炎検出器と、を用意するとよい。着火遅れ時間Tdは、例えば、パイロットバーナ43又はメインバーナ42への点火又は着火を指示する信号を出力する着火指示から、メインバーナ42の着火を検出する着火検出までの期間であればよい。
(Variation 1)
The configuration of the
(変形例2)
比較部21Cは、縦軸を着火遅れ時間の階級とし、横軸を着火遅れ時間の個数として、直近統計データの直近分布データと、基準統計データの基準分布データと、を互いに関連付けてグラフ化してもよい。関連付けてグラフ化する手法は、上記のように、縦軸及び横軸を共通にした座標平面で各グラフを重畳する方法に限定されない。例えば、座標軸のスケールを共通とした異なる座標平面それぞれに各グラフがあらわされてもよい。このように、関連付けてグラフ化する手法は、例えば、ユーザが各分布データを比較可能な手法でグラフ化する手法であればよい。上記統計的な解析の対象の着火遅れ時間Tdの集合のうち、突発的に異常な数値の着火遅れ時間Tdについては、解析対象から除外してもよい。
(Variation 2)
The comparison unit 21C may graph the most recent distribution data of the most recent statistical data and the reference distribution data of the reference statistical data in association with each other, with the vertical axis representing the class of the ignition delay time and the horizontal axis representing the number of ignition delay times. The method of graphing in association is not limited to the method of superimposing each graph on a coordinate plane with a common vertical axis and horizontal axis as described above. For example, each graph may be represented on a different coordinate plane with a common scale of the coordinate axis. In this way, the method of graphing in association may be, for example, a method of graphing each distribution data by a method that allows a user to compare them. Among the set of ignition delay times Td to be the subject of the statistical analysis, ignition delay times Td with suddenly abnormal values may be excluded from the analysis target.
(変形例3)
比較部21Cは、直近統計データと基準統計データとの差に基づいて、燃焼装置30の不調の有無及び不調があった場合のその不調の種類を推定し、推定の結果を比較結果として出力するように構成されていればよい。この場合、解析部21Bは、上記の統計的な解析において、解析対象の集合に含まれる着火遅れ時間Td(正規化された着火遅れ時間Tdを含む)の分布を表す統計量を算出してもよい。この場合、直近統計データと基準統計データとは、着火遅れ時間Tdの分布を表す統計量を含む。比較部21Cは、各統計量を比較することで燃焼装置の不調の有無及び不調があった場合のその種類を推定し、推定の結果を比較結果として出力してもよい。
(Variation 3)
The comparison unit 21C may be configured to estimate the presence or absence of a malfunction in the
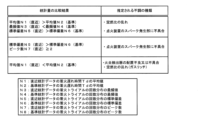
統計量の比較結果と不調の種類の推定の結果との関係の例を図10に示す。前記の統計量は、例えば、着火遅れ時間Tdの平均値と、着火遅れ時間Tdの階級それぞれに属する着火遅れ時間Tdの個数の分布における最頻値を取る前記個数(最頻値個数ともいう)、前記分布の標準偏差、及び、前記分布のピーク数を含む。なお、直近統計データの平均値、最頻値個数、標準偏差、ピーク数を、N1、N3、N5、N7とそれぞれいう。基準統計データの平均値、最頻値個数、標準偏差、ピーク数を、N2、N4、N6、N8とそれぞれいう。 An example of the relationship between the statistical quantity comparison result and the result of estimating the type of malfunction is shown in FIG. 10. The statistical quantities include, for example, the average value of the ignition delay time Td, the number of ignition delay times Td that take the most frequent value in the distribution of the number of ignition delay times Td that belong to each class of ignition delay times Td (also called the number of modes), the standard deviation of the distribution, and the number of peaks in the distribution. The average value, number of modes, standard deviation, and number of peaks of the most recent statistical data are referred to as N1, N3, N5, and N7, respectively. The average value, number of modes, standard deviation, and number of peaks of the reference statistical data are referred to as N2, N4, N6, and N8, respectively.
比較結果が、図10に示す、平均値N1(直近)>平均値N2(基準)、最頻値個数N3(直近)<最頻値個数N4(基準)、かつ、標準偏差N5(直近)>標準偏差N6(基準)の場合、着火遅れ時間Tdの分布は、図7のようになる。そこで、比較部21Cは、前記の条件が満たされる場合、燃焼装置30に不調があり、かつ、その不調の種類は、空燃比の乱れ又は点火装置44のスパーク発生部44Aの不具合と推定し、その旨(前記不調の少なくともいずれかが発生している旨、又は、他の条件も加味して、前記不調のいずれかが発生している旨)を比較結果として出力する(例えば、ディスプレイ24に表示する。以下の比較結果の出力において同様)。比較部21Cは、スパーク発生部44Aの不具合として、スパーク発生部44Aが変形している旨を推定及び出力してもよい。なお、平均値N1(直近)>平均値N2(基準)、最頻値個数N3(直近)<最頻値個数N4(基準)、標準偏差N5(直近)>標準偏差N6(基準)のうちの少なくとも1つが満たされた場合、燃焼装置30に不調があり、かつ、その不調の種類は、空燃比の乱れ又は点火装置44のスパーク発生部44Aの不具合と推定してもよい。
When the comparison result is shown in FIG. 10, where the average value N1 (most recent)>the average value N2 (reference), the number of most recent values N3 (most recent)<the number of most recent values N4 (reference), and the standard deviation N5 (most recent)>the standard deviation N6 (reference), the distribution of the ignition delay time Td is as shown in FIG. 7. Therefore, when the above conditions are satisfied, the comparison unit 21C estimates that there is a malfunction in the
なお、上述のように、空燃比の乱れの場合は、火炎の活発度が低下する。このため、火炎活発度処理部21Dは、基準となる初期(初期の一回でも一定回数でもよい)の着火トライアルで得られた火炎活発度データと、直近(直近の一回でも一定回数でもよい)の着火トライアルで得られた火炎活発度データとに基づいて、各火炎活発度データにおける任意の時点での火炎の活発度を比較する。比較の結果、後者が所定の基準以上に低ければ、比較部21Cは、空燃比の乱れを不調の種類として推定してもよい。このように、比較部21Cは、火炎検出器45が検出する火炎の活発度が所定基準よりも低下している場合に、不調の種類が空燃比の乱れであるとして推定してもよい。
As described above, the flame activity decreases when the air-fuel ratio is disturbed. Therefore, the flame
なお、空燃比の乱れは、ブロワ62の不具合に由来することもある。そこで、比較部21Cは、ブロワ62が動作してから風圧スイッチ63がオンとなった時点までの期間を着火トライルごとに計測し、当該期間が所定基準よりも長くなっている場合又は短くなっている場合に、不調の種類が空燃比の乱れであるとして推定してもよい。
Note that disturbances in the air-fuel ratio may also result from a malfunction of the
比較結果が、図10に示す、標準偏差N5(直近)>標準偏差N6(基準)、及び、ピーク数N7(直近)≧2である場合、着火遅れ時間Tdの分布は、図8のようになる。そこで、比較部21Cは、前記の条件が満たされる場合、燃焼装置30に不調があり、かつ、その不調の種類は、点火装置44のスパーク発生部44Aの不具合と推定し、その旨を比較結果として出力する。このとき、比較部21Cは、スパーク発生部44Aの不具合が絶縁不良である旨を出力してもよい。なお、標準偏差N5(直近)>標準偏差N6(基準)、及び、ピーク数N7(直近)≧2のうちの少なくとも1つが満たされた場合、燃焼装置30に不調があり、かつ、その不調の種類は、点火装置44のスパーク発生部44Aの不具合であると推定してもよい。
When the comparison result is shown in FIG. 10, where standard deviation N5 (most recent)>standard deviation N6 (reference) and number of peaks N7 (most recent)≧2, the distribution of the ignition delay time Td is as shown in FIG. 8. Therefore, when the above conditions are satisfied, the comparison unit 21C estimates that there is a malfunction in the
比較結果が、図10に示す、平均値N1(直近)<平均値N2(基準)である場合、着火遅れ時間Tdの分布は、図9のようになる。そこで、比較部21Cは、前記の条件が満たされる場合、燃焼装置30に不調があり、かつ、その不調の種類は、火炎検出器45の配置不良又は不具合、又は、空燃比の乱れ(ガスリッチ)と推定し、その旨(前記不調の少なくともいずれかが発生している旨、又は、他の条件も加味して、前記不調のいずれかが発生している旨)を比較結果として出力する。このとき、比較部21Cは、火炎検出器45の不具合が、偽放電によるものである旨を出力してもよい。
When the comparison result is shown in FIG. 10, where average value N1 (most recent) < average value N2 (reference), the distribution of ignition delay time Td will be as shown in FIG. 9. Therefore, when the above condition is satisfied, comparison unit 21C estimates that there is a malfunction in
上記のように、偽放電では、火炎の活発度が時間変化に伴って振幅する。このため、火炎活発度処理部21Dは、直近(直近の一回又は複数回)の着火トライアルで得られた火炎活発度データに基づいて、火炎の活発度の時間変化の振幅(例えば、最大振幅)を特定する。比較部21Cは、特定された前記の振幅が所定値より大きければ、火炎検出器45の不具合を不調の種類として推定してもよい。このように、比較部21Cは、火炎検出器45が検出する火炎の活発度の振幅が所定基準よりも大きい場合に、不調の種類が火炎検出器45の不具合又は偽放電であると推定してもよい。
As described above, in a false discharge, the flame activity varies with time. For this reason, the flame
比較部21Cは、図10に示す統計量の比較結果と不調の種類との関係のうち、少なくとも一つについて、統計量の算出及び比較を行ってもよい。図10に示す各統計量の大小の条件は、大小が比較される統計量の差の絶対値が所定の閾値よりも大きい場合に、上記大小の条件が成り立つとしてもよい。統計量として、他の数量が採用されてもよい。 The comparison unit 21C may calculate and compare statistics for at least one of the relationships between the comparison results of the statistics shown in FIG. 10 and the types of illness. The condition for the magnitude of each statistical quantity shown in FIG. 10 may be satisfied when the absolute value of the difference between the statistical quantities being compared is greater than a predetermined threshold value. Other quantities may be used as the statistical quantity.
本変形例によれば、出力された比較結果により、ユーザは、不調の有無に加えて、不調の種類の推定結果も把握できるので、より適切に燃焼装置30の不調を把握できる。
According to this modified example, the output comparison result allows the user to grasp not only the presence or absence of a malfunction, but also an estimated result of the type of malfunction, so that the user can more appropriately grasp the malfunction of the
(変形例4)
着火遅れ時間監視装置20のハードウェア構成は任意である。収集部21A、解析部21B、比較部21C、及び、火炎活発度処理部21Dは、それぞれ、一以上のコンピュータ又は制御回路(ASIC(Application Specific Integrated Circuit)、又は、FPGA(Field-Programmable Gate Array)など)から構成されてもよい。前記各部21A~21Dのうちの少なくとも一部は、燃焼制御装置70が備えてもよい。着火遅れ時間監視装置20は、サーバコンピュータ、クラウドコンピュータ等であってもよい。これらの場合、上記比較結果などが表示されるディスプレイ24は、ユーザ端末などのディスプレイであってもよい。比較部21C及び火炎活発度処理部21Dからの比較結果又は火炎活発度データなどの各種データの出力先は、プリンタ、記憶媒体、ネットワーク、他のコンピュータ等であってもよい。上記着火遅れ時間監視装置20などの各装置は、装置の構成要素が一つの筐体にまとめられた装置の他、装置の構成要素が複数の筐体に分散して収容されたシステムを含む。
(Variation 4)
The hardware configuration of the ignition delay
(着火遅れ時間監視方法)
上記着火遅れ時間監視装置20が実行する処理により、統計的な解析、及び、直近統計データと基準統計データとの比較を行う着火遅れ時間監視方法が行われているが、当該方法の少なくとも一部は、着火遅れ時間監視装置20以外の物又は人により行われてもよい。ユーザは、直近統計データと基準統計データとの比較で得られる比較結果を確認することで、上記のように、燃焼装置30の不調を適切に把握できる。
(Method of monitoring ignition delay time)
The ignition delay time monitoring method includes a process executed by the ignition delay
(本発明の範囲)
以上、実施形態及び変形例を参照して本発明を説明したが、本発明は、上記実施形態及び変形例に限定されるものではない。例えば、本発明には、本発明の技術思想の範囲内で当業者が理解し得る、上記実施形態及び変形例に対する様々な変更が含まれる。上記実施形態及び変形例に挙げた各構成は、矛盾の無い範囲で適宜組み合わせることができる。
(Scope of the present invention)
Although the present invention has been described above with reference to the embodiments and modifications, the present invention is not limited to the above embodiments and modifications. For example, the present invention includes various modifications to the above embodiments and modifications that can be understood by a person skilled in the art within the scope of the technical concept of the present invention. The configurations listed in the above embodiments and modifications can be appropriately combined within a range without contradiction.
10…燃焼システム、20…着火遅れ時間監視装置、21…プロセッサ、21A…収集部、21B…解析部、21C…比較部、21D…火炎活発度処理部、23…記憶装置、25…操作装置、40…燃焼機器、42…メインバーナ、43…パイロットバーナ、44…点火装置、44A…スパーク発生部、45…火炎検出器、50…燃料供給系統、60…空気供給系統、70…燃焼制御装置。 10...combustion system, 20...ignition delay time monitoring device, 21...processor, 21A...collection section, 21B...analysis section, 21C...comparison section, 21D...flame activity processing section, 23...storage device, 25...operation device, 40...combustion equipment, 42...main burner, 43...pilot burner, 44...ignition device, 44A...spark generating section, 45...flame detector, 50...fuel supply system, 60...air supply system, 70...combustion control device.
Claims (9)
前記収集部により収集された複数回分の前記着火トライアルそれぞれの前記着火遅れ時間の集合を統計的に解析し、当該集合の統計データを第1統計データとして得るように構成された解析部と、
前記第1統計データと、前記着火トライアルが複数回行われたときの着火遅れ時間の集合の統計データとして用意された基準となる第2統計データとを比較し、比較結果を出力するように構成された比較部と、を備え、
前記第1統計データ及び前記第2統計データは、着火遅れ時間の階級それぞれに属する着火遅れ時間の個数の分布における最頻値を取る前記個数と、前記分布の標準偏差と、の少なくとも1つを含む統計量を含み、
前記比較部は、前記第1統計データの方が前記第2統計データよりも、前記統計量に前記個数が含まれる場合に当該個数が小さく、又は、前記統計量に前記標準偏差が含まれる場合に当該標準偏差が大きい場合に、前記バーナに供給される空気と燃料との比率である空燃比の乱れ、及び、前記バーナを着火するときに使用される点火装置のスパーク発生部の不具合の少なくとも一方を前記比較結果として出力する、ように構成されている、
着火遅れ時間監視装置。 A collection unit configured to collect an ignition delay time from an ignition instruction to an ignition detection of an ignition trial for igniting the burner;
An analysis unit configured to statistically analyze a set of the ignition delay times of each of the multiple ignition trials collected by the collection unit and obtain statistical data of the set as first statistical data;
A comparison unit configured to compare the first statistical data with second statistical data that is prepared as a reference statistical data of a set of ignition delay times when the ignition trial is performed a plurality of times, and to output a comparison result ,
The first statistical data and the second statistical data include at least one of the number of times that is a mode in a distribution of the number of ignition delay times that belong to each class of ignition delay times and the standard deviation of the distribution,
the comparison unit is configured to output, as the comparison result, at least one of a disturbance in an air-fuel ratio, which is a ratio of air to fuel supplied to the burner, and a malfunction of a spark generating unit of an ignition device used to ignite the burner, when the first statistical data is smaller in number than the second statistical data when the number is included in the statistical amount, or when the standard deviation is included in the statistical amount, the standard deviation is larger.
Ignition delay time monitor.
前記収集部により収集された複数回分の前記着火トライアルそれぞれの前記着火遅れ時間の集合を統計的に解析し、当該集合の統計データを第1統計データとして得るように構成された解析部と、An analysis unit configured to statistically analyze a set of the ignition delay times of each of the multiple ignition trials collected by the collection unit and obtain statistical data of the set as first statistical data;
前記第1統計データと、前記着火トライアルが複数回行われたときの着火遅れ時間の集合の統計データとして用意された基準となる第2統計データとを比較し、比較結果を出力するように構成された比較部と、を備え、A comparison unit configured to compare the first statistical data with second statistical data that is prepared as a reference statistical data of a set of ignition delay times when the ignition trial is performed a plurality of times, and to output a comparison result,
前記第1統計データ及び前記第2統計データは、着火遅れ時間の階級それぞれに属する着火遅れ時間の個数の分布の標準偏差と、前記分布のピークの数と、の少なくとも1つを含む統計量を含み、The first statistical data and the second statistical data include at least one of a standard deviation of a distribution of the number of ignition delay times belonging to each class of ignition delay times and a number of peaks in the distribution,
前記統計量に前記ピークの数が含まれる場合に前記第2統計データの前記ピークの数は、1つであり、When the statistical amount includes the number of peaks, the number of peaks in the second statistical data is one;
前記比較部は、前記統計量に前記標準偏差が含まれる場合に前記第1統計データの方が前記第2統計データよりも前記標準偏差が大きく、又は、前記統計量に前記ピークの数が含まれる場合に前記第1統計データの前記ピークの数が複数である場合に、前記バーナを着火するときに使用される点火装置のスパーク発生部の不具合を前記比較結果として出力する、ように構成されている、the comparison unit is configured to output, as the comparison result, a malfunction of a spark generating unit of an ignition device used when igniting the burner when the standard deviation is included in the statistical amount and the standard deviation of the first statistical data is larger than that of the second statistical data, or when the number of peaks is included in the statistical amount and the number of peaks of the first statistical data is multiple.
着火遅れ時間監視装置。Ignition delay time monitor.
請求項1又は2に記載の着火遅れ時間監視装置。 The analysis unit is configured to statistically analyze a set of the ignition delay times of the ignition trials performed in the combustion device before a malfunction occurs in the combustion device that is equipped with the burner and performs the ignition trial, which is the same number of ignition trials as the plurality of ignition trials performed in the combustion device, collected by the collection unit, in the same manner as when obtaining the first statistical data, and obtain the statistical data of the set as the second statistical data.
3. The ignition delay time monitoring device according to claim 1 or 2 .
前記第2統計データは、着火遅れ時間の階級それぞれに属する着火遅れ時間の個数の分布を示す第2分布データを含む、
請求項1~3のいずれかに記載の着火遅れ時間監視装置。 The first statistical data includes first distribution data indicating a distribution of the number of ignition delay times belonging to each class of ignition delay times,
The second statistical data includes second distribution data indicating a distribution of the number of ignition delay times belonging to each class of ignition delay times.
The ignition delay time monitor according to any one of claims 1 to 3 .
第1軸を着火遅れ時間の階級とし、第2軸を着火遅れ時間の個数として、前記第1分布データと前記第2分布データとを互いに関連付けてグラフ化することで、前記第1統計データと前記第2統計データとを比較し、
互いに関連付けられてグラフ化された前記第1分布データ及び前記第2分布データの各グラフを前記比較結果として出力する、ように構成されている、
請求項4に記載の着火遅れ時間監視装置。 The comparison unit is
A first axis represents the class of the ignition delay time, and a second axis represents the number of the ignition delay time, and the first distribution data and the second distribution data are correlated with each other to create a graph, thereby comparing the first statistical data and the second statistical data;
and outputting, as the comparison result, each graph of the first distribution data and the second distribution data graphed in association with each other.
5. The ignition delay time monitoring device according to claim 4 .
前記比較部は、前記第1統計データの方が前記第2統計データよりも前記平均値が短い場合に、前記着火検出に使用される火炎検出器の配置不良、前記火炎検出器の不具合、及び、前記バーナに供給される空気と燃料との比率である空燃比の乱れの少なくとも1つを前記比較結果として出力する、ように構成されている、
請求項1~5のいずれかに記載の着火遅れ時間監視装置。 The first statistical data and the second statistical data include an average value of the ignition delay time,
the comparison unit is configured to output, when the average value of the first statistical data is shorter than that of the second statistical data, at least one of improper placement of a flame detector used for the ignition detection , a malfunction of the flame detector, and a disturbance in an air-fuel ratio, which is a ratio of air to fuel supplied to the burner, as the comparison result .
The ignition delay time monitoring device according to any one of claims 1 to 5 .
前記第1統計データと、前記着火トライアルが複数回行われたときの着火遅れ時間の集合の統計データとして用意された基準となる第2統計データとを比較し、比較結果を得る比較ステップと、を備え、
前記第1統計データ及び前記第2統計データは、着火遅れ時間の階級それぞれに属する着火遅れ時間の個数の分布における最頻値を取る前記個数と、前記分布の標準偏差と、の少なくとも1つを含む統計量を含み、
前記比較ステップでは、前記第1統計データの方が前記第2統計データよりも、前記統計量に前記個数が含まれる場合に当該個数が小さく、又は、前記統計量に前記標準偏差が含まれる場合に当該標準偏差が大きい場合に、前記バーナに供給される空気と燃料との比率である空燃比の乱れ、及び、前記バーナを着火するときに使用される点火装置のスパーク発生部の不具合の少なくとも一方を前記比較結果として得る、
着火遅れ時間監視方法。 an analysis step of statistically analyzing a set of ignition delay times from an ignition command to an ignition detection for each of a plurality of ignition trials for igniting the burner, and obtaining statistical data of the set as first statistical data;
A comparison step of comparing the first statistical data with second statistical data that is prepared as a reference statistical data of a set of ignition delay times when the ignition trial is performed a plurality of times, and obtaining a comparison result ,
The first statistical data and the second statistical data include at least one of the number of times that is a mode in a distribution of the number of ignition delay times that belong to each class of ignition delay times and the standard deviation of the distribution,
In the comparison step, when the number is included in the statistical amount and the first statistical data has a smaller number, or when the standard deviation is included in the statistical amount and the standard deviation is larger, the comparison result indicates at least one of a disturbance in an air-fuel ratio, which is a ratio of air to fuel supplied to the burner, and a malfunction of a spark generating unit of an ignition device used to ignite the burner.
Ignition delay time monitoring method.
前記第1統計データと、前記着火トライアルが複数回行われたときの着火遅れ時間の集合の統計データとして用意された基準となる第2統計データとを比較し、比較結果を得る比較ステップと、を備え、A comparison step of comparing the first statistical data with second statistical data that is prepared as a reference statistical data of a set of ignition delay times when the ignition trial is performed a plurality of times, and obtaining a comparison result,
前記第1統計データ及び前記第2統計データは、着火遅れ時間の階級それぞれに属する着火遅れ時間の個数の分布の標準偏差と、前記分布のピークの数と、の少なくとも1つを含む統計量を含み、The first statistical data and the second statistical data include at least one of a standard deviation of a distribution of the number of ignition delay times belonging to each class of ignition delay times and a number of peaks in the distribution,
前記統計量に前記ピークの数が含まれる場合に前記第2統計データの前記ピークの数は、1つであり、When the statistical amount includes the number of peaks, the number of peaks in the second statistical data is one;
前記比較ステップでは、前記統計量に前記標準偏差が含まれる場合に前記第1統計データの方が前記第2統計データよりも前記標準偏差が大きく、又は、前記統計量に前記ピークの数が含まれる場合に前記第1統計データの前記ピークの数が複数である場合に、前記バーナを着火するときに使用される点火装置のスパーク発生部の不具合を前記比較結果として得る、In the comparison step, when the standard deviation is included in the statistical amount and the standard deviation of the first statistical data is larger than that of the second statistical data, or when the number of peaks is included in the statistical amount and the number of peaks of the first statistical data is more than one, a malfunction of a spark generating unit of an ignition device used to ignite the burner is obtained as the comparison result.
着火遅れ時間監視方法。Ignition delay time monitoring method.
Priority Applications (1)
| Application Number | Priority Date | Filing Date | Title |
|---|---|---|---|
| JP2021030605A JP7619829B2 (en) | 2021-02-26 | 2021-02-26 | Ignition delay time monitoring device, ignition delay time monitoring program, and ignition delay time monitoring method |
Applications Claiming Priority (1)
| Application Number | Priority Date | Filing Date | Title |
|---|---|---|---|
| JP2021030605A JP7619829B2 (en) | 2021-02-26 | 2021-02-26 | Ignition delay time monitoring device, ignition delay time monitoring program, and ignition delay time monitoring method |
Publications (2)
| Publication Number | Publication Date |
|---|---|
| JP2022131591A JP2022131591A (en) | 2022-09-07 |
| JP7619829B2 true JP7619829B2 (en) | 2025-01-22 |
Family
ID=83152786
Family Applications (1)
| Application Number | Title | Priority Date | Filing Date |
|---|---|---|---|
| JP2021030605A Active JP7619829B2 (en) | 2021-02-26 | 2021-02-26 | Ignition delay time monitoring device, ignition delay time monitoring program, and ignition delay time monitoring method |
Country Status (1)
| Country | Link |
|---|---|
| JP (1) | JP7619829B2 (en) |
Family Cites Families (2)
| Publication number | Priority date | Publication date | Assignee | Title |
|---|---|---|---|---|
| JP2989104B2 (en) * | 1994-11-18 | 1999-12-13 | 東京瓦斯株式会社 | Combustion control device |
| JPH10160160A (en) * | 1996-11-27 | 1998-06-19 | Hitachi Bill Shisetsu Eng Kk | Misfire prediction method for burner for high temperature regenerator and misfire prediction device for the burner |
-
2021
- 2021-02-26 JP JP2021030605A patent/JP7619829B2/en active Active
Also Published As
| Publication number | Publication date |
|---|---|
| JP2022131591A (en) | 2022-09-07 |
Similar Documents
| Publication | Publication Date | Title |
|---|---|---|
| JP5346190B2 (en) | Method and system for gas turbine combustion consumption detection using fuel normalized power response | |
| US10288287B2 (en) | Combustion system | |
| US20220042682A1 (en) | Diagnosis support device and diagnostic method | |
| JP7619829B2 (en) | Ignition delay time monitoring device, ignition delay time monitoring program, and ignition delay time monitoring method | |
| JP2019060573A (en) | Combustion system | |
| JP7658755B2 (en) | Flame monitoring device, flame monitoring program, and flame monitoring method | |
| JP7612452B2 (en) | Flame detector monitoring device, flame detector monitoring program, and flame detector monitoring method | |
| JP7612453B2 (en) | Flame monitoring device, flame monitoring program, and flame monitoring method | |
| JP7612465B2 (en) | Delay time monitoring device, delay time monitoring program, and delay time monitoring method | |
| JP6843722B2 (en) | Combustion system | |
| JP7690340B2 (en) | Heat adjustment monitoring device, heat adjustment monitoring program, and heat adjustment monitoring method | |
| KR102019370B1 (en) | Igniter misfire detection device of gas appliance and control method therefor | |
| JP6649827B2 (en) | Combustion system | |
| JP7708597B2 (en) | Heat adjustment monitoring device, heat adjustment monitoring program, and heat adjustment monitoring method | |
| JP3062019B2 (en) | Combustion control device | |
| CN113423991A (en) | Burner arrangement and method for operating a burner arrangement | |
| JP7708598B2 (en) | Heat adjustment monitoring device, heat adjustment monitoring program, and heat adjustment monitoring method | |
| JP2019074291A (en) | State determination device of flame rod | |
| US20240035658A1 (en) | Flame monitoring device and flame monitoring program | |
| JP2023177452A (en) | Combustion monitoring device and combustion monitoring program | |
| JP6981798B2 (en) | Combustion system and malfunction determination device | |
| JP3120008B2 (en) | Combustion control method | |
| JP3120009B2 (en) | Combustion control device | |
| JPH0512615Y2 (en) | ||
| JP2989104B2 (en) | Combustion control device |
Legal Events
| Date | Code | Title | Description |
|---|---|---|---|
| A621 | Written request for application examination |
Free format text: JAPANESE INTERMEDIATE CODE: A621 Effective date: 20231226 |
|
| A977 | Report on retrieval |
Free format text: JAPANESE INTERMEDIATE CODE: A971007 Effective date: 20240828 |
|
| A131 | Notification of reasons for refusal |
Free format text: JAPANESE INTERMEDIATE CODE: A131 Effective date: 20241001 |
|
| A521 | Request for written amendment filed |
Free format text: JAPANESE INTERMEDIATE CODE: A523 Effective date: 20241202 |
|
| TRDD | Decision of grant or rejection written | ||
| A01 | Written decision to grant a patent or to grant a registration (utility model) |
Free format text: JAPANESE INTERMEDIATE CODE: A01 Effective date: 20241217 |
|
| A61 | First payment of annual fees (during grant procedure) |
Free format text: JAPANESE INTERMEDIATE CODE: A61 Effective date: 20250109 |
|
| R150 | Certificate of patent or registration of utility model |
Ref document number: 7619829 Country of ref document: JP Free format text: JAPANESE INTERMEDIATE CODE: R150 |