JP7600611B2 - Biological information analysis system, information processing device, and biological information measuring device - Google Patents
Biological information analysis system, information processing device, and biological information measuring device Download PDFInfo
- Publication number
- JP7600611B2 JP7600611B2 JP2020176001A JP2020176001A JP7600611B2 JP 7600611 B2 JP7600611 B2 JP 7600611B2 JP 2020176001 A JP2020176001 A JP 2020176001A JP 2020176001 A JP2020176001 A JP 2020176001A JP 7600611 B2 JP7600611 B2 JP 7600611B2
- Authority
- JP
- Japan
- Prior art keywords
- measurement data
- analysis
- information
- unit
- biological information
- Prior art date
- Legal status (The legal status is an assumption and is not a legal conclusion. Google has not performed a legal analysis and makes no representation as to the accuracy of the status listed.)
- Active
Links
- 238000004458 analytical method Methods 0.000 title claims description 275
- 230000010365 information processing Effects 0.000 title claims description 51
- 238000005259 measurement Methods 0.000 claims description 302
- 238000003860 storage Methods 0.000 claims description 22
- QVGXLLKOCUKJST-UHFFFAOYSA-N atomic oxygen Chemical compound [O] QVGXLLKOCUKJST-UHFFFAOYSA-N 0.000 claims description 9
- 229910052760 oxygen Inorganic materials 0.000 claims description 9
- 239000001301 oxygen Substances 0.000 claims description 9
- 239000008280 blood Substances 0.000 claims description 8
- 210000004369 blood Anatomy 0.000 claims description 8
- 238000000034 method Methods 0.000 description 54
- 238000012360 testing method Methods 0.000 description 23
- 238000012545 processing Methods 0.000 description 18
- 230000001133 acceleration Effects 0.000 description 12
- 238000004891 communication Methods 0.000 description 12
- 238000012217 deletion Methods 0.000 description 11
- 230000037430 deletion Effects 0.000 description 11
- 201000002859 sleep apnea Diseases 0.000 description 11
- 230000001186 cumulative effect Effects 0.000 description 6
- 238000001514 detection method Methods 0.000 description 6
- 238000010586 diagram Methods 0.000 description 5
- 230000006870 function Effects 0.000 description 5
- 230000000241 respiratory effect Effects 0.000 description 5
- 238000007405 data analysis Methods 0.000 description 4
- 238000009826 distribution Methods 0.000 description 4
- 239000003814 drug Substances 0.000 description 4
- 230000007774 longterm Effects 0.000 description 3
- 238000003825 pressing Methods 0.000 description 3
- 238000012216 screening Methods 0.000 description 3
- 208000000059 Dyspnea Diseases 0.000 description 2
- 206010013975 Dyspnoeas Diseases 0.000 description 2
- 238000004364 calculation method Methods 0.000 description 2
- 238000012790 confirmation Methods 0.000 description 2
- 238000013500 data storage Methods 0.000 description 2
- 239000004065 semiconductor Substances 0.000 description 2
- 208000013220 shortness of breath Diseases 0.000 description 2
- 208000019116 sleep disease Diseases 0.000 description 2
- 208000020685 sleep-wake disease Diseases 0.000 description 2
- 238000003745 diagnosis Methods 0.000 description 1
- 201000010099 disease Diseases 0.000 description 1
- 208000037265 diseases, disorders, signs and symptoms Diseases 0.000 description 1
- 238000005516 engineering process Methods 0.000 description 1
- 239000004973 liquid crystal related substance Substances 0.000 description 1
- 238000002360 preparation method Methods 0.000 description 1
- 239000000523 sample Substances 0.000 description 1
- 230000007704 transition Effects 0.000 description 1
- 210000000707 wrist Anatomy 0.000 description 1
Images


Landscapes
- Measuring Pulse, Heart Rate, Blood Pressure Or Blood Flow (AREA)
- Measurement Of The Respiration, Hearing Ability, Form, And Blood Characteristics Of Living Organisms (AREA)
- Measuring And Recording Apparatus For Diagnosis (AREA)
Description
本発明は、生体情報解析システム、情報処理装置及び生体情報測定装置に関する。 The present invention relates to a biometric information analysis system, an information processing device, and a biometric information measuring device.
従来、生体情報測定装置として、プローブ等の光検出器を指先等の生体部位に付けて動脈血酸素飽和度(SpO2)や脈拍数等の生体情報を測定するパルスオキシメーターが知られている(特許文献1参照)。パルスオキシメーターには、連続測定・記録ができず、スポットチェックに使用されるものや、一定時間の測定データをメモリーに記録可能なものがある。メモリーに記録された測定データは、後に解析され、特定の疾患の発見や、容態の判定に利用される。 Conventionally, pulse oximeters have been known as biological information measuring devices, in which a light detector such as a probe is attached to a biological part such as a fingertip to measure biological information such as arterial blood oxygen saturation ( SpO2 ) and pulse rate (see Patent Document 1). Some pulse oximeters are not capable of continuous measurement and recording and are used for spot checks, while others are capable of recording measurement data for a certain period of time in memory. The measurement data recorded in memory is later analyzed and used to discover specific diseases and assess the patient's condition.
また、パルスオキシメーターに内蔵された加速度センサーにより、患者の動きを示す労作情報を取得する場合もある。 In addition, an acceleration sensor built into the pulse oximeter may be used to obtain exertion information indicating the patient's movement.
メモリーを有するパルスオキシメーターは、例えば、睡眠時無呼吸症候群(SAS:Sleep Apnea Syndrome)のスクリーニング検査に使用される。SASスクリーニング検査では、睡眠時のデータが取得される。
また、呼吸器・循環器等の病棟では、患者のバイタルチェックとして、パルスオキシメーターが使用される。呼吸器内科等では、24時間のデータが取得される。
このようなパルスオキシメーターの使用方法では、8時間から24時間といった比較的長い期間のSpO2のトレンドを確認し、労作情報については、各タイミングにおけるイベント(トイレ、歩行等)との関係を知ることが重要である。
A pulse oximeter having a memory is used, for example, in a screening test for sleep apnea syndrome (SAS), in which data is obtained during sleep.
In addition, in respiratory and circulatory wards, pulse oximeters are used to check patients' vital signs. In respiratory medicine departments, data is collected for 24 hours.
When using a pulse oximeter in this way, it is important to check the SpO2 trend over a relatively long period of time, such as 8 to 24 hours, and with regard to exertion information, it is important to know the relationship with events at each timing (toileting, walking, etc.).
一方、リハビリテーションにおける歩行試験では、パルスオキシメーターにより、6分間という短い歩行期間のデータが取得される。歩行試験では、労作情報により特定される歩行開始や終了のタイミングを把握しながら、6分間のSpO2の変化を確認することになる。 On the other hand, in a walking test in rehabilitation, data is obtained from a short walking period of six minutes using a pulse oximeter. In the walking test, the change in SpO2 over the six minutes is confirmed while grasping the timing of the start and end of walking specified by the exertion information.
比較的長期の測定を行うSASスクリーニング検査や呼吸器内科では、スパイクノイズ等を除去するために、労作情報に移動平均をかけて処理する。また、長期測定の場合には、睡眠時無呼吸指数や、労作時/安静時における統計データ等を含む解析レポートを作成し、診断に用いる。 In SAS screening tests and respiratory medicine, which involve relatively long-term measurements, a moving average is applied to the exertion information to remove spike noise, etc. In the case of long-term measurements, an analysis report is created that includes the sleep apnea index and statistical data during exertion and at rest, and is used for diagnosis.
これに対し、6分間歩行試験の解析では、歩行開始/終了を把握するため、労作情報には移動平均をかけない。また、歩行試験では、6分間の歩行期間のSpO2や脈拍数のトレンドグラフを含む解析レポートを作成する。また、測定データをグラフ化する際に用いる移動平均時間(時系列データについて移動平均をとる際に用いる時間幅)も、長期測定の場合とは異なる。 In contrast, in the analysis of the 6-minute walking test, the moving average is not applied to the exertion information in order to grasp the start/end of walking. In addition, in the walking test, an analysis report is created that includes trend graphs of SpO2 and pulse rate during the 6-minute walking period. In addition, the moving average time (time width used to take the moving average of time-series data) used in graphing the measurement data is also different from that in the case of long-term measurement.
このように、パルスオキシメーターにより測定された生体情報の測定データに対して、どのような解析を行い、どのようなグラフを表示するかは、用途により異なる。 As such, the type of analysis performed on the vital signs data measured by a pulse oximeter and the type of graph displayed will vary depending on the application.
しかし、パルスオキシメーターから測定データを取得して解析する従来の装置においては、測定データや労作情報の表示及び解析方法や作成される解析レポートは、どの用途で得られたデータでも一律に同じであった。
そこで、用途が異なり、表示や解析条件、あるいは、作成される解析レポートが違う場合には、その都度、設定画面から条件を変更する必要があるが、ユーザーは設定画面に慣れていないため、測定データに適した解析内容を設定することは難しかった。
However, in conventional devices that acquire and analyze measurement data from a pulse oximeter, the display and analysis methods of the measurement data and exertion information, as well as the analysis reports that are created, are uniform regardless of the data obtained for any purpose.
Therefore, when the purpose is different and the display or analysis conditions, or the analysis report to be created, are different, it is necessary to change the conditions from the settings screen each time. However, because users are not familiar with the settings screen, it is difficult for them to set analysis contents appropriate for the measurement data.
本発明は、上記の従来技術における問題に鑑みてなされたものであって、生体情報測定装置により得られた測定データに対して、当該測定データに適した解析を行うことを課題とする。 The present invention was made in consideration of the problems with the conventional technology described above, and aims to perform an analysis appropriate to the measurement data obtained by a biometric information measurement device.
上記課題を解決するために、請求項1に記載の発明は、被検者の動脈血酸素飽和度及び/又は脈拍数を生体情報として測定する生体情報測定部と、当該測定された生体情報の測定データを記憶するメモリー部と、を有する生体情報測定装置と、前記生体情報測定装置のメモリー部から測定データを読み込み、当該測定データに、後に当該測定データについて波形表示及び/又は解析を行う際の解析モードを示す解析モード情報を付加して記憶部に保存させる制御部を有する情報処理装置と、を備える生体情報解析システムである。
In order to solve the above problem, the invention described in
請求項2に記載の発明は、請求項1に記載の生体情報解析システムにおいて、前記制御部は、前記測定データに付加された前記解析モード情報に基づいて、当該測定データについて波形表示及び/又は解析を行う。
The invention described in
請求項3に記載の発明は、請求項2に記載の生体情報解析システムにおいて、前記情報処理装置は、前記解析モード情報ごとに、波形表示及び/又は解析の条件を変更するための条件変更部を有する。
The invention described in
請求項4に記載の発明は、請求項1から3のいずれか一項に記載の生体情報解析システムにおいて、前記情報処理装置は、前記測定データを読み込む際に、当該測定データに対する解析モード情報を選択するためのモード選択部を有し、前記制御部は、前記選択された解析モード情報を前記測定データに付加する。
The invention described in
請求項5に記載の発明は、被検者の動脈血酸素飽和度及び/又は脈拍数を生体情報として測定する生体情報測定部と、当該測定された生体情報の測定データを記憶するメモリー部と、を有する生体情報測定装置のメモリー部から測定データを読み込み、当該測定データに、後に当該測定データについて波形表示及び/又は解析を行う際の解析モードを示す解析モード情報を付加して記憶部に保存させる制御部を備える情報処理装置である。
The invention described in
請求項6に記載の発明は、被検者の動脈血酸素飽和度及び/又は脈拍数を生体情報として測定する生体情報測定部と、当該測定された生体情報の測定データに、後に当該測定データについて波形表示及び/又は解析を行う際の解析モードを示す解析モード情報を付加して記憶するメモリー部と、を有する生体情報測定装置である。
The invention described in
本発明によれば、生体情報測定装置により得られた測定データに対して、当該測定データに適した解析を行うことができる。 According to the present invention, it is possible to perform an analysis appropriate to the measurement data obtained by the bioinformation measuring device.
以下、本発明の実施の形態について、図面を参照しながら説明する。ただし、本発明の範囲は、図示例に限定されるものではない。 The following describes an embodiment of the present invention with reference to the drawings. However, the scope of the present invention is not limited to the illustrated examples.
(生体情報解析システムの構成)
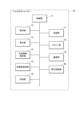
図1に、本実施の形態における生体情報解析システム100の全体構成例を示す。図1に示すように、生体情報解析システム100は、複数のパルスオキシメーター10と、情報処理装置30と、を備えて構成されている。
(Biometric information analysis system configuration)
1 shows an example of the overall configuration of a biological
パルスオキシメーター10は、動脈血酸素飽和度(SpO2)、脈拍数等の生体情報を測定する生体情報測定装置である。パルスオキシメーター10は、生体情報の測定時に、測定対象となる被検者の指に装着される。
The
情報処理装置30は、生体情報の測定データの解析に用いられる装置である。情報処理装置30は、USB(Universal Serial Bus)ハブ40を含むUSBケーブルを介して、複数のパルスオキシメーター10を同時に接続可能となっており、各パルスオキシメーター10からデータを読み出して処理する。情報処理装置30としては、PC(Personal Computer)等が適用可能である。
The
(パルスオキシメーターの構成)
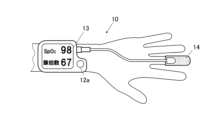
図2に、パルスオキシメーター10の機能構成例を示す。図2に示すように、パルスオキシメーター10は、制御部11、操作部12、表示部13、生体情報測定部14、加速度検知部15、計時部16、記憶部17、メモリー部18、通信部19、電力供給部20等を備えて構成されている。また、図3に、パルスオキシメーター10の外観構成例を示す。
(Configuration of a pulse oximeter)
Fig. 2 shows an example of the functional configuration of the
パルスオキシメーター10は、腕時計のように被検者の手首に対して巻き付けられ、生体情報測定部14が指に装着された状態で使用される。パルスオキシメーター10は、SASスクリーニング検査時、呼吸器内科等の病棟で患者のバイタルチェックを行う時、リハビリテーション施設等で歩行試験を行う時等に使用される。
The
制御部11は、CPU(Central Processing Unit)、RAM(Random Access Memory)等により構成される。制御部11のCPUは、記憶部17に記憶されている各種プログラムを読み出してRAMに展開し、展開されたプログラムに従って各種処理を実行する。
The
操作部12は、各種スイッチ、各種機能ボタン等を備えており、これらの操作信号を制御部11に出力する。操作部12には、電源をON/OFFするための電源ボタン12aが含まれる。
The
表示部13は、LCD(Liquid Crystal Display)等を備えて構成されており、制御部11から入力される表示信号の指示に従って表示を行う。
The
生体情報測定部14は、指先等の生体部位に装着可能に構成されており、被検者のSpO2及び脈拍数を生体情報として測定する。生体情報測定部14は、発光素子、受光素子等を備え、赤色光と赤外光を生体部位に向けて発光し、その透過光(又は反射光)を受光して、SpO2及び脈拍数の測定データを制御部11に出力する。
The biological
加速度検知部15は、加速度センサーを備え、加速度センサーにより得られた加速度の変化に基づいて、患者の動きを示す労作情報を生成する。
The
計時部16は、計時回路(RTC:Real Time Clock)を有し、この計時回路により現在日時を計時して制御部11に出力する。
The
記憶部17は、不揮発性の半導体メモリー等で構成されている。記憶部17には、各種プログラムや、各処理に用いられるデータが記憶されている。また、記憶部17には、パルスオキシメーター10の機器番号や、現在設定されている検査IDが記憶されている。
機器番号は、各パルスオキシメーター10を識別するための番号である。機器番号は、ユーザーが任意に設定した番号でもよいし、製造番号等であってもよい。
検査IDは、検査を特定するための情報である。
The
The device number is a number for identifying each
The examination ID is information for identifying an examination.
メモリー部18は、生体情報測定部14により測定された生体情報の測定データ、加速度検知部15により生成された労作情報等を記憶するための記憶装置である。なお、メモリー部18は、記憶部17の一部を利用することとしてもよい。
The
通信部19は、USBケーブルを介して情報処理装置30との間でデータの送受信を行うためのインターフェースである。
The
電力供給部20は、パルスオキシメーター10の各部が動作に要する電力を当該各部へ供給する。電力供給部20は、図示しないバッテリーから出力される電力を各部の動作電圧で供給する。
The
制御部11は、生体情報測定部14により測定された生体情報の測定データ、加速度検知部15により生成された労作情報をメモリー部18に記憶させる。なお、本実施の形態では、測定データに労作情報が含まれることとする。
The
(情報処理装置の構成)
図4に、情報処理装置30の機能構成例を示す。図4に示すように、情報処理装置30は、制御部31、操作部32、表示部33、記憶部34、通信部35等を備えて構成されている。
(Configuration of information processing device)
Fig. 4 shows an example of a functional configuration of the
制御部31は、CPU、RAM等により構成される。制御部31のCPUは、記憶部34に記憶されているシステムプログラムや処理プログラム等の各種プログラムを読み出してRAMに展開し、展開されたプログラムに従って各種処理を実行する。
The
操作部32は、カーソルキー、文字・数字入力キー及び各種機能キー等を備えたキーボードと、マウス等のポインティングデバイスを備えて構成され、キーボードに対するキー操作やマウス操作により入力された操作信号を制御部31に出力する。また、操作部32が、表示部33に積層されたタッチパネルにより構成される場合には、操作者の指等によるタッチ操作の位置に応じた操作信号を制御部31に出力する。
The
表示部33は、LCD等のモニターを備えて構成されており、制御部31から入力される表示信号の指示に従って各種画面を表示する。
The
記憶部34は、ハードディスクや不揮発性の半導体メモリー等で構成されている。記憶部34には、各種プログラムや、各処理に用いられるデータが記憶されている。また、記憶部34には、各パルスオキシメーター10から読み込まれた測定データ等が記憶される。
The
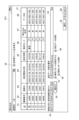
記憶部34には、解析モード情報定義テーブル341が記憶されている。図5に、解析モード情報定義テーブル341の例を示す。解析モード情報定義テーブル341には、解析モードごとに、SpO2移動平均時間、労作情報移動平均時間、作成レポート等が対応付けられている。
SpO2移動平均時間は、SpO2の測定データに対して移動平均をとる際の移動平均時間である。移動平均時間は、時系列データについて一定区間ごとの平均値を、区間をずらしながら求める際の「一定区間」に相当する時間幅である。
労作情報移動平均時間は、労作情報に対して移動平均をとる際の移動平均時間である。
作成レポートは、作成される解析レポートの種類(図11~図16参照)である。
The
The SpO2 moving average time is the moving average time when taking the moving average of the measurement data of SpO2 . The moving average time is the time width corresponding to the "fixed interval" when the average value for each fixed interval of the time series data is calculated while shifting the interval.
The exercise information moving average time is a moving average time when taking a moving average of the exercise information.
The report to be generated is the type of analysis report to be generated (see FIGS. 11 to 16).
例えば、解析モードが「通常モード」である場合には、SpO2データに対して移動平均時間を「12秒」として移動平均を求め、労作情報に対して移動平均時間を「60秒」として移動平均を求め、解析レポートとして「解析概要レポート」、「SpO2解析レポート」、「脈拍数解析レポート」、「トレンドグラフ(24時間表示)レポート」を作成することになる。
解析モードが「歩行試験モード」である場合には、SpO2データに対して移動平均時間を「3秒」として移動平均を求め、労作情報に対しては移動平均を行わず、解析レポートとして「歩行試験レポート」を作成することになる。
なお、図5に示す解析モード情報定義テーブル341では、解析モードの例として、通常モード、歩行試験モードの2種類を挙げているが、解析モードの数は、より多くてもよい。
For example, when the analysis mode is "normal mode," the moving average is calculated for the SpO2 data with a moving average time of "12 seconds," and the moving average is calculated for the exertion information with a moving average time of "60 seconds," and the following analysis reports are created: "Analysis Summary Report,"" SpO2 Analysis Report,""Pulse Rate Analysis Report," and "Trend Graph (24-hour display) Report."
When the analysis mode is the "walking test mode", the moving average is calculated for the SpO2 data with a moving average time of "3 seconds", no moving average is calculated for the exertion information, and a "walking test report" is created as the analysis report.
In the analysis mode information definition table 341 shown in FIG. 5, two types of analysis modes, the normal mode and the walking test mode, are given as examples of the analysis modes, but the number of analysis modes may be greater.
また、記憶部34には、読み込み済みファイル情報342が記憶されている。読み込み済みファイル情報342は、拡張子が「.txt」のテキストファイルであり、情報処理装置30の記憶部34に既に読み込まれている測定データのデータ名が記録されている。
The
通信部35は、USBケーブルを介して複数のパルスオキシメーター10との間でデータの送受信を行うためのインターフェースである。また、通信部35は、ネットワークインターフェースを有し、通信ネットワークを介して接続された外部機器との間でデータの送受信を行う。
The
制御部31は、パルスオキシメーター10のメモリー部18から測定データを読み込み、当該測定データに解析モード情報を付加して記憶部34に保存させる。測定データに解析モード情報を付加する方法としては、測定データと解析モード情報との対応関係を後で利用可能なように、測定データ及び解析モード情報を記憶部34に記憶させればよい。
The
測定データを読み込む際に、ユーザーは、操作部32からの操作により、当該測定データに対する解析モード情報を選択する。すなわち、操作部32は、モード選択部として機能する。
制御部31は、選択された解析モード情報を測定データに付加する。
When reading measurement data, the user selects analysis mode information for the measurement data by operating the
The
制御部31は、測定データに付加された解析モード情報に基づいて、当該測定データについて波形表示及び/又は解析を行う。例えば、制御部31は、解析モード情報が示す解析モードに対応する移動平均時間を用いて、測定データ(労作情報を含む。)に移動平均をかけ、移動平均後のデータを用いて波形表示や解析を行う。また、制御部31は、解析モード情報が示す解析モードに対応する作成レポートに従って、解析レポートを作成する。
The
ユーザーは、操作部32からの操作により、解析モード情報ごとに、波形表示及び/又は解析の条件を変更する。すなわち、操作部32は、条件変更部として機能する。
The user changes the conditions for waveform display and/or analysis for each analysis mode information by operating the
(生体情報解析システムの動作)
次に、生体情報解析システム100の動作について説明する。
パルスオキシメーター10において、電源ボタン12a(電源ON)が押下される等、操作部12から測定開始の指示があった場合には、制御部11により、生体情報測定部14における生体情報の測定が開始される。生体情報の測定データは、測定値(SpO2、脈拍数)と、当該測定値が得られた日時(計時部16から取得)とが対応付けられた時系列データである。また、測定データには、加速度検知部15により生成された労作情報も含まれる。労作情報は、加速度(患者の動き)の大きさを示す値と、当該値が得られた日時とが対応付けられた時系列データである。
(Operation of Biometric Information Analysis System)
Next, the operation of the biological
In the
その後、電源ボタン12a(電源OFF)が押下される等、操作部12から測定終了の指示があった場合には、制御部11により、生体情報測定部14における生体情報の測定が終了され、測定データ(SpO2、脈拍数、労作情報)がメモリー部18に記憶される。具体的には、制御部11により、測定開始から測定終了までの測定データが1ファイルとして生成され、記憶部17に記憶されている機器番号及び検査IDに加え、測定開始日時、測定終了日時、測定時間、データ名等が測定データのヘッダーに書き込まれ、測定データのファイルがメモリー部18に保存される。
Thereafter, when an instruction to end the measurement is given from the
1台のパルスオキシメーター10において、電源ON/OFFが複数回行われることにより、複数のファイルが生成されることもある。
In a
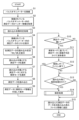
図6は、情報処理装置30において実行される測定データ読み込み処理を示すフローチャートである。この処理は、制御部31と記憶部34に記憶されているプログラムとの協働により実行される。測定データ読み込み処理は、情報処理装置30の表示部33に読み込み画面が表示された状態で実行される。
Figure 6 is a flowchart showing the measurement data reading process executed in the
情報処理装置30に一又は複数のパルスオキシメーター10が接続されると(ステップS1)、制御部31により、通信部35を介して、情報処理装置30に接続されている各パルスオキシメーター10のメモリー部18に記憶されている測定データのヘッダー情報が取得される(ステップS2)。測定データのヘッダー情報には、機器番号、検査ID、測定開始日時、測定終了日時、測定時間、データ名等が含まれる。
When one or
次に、制御部31により、読み込み有無判定処理が行われる(ステップS3)。読み込み有無判定処理は、パルスオキシメーター10内の各測定データが情報処理装置30に読み込み済みであるか否かを判定する処理である。
Next, the
ここで、図7を参照して、読み込み有無判定処理について説明する。
まず、制御部31により、情報処理装置30に接続されている各パルスオキシメーター10のメモリー部18に記憶されている測定データのうち、判定対象とする一つの測定データが決定される(ステップS21)。
Now, the read presence/absence determination process will be described with reference to FIG.
First, the
次に、制御部31により、判定対象の測定データのデータ名が、記憶部34に記憶されている読み込み済みファイル情報342に含まれているか否かが判定される(ステップS22)。
Next, the
判定対象の測定データのデータ名が読み込み済みファイル情報342に含まれている場合には(ステップS22;YES)、制御部31により、判定対象の測定データは読み込み済みである(済)と判定される(ステップS23)。
If the data name of the measurement data to be judged is included in the loaded file information 342 (step S22; YES), the
ステップS22において、判定対象の測定データのデータ名が読み込み済みファイル情報342に含まれていない場合には(ステップS22;NO)、制御部31により、判定対象の測定データは読み込まれていない(未)と判定される(ステップS24)。
In step S22, if the data name of the measurement data to be judged is not included in the loaded file information 342 (step S22; NO), the
ステップS23又はステップS24の後、制御部31により、情報処理装置30に接続されている各パルスオキシメーター10内の全ての測定データについて判定が終了したか否かが判断される(ステップS25)。
After step S23 or step S24, the
判定が終了していない測定データがある場合には(ステップS25;NO)、ステップS21に戻り、別の測定データを判定対象として、処理が繰り返される。 If there is measurement data for which judgment has not been completed (step S25; NO), the process returns to step S21 and the process is repeated using other measurement data as the judgment target.
ステップS25において、全ての測定データについて判定が終了した場合には(ステップS25;YES)、読み込み有無判定処理が終了する。 In step S25, if the judgment has been completed for all the measurement data (step S25; YES), the reading/non-reading judgment process ends.
次に、図6に戻り、制御部31により、情報処理装置30に接続されている各パルスオキシメーター10のメモリー部18に記憶されている測定データのリストが表示部33に表示される(ステップS4)。
また、制御部31により、ステップS3の読み込み有無判定処理の結果に基づいて、リスト上の各測定データの読み込み状況について、「未」又は「済」が表示される(ステップS5)。
Returning to FIG. 6, the
Furthermore, the
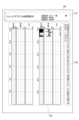
図8に、表示部33に表示される読み込み画面331の例を示す。読み込み画面331には、測定データリスト表示領域51、非表示選択領域52、測定データ保存場所指定領域53、対応関係指定領域54、紐付けボタン55、測定データ表示選択領域56、読み込み時解析選択領域57、レポート表示選択領域58、実行ボタン59、キャンセルボタン60等が含まれる。
Figure 8 shows an example of a
測定データリスト表示領域51には、各パルスオキシメーター10のメモリー部18に記憶されている測定データの情報が表示される。測定データリスト表示領域51には、読み込みデータ選択欄61、機器番号欄62、検査ID欄63、測定開始日時欄64、測定時間欄65、解析モード選択欄66、読み込み状況欄67、データ名欄68等が設けられている。
The measurement data
読み込みデータ選択欄61には、情報処理装置30に読み込みたい測定データを選択するためのチェックボックスが設けられている。ユーザーは、読み込みたい測定データに対応するチェックボックスにチェックを入れる。
機器番号欄62には、測定データを生成したパルスオキシメーター10の機器番号が表示される。
検査ID欄63には、測定データに係る検査IDが表示される。
測定開始日時欄64には、測定データの測定開始日時が表示される。
測定時間欄65には、測定データの測定時間が表示される。
The read
The
The
The measurement start date and
The
解析モード選択欄66は、複数の解析モードの中から、読み込み対象とする測定データに対する解析モードを選択するための領域である。解析モード選択欄66に、デフォルトとして、どのモードが表示されるかは、予め設定されていてもよい。例えば、呼吸器内科の場合には、解析モード選択欄66に「通常モード」がデフォルトとして表示され、リハビリテーション施設の場合には、解析モード選択欄66に「歩行試験モード」がデフォルトとして表示されるように設定しておく。
The analysis
読み込み状況欄67には、該当する測定データが情報処理装置30に読み込み済みであるか否かが表示される。測定データが読み込み済みである場合には「済」、測定データが読み込まれていない場合には「未」が表示される。ユーザーは、各測定データの読み込み状況欄67を確認することで、どの測定データを読み込めばよいかを瞬時に把握することができる。
データ名欄68には、測定データのデータ名が表示される。
The read
The
非表示選択領域52には、測定データリスト表示領域51において、短時間ファイルを非表示とするか否かを選択するためのチェックボックスが設けられている。非表示選択領域52にチェックが入れられた場合には、測定時間が予め定められた閾値以下の測定データについては、測定データリスト表示領域51のリストに表示されない。短時間ファイルは、パルスオキシメーター10の電源ボタン12aを誤ってON/OFFすることで作成されたと考えられるためである。
The hidden
測定データ保存場所指定領域53は、測定データの保存場所を指定するための領域である。
対応関係指定領域54は、検査IDと患者情報との対応関係を示す情報(CSVファイル等)を指定するための領域である。患者情報には、患者名、患者ID、生年月日、性別、身長、体重等が含まれる。
紐付けボタン55は、対応関係指定領域54において指定された対応関係に基づいて、測定データに患者情報を紐付ける(対応付ける)ことを指示するためのボタンである。
The measurement data storage
The
The
測定データ表示選択領域56には、測定データを読み込む際に測定データを表示するか否かを選択するためのチェックボックスが設けられている。測定データ表示選択領域56にチェックが入れられた場合には、測定データの読み込みに続いて、測定データの波形が表示部33に表示される。
読み込み時解析選択領域57には、測定データを読み込む際に解析処理(解析レポートの作成・保存)を行うか否かを選択するためのチェックボックスが設けられている。読み込み時解析選択領域57にチェックが入れられた場合には、測定データの読み込みに続いて、測定データに解析処理が行われる。
レポート表示選択領域58には、測定データの読み込み時の解析処理で作成された解析レポートを表示するか否かを選択するためのチェックボックスが設けられている。レポート表示選択領域58にチェックが入れられた場合には、解析処理に続いて、解析レポートが表示部33に表示される。
A check box for selecting whether or not to display the measurement data when the measurement data is read is provided in the measurement data
The read-in
A check box for selecting whether or not to display the analysis report created in the analysis process when the measurement data is read is provided in the report
実行ボタン59は、測定データの読み込みを指示するためのボタンである。
キャンセルボタン60は、測定データの読み込みをキャンセルするためのボタンである。
The execute
The cancel
次に、表示部33に表示されている測定データのリストにおいて、操作部32から読み込み対象とする測定データが選択される(ステップS6)。具体的には、読み込み画面331の測定データリスト表示領域51において、読み込み対象とする測定データの読み込みデータ選択欄61にチェックが入れられる。読み込み対象とする測定データは、複数選択可能となっている。
Next, in the list of measurement data displayed on the
次に、操作部32から読み込み対象とする測定データに対する解析モードが選択される(ステップS7)。具体的には、読み込み画面331の測定データリスト表示領域51において、読み込み対象とする測定データの解析モード選択欄66で解析モードが選択される。
Next, an analysis mode for the measurement data to be read is selected from the operation unit 32 (step S7). Specifically, in the measurement data
次に、操作部32からの操作により、測定データの読み込み指示(実行ボタン59の押下)が行われると、制御部31により、通信部35を介して、各パルスオキシメーター10のメモリー部18から、ステップS6で選択された測定データが読み込まれる(ステップS8)。
Next, when an instruction to read the measurement data is given by operating the operation unit 32 (pressing the execute button 59), the
そして、制御部31により、読み込まれた測定データごとに、当該測定データに対して選択された解析モードを示す解析モード情報が付加され、記憶部34に保存される(ステップS9)。例えば、制御部31により、測定データと解析モード情報とが同一のフォルダーに格納されることで、相互に対応付けられる。さらに、制御部31により、測定データのヘッダー情報から取得された検査IDに基づいて、読み込み画面331の対応関係指定領域54で指定された対応関係から患者情報が特定され、この患者情報についても、測定データ及び解析モード情報と同一のフォルダーに格納される。
Then, the
次に、制御部31により、読み込み画面331で測定データを開くことが選択されていたか否かが判断される(ステップS10)。具体的には、制御部31により、測定データ表示選択領域56にチェックが入れられたか否かが判断される。
Next, the
測定データを開くことが選択されていた場合には(ステップS10;YES)、制御部31により、測定データに付加されている解析モード情報が示す解析モードに基づいて、測定データに移動平均がかけられ、表示部33に波形が表示される(ステップS11)。具体的には、制御部31により、解析モード情報定義テーブル341(図5参照)が参照され、解析モードに対応する移動平均時間が指定されている場合には、この移動平均時間を用いて測定データに移動平均処理が行われ、移動平均後のデータを用いて波形が表示される。一方、解析モードに対応する移動平均時間が指定されていない場合には、移動平均処理は行われずに、測定データを用いた波形表示が行われる。
なお、読み込み対象として複数の測定データが選択されていた場合には、測定データごとに、波形(グラフ)が表示される。
If it has been selected to open the measurement data (step S10; YES), the
When multiple measurement data are selected to be read, a waveform (graph) is displayed for each measurement data.
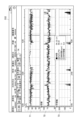
図9に、表示部33に表示される測定データ波形表示画面332の例を示す。測定データ波形表示画面332には、SpO2表示領域71、脈拍数表示領域72、労作情報表示領域73、解析レポートアイコン74等が含まれる。
9 shows an example of a measurement data
SpO2表示領域71には、横軸に時間をとったSpO2(%)のグラフが表示される。
脈拍数表示領域72には、横軸に時間をとった脈拍数(bpm)のグラフが表示される。
労作情報表示領域73には、横軸に時間をとった労作情報のグラフが表示される。労作情報の縦軸は、3軸加速度の大きさを示す無次元の値である。
解析レポートアイコン74は、測定データ波形表示画面332に表示されている測定データについて、解析処理(解析レポートの作成)の実行を指示するためのアイコンである。
The SpO2
The pulse
A graph of the exertion information with time on the horizontal axis is displayed in the exertion
The
次に、制御部31により、測定データ波形表示画面332において、解析レポートアイコン74が押下されたか否かが判断される(ステップS12)。
Next, the
ステップS10において、測定データを開くことが選択されていなかった場合(ステップS10;NO)、又は、ステップS12において、解析レポートアイコン74が押下されない場合には(ステップS12;NO)、制御部31により、読み込み画面331(図8参照)で読み込み時に解析処理を行うことが選択されていたか否かが判断される(ステップS13)。具体的には、制御部31により、読み込み時解析選択領域57にチェックが入れられたか否かが判断される。
If opening the measurement data has not been selected in step S10 (step S10; NO), or if the
ステップS13において、読み込み時に解析処理を行うことが選択されていた場合(ステップS13;YES)、又は、ステップS12において、解析レポートアイコン74が押下された場合には(ステップS12;YES)、制御部31により、解析処理が行われる(ステップS14)。
If it is selected in step S13 to perform analysis processing at the time of reading (step S13; YES), or if the
なお、読み込み時に解析処理を行うことが選択されていた場合には(ステップS13;YES)、読み込み画面331(図8参照)の測定データリスト表示領域51の読み込みデータ選択欄61において選択された測定データごとに、解析処理が行われる。
或る測定データに係る測定データ波形表示画面332(図9参照)において、解析レポートアイコン74が押下された場合には(ステップS12;YES)、当該測定データについて、解析処理が行われる。
In addition, if it has been selected to perform analysis processing during loading (step S13; YES), analysis processing is performed for each measurement data selected in the load
When the
ここで、図10を参照して、解析処理について説明する。
制御部31により、測定データに付加された解析モード情報が取得される(ステップS31)。具体的には、制御部31により、解析対象とする測定データに対応付けられている解析モード情報(測定データと同一のフォルダー内に格納されている解析モード情報)が記憶部34から取得される。
The analysis process will now be described with reference to FIG.
The
次に、制御部31により、解析モード情報が示す解析モードに基づいて、測定データに統計計算が行われる(ステップS32)。具体的には、制御部31により、解析モード情報定義テーブル341(図5参照)が参照され、解析モードに対応する作成レポートが取得され、作成すべき解析レポートに必要な各種統計値(平均値、中央値、最頻値、標準偏差等)が計算される。
Next, the
次に、制御部31により、解析モード情報が示す解析モードに基づいて、測定データに移動平均がかけられ、波形及び統計結果を含む解析レポートが作成される(ステップS33)。具体的には、制御部31により、解析モード情報定義テーブル341(図5参照)が参照され、解析モードに対応する移動平均時間が指定されている場合には、この移動平均時間を用いて測定データに移動平均処理が行われ、移動平均後のデータを用いて波形(グラフ)が生成される。一方、解析モードに対応する移動平均時間が指定されていない場合には、移動平均処理は行われずに、測定データを用いて波形(グラフ)が生成される。また、ここで作成される解析レポートは、解析モード情報定義テーブル341において、解析モードに対応付けられている作成レポート(解析レポートの種類)により特定される。
Next, the
次に、制御部31により、作成された解析レポートが記憶部34に保存される(ステップS34)。例えば、制御部31により、作成された解析レポートが、測定データ、解析モード情報及び患者情報と同一のフォルダーに格納されることで、測定データと対応付けられて保存される。
Next, the
次に、制御部31により、作成された解析レポートが表示部33に表示され(ステップS35)、解析処理が終了する。
Next, the
なお、測定データ読み込み処理(図6参照)のステップS14として、解析処理が行われる場合、読み込み画面331(図8参照)のレポート表示選択領域58で解析レポートを表示することが選択されていないときには、ステップS35の処理が省略される。
When analysis processing is performed as step S14 of the measurement data reading processing (see FIG. 6), if displaying the analysis report is not selected in the report
図6に戻り、解析処理(ステップS14)の後、又は、ステップS13において、読み込み時に解析処理を行うことが選択されていなかった場合には(ステップS13;NO)、制御部31により、読み込まれた測定データのデータ名が、記憶部34の読み込み済みファイル情報342に追記される(ステップS15)。
以上で、測定データ読み込み処理が終了する。
Returning to Figure 6, after the analysis process (step S14), or if in step S13, it was not selected to perform the analysis process at the time of reading (step S13; NO), the
This completes the measurement data reading process.
ここで、図11~図16を参照して、測定データの解析により作成される解析レポートについて説明する。なお、各解析レポートに含まれる内容やレイアウトは一例である。
(1)解析概要レポート
図11に、解析概要レポートR1の例を示す。
解析概要レポートR1には、ヘッダー部領域101、測定情報領域102、患者情報領域103、SpO2解析領域104、脈拍数解析領域105、コメント領域106、グラフ領域107が含まれる。
Here, analysis reports created by analyzing the measurement data will be described with reference to Figures 11 to 16. Note that the contents and layouts included in each analysis report are merely examples.
(1) Analysis Summary Report FIG. 11 shows an example of the analysis summary report R1.
The analysis summary report R1 includes a
ヘッダー部領域101には、レポートのタイトル、患者名、患者ID、検査ID等が含まれる。
測定情報領域102には、測定開始日時、測定終了日時、測定時間等が含まれる。
患者情報領域103には、測定時年齢、生年月日、性別、身長、体重等の患者情報が含まれる。
領域101~103に記載される患者名、患者ID、年齢、生年月日、性別、身長、体重等は、レポート対象の測定データと対応付けられている患者情報から取得される。また、領域101~103に記載される検査ID、測定開始日時、測定終了日時、測定時間等は、レポート対象の測定データのヘッダー情報から取得される。
The
The
The
The patient name, patient ID, age, date of birth, sex, height, weight, etc., written in
SpO2解析領域104には、SpO2の解析結果が含まれる。SpO2の解析結果には、SpO2の平均値、SpO2の値が所定の条件を満たした合計時間及び解析時間に対する割合(%)、睡眠時無呼吸指数等が含まれる。睡眠時無呼吸指数には、ODI(1時間あたりのDip数)、Dip最低値(全Dipの中でのSpO2の最低値)が含まれる。なお、睡眠時無呼吸指数については、睡眠時以外のデータも含まれる場合には無効である。
The SpO2
脈拍数解析領域105には、脈拍数の解析結果が含まれる。脈拍数の解析結果には、脈拍数の平均値、脈拍数の標準偏差、睡眠障害指数である1時間あたりの脈拍数上昇回数等が含まれる。なお、睡眠障害指数については、睡眠時以外のデータも含まれる場合には無効である。
コメント領域106には、コメントが記載される。
グラフ領域107には、移動平均後のSpO2のグラフ、脈拍数のグラフ(移動平均なし)、移動平均後の労作情報のグラフが描画される。
The pulse
Comments are written in the
In the
(2)SpO2解析レポート
図12に、SpO2解析レポートR2の例を示す。
SpO2解析レポートR2には、ヘッダー部領域111、測定情報領域112、SpO2分布グラフ領域113、SpO2累積比率グラフ領域114、SpO2解析領域115が含まれる。
(2) SpO2 Analysis Report FIG. 12 shows an example of SpO2 analysis report R2.
The SpO 2
ヘッダー部領域111には、レポートのタイトル、患者名、患者ID、検査ID等が含まれる。
測定情報領域112には、測定開始日時、測定終了日時、測定時間等が含まれる。
The
The
SpO2分布グラフ領域113には、SpO2の値ごとの、その値のSpO2が発生した合計時間(発生頻度)を示すグラフが描画される。
SpO2累積比率グラフ領域114には、SpO2の値ごとの、その値以下のSpO2が発生した累積時間の全時間に対する割合を示すグラフが描画される。
In the SpO2
In the SpO2 cumulative
SpO2解析領域115には、SpO2の解析結果が含まれる。SpO2解析領域115は、第1領域115A、第2領域115Bに分けられる。
第1領域115Aにおける解析結果は、移動平均されたSpO2より計算された結果である。第1領域115Aには、SpO2解析時間、平均値、中央値、5%番目の値(SpO2を小さい順に並べた時の5%番目の値)、95%番目の値(SpO2を小さい順に並べた時の95%番目の値)、SpO2の値が所定の条件を満たした合計時間及び解析時間に対する割合(%)が、総計/労作時/安静時のそれぞれについて記載される。
第2領域115Bにおける解析結果は、移動平均されていないSpO2より計算された結果である。第2領域115Bには、睡眠時無呼吸指数として、睡眠時無呼吸指数解析時間、Dip最低値、Dip数(SpO2の低下回数)、ODI、Dip最低値平均(各Dipの最低値を平均した値)が含まれる。なお、睡眠時無呼吸指数については、睡眠時以外のデータも含まれる場合には無効である。
The analysis results of SpO2 are included in the SpO2
The analysis results in the
The analysis results in the
(3)脈拍数解析レポート
図13に、脈拍数解析レポートR3の例を示す。
脈拍数解析レポートR3には、ヘッダー部領域121、測定情報領域122、脈拍数分布グラフ領域123、脈拍数累積比率グラフ領域124、脈拍数解析領域125、脈拍数上昇領域126が含まれる。
(3) Pulse Rate Analysis Report FIG. 13 shows an example of the pulse rate analysis report R3.
The pulse rate analysis report R3 includes a
ヘッダー部領域121には、レポートのタイトル、患者名、患者ID、検査ID等が含まれる。
測定情報領域122には、測定開始日時、測定終了日時、測定時間等が含まれる。
The
The
脈拍数分布グラフ領域123には、脈拍数の値ごとの、その値の脈拍数が発生した合計時間(発生頻度)を示すグラフが描画される。
脈拍数累積比率グラフ領域124には、脈拍数の値ごとの、その値以下の脈拍数が発生した累積時間の全時間に対する割合を示すグラフが描画される。
In the pulse rate
In the pulse rate cumulative
脈拍数解析領域125には、脈拍数の解析結果が含まれる。脈拍数の解析結果には、脈拍数解析時間、平均値、中央値、最頻値、標準偏差等が含まれる。
脈拍数上昇領域126には、上昇解析時間、ピークの最大値(全脈拍数上昇箇所の中での脈拍数最大値及び発生時刻)、脈拍数上昇回数、1時間あたりの脈拍数上昇回数等が含まれる。
The pulse
The pulse
(4)歩行試験レポート
図14に、歩行試験レポートR4の例を示す。
歩行試験レポートR4には、ヘッダー部領域131、測定情報領域132、患者情報領域133、歩行前情報領域134、歩行後情報領域135、歩行試験概要領域136、コメント領域137、グラフ領域138が含まれる。
(4) Walking Test Report FIG. 14 shows an example of a walking test report R4.
The walking test report R4 includes a
ヘッダー部領域131には、レポートのタイトル、患者名、患者ID、BMI等が含まれる。
測定情報領域132には、測定開始日時、測定終了日時、測定時間等が含まれる。
患者情報領域133には、測定時年齢、生年月日、性別、身長、体重等の患者情報が含まれる。
The
The
The
歩行前情報領域134には、歩行開始時の時間、SpO2、脈拍数、息切れ、疲労感が含まれる。
歩行後情報領域135には、歩行終了時の時間、SpO2、脈拍数、息切れ、疲労感が含まれる。
歩行試験概要領域136には、SpO2最低値、脈拍数最大値、酸素吸入量、総歩行距離等が含まれる。なお、SpO2最低値と脈拍数最大値を計算する際、最初の1分間のデータは解析から除外される。
コメント領域137には、コメントが記載される。
グラフ領域138には、移動平均後のSpO2のグラフ、脈拍数のグラフ(移動平均なし)、労作情報のグラフ(移動平均なし)が描画される。
The
The ambulatory
Comments are written in the
In the
(5)トレンドグラフ(24時間表示)レポート
図15に、トレンドグラフ(24時間表示)レポートR5の例を示す。
トレンドグラフ(24時間表示)レポートR5には、ヘッダー部領域141、測定解析情報領域142、トレンドグラフ領域143が含まれる。
(5) Trend Graph (24-hour display) Report FIG. 15 shows an example of a trend graph (24-hour display) report R5.
The trend graph (24-hour display) report R5 includes a
ヘッダー部領域141には、レポートのタイトル、患者名、患者ID、検査ID等が含まれる。
測定解析情報領域142には、測定開始日時、測定終了日時、測定時間、SpO2移動平均時間、生年月日等が含まれる。
トレンドグラフ領域143には、移動平均後のSpO2のグラフ、脈拍数のグラフ(移動平均なし)、移動平均後の労作情報のグラフが描画される。ここでは、1ページあたり24時間のデータが含まれる。
The
The measurement
A graph of SpO2 after moving average, a graph of pulse rate (without moving average), and a graph of exertion information after moving average are drawn in
(6)トレンドグラフ(横軸60分表示)レポート
図16に、トレンドグラフ(横軸60分表示)レポートR6の例を示す。
トレンドグラフ(横軸60分表示)レポートR6には、ヘッダー部領域151、測定解析情報領域152、トレンドグラフ領域153が含まれる。
(6) Trend Graph (
The trend graph (horizontal axis showing 60 minutes) report R6 includes a
ヘッダー部領域151には、レポートのタイトル、患者名、患者ID、検査ID等が含まれる。
測定解析情報領域152には、測定開始日時、測定終了日時、測定時間、SpO2移動平均時間等が含まれる。
トレンドグラフ領域153には、移動平均後のSpO2のグラフ、脈拍数のグラフ(移動平均なし)、移動平均後の労作情報のグラフが描画される。ここでは、1行あたり60分のデータが含まれる。1行の上段には、SpO2のグラフと脈拍数のグラフが描画され、下段には、労作情報のグラフが描画されている。
The
The measurement
In the
図17は、情報処理装置30において実行されるローカルデータ解析処理を示すフローチャートである。この処理は、制御部31と記憶部34に記憶されているプログラムとの協働により実行される。ローカルデータ解析処理は、情報処理装置30の記憶部34に保存されている測定データを解析する処理である。
Figure 17 is a flowchart showing the local data analysis process executed in the
まず、制御部31により、情報処理装置30の記憶部34に保存されている測定データのリストが表示部33に表示される(ステップS41)。
次に、表示部33に表示されている測定データのリストにおいて、操作部32からの操作により、解析対象とする測定データが選択される(ステップS42)。
First, the
Next, in the list of measurement data displayed on the
次に、制御部31により、選択された測定データに付加されている解析モード情報が示す解析モードに基づいて、測定データに移動平均がかけられ、表示部33に波形が表示される(ステップS43)。具体的には、図9に示す測定データ波形表示画面332のような波形が表示される。ステップS43の処理の詳細は、測定データ読み込み処理(図6参照)のステップS11の処理と同様である。
Next, the
次に、制御部31により、測定データ波形表示画面332において、解析レポートアイコン74が押下されたか否かが判断される(ステップS44)。
Next, the
解析レポートアイコン74が押下された場合には(ステップS44;YES)、制御部31により、解析処理が行われる(ステップS45)。解析処理については、既に図10を参照して説明したので、詳細な説明を省略する。
When the
ステップS45の後、又は、ステップS44において、解析レポートアイコン74が押下されない場合には(ステップS44;NO)、ローカルデータ解析処理が終了する。
After step S45, or if the
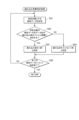
図18は、情報処理装置30において実行される測定データ削除処理を示すフローチャートである。この処理は、制御部31と記憶部34に記憶されているプログラムとの協働により実行される。測定データ削除処理は、情報処理装置30の表示部33に機器設定画面が表示された状態で実行される。
Figure 18 is a flowchart showing the measurement data deletion process executed in the
ステップS51~ステップS53の処理は、測定データ読み込み処理(図6参照)のステップS1~ステップS3の処理と同様であるため、説明を省略する。 The processing from step S51 to step S53 is similar to the processing from step S1 to step S3 of the measurement data reading process (see FIG. 6), so a description thereof will be omitted.
次に、制御部31により、情報処理装置30に接続されているパルスオキシメーター10のリストが表示部33に表示される(ステップS54)。
また、制御部31により、ステップS53の読み込み有無判定処理の結果に基づいて、リスト上の各パルスオキシメーター10の読み込み状況について、「未」又は「済」が表示される(ステップS55)。或るパルスオキシメーター10のメモリー部18に記憶されている全ての測定データが読み込み済みである場合には、このパルスオキシメーター10に対応する読み込み状況は「済」と表示される。或るパルスオキシメーター10のメモリー部18に記憶されている測定データの中で読み込まれていない測定データがある場合には、このパルスオキシメーター10に対応する読み込み状況は「未」と表示される。
Next, the
Based on the result of the read/no read process in step S53, the
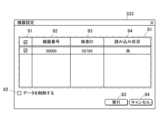
図19に、表示部33に表示される機器設定画面333の例を示す。機器設定画面333には、機器リスト表示領域81、データ削除選択領域82、実行ボタン83、キャンセルボタン84等が含まれる。
機器リスト表示領域81には、情報処理装置30に接続されているパルスオキシメーター10の情報が表示される。機器リスト表示領域81には、対象機器選択欄91、機器番号欄92、検査ID欄93、読み込み状況欄94等が設けられている。
対象機器選択欄91には、処理対象とするパルスオキシメーター10(機器)を選択するためのチェックボックスが設けられている。ユーザーは、測定データを削除したいパルスオキシメーター10に対応するチェックボックスにチェックを入れる。
機器番号欄92には、パルスオキシメーター10の機器番号が表示される。
検査ID欄93には、パルスオキシメーター10に設定されている検査IDが表示される。
19 shows an example of a
The device
The target
The
The
読み込み状況欄94には、パルスオキシメーター10内の測定データが情報処理装置30に読み込み済みであるか否かが表示される。パルスオキシメーター10内の全ての測定データが読み込み済みである場合には「済」、読み込まれていない測定データがある場合には「未」が表示される。
The
なお、パルスオキシメーター10の測定時に誤って電源ボタン12aをON/OFFする等、測定ミスにより生成された測定データは、基本的には短時間ファイルであり、読み込む必要がない。そのため、測定時間が予め定められた閾値以下の測定データ(短時間ファイル)については、読み込み状況の判断の対象外とすることとしてもよい。つまり、或るパルスオキシメーター10のメモリー部18に記憶されている測定データのうち、読み込まれていない測定データがあったとしても、それが短時間ファイルである場合には、読み込み状況を「済」としてもよい。
Measurement data generated due to a measurement error, such as accidentally turning the
データ削除選択領域82には、機器リスト表示領域81において選択されたパルスオキシメーター10内の測定データを削除することを選択するためのチェックボックスが設けられている。
実行ボタン83は、選択されたパルスオキシメーター10内の測定データの削除を指示するためのボタンである。
キャンセルボタン84は、選択されたパルスオキシメーター10内の測定データの削除をキャンセルするためのボタンである。
The data
The execute
The cancel
次に、表示部33に表示されているパルスオキシメーター10のリストにおいて、操作部32からの操作により、測定データを削除するパルスオキシメーター10が選択される(ステップS56)。具体的には、機器設定画面333の機器リスト表示領域81において、測定データを削除するパルスオキシメーター10の対象機器選択欄91にチェックが入れられる。
Next, in the list of
次に、操作部32からの操作により、測定データの削除指示が行われると、制御部31により、通信部35を介して、選択されたパルスオキシメーター10のメモリー部18に記憶されている測定データが削除される(ステップS57)。具体的には、機器設定画面333のデータ削除選択領域82にチェックが入れられ、実行ボタン83が押下されると、表示部33に確認画面が表示される。そして、確認画面に設けられたOKボタンが押下されると、選択されたパルスオキシメーター10内の測定データが削除される。
以上で、測定データ削除処理が終了する。
Next, when an instruction to delete the measurement data is given by operating the
This completes the measurement data deletion process.
データの削除は、慎重に行うべき作業である。本実施の形態では、機器設定画面333において、読み込まれていないデータの有無を確認できるため、パルスオキシメーター10内のデータを安心して削除することができる。
Deleting data is a task that should be performed with care. In this embodiment, the presence or absence of unloaded data can be checked on the
測定データ削除処理は、パルスオキシメーター10を患者に貸し出す前の準備として行われてもよいし、測定データ読み込み処理(図6参照)に続けて行われてもよい。後者の場合、機器設定画面333への遷移指示があった場合に、測定データ削除処理のステップS52以降の処理が行われる。
The measurement data deletion process may be performed as a preparation before lending the
次に、ユーザーが解析モード情報定義テーブル341(図5参照)の内容(移動平均時間、作成レポート)をカスタマイズする処理について説明する。
図20に、情報処理装置30の表示部33に表示される解析情報設定画面334の例を示す。解析情報設定画面334には、解析モード選択領域201、作成レポート選択領域202、移動平均時間選択領域203、保存ボタン204、キャンセルボタン205等が含まれる。
Next, a process in which the user customizes the contents (moving average time, report to be created) of the analysis mode information definition table 341 (see FIG. 5) will be described.
20 shows an example of an analysis
解析モード選択領域201は、設定対象とする解析モードを選択するための領域である。
作成レポート選択領域202は、作成される解析レポートの種類を選択するための領域である。作成レポート選択領域202では、解析レポートの種類を複数選択可能である。
移動平均時間選択領域203は、SpO2データに対する移動平均時間を選択するための領域である。
保存ボタン204は、解析情報設定画面334における設定内容の保存を指示するためのボタンである。
キャンセルボタン205は、解析情報設定画面334における設定変更をキャンセルするためのボタンである。
The analysis
The report selection area 202 is an area for selecting the type of analysis report to be created. In the report selection area 202, multiple types of analysis reports can be selected.
The moving average
The
The cancel
ユーザーの操作部32からの操作により、解析情報設定画面334の解析モード選択領域201において、設定対象とする解析モードが選択され、作成レポート選択領域202において、作成される解析レポートの種類が選択され、移動平均時間選択領域203において、SpO2データに対する移動平均時間が選択される。その後、保存ボタン204が押下されると、制御部31により、解析モード情報定義テーブル341の内容が書き換えられる。このようにして、解析モード情報ごとに、波形表示及び/又は解析の条件を変更することができる。
By operation of the user from the
なお、既存の解析モードに対する設定内容を変更するだけでなく、新たな解析モードを解析モード情報定義テーブル341に追加可能としてもよい。
また、解析情報設定画面334において、労作情報に対する移動平均時間を変更可能としてもよい。
In addition to changing the settings of the existing analysis modes, new analysis modes may be added to the analysis mode information definition table 341 .
Furthermore, the analysis
以上説明したように、本実施の形態によれば、情報処理装置30の制御部31は、パルスオキシメーター10のメモリー部18に記憶されていた測定データに解析モード情報を付加して記憶部34に保存させるので、パルスオキシメーター10(生体情報測定装置)により得られた測定データに対して、当該測定データに適した解析を行うことができる。
As described above, according to this embodiment, the
例えば、測定データに付加された解析モード情報に基づいて、当該測定データについて波形を表示することができる。
また、測定データに付加された解析モード情報に基づいて、解析モードに対応する解析レポートを作成するために、当該測定データについて、レポートの作成に必要な解析を行うことができる。
For example, it is possible to display a waveform for the measurement data based on analysis mode information added to the measurement data.
Furthermore, in order to create an analysis report corresponding to the analysis mode based on the analysis mode information added to the measurement data, the analysis required for creating the report can be performed on the measurement data.
また、解析モード情報定義テーブル341(図5参照)の内容を変更することで、解析モード情報ごとの波形表示及び解析の条件を変更することができる。例えば、SpO2移動平均時間を変更することで、SpO2データの波形の表示態様や、SpO2の解析条件を変更することができる。また、作成レポートを変更することで、作成される解析レポートや、解析レポートの作成に伴う統計計算の項目等を変更することができる。 In addition, by changing the contents of the analysis mode information definition table 341 (see FIG. 5), it is possible to change the conditions of waveform display and analysis for each analysis mode information. For example, by changing the SpO2 moving average time, it is possible to change the display mode of the waveform of SpO2 data and the analysis conditions of SpO2 . In addition, by changing the report to be created, it is possible to change the analysis report to be created and the items of statistical calculations associated with the creation of the analysis report.
また、測定データを読み込む際に、読み込み画面331(図8参照)において、読み込み対象とする測定データの解析モードを選択することができる。 When reading measurement data, the analysis mode of the measurement data to be read can be selected on the reading screen 331 (see FIG. 8).
なお、上記実施の形態における記述は、本発明に係る生体情報解析システム及び情報処理装置の例であり、これに限定されるものではない。システムを構成する各装置の細部構成及び細部動作に関しても本発明の趣旨を逸脱することのない範囲で適宜変更可能である。 The above description of the embodiment is an example of the bioinformation analysis system and information processing device according to the present invention, and is not limited to this. The detailed configuration and detailed operation of each device constituting the system can be modified as appropriate without departing from the spirit of the present invention.
例えば、上記実施の形態では、パルスオキシメーター10がSpO2及び脈拍数を含む生体情報や労作情報を測定する場合について説明したが、パルスオキシメーター10により測定される情報に、SpO2、脈拍数、労作情報のいずれかが含まれないこととしてもよい。
For example, in the above embodiment, a case has been described in which
また、解析モード情報に基づく測定データの波形表示、解析モード情報に基づく測定データの解析は、いずれか一方のみを行うこととしてもよい。
また、解析モード情報ごとの波形表示の条件、解析モード情報ごとの解析の条件について、いずれか一方のみを変更可能としてもよい。
Moreover, only one of displaying the waveform of the measurement data based on the analysis mode information and analyzing the measurement data based on the analysis mode information may be performed.
Also, only one of the waveform display conditions for each analysis mode information and the analysis conditions for each analysis mode information may be changeable.
また、上記実施の形態では、情報処理装置30の制御部31が測定データを読み込み、測定データを情報処理装置30内の記憶部34に保存する場合について説明したが、測定データに解析モード情報を付加して保存させる保存先は、クラウド上であってもよい。また、パルスオキシメーター10から測定データを取得する機能以外の情報処理装置30の処理(測定データに解析モード情報を付加して保存する処理、解析モード情報に基づいて測定データの波形表示及び/又は解析を行う処理等)を、クラウドサーバーが行うこととしてもよい。
In the above embodiment, the
また、上記実施の形態では、情報処理装置30において、パルスオキシメーター10から測定データを読み込む際に、解析モードを選択することとしたが、パルスオキシメーター10で生体情報を測定する際に、表示部13に表示される測定画面において解析モードを選択することで、メモリー部18に記憶される測定データに対する解析モードを設定することとしてもよい。この場合、パルスオキシメーター10の制御部11は、測定された生体情報の測定データに、解析モードを示す解析モード情報を付加してメモリー部18に記憶させる。そして、解析モード情報と測定データとが対応付けられてメモリー部18に記憶され、情報処理装置30がパルスオキシメーター10から測定データを読み込む際に、測定データと解析モード情報との対応関係を含めて取得することになる。
In the above embodiment, the
また、測定データにおける測定時間や労作情報を用いて、情報処理装置30又はパルスオキシメーター10のアプリケーションが、自動的に解析モードを判定するようにしてもよい。例えば、測定データの測定時間が6分間程度であり、労作情報から6分間程度の患者の動きが検知された場合に、歩行試験とみなすこととしてもよい。
The
また、或る測定データに対し、解析情報設定画面334(図20参照)と同様の設定画面において、作成レポートや移動平均時間を変更して解析を行う度に、作業履歴として解析結果(波形表示条件、解析条件、解析レポート等)を保存しておき、各作業履歴に対応する解析結果を参照可能としてもよい。 In addition, for certain measurement data, each time an analysis is performed by changing the report creation or moving average time on a setting screen similar to the analysis information setting screen 334 (see FIG. 20), the analysis results (waveform display conditions, analysis conditions, analysis report, etc.) can be saved as work history, and the analysis results corresponding to each work history can be referenced.
各処理を実行するためのプログラムを格納するコンピューター読み取り可能な媒体としては、上記の例に限定されず、CD-ROM等の可搬型記録媒体を適用することも可能である。また、プログラムのデータを通信回線を介して提供する媒体として、キャリアウェーブ(搬送波)を適用することとしてもよい。 The computer-readable medium for storing the programs for executing each process is not limited to the above examples, and a portable recording medium such as a CD-ROM can also be used. A carrier wave can also be used as a medium for providing program data via a communication line.
10 パルスオキシメーター
11 制御部
14 生体情報測定部
15 加速度検知部
18 メモリー部
19 通信部
30 情報処理装置
31 制御部
32 操作部
33 表示部
34 記憶部
35 通信部
100 生体情報解析システム
331 読み込み画面
332 測定データ波形表示画面
333 機器設定画面
334 解析情報設定画面
341 解析モード情報定義テーブル
R1 解析概要レポート
R2 SpO2解析レポート
R3 脈拍数解析レポート
R4 歩行試験レポート
R5 トレンドグラフ(24時間表示)レポート
R6 トレンドグラフ(横軸60分表示)レポート
10
Claims (6)
前記生体情報測定装置のメモリー部から測定データを読み込み、当該測定データに、後に当該測定データについて波形表示及び/又は解析を行う際の解析モードを示す解析モード情報を付加して記憶部に保存させる制御部を有する情報処理装置と、
を備える生体情報解析システム。 A biological information measuring device including a biological information measuring unit that measures the arterial blood oxygen saturation and/or pulse rate of a subject as biological information, and a memory unit that stores measurement data of the measured biological information;
an information processing device having a control unit that reads measurement data from a memory unit of the biological information measuring device, adds analysis mode information indicating an analysis mode for later performing waveform display and/or analysis on the measurement data to the measurement data, and stores the result in a storage unit;
A biological information analysis system comprising:
前記制御部は、前記選択された解析モード情報を前記測定データに付加する請求項1から3のいずれか一項に記載の生体情報解析システム。 the information processing device has a mode selection unit for selecting analysis mode information for the measurement data when the measurement data is read,
The biological information analyzing system according to claim 1 , wherein the control unit adds information about the selected analysis mode to the measurement data.
Priority Applications (1)
| Application Number | Priority Date | Filing Date | Title |
|---|---|---|---|
| JP2020176001A JP7600611B2 (en) | 2020-10-20 | 2020-10-20 | Biological information analysis system, information processing device, and biological information measuring device |
Applications Claiming Priority (1)
| Application Number | Priority Date | Filing Date | Title |
|---|---|---|---|
| JP2020176001A JP7600611B2 (en) | 2020-10-20 | 2020-10-20 | Biological information analysis system, information processing device, and biological information measuring device |
Publications (2)
| Publication Number | Publication Date |
|---|---|
| JP2022067338A JP2022067338A (en) | 2022-05-06 |
| JP7600611B2 true JP7600611B2 (en) | 2024-12-17 |
Family
ID=81390449
Family Applications (1)
| Application Number | Title | Priority Date | Filing Date |
|---|---|---|---|
| JP2020176001A Active JP7600611B2 (en) | 2020-10-20 | 2020-10-20 | Biological information analysis system, information processing device, and biological information measuring device |
Country Status (1)
| Country | Link |
|---|---|
| JP (1) | JP7600611B2 (en) |
Families Citing this family (2)
| Publication number | Priority date | Publication date | Assignee | Title |
|---|---|---|---|---|
| JP2024024884A (en) * | 2022-08-10 | 2024-02-26 | 日本光電工業株式会社 | Biological information processing device and biological information processing method |
| JP2024127075A (en) * | 2023-03-08 | 2024-09-20 | オムロンヘルスケア株式会社 | Measurement device, control method, and control program |
Citations (4)
| Publication number | Priority date | Publication date | Assignee | Title |
|---|---|---|---|---|
| JP2002291707A (en) | 2001-03-30 | 2002-10-08 | Teijin Ltd | Biological information analysis support method |
| WO2011052302A1 (en) | 2009-10-29 | 2011-05-05 | コニカミノルタセンシング株式会社 | Biological information measurement device |
| JP2018082986A (en) | 2016-11-25 | 2018-05-31 | 日本光電工業株式会社 | Detection device and watching system including detection device |
| JP2018171239A (en) | 2017-03-31 | 2018-11-08 | フクダ電子株式会社 | Electrocardiograph and control method therefor |
Family Cites Families (1)
| Publication number | Priority date | Publication date | Assignee | Title |
|---|---|---|---|---|
| JPH10234685A (en) * | 1997-02-28 | 1998-09-08 | Seiko Epson Corp | Measuring device |
-
2020
- 2020-10-20 JP JP2020176001A patent/JP7600611B2/en active Active
Patent Citations (4)
| Publication number | Priority date | Publication date | Assignee | Title |
|---|---|---|---|---|
| JP2002291707A (en) | 2001-03-30 | 2002-10-08 | Teijin Ltd | Biological information analysis support method |
| WO2011052302A1 (en) | 2009-10-29 | 2011-05-05 | コニカミノルタセンシング株式会社 | Biological information measurement device |
| JP2018082986A (en) | 2016-11-25 | 2018-05-31 | 日本光電工業株式会社 | Detection device and watching system including detection device |
| JP2018171239A (en) | 2017-03-31 | 2018-11-08 | フクダ電子株式会社 | Electrocardiograph and control method therefor |
Also Published As
| Publication number | Publication date |
|---|---|
| JP2022067338A (en) | 2022-05-06 |
Similar Documents
| Publication | Publication Date | Title |
|---|---|---|
| US8956292B2 (en) | Trending display of patient wellness | |
| JP7278220B2 (en) | Spot check measurement system | |
| JP5176850B2 (en) | Biological information display device, biological information display system, statistical processing method, and statistical processing program | |
| US20190362851A1 (en) | Computer-Aided Multiple Standard-Based Functional Evaluation and Medical Reporting System | |
| JP6851866B2 (en) | Information processing equipment and information processing programs | |
| CN110446460B (en) | Information processing apparatus and storage medium | |
| US10860174B2 (en) | Biological information displaying apparatus | |
| JP7600611B2 (en) | Biological information analysis system, information processing device, and biological information measuring device | |
| JP4933100B2 (en) | ECG analyzer | |
| JP4949685B2 (en) | Electrocardiograph | |
| JP2016192157A (en) | Biological information analyzer, report server and control method of the same, and biological information analysis system | |
| JP6823911B2 (en) | Biometric information report server and its control method | |
| JP5884324B2 (en) | Biological information measurement system | |
| JP6192267B2 (en) | ECG and setting method thereof | |
| JP2021079007A (en) | Biological information processing device and control method of the same | |
| JP5353691B2 (en) | Biological information monitor, biological information display method, and biological information display program | |
| JP7435262B2 (en) | Biological information measuring device and biological information analysis system | |
| JP6926399B2 (en) | Diagnostic support device, diagnostic support method, and diagnostic support program | |
| JP7734559B2 (en) | Electrocardiogram analyzer and control method thereof | |
| CN119255753A (en) | Electrocardiograph and control method thereof | |
| Vakulenko et al. | User Manual of the Oranta-AO Information System | |
| WO2018079380A1 (en) | Biometric data processing device, biometric data processing system and program | |
| JP2023068220A (en) | Electrocardiographic analysis apparatus and control method of the same | |
| WO2023204312A1 (en) | Electrocardiograph and control method for same | |
| WO2023204310A1 (en) | Electrocardiograph and method for controlling same |
Legal Events
| Date | Code | Title | Description |
|---|---|---|---|
| A621 | Written request for application examination |
Free format text: JAPANESE INTERMEDIATE CODE: A621 Effective date: 20230913 |
|
| A131 | Notification of reasons for refusal |
Free format text: JAPANESE INTERMEDIATE CODE: A131 Effective date: 20240806 |
|
| A521 | Request for written amendment filed |
Free format text: JAPANESE INTERMEDIATE CODE: A523 Effective date: 20240920 |
|
| TRDD | Decision of grant or rejection written | ||
| A01 | Written decision to grant a patent or to grant a registration (utility model) |
Free format text: JAPANESE INTERMEDIATE CODE: A01 Effective date: 20241105 |
|
| A61 | First payment of annual fees (during grant procedure) |
Free format text: JAPANESE INTERMEDIATE CODE: A61 Effective date: 20241118 |
|
| R150 | Certificate of patent or registration of utility model |
Ref document number: 7600611 Country of ref document: JP Free format text: JAPANESE INTERMEDIATE CODE: R150 |