JP7578286B2 - A method for creating a visualization image of deterioration trends in AC rotating machines - Google Patents
A method for creating a visualization image of deterioration trends in AC rotating machines Download PDFInfo
- Publication number
- JP7578286B2 JP7578286B2 JP2021176574A JP2021176574A JP7578286B2 JP 7578286 B2 JP7578286 B2 JP 7578286B2 JP 2021176574 A JP2021176574 A JP 2021176574A JP 2021176574 A JP2021176574 A JP 2021176574A JP 7578286 B2 JP7578286 B2 JP 7578286B2
- Authority
- JP
- Japan
- Prior art keywords
- distribution map
- rotating machines
- deterioration
- creating
- machines
- Prior art date
- Legal status (The legal status is an assumption and is not a legal conclusion. Google has not performed a legal analysis and makes no representation as to the accuracy of the status listed.)
- Active
Links
- 230000006866 deterioration Effects 0.000 title claims description 47
- 238000000034 method Methods 0.000 title claims description 28
- 238000012800 visualization Methods 0.000 title 1
- 238000009826 distribution Methods 0.000 claims description 77
- 230000005856 abnormality Effects 0.000 claims description 58
- 238000011156 evaluation Methods 0.000 claims description 32
- 230000015556 catabolic process Effects 0.000 claims description 13
- 238000012423 maintenance Methods 0.000 description 20
- 230000008439 repair process Effects 0.000 description 7
- 238000003745 diagnosis Methods 0.000 description 6
- 238000007689 inspection Methods 0.000 description 4
- 230000007774 longterm Effects 0.000 description 4
- 238000004891 communication Methods 0.000 description 3
- 238000012360 testing method Methods 0.000 description 3
- 230000002159 abnormal effect Effects 0.000 description 2
- 230000001364 causal effect Effects 0.000 description 2
- 238000009413 insulation Methods 0.000 description 2
- 238000007726 management method Methods 0.000 description 2
- 230000003247 decreasing effect Effects 0.000 description 1
- 238000006731 degradation reaction Methods 0.000 description 1
- 238000002405 diagnostic procedure Methods 0.000 description 1
- 238000010586 diagram Methods 0.000 description 1
- 230000000694 effects Effects 0.000 description 1
- 230000006870 function Effects 0.000 description 1
- 238000009434 installation Methods 0.000 description 1
- 238000004519 manufacturing process Methods 0.000 description 1
- 238000005259 measurement Methods 0.000 description 1
- 230000010287 polarization Effects 0.000 description 1
- 238000001303 quality assessment method Methods 0.000 description 1
- 238000003860 storage Methods 0.000 description 1
- 238000011179 visual inspection Methods 0.000 description 1
Images


Landscapes
- Control Of Multiple Motors (AREA)
Description
本発明は、複数の交流回転機(主に交流高圧電動機及び交流特別高圧電動機又は交流高圧発電機及び交流特別高圧発電機)の劣化に関わる評価項目別の異常発生数を集計して分布図を作成することにより、複数の交流回転機の劣化傾向をまとめて把握することができ、会社単位又は工場単位での計画的なメンテナンス及び更新を可能とする交流回転機の劣化傾向の可視化画像作成方法に関する。 The present invention relates to a method for creating a visualized image of deterioration trends of multiple AC rotating machines, which allows for a comprehensive understanding of the deterioration trends of multiple AC rotating machines by tallying up the number of abnormal occurrences for each evaluation item related to the deterioration of multiple AC rotating machines (mainly AC high-voltage motors and AC extra-high-voltage motors, or AC high-voltage generators and AC extra-high-voltage generators) and creating a distribution map, thereby enabling planned maintenance and renewal on a company or factory basis.
従来、工場等で使用される交流回転機は、安定稼働が望まれる非常に重要な設備であり、日常点検に加え、定期的又は不定期に検査(点検)を受け、その良否判定(劣化診断)の結果を基に、必要に応じて、オーバーホール、補修又は更新(交換)等のメンテナンスが実施されることにより、正常な稼働状態が維持されていた。
しかし、大規模な工場等では使用される交流回転機の数が多く、検査に必要な人員と時間が増大するため、短時間で効率的に交流回転機の劣化(寿命)を診断(判定)することが可能な診断方法や診断装置が望まれていた。また、交流回転機の劣化を確実かつ効率的に診断するためには、様々なパラメータ(評価項目)の中から、評価の対象とするパラメータの数及び組合せを選択する必要もあった。
そのような観点から、これまでに交流回転機の劣化を診断するための様々な方法及び装置が提案されている(例えば、特許文献1、2)。
Conventionally, AC rotating machines used in factories and other facilities are very important equipment that requires stable operation. In addition to daily inspections, they are also inspected regularly or irregularly. Based on the results of these inspections (deterioration diagnosis), overhauls, repairs, renewals (replacements), and other maintenance are carried out as necessary to maintain normal operation.
However, in a large-scale factory or the like, a large number of AC rotating machines are used, and the number of personnel and time required for inspection are increased, so that a diagnostic method and diagnostic device capable of diagnosing (determining) the deterioration (life) of an AC rotating machine efficiently in a short time has been desired. Also, in order to reliably and efficiently diagnose the deterioration of an AC rotating machine, it is necessary to select the number and combination of parameters to be evaluated from various parameters (evaluation items).
From this perspective, various methods and devices for diagnosing deterioration of AC rotating machines have been proposed (for example,
しかし、特許文献1、2のようなこれまでの劣化診断の方法及び装置は、上述のように、個別に行われるそれぞれの交流回転機の検査(点検)及び良否判定(劣化診断)に必要な時間及び工数を削減すること、或いは良否判定に必要なデータの測定精度を改善し、良否判定の信頼性を向上することを目的としたものである。
従って、良否判定の結果、オーバーホール、補修又は更新(交換)等が必要であると判定された時には、その都度、対応しなければならず、メンテナンスのタイミングを掴むことが困難であり、短期間の内(集中的)に、大量の補修又は更新等が必要となった場合には、予算又は人手が不足して十分な対応ができず、業務に支障をきたすおそれもある。
本発明は、かかる事情に鑑みてなされたもので、複数の交流回転機の劣化傾向を一元管理して、可視化するものであり、長期的なメンテナンス計画の立案に役立てることができ、予算及び人員の事前確保を可能にして、メンテナンスが、適切なタイミングで効率的に行われるように支援することができる交流回転機の劣化傾向の可視化画像作成方法を提供することを目的とする。
However, the conventional degradation diagnosis methods and devices such as those disclosed in
Therefore, when the result of the quality assessment indicates that overhaul, repair, or renewal (replacement), etc. is necessary, action must be taken each time, making it difficult to determine the timing of maintenance. In addition, if a large number of repairs or renewals are required in a short period of time (intensively), there may be a lack of budget or manpower to respond adequately, which could disrupt business operations.
The present invention has been made in consideration of the above circumstances, and aims to provide a method for creating a visualized image of the deterioration trends of AC rotating machines, which centrally manages and visualizes the deterioration trends of multiple AC rotating machines, can be useful in planning long-term maintenance plans, enables advance securing of budgets and personnel, and can assist in ensuring that maintenance is carried out efficiently at the appropriate time.
前記目的に沿う本発明に係る交流回転機の劣化傾向の可視化画像作成方法は、コンピュータを用いて、複数の交流回転機の劣化傾向を一元管理することができる交流回転機の劣化傾向の可視化画像作成方法であって、
前記コンピュータにより、全ての前記交流回転機のうち、交流回転機の劣化に関わる1又は複数の評価項目のデータの異常が発生した前記交流回転機の評価項目別異常発生台数を、前記交流回転機の使用開始から評価時までの経過年数毎に集計し、該経過年数毎の全ての前記交流回転機の台数の分布を示す総台数分布図及び前記経過年数毎の前記評価項目別異常発生台数の分布を示す異常発生台数分布図を作成する。
A method for creating a visualized image of deterioration trends of AC rotating machines according to the present invention in accordance with the above-mentioned object is a method for creating a visualized image of deterioration trends of AC rotating machines, which can centrally manage deterioration trends of a plurality of AC rotating machines using a computer, comprising:
The computer compiles, among all of the AC rotating machines, the number of AC rotating machines in which abnormalities have occurred in data for one or more evaluation items related to deterioration of the AC rotating machines, by the number of years that have elapsed since the start of use of the AC rotating machines to the time of evaluation, and creates a total number distribution chart showing the distribution of the number of all the AC rotating machines for each number of years that have elapsed, and a distribution chart of the number of machines in which abnormalities have occurred for each evaluation item for each number of years that have elapsed.
本発明に係る交流回転機の劣化傾向の可視化画像作成方法において、前記総台数分布図及び前記異常発生台数分布図は、前記コンピュータに接続された表示部に表示されることが好ましい。 In the method for creating a visualized image of the deterioration trend of an AC rotating machine according to the present invention, it is preferable that the total number distribution map and the abnormality occurrence number distribution map are displayed on a display unit connected to the computer.
本発明に係る交流回転機の劣化傾向の可視化画像作成方法において、前記総台数分布図及び前記異常発生台数分布図は、1つのグラフ上に作成されることが好ましい。 In the method for creating a visualized image of the deterioration trend of an AC rotating machine according to the present invention, it is preferable that the total number distribution map and the abnormality occurrence number distribution map are created on a single graph.
本発明に係る交流回転機の劣化傾向の可視化画像作成方法において、前記評価項目は、最大放電電荷Qmax及び推定破壊電圧Edであることが好ましい。 In the method for producing a visualized image of the deterioration tendency of an AC rotating machine according to the present invention, the evaluation items are preferably a maximum discharge charge Q max and an estimated breakdown voltage E d .
本発明に係る交流回転機の劣化傾向の可視化画像作成方法において、前記総台数分布図及び前記異常発生台数分布図は、前記交流回転機を所有する会社単位、事業所単位又は工場単位で作成されることが好ましい。 In the method for creating a visualized image of the deterioration trend of an AC rotating machine according to the present invention, it is preferable that the total number distribution map and the abnormality occurrence number distribution map are created for each company, business establishment, or factory that owns the AC rotating machines.
本発明に係る交流回転機の劣化傾向の可視化画像作成方法によれば、経過年数毎に集計された全ての交流回転機の台数の分布を示す総台数分布図及び経過年数毎に集計された評価項目別異常発生台数の分布を示す異常発生台数分布図を作成することができ、利用者はこれらに基づいて、全ての交流回転機の経過年数と、経過年数毎の評価項目別の異常発生状況をまとめて把握することができ、複数の交流回転機に対して、長期的なメンテナンス計画を立てることが可能となり、メンテナンスの適切な実行を実現することができる。 The method for creating a visualized image of the deterioration tendency of AC rotating machines according to the present invention can create a total number distribution chart showing the distribution of the number of all AC rotating machines counted by age and a distribution chart of the number of abnormalities showing the distribution of the number of abnormalities by evaluation item counted by age. Based on these, users can grasp the age of all AC rotating machines and the abnormality occurrence status by evaluation item for each age, making it possible to create long-term maintenance plans for multiple AC rotating machines and ensure that maintenance is carried out appropriately.
本発明に係る交流回転機の劣化傾向の可視化画像作成方法において、総台数分布図及び異常発生台数分布図が、コンピュータに接続された表示部に表示される場合、利用者は、必要時に、一目で全ての交流回転機の経過年数と、経過年数毎の評価項目別の異常発生状況を簡単に確認することができる。 In the method for creating a visualized image of the deterioration tendency of AC rotating machines according to the present invention, if the total number distribution map and the number of abnormality occurrence distribution map are displayed on a display unit connected to a computer, the user can easily check at a glance, when necessary, the age of all AC rotating machines and the abnormality occurrence status by evaluation item for each age.
本発明に係る交流回転機の劣化傾向の可視化画像作成方法において、総台数分布図及び異常発生台数分布図が、1つのグラフ上に作成された場合、利用者は、経過年数と、評価項目別の異常発生状況との関連性(因果関係の有無、経過年数が異常発生に与える影響度等)を容易に把握することができ、劣化診断の支援に効果的である。 In the method for creating a visualized image of the deterioration tendency of AC rotating machines according to the present invention, when a distribution map of the total number of machines and a distribution map of the number of machines with abnormalities are created on a single graph, the user can easily grasp the relationship between the number of years passed and the occurrence of abnormalities by evaluation item (presence or absence of a causal relationship, the degree of influence of the number of years passed on the occurrence of abnormalities, etc.), which is effective in supporting deterioration diagnosis.
本発明に係る交流回転機の劣化傾向の可視化画像作成方法において、評価項目が、最大放電電荷Qmax及び推定破壊電圧Edである場合、少ない評価項目で、複数の交流回転機の劣化傾向を正確に示すことができ、利用者は、これらに基づいて、それぞれの交流回転機に必要な対策(オーバーホール、補修又は更新(交換)等)及びその実施時期を予測して、より具体的なメンテナンス計画を立案することができる。 In the method for creating a visualized image of the deterioration tendency of an AC rotating machine according to the present invention, when the evaluation items are the maximum discharge charge Q max and the estimated breakdown voltage Ed , the deterioration trends of a plurality of AC rotating machines can be accurately shown with a small number of evaluation items, and based on these, a user can predict the measures (overhaul, repair, renewal (replacement), etc.) required for each AC rotating machine and the timing of their implementation, and thus create a more specific maintenance plan.
本発明に係る交流回転機の劣化傾向の可視化画像作成方法において、総台数分布図及び異常発生台数分布図が、交流回転機を所有する会社単位、事業所単位又は工場単位で作成された場合、利用者は、それに基づいて数多くの交流回転機のメンテナンス計画を会社単位、事業所単位又は工場単位でまとめて立案することができ、それぞれの単位で予算管理及び人員確保等を行って、必要な時期に確実かつ効率的にメンテナンス(オーバーホール、補修又は更新(交換)等)を実施して、安定した操業を実現することができる。 In the method for creating a visualized image of the deterioration tendency of AC rotating machines according to the present invention, if a total number distribution map and an abnormality occurrence number distribution map are created for each company, business establishment, or factory that owns the AC rotating machines, the user can use that information to collectively plan maintenance plans for numerous AC rotating machines for each company, business establishment, or factory, and can perform budget management and personnel allocation for each unit to reliably and efficiently perform maintenance (overhaul, repair, or renewal (replacement), etc.) when necessary, thereby realizing stable operation.
続いて、添付した図面を参照しつつ、本発明を具体化した実施の形態につき説明し、本発明の理解に供する。
本発明の一実施の形態に係る交流回転機の劣化傾向の可視化画像作成方法は、複数の交流回転機の劣化傾向を一元管理して、可視化するものであり、長期的なメンテナンス計画の立案に役立てることができ、予算及び人員の事前確保を可能にして、メンテナンスが、適切なタイミングで効率的に行われるように支援するものである。
この交流回転機の劣化傾向の可視化画像作成方法では、管理対象となる複数の交流回転機に対し、図1に示すコンピュータ10により、全ての交流回転機のうち、交流回転機の劣化に関わる1又は複数の評価項目のデータの異常が発生した交流回転機の評価項目別異常発生台数を、交流回転機の使用開始から評価時までの経過年数毎に集計し、経過年数毎の全ての交流回転機の台数の分布を示す総台数分布図及び経過年数毎の評価項目別異常発生台数の分布を示す異常発生台数分布図を作成する。
Next, with reference to the attached drawings, an embodiment of the present invention will be described for understanding the present invention.
A method for creating a visualized image of the deterioration trend of an AC rotating machine according to one embodiment of the present invention centrally manages and visualizes the deterioration trends of multiple AC rotating machines, which can be useful in formulating long-term maintenance plans, enables budgets and personnel to be secured in advance, and helps ensure that maintenance is carried out efficiently and at the appropriate time.
In this method for creating a visualized image of the deterioration tendency of AC rotating machines, for a plurality of AC rotating machines to be managed, a
ここで、評価項目のデータには、各種測定器によって測定される測定値及び各種測定器によって測定される1又は複数の測定値を基に算出される計算値が含まれる。
評価項目として、最大放電電荷Qmax及び推定破壊電圧Edが好適に用いられるが、評価項目の種類(数)及び組合せは、これらに限定されるものではなく、適宜、選択され、これら以外に、例えばメガー値(電動機対地間絶縁抵抗)、成極指数、直流漏れ電流、RC値(絶縁抵抗と静電容量の積)等が追加されてもよい。
最大放電電荷Qmaxは、部分放電試験において所定の時間内における最大の放電パルスの電流値を積分した電荷量(単位:C(クーロン))である。また、推定破壊電圧Edは、次式(1)により、算出される計算値である。
Ed=100-k1×(ΔI+Δtanδ)-k2×Log(Qmax) (1)
ここで、
k1、k2:交流回転機の定格出力に応じて予め設定される係数
ΔI:交流電流試験で測定される部分放電等による電流増加量
Δtanδ:誘電正接試験で測定される部分放電等による損失増加量
である。
なお、低圧の場合、評価項目として、メガー値変動幅及び楔緩み値等が用いられる。
Here, the data of the evaluation items includes measured values measured by various measuring devices and calculated values calculated based on one or more measured values measured by various measuring devices.
As evaluation items, the maximum discharge charge Q max and the estimated breakdown voltage E d are preferably used, but the types (number) and combinations of evaluation items are not limited to these and may be selected as appropriate. In addition to these, for example, megger value (insulation resistance between the motor and ground), polarization index, DC leakage current, RC value (product of insulation resistance and capacitance), etc. may be added.
The maximum discharge charge Qmax is the charge amount (unit: C (coulomb)) obtained by integrating the current value of the maximum discharge pulse within a specified time in a partial discharge test. The estimated breakdown voltage E d is a calculated value calculated by the following formula (1).
E d =100-k1×(ΔI+Δtanδ)-k2×Log(Q max ) (1)
Where:
k1, k2: Coefficients preset according to the rated output of the AC rotating machine. ΔI: Current increase due to partial discharge, etc. measured in an AC current test. Δtan δ: Loss increase due to partial discharge, etc. measured in a dielectric tangent test.
In the case of low pressure, the evaluation items used are the megger value fluctuation range and the wedge loosening value.
交流回転機の劣化傾向の可視化画像作成方法には、図1に示す従来公知のコンピュータ(演算器)10が用いられる。コンピュータ10は、CPU11、RAM12、ROM13、通信部14、表示部15、入力部16、出力部17及び記憶部18を含み、これらの構成はバス20で接続されている。
ROM13には、キーボードやマウス等の入力部16から入力される数値データを集計し、グラフを作成する機能を備えた従来公知の表計算ソフトがインストールされており、CPU11により実行される。
具体的には、利用者が、総台数分布図及び異常発生台数分布図の作成に必要な数値データを入力部16から入力することにより、上述の総台数分布図及び異常発生台数分布図が作成される。そして、作成された総台数分布図及び異常発生台数分布図は、表示部(ディスプレイ)15に表示される。
The method for creating a visualized image of the deterioration tendency of an AC rotating machine uses a conventionally known computer (arithmetic unit) 10 shown in Fig. 1. The
The
Specifically, the above-mentioned total number distribution map and abnormality occurrence number distribution map are created by the user inputting numerical data required for creating the total number distribution map and abnormality occurrence number distribution map from the
表示部15は、コンピュータ10と一体でもよいし、有線又は無線でコンピュータ10と接続されてもよい。なお、作成された総台数分布図及び異常発生台数分布図は、出力部17に接続されたプリンタ等で印刷することができる。また、入力部16から入力された数値データ及び作成された総台数分布図及び異常発生台数分布図は記憶部18に記憶され、必要に応じて、読み出して使用することができる。さらに、コンピュータ10は通信部14を介してネットワークに接続することができ、必要に応じて、同じ工場内の他のコンピュータ、他の工場のコンピュータ及び他の事業所のコンピュータと通信して、それぞれのコンピュータの記憶部等に記憶された数値データの送受信を行うことができる。これにより、それぞれのコンピュータに記憶された数値データを集計し、容易に会社単位、事業所単位又は工場単位で総台数分布図及び異常発生台数分布図を作成することができる。
The
総台数分布図及び異常発生台数分布図の横軸は、交流回転機の使用開始から評価時までの経過年数である。この横軸の目盛り(区切り)は1年単位でもよいし、例えば5年単位又は10年単位等の複数年単位でもよい。
総台数分布図の縦軸は、それぞれの経過年数に含まれる全ての交流回転機の台数であり、異常発生台数分布図の縦軸は、それぞれの経過年数に含まれる全ての交流回転機のうち、各評価項目のデータの異常が発生した交流回転機の台数である。
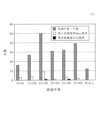
総台数分布図及び異常発生台数分布図は棒グラフでもよいし、折れ線グラフでもよい。また、総台数分布図及び異常発生台数分布図は、別々のグラフ上に作成することもできるし、1つのグラフ上に作成することもできる。総台数分布図及び異常発生台数分布図を棒グラフで1つのグラフ上に作成する場合、それぞれの経過年数に対し、全ての交流回転機の台数と評価項目別異常発生台数を並べて表示することが好ましい。例えば、評価項目が最大放電電荷Qmax及び推定破壊電圧Edの2種類である場合、横軸のそれぞれの経過年数に対し、全ての交流回転機の台数、最大放電電荷Qmaxの異常が発生した交流回転機の台数及び推定破壊電圧Edの異常が発生した交流回転機の台数を示す3つの棒グラフが横に並べて作成される(図2、図3(A)、(B)参照)。
The horizontal axis of the total number distribution map and the abnormality occurrence number distribution map represents the number of years elapsed from the start of use of the AC rotating machine to the time of evaluation. The scale (division) of this horizontal axis may be in one-year increments or in multiple-year increments, such as in five-year or ten-year increments.
The vertical axis of the total number distribution chart is the number of all AC rotating machines included in each elapsed year, and the vertical axis of the distribution chart of the number of abnormalities occurred is the number of AC rotating machines in which an abnormality occurred in the data for each evaluation item among all AC rotating machines included in each elapsed year.
The total number distribution map and the abnormality occurrence number distribution map may be a bar graph or a line graph. The total number distribution map and the abnormality occurrence number distribution map may be created on separate graphs or on one graph. When the total number distribution map and the abnormality occurrence number distribution map are created on one graph as bar graphs, it is preferable to display the number of all AC rotating machines and the number of abnormality occurrence machines by evaluation item side by side for each elapsed year. For example, when the evaluation items are two types, the maximum discharge charge Q max and the estimated breakdown voltage E d , three bar graphs showing the number of all AC rotating machines, the number of AC rotating machines with the maximum discharge charge Q max abnormality, and the number of AC rotating machines with the estimated breakdown voltage E d abnormality are created side by side for each elapsed year on the horizontal axis (see FIG. 2, FIG. 3 (A), (B)).
このようにして作成された総台数分布図及び異常発生台数分布図が、表示部15に表示されることにより、利用者は、一目で全ての交流回転機の経過年数と、経過年数毎の評価項目別の異常発生状況を簡単に確認することができる。そして、利用者はこれらに基づいて、全ての交流回転機の経過年数と、経過年数毎の評価項目別の異常発生状況をまとめて把握することができ、複数の交流回転機に対して、長期的なメンテナンス計画を立てることが可能となり、メンテナンスの適切な実行を実現することができる。特に、総台数分布図及び異常発生台数分布図が、1つのグラフ上に作成されていれば、利用者は、経過年数と、評価項目別の異常発生状況との関連性(因果関係の有無、経過年数が異常発生に与える影響度等)を容易に把握することができ、劣化診断の支援に効果的である。また、最大放電電荷Qmax及び推定破壊電圧Edを評価項目とすることにより、少ない評価項目で、複数の交流回転機の劣化傾向を正確に示すことができ、利用者は、これらに基づいて、それぞれの交流回転機に必要な対策(オーバーホール、補修又は更新(交換)等)及びその実施時期を予測して、より具体的なメンテナンス計画を立案することができる。さらに、総台数分布図及び異常発生台数分布図が、交流回転機を所有する会社単位、事業所単位又は工場単位で作成されることにより、利用者は、それに基づいて数多くの交流回転機のメンテナンス計画を会社単位、事業所単位又は工場単位でまとめて立案することができ、それぞれの単位で予算管理及び人員確保等を行って、必要な時期に確実かつ効率的にメンテナンス(オーバーホール、補修又は更新(交換)等)を実施して、安定した操業を実現することができる。
よって、この交流回転機の劣化傾向の可視化画像作成方法は、交流回転機の劣化傾向の判定支援方法とも言える。
The total number distribution map and the abnormality occurrence number distribution map thus created are displayed on the
Therefore, this method for creating a visualized image of the deterioration tendency of an AC rotating machine can also be said to be a method for supporting the determination of the deterioration tendency of an AC rotating machine.
次に、本発明の作用効果を確認するために行った実施例について説明する。
(実施例1)
会社で所有する207台の交流回転機それぞれにつき、経過年数を確認した。また、各交流回転機につき、最大放電電荷Qmaxの測定及び推定破壊電圧Edの算出を行い、それぞれのデータにつき、異常の有無を確認した。これらのデータに基づき、コンピュータ(表計算ソフト)により、全ての交流回転機のうち、最大放電電荷Qmax及び推定破壊電圧Edのデータの異常が発生した交流回転機の評価項目別異常発生台数(最大放電電荷Qmaxの異常発生台数及び推定破壊電圧Edの異常発生台数)を、経過年数毎に集計し、図2に示すように、経過年数毎の全ての交流回転機の台数の分布を示す総台数分布図及び経過年数毎の評価項目別異常発生台数の分布を示す異常発生台数分布図を作成した。
図2では、横軸の経過年数を10年単位とし、総台数分布図及び異常発生台数分布図を1つのグラフ上に作成した。
総台数分布図から、経過年数が21~30年の交流回転機の台数が最も多く、続いて51~60年、41~50年、31~40年の順に台数が減っていることを確認することができる。これにより、利用者は、5年後、10年後にどの程度の台数の交流回転機の更新が必要になるのか容易に把握して、適切な更新計画を立てることができる。
また、異常発生台数分布図から、経過年数31年以上に比べ、経過年数30年以下で、最大放電電荷Qmaxの異常が多く発生していることを確認することができる。これにより、利用者は、経過年数30年以下で、最大放電電荷Qmaxの異常が発生している交流回転機につき、定期的に精密診断を行い、劣化の進行状況を把握して早期に対策を講じることができ、業務への支障を最小限に抑えることができる。
Next, examples carried out to confirm the effects of the present invention will be described.
Example 1
The age of each of the 207 AC rotating machines owned by the company was confirmed. In addition, the maximum discharge charge Q max and the estimated breakdown voltage Ed were measured for each AC rotating machine, and the presence or absence of abnormalities was confirmed for each data. Based on these data, the number of AC rotating machines with abnormalities in the maximum discharge charge Q max and estimated breakdown voltage Ed (the number of machines with abnormalities in the maximum discharge charge Q max and the number of machines with abnormalities in the estimated breakdown voltage Ed ) was counted by age using a computer (spreadsheet software), and a total number distribution chart showing the distribution of the number of all AC rotating machines by age and a number of abnormality distribution chart showing the distribution of the number of machines with abnormalities by evaluation item by age were created, as shown in Figure 2.
In Figure 2, the horizontal axis represents the number of years since the accident in units of 10 years, and the distribution map of the total number of vehicles and the distribution map of the number of vehicles with abnormalities are plotted on a single graph.
From the distribution map of the total number, it can be seen that the largest number of AC rotating machines are 21 to 30 years old, followed by those 51 to 60 years old, 41 to 50 years old, and 31 to 40 years old, with the number decreasing in that order. This allows users to easily grasp how many AC rotating machines will need to be replaced in five and ten years' time, and to make appropriate replacement plans.
In addition, from the distribution map of the number of machines with abnormalities, it can be seen that abnormalities in maximum discharge charge Qmax occur more frequently in machines that are 30 years old or younger than those that are 31 years old or older. This enables users to periodically perform detailed diagnosis of AC rotating machines that are 30 years old or younger and in which abnormalities in maximum discharge charge Qmax occur, understand the progress of deterioration, and take measures early, thereby minimizing disruption to business operations.
(実施例2)
会社の所有する2つの工場につき、実施例1のデータを工場毎に集計した以外は、実施例1と同様にして、工場単位で総台数分布図及び異常発生台数分布図を作成した。
これにより、図3(A)の工場及び図3(B)の工場のそれぞれで、どの時期に何台の交流回転機の更新が必要になるかが分かり、必要な予算を確保して、適切なメンテナンスを実行することができる。また、図3(B)の工場では、経過年数が41~50年の交流回転機で最大放電電荷Qmaxの異常及び推定破壊電圧Edの異常が発生していることを確認することができる。従って、図3(B)の工場で、交流回転機の設置環境を確認し、必要な改善を行うことによって、交流回転機の劣化の進行を遅らせることや、日常的な目視点検を実施することによって、交流回転機に発生する異常を早期に発見して効率的にメンテナンスを実施することができる。
Example 2
A distribution map of the total number of units and a distribution map of the number of units with abnormalities were created for each of the two factories owned by the company in the same manner as in Example 1, except that the data in Example 1 was compiled for each factory.
As a result, it is possible to know how many AC rotating machines need to be replaced and when in each of the factories in Fig. 3(A) and Fig. 3(B), and to secure the necessary budget and perform appropriate maintenance. In addition, in the factory in Fig. 3(B), it is possible to confirm that an abnormality in the maximum discharge charge Q max and an abnormality in the estimated breakdown voltage E d have occurred in an AC rotating machine that is 41 to 50 years old. Therefore, in the factory in Fig. 3(B), by checking the installation environment of the AC rotating machine and making necessary improvements, it is possible to slow down the progression of deterioration of the AC rotating machine, and by performing daily visual inspection, it is possible to find abnormalities occurring in the AC rotating machine early and perform efficient maintenance.
以上説明したように、会社単位又は工場単位で総台数分布図及び異常発生台数分布図が作成されることにより、会社単位又は工場単位で、複数の交流回転機の劣化傾向をまとめて把握することができ、限られた予算を適正に配分して、計画的なメンテナンス及び更新を行うことが可能となる。 As explained above, by creating a total number distribution map and anomaly occurrence number distribution map for each company or factory, it is possible to grasp the deterioration trends of multiple AC rotating machines at a company or factory level, and it becomes possible to appropriately allocate limited budgets and carry out planned maintenance and updates.
以上、本発明を、実施の形態を参照して説明してきたが、本発明は何ら上記した実施の形態に記載した構成に限定されるものではなく、特許請求の範囲に記載されている事項の範囲内で考えられるその他の実施の形態や変形例も含むものである。 The present invention has been described above with reference to the embodiments, but the present invention is not limited to the configurations described in the above embodiments, and also includes other embodiments and variations that are possible within the scope of the matters described in the claims.
10:コンピュータ、11:CPU、12:RAM、13:ROM、14:通信部、15:表示部、16:入力部、17:出力部、18:記憶部、20:バス 10: Computer, 11: CPU, 12: RAM, 13: ROM, 14: Communication unit, 15: Display unit, 16: Input unit, 17: Output unit, 18: Memory unit, 20: Bus
Claims (5)
前記コンピュータにより、全ての前記交流回転機のうち、交流回転機の劣化に関わる1又は複数の評価項目のデータの異常が発生した前記交流回転機の評価項目別異常発生台数を、前記交流回転機の使用開始から評価時までの経過年数毎に集計し、該経過年数毎の全ての前記交流回転機の台数の分布を示す総台数分布図及び前記経過年数毎の前記評価項目別異常発生台数の分布を示す異常発生台数分布図を作成することを特徴とする交流回転機の劣化傾向の可視化画像作成方法。 A method for creating a visualized image of deterioration trends of AC rotating machines, which can centrally manage deterioration trends of a plurality of AC rotating machines using a computer, comprising:
a computer-generated total number distribution map showing the distribution of the number of all the AC rotating machines for each number of years elapsed from the start of use of the AC rotating machines to the time of evaluation, and a distribution map of the number of machines for which an abnormality has occurred for each evaluation item for each number of years elapsed.
Priority Applications (1)
| Application Number | Priority Date | Filing Date | Title |
|---|---|---|---|
| JP2021176574A JP7578286B2 (en) | 2021-10-28 | 2021-10-28 | A method for creating a visualization image of deterioration trends in AC rotating machines |
Applications Claiming Priority (1)
| Application Number | Priority Date | Filing Date | Title |
|---|---|---|---|
| JP2021176574A JP7578286B2 (en) | 2021-10-28 | 2021-10-28 | A method for creating a visualization image of deterioration trends in AC rotating machines |
Publications (2)
| Publication Number | Publication Date |
|---|---|
| JP2023066074A JP2023066074A (en) | 2023-05-15 |
| JP7578286B2 true JP7578286B2 (en) | 2024-11-06 |
Family
ID=86322258
Family Applications (1)
| Application Number | Title | Priority Date | Filing Date |
|---|---|---|---|
| JP2021176574A Active JP7578286B2 (en) | 2021-10-28 | 2021-10-28 | A method for creating a visualization image of deterioration trends in AC rotating machines |
Country Status (1)
| Country | Link |
|---|---|
| JP (1) | JP7578286B2 (en) |
Citations (5)
| Publication number | Priority date | Publication date | Assignee | Title |
|---|---|---|---|---|
| JP2000214212A (en) | 1999-01-21 | 2000-08-04 | Fuji Electric Co Ltd | Life prediction method for electrical insulation of electrical equipment. |
| JP2003331087A (en) | 2002-05-13 | 2003-11-21 | Honda Motor Co Ltd | Demand forecast system for repair parts |
| JP2009099144A (en) | 2007-10-15 | 2009-05-07 | General Electric Co <Ge> | Method and system for remotely predictig remaining life of ac motor system |
| JP2009155041A (en) | 2007-12-26 | 2009-07-16 | Toshiba Elevator Co Ltd | Automatic replacement schedule system for elevator life-limited component and automatic replacement schedule method for elevator life-limited component |
| WO2015198453A1 (en) | 2014-06-26 | 2015-12-30 | 三菱電機ビルテクノサービス株式会社 | Elevating machine component demand forecasting system |
Family Cites Families (1)
| Publication number | Priority date | Publication date | Assignee | Title |
|---|---|---|---|---|
| JP3280547B2 (en) * | 1995-09-12 | 2002-05-13 | 株式会社日立製作所 | Insulation diagnosis method |
-
2021
- 2021-10-28 JP JP2021176574A patent/JP7578286B2/en active Active
Patent Citations (5)
| Publication number | Priority date | Publication date | Assignee | Title |
|---|---|---|---|---|
| JP2000214212A (en) | 1999-01-21 | 2000-08-04 | Fuji Electric Co Ltd | Life prediction method for electrical insulation of electrical equipment. |
| JP2003331087A (en) | 2002-05-13 | 2003-11-21 | Honda Motor Co Ltd | Demand forecast system for repair parts |
| JP2009099144A (en) | 2007-10-15 | 2009-05-07 | General Electric Co <Ge> | Method and system for remotely predictig remaining life of ac motor system |
| JP2009155041A (en) | 2007-12-26 | 2009-07-16 | Toshiba Elevator Co Ltd | Automatic replacement schedule system for elevator life-limited component and automatic replacement schedule method for elevator life-limited component |
| WO2015198453A1 (en) | 2014-06-26 | 2015-12-30 | 三菱電機ビルテクノサービス株式会社 | Elevating machine component demand forecasting system |
Also Published As
| Publication number | Publication date |
|---|---|
| JP2023066074A (en) | 2023-05-15 |
Similar Documents
| Publication | Publication Date | Title |
|---|---|---|
| KR102092185B1 (en) | Platform for analyzing electric motor health and analysis method using the same | |
| DE60031615T2 (en) | Intelligent apparatus and method for analyzing a liquid-filled electrical system | |
| JP7191807B2 (en) | Diagnostic device and diagnostic method | |
| CN103149475A (en) | Method and system for fault diagnosis of electrical equipment | |
| Karandaev et al. | Diagnostic functions of a system for continuous monitoring of the technical condition of the transformers of arc steelmaking furnaces | |
| BR112013026307B1 (en) | DYNAMIC EVALUATION SYSTEM FOR MONITORING HIGH VOLTAGE ELECTRICAL COMPONENTS AND METHOD FOR EVALUATION OF AT LEAST ONE HIGH VOLTAGE ELECTRICAL COMPONENT | |
| CN103377110A (en) | Method and system for use in condition monitoring | |
| CN114167282B (en) | Motor fault diagnosis and degradation trend prediction system | |
| Honarmand et al. | Reliability modeling of process-oriented smart monitoring in the distribution systems | |
| JP7578286B2 (en) | A method for creating a visualization image of deterioration trends in AC rotating machines | |
| JP4550537B2 (en) | System and method for estimating residual insulation life of high-pressure rotating machine | |
| US20240028022A1 (en) | Prognosis of high voltage equipment | |
| Al‐Najjar | Economic criteria to select a cost‐effective maintenance policy | |
| US11568336B2 (en) | Information-technology-utilization evaluation device, information-technology-utilization evaluation system, and information-technology-utilization evaluation method | |
| JPH02247576A (en) | Equipment/equipment diagnostic system | |
| Waugh et al. | Improving the life cycle management of power transformers transforming data to life | |
| JP6971936B2 (en) | Maintenance support equipment, methods and programs for electric power equipment | |
| Lawan et al. | Reliability and performance analysis of two unit active parallel system attended by two repairable machines | |
| Prata et al. | Overhead lines and underground cables asset management–best practices and challenges | |
| Ravinder | Experience in asset performance management analytics for decision support on Transmission & Distribution Assets | |
| Adoghe | Reliability centered maintenance (RCM) for asset management in electric power distribution system | |
| Zhou | A practical method for cable failure rate modeling | |
| Lybeck et al. | Online monitoring technical basis and analysis framework for large power transformers; Interim report for FY 2012 | |
| Lüpschen et al. | Medium voltage energy cable diagnostics–service provider experiences and diagnostic information system | |
| Aziz et al. | Protection & Controls analytics for a reliable grid |
Legal Events
| Date | Code | Title | Description |
|---|---|---|---|
| RD02 | Notification of acceptance of power of attorney |
Free format text: JAPANESE INTERMEDIATE CODE: A7422 Effective date: 20230703 |
|
| A621 | Written request for application examination |
Free format text: JAPANESE INTERMEDIATE CODE: A621 Effective date: 20240311 |
|
| TRDD | Decision of grant or rejection written | ||
| A977 | Report on retrieval |
Free format text: JAPANESE INTERMEDIATE CODE: A971007 Effective date: 20240930 |
|
| A01 | Written decision to grant a patent or to grant a registration (utility model) |
Free format text: JAPANESE INTERMEDIATE CODE: A01 Effective date: 20241001 |
|
| A61 | First payment of annual fees (during grant procedure) |
Free format text: JAPANESE INTERMEDIATE CODE: A61 Effective date: 20241017 |
|
| R150 | Certificate of patent or registration of utility model |
Ref document number: 7578286 Country of ref document: JP Free format text: JAPANESE INTERMEDIATE CODE: R150 |