JP7367366B2 - Anomaly detection device, anomaly detection method, and anomaly detection program - Google Patents
Anomaly detection device, anomaly detection method, and anomaly detection program Download PDFInfo
- Publication number
- JP7367366B2 JP7367366B2 JP2019135695A JP2019135695A JP7367366B2 JP 7367366 B2 JP7367366 B2 JP 7367366B2 JP 2019135695 A JP2019135695 A JP 2019135695A JP 2019135695 A JP2019135695 A JP 2019135695A JP 7367366 B2 JP7367366 B2 JP 7367366B2
- Authority
- JP
- Japan
- Prior art keywords
- index
- target device
- index value
- abnormality detection
- abnormality
- Prior art date
- Legal status (The legal status is an assumption and is not a legal conclusion. Google has not performed a legal analysis and makes no representation as to the accuracy of the status listed.)
- Active
Links
Images


Classifications
-
- G—PHYSICS
- G05—CONTROLLING; REGULATING
- G05B—CONTROL OR REGULATING SYSTEMS IN GENERAL; FUNCTIONAL ELEMENTS OF SUCH SYSTEMS; MONITORING OR TESTING ARRANGEMENTS FOR SUCH SYSTEMS OR ELEMENTS
- G05B23/00—Testing or monitoring of control systems or parts thereof
- G05B23/02—Electric testing or monitoring
- G05B23/0205—Electric testing or monitoring by means of a monitoring system capable of detecting and responding to faults
- G05B23/0218—Electric testing or monitoring by means of a monitoring system capable of detecting and responding to faults characterised by the fault detection method dealing with either existing or incipient faults
- G05B23/0224—Process history based detection method, e.g. whereby history implies the availability of large amounts of data
- G05B23/024—Quantitative history assessment, e.g. mathematical relationships between available data; Functions therefor; Principal component analysis [PCA]; Partial least square [PLS]; Statistical classifiers, e.g. Bayesian networks, linear regression or correlation analysis; Neural networks
-
- B—PERFORMING OPERATIONS; TRANSPORTING
- B30—PRESSES
- B30B—PRESSES IN GENERAL
- B30B15/00—Details of, or accessories for, presses; Auxiliary measures in connection with pressing
- B30B15/26—Programme control arrangements
-
- B—PERFORMING OPERATIONS; TRANSPORTING
- B30—PRESSES
- B30B—PRESSES IN GENERAL
- B30B15/00—Details of, or accessories for, presses; Auxiliary measures in connection with pressing
- B30B15/28—Arrangements for preventing distortion of, or damage to, presses or parts thereof
-
- G—PHYSICS
- G05—CONTROLLING; REGULATING
- G05B—CONTROL OR REGULATING SYSTEMS IN GENERAL; FUNCTIONAL ELEMENTS OF SUCH SYSTEMS; MONITORING OR TESTING ARRANGEMENTS FOR SUCH SYSTEMS OR ELEMENTS
- G05B19/00—Programme-control systems
- G05B19/02—Programme-control systems electric
- G05B19/18—Numerical control [NC], i.e. automatically operating machines, in particular machine tools, e.g. in a manufacturing environment, so as to execute positioning, movement or co-ordinated operations by means of programme data in numerical form
- G05B19/406—Numerical control [NC], i.e. automatically operating machines, in particular machine tools, e.g. in a manufacturing environment, so as to execute positioning, movement or co-ordinated operations by means of programme data in numerical form characterised by monitoring or safety
-
- G—PHYSICS
- G06—COMPUTING; CALCULATING OR COUNTING
- G06F—ELECTRIC DIGITAL DATA PROCESSING
- G06F18/00—Pattern recognition
- G06F18/20—Analysing
- G06F18/22—Matching criteria, e.g. proximity measures
-
- G—PHYSICS
- G05—CONTROLLING; REGULATING
- G05B—CONTROL OR REGULATING SYSTEMS IN GENERAL; FUNCTIONAL ELEMENTS OF SUCH SYSTEMS; MONITORING OR TESTING ARRANGEMENTS FOR SUCH SYSTEMS OR ELEMENTS
- G05B2219/00—Program-control systems
- G05B2219/30—Nc systems
- G05B2219/34—Director, elements to supervisory
- G05B2219/34465—Safety, control of correct operation, abnormal states
Description
本発明は、対象装置の異常を検知する異常検知装置、異常検知方法、および異常検知プログラムに関する。 The present invention relates to an anomaly detection device, an anomaly detection method, and an anomaly detection program that detect an anomaly in a target device.
従来、プレスシステムにおいて、ワークをプレスする際のプレス荷重の荷重波形に基づいて、プレス異常を検知する技術が知られている(例えば、特許文献1参照)。 BACKGROUND ART Conventionally, in a press system, a technique is known that detects a press abnormality based on a load waveform of a press load when pressing a workpiece (see, for example, Patent Document 1).
また、サーボモータの速度に依存した確立密度関数を用いて、モータを制御する技術が知られている(例えば、特許文献2参照)。 Furthermore, a technique is known in which a motor is controlled using a probability density function that depends on the speed of the servo motor (for example, see Patent Document 2).
特許文献1、または特許文献2に記載の技術は、ワークを加工する加工動作による装置の実測値が、標準偏差内であるか否かで、異常が発生しているか否かを判定している。
The technology described in Patent Document 1 or
ところで、サーボモータを動力源とする対象装置において、加工動作途中のプレス荷重、またはモータ速度の予測曲線は、加工動作途中で急峻となる部分がある場合がある。上述の従来技術のように、加工動作による装置の実測値が、標準偏差内であるか否かで、異常が発生しているか否かを判定する場合、予測曲線が急峻な時では、異常が発生していないのにも関わらず、異常であると判定されてしまう場合がある。 By the way, in a target device using a servo motor as a power source, the predicted curve of the press load or motor speed during the processing operation may have a steep portion during the processing operation. As in the above-mentioned conventional technology, when determining whether an abnormality has occurred based on whether or not the actual measurement value of the device due to the machining operation is within the standard deviation, when the predicted curve is steep, it is difficult to determine whether the abnormality has occurred. There are cases where it is determined that there is an abnormality even though it has not occurred.
本発明の一態様は、上述した事情に鑑みてなされたものであり、異常判定を適切に行うことができる技術を提供することを目的とする。 One aspect of the present invention has been made in view of the above-mentioned circumstances, and an object of the present invention is to provide a technique that can appropriately determine an abnormality.
前記の課題を解決するために、本発明の一態様に係る異常検知装置は、対象装置の異常を検知する異常検知装置であって、前記対象装置の動作における第1指標に関する第1指標値と、第2指標に関する第2指標値と、を取得する取得部と、前記第1指標と、前記第2指標とを軸とする2次元平面おける、前記第1指標値、及び前記第2指標値により示される点の、予め設定された基準曲線からの距離に基づいて、前記対象装置の異常を検知する異常検知部と、を備える。 In order to solve the above problems, an abnormality detection device according to one aspect of the present invention is an abnormality detection device that detects an abnormality in a target device, and includes a first index value related to a first index in the operation of the target device. , a second index value related to a second index, and an acquisition unit that acquires the first index value and the second index value in a two-dimensional plane having the first index and the second index as axes. and an abnormality detection unit that detects an abnormality in the target device based on a distance of a point indicated by from a preset reference curve.
また、前記の課題を解決するために、本発明の一態様に係る異常検知方法は、対象装置の異常を検知する異常検知装置において実行される異常検知方法であって、対象装置の動作における第1指標に関する第1指標値と、第2指標に関する第2指標値と、を取得する指標値取得ステップと、前記第1指標と、前記第2指標とを軸とする2次元平面おける、前記第1指標値、及び前記第2指標値により示される点の、予め設定された基準曲線からの距離に基づいて、前記対象装置の異常を検知する異常検知ステップと、を含む。 Further, in order to solve the above-mentioned problems, an anomaly detection method according to one aspect of the present invention is an anomaly detection method that is executed in an anomaly detection device that detects an abnormality in a target device. an index value obtaining step of obtaining a first index value related to one index and a second index value related to a second index; and an abnormality detection step of detecting an abnormality in the target device based on a distance of a point indicated by the first index value and the second index value from a preset reference curve.
前記の構成によれば、対象装置の動作過程における異常判定を適切に行うことができる。 According to the above configuration, it is possible to appropriately determine an abnormality in the operation process of the target device.
また、本発明の一態様に係る異常検知装置は、前記第1指標値は、前記対象装置の動作の段階に係る値であり、前記第2指標値は、前記対象装置の動作の負荷に係る値である。 Further, in the abnormality detection device according to one aspect of the present invention, the first index value is a value related to an operation stage of the target device, and the second index value is a value related to an operation load of the target device. It is a value.
前記の構成によれば、対象装置の動作の各段階において適切に異常判定を行うことができる。 According to the above configuration, abnormality determination can be appropriately performed at each stage of the operation of the target device.
また、本発明の一態様に係る異常検知装置は、前記2次元平面における前記第1指標値のスケールと、前記2次元平面における前記第2指標値のスケールとを、それぞれ個別に規格化するスケール規格化部を備える。 Further, the anomaly detection device according to one aspect of the present invention includes a scale that individually normalizes a scale of the first index value in the two-dimensional plane and a scale of the second index value in the two-dimensional plane. Equipped with a standardization section.
前記の構成によれば、各指標値を適切に規格化して、異常判定を行うため、異常判定を適切に行うことができる。 According to the above configuration, each index value is appropriately standardized to perform abnormality determination, so that abnormality determination can be appropriately performed.
また、本発明の一態様に係る異常検知装置は、前記異常検知部は、前記異常検知部は、前記第2指標値が、前記基準曲線に対して負荷が大きい側であるか、負荷が小さい側であるかに応じて、前記距離に付す符号の正負を切り替え、正負が付された前記距離に基づいて前記対象装置の異常を検知する。 Further, in the anomaly detection device according to one aspect of the present invention, the anomaly detection unit may be configured such that the second index value is on a side with a large load or a small load with respect to the reference curve. The sign attached to the distance is switched between positive and negative depending on the side, and an abnormality in the target device is detected based on the distance to which the positive and negative signs are attached.
前記の構成によれば、指標値が基準曲線よりある程度小さくても異常ではないが、指標値が基準曲線より高いと異常の可能性が高い場合等であっても、適切に異常判定を行うことができる。 According to the above configuration, even if the index value is smaller than the reference curve to some extent, it is not abnormal, but if the index value is higher than the reference curve, there is a high possibility of abnormality, even if the abnormality determination is made appropriately. I can do it.
また、本発明の一態様に係る異常検知装置は、前記異常検知部は、前記距離に付された正負に応じて、前記対象装置の異常の有無に関する判断に用いる閾値であって、前記基準曲線からの距離の閾値を変更する。 Further, in the anomaly detection device according to one aspect of the present invention, the anomaly detection unit is configured to set a threshold value for use in determining whether or not there is an abnormality in the target device according to a sign attached to the distance; Change the distance threshold from.
前記の構成によれば、距離の正負に応じて、異常の有無に関する判断が異なる場合でも、適切に異常判定を行うことができる。 According to the above-mentioned configuration, even if the judgment regarding the presence or absence of an abnormality differs depending on whether the distance is positive or negative, it is possible to appropriately determine the abnormality.
また、本発明の一態様に係る異常検知装置は、前記異常検知部は、加工動作中の前記距離の標準偏差に基づいて、前記対象装置の異常を検知する。 Further, in the abnormality detection device according to one aspect of the present invention, the abnormality detection unit detects an abnormality in the target device based on a standard deviation of the distance during a machining operation.
また、本発明の一態様に係る異常検知装置は、前記異常検知部は、加工動作中の前記距離の度数分布における特徴量に基づいて、前記対象装置の異常を検知する。 Further, in the abnormality detection device according to one aspect of the present invention, the abnormality detection unit detects an abnormality in the target device based on a feature amount in a frequency distribution of the distance during a machining operation.
また、本発明の一態様に係る異常検知装置は、前記度数分布における特徴量は、加工動作中の前記距離をビンとしたヒストグラムにおける尖度である。 Further, in the abnormality detection device according to one aspect of the present invention, the feature amount in the frequency distribution is kurtosis in a histogram with the distance during the machining operation as bins.
また、本発明の一態様に係る異常検知装置は、前記度数分布における特徴量は、加工動作中の前記距離をビンとしたヒストグラムにおける歪度である。 Further, in the abnormality detection device according to one aspect of the present invention, the feature amount in the frequency distribution is a skewness in a histogram with the distance during the machining operation as bins.
また、本発明の一態様に係る異常検知プログラムは、前記異常検知装置としてコンピュータを機能させるための異常検知プログラムであって、前記取得部、および前記異常検知部としてコンピュータを機能させる。 Further, an abnormality detection program according to one aspect of the present invention is an abnormality detection program for causing a computer to function as the abnormality detection device, and causes the computer to function as the acquisition unit and the abnormality detection unit.
本発明の一態様によれば、対象装置の異常判定を適切に行うことができる。 According to one aspect of the present invention, abnormality determination of a target device can be appropriately performed.
以下、本発明の一側面に係る実施形態(以下、「本実施形態」とも表記する)を、図面に基づいて説明する。 Hereinafter, an embodiment (hereinafter also referred to as "this embodiment") according to one aspect of the present invention will be described based on the drawings.
§1 適用例
図1を用いて、本発明が適用される場面の一例について説明する。図1は、本実施形態に係る異常検知装置100が用いられる現場を模式的に示した図である。
§1 Application Example An example of a situation where the present invention is applied will be described using FIG. 1. FIG. 1 is a diagram schematically showing a site where an
図1に示すように、異常検知装置100は、例えば製造現場において用いられ、対象装置10の異常を検知する装置である。異常検知装置100は、例えば、PLC(プログラマブルコントローラ)によって実現される。PLCによって異常検知装置100を実現する構成では、異常検知装置100は、対象装置10の動作を制御する構成であってもよい。異常検知装置100は、フィールドネットワーク、またはローカルネットワーク等のネットワークを介して1又は複数の対象装置10と接続されている。
As shown in FIG. 1, an
対象装置10は、例えば、サーボモータを動力源として駆動するプレス機器である。対象装置10の一例であるプレス機器は、サーボモータ20を回転運動し、サーボモータ20の回転運動をアクチュエータ15により直線運動に変換して、圧入ワーク5bを被圧入ワーク5a内にプレスツール12を介して圧入する。
The
プレス機器におけるプレスツール12は、圧入の回数を重ねると、圧入ワーク5bとの接触面が摩耗する。プレスツール12の摩耗が進むと、金属粉が発生し、圧入時に、当該金属粉が圧入ワーク5bと被圧入ワーク5aとの間に挟み込まれると、異物噛み込みの異常、およびプレスツールが抜けなくなる異常等が発生する。
When the
異常検知装置100は、対象装置10の動作に係るデータを収集し、学習し、監視する機能を有している。異常検知装置100は、対象装置10から、例えば、サーボモータのトルク、速度、および位置等の情報、およびロードセル16で測定されるプレスツール12に掛かる負荷の情報、および変位センサ11によって検知されたセンサ値(位置)を取得する。
The
異常検知装置100は、対象装置10の動作に係るデータに基づく、第1指標に関する第1指標値、例えば対象装置10の動作の段階に係る値と、第2指標に関する第2指標値、例えば対象装置10の動作の負荷に係る値と、を取得して、これらの2つの指標値を参照して、対象装置10に異常が生じているか否かを判定する。
The
異常検知装置100は、特に、第1指標と、第2指標とを軸とする2次元平面おける、第1指標値、及び第2指標値により示される点の、予め設定された基準曲線からの距離に基づいて対象装置10に異常が生じているか否かを判定する。
In particular, the
これにより、異常検知装置100は、対象装置10の加工動作開始から加工動作終了までを監視し、異常予兆を早く検知することができる。また、対象装置10の動作過程でセンサ値が急峻に変化する場面においても、異常が生じているか否かを適切に判定することができる。また、対象装置10の動作の段階に係る値と、対象装置10の動作の負荷に係る値とを、用いて異常判定を行うことで、対象装置10の動作の各段階において適切に異常判定を行うことができる。
Thereby, the
§2 構成例
〔実施形態1〕
以下、本発明の一実施形態について、詳細に説明する。
§2 Configuration example [Embodiment 1]
Hereinafter, one embodiment of the present invention will be described in detail.
(異常検知装置100の構成について)
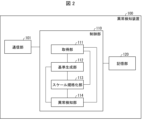
図2は、異常検知装置100の要部構成を示すブロック図である。図2に示すように、異常検知装置100は、通信部101、制御部110、および記憶部120を備えている。
(About the configuration of the abnormality detection device 100)
FIG. 2 is a block diagram showing the configuration of main parts of the
通信部101は、対象装置10との間でネットワークを介して通信を行い、データの送受信を実行する。通信部101は、例えば、通信IC(Integrated Circuits)などの集積回路を用いて実現される。通信部101は、有線通信、または無線通信により対象装置10との間で通信を行う。
The
制御部110は、異常検知装置100の各部を統括的に制御する機能を備えている演算装置である。制御部110は、例えば1つ以上のプロセッサ(例えばCPUなど)が、1つ以上のメモリ(例えばRAMやROMなど)に記憶されているプログラムを実行することで異常検知装置100の各部を制御してもよい。
The
記憶部120は、制御部110によって用いられる各種データ、および、制御部110によって実行される各種ソフトウェアを記憶している。また、記憶部120は、制御部110によって、対象装置10から取得し、学習された、対象装置10の動作に係るデータを記憶している。
The
(制御部110の構成について)
制御部110は、取得部111、基準生成部112、スケール規格化部113、および異常検知部114を含んでいる。
(Regarding the configuration of the control unit 110)
The
取得部111は、通信部101を介して、対象装置10の動作における第1指標に関する第1指標値と、第2指標に関する第2指標値と、を取得する。対象装置10の動作における第1指標の値と、第2指標の値とは、対象装置10の、サーボモータ20、変位センサ11、またはロードセル16が示す、位置、トルク、プレスツール12に加わる負荷(圧入ワーク5bに加わる負荷)等に係る値である。サーボモータ20のトルクからプレスツール12に加わる負荷を推定することもできる。
The
基準生成部112は、取得部111によって対象装置10から取得された、第1指標値と、第2指標値とを収集して、収集した第1指標値と、第2指標値とに対する機械学習の一手法である回帰予測モデルを生成する。基準生成部112は、機械学習の結果から、第1指標と、第2指標とを軸とする2次元平面における基準曲線を設定する。基準曲線は、対象装置10が正常な状態における、第1指標値と第2指標値との関係を表す。異常検知装置100は、外部から基準曲線を示す情報を予め取得してもよい。
The
第1指標に関する第1指標値は、対象装置10の動作の段階に係る値であり、対象装置10がサーボプレス機器である場合には、第1指標値は、例えば、1連のプレス動作における進行度合いを示す値(1連のプレス動作の開始から、終了まで何割工程が進行しているかを示す値、例えばサーボモータ20の位置またはプレスツール12の位置)、または1連のプレス動作の開始からの経過時間である。第2指標に関する第2指標値は、対象装置10の負荷に係る値である。
The first index value related to the first index is a value related to the operation stage of the
なお、第1指標値、および第2指標値は、1連のプレス動作における進行度合いを示す値と、対象装置10の負荷(ロードセルの負荷)に係る値と、に限られるものではなく、サーボモータの位置、トルク、速度、対象装置10に関する測定値等の値を適宜に選択して用いることができる。
Note that the first index value and the second index value are not limited to the value indicating the degree of progress in one series of press operations and the value related to the load of the target device 10 (load cell load), but are Values such as motor position, torque, speed, and measured values regarding the
スケール規格化部113は、第1指標と、第2指標とを軸とする2次元平面における、第1指標のスケールと、第2指標のスケールと、をそれぞれ個別に規格化する。スケール規格化部113は、基準生成部112による第1指標値と、第2指標値との機械学習の結果に基づいて、第1指標のスケールと、第2指標のスケールとを規格化する。当該規格化されたスケールによる2次元平面に対して、基準曲線が設定されてもよい。このように、各指標値を適切に規格化して、異常判定を行うことで、異常判定を適切に行うことができる。
The
図3は、サーボプレス機器である対象装置10から収集された、複数回分のプレス動作における第1指標値、及び第2指標値を示すグラフであり、第1指標(位置)を横軸とし、第2指標(負荷)を縦軸としている。
FIG. 3 is a graph showing the first index value and second index value in multiple press operations collected from the
図4は、図3に示した収集データを用いて、スケール規格化部113によって規格化されたスケールを用いて、基準生成部112によって設定された基準曲線を示したグラフである。図4に示すよう、基準生成部112による機械学習によって設定された基準曲線は、例えば、折れ線グラフである。基準曲線は、スケール規格化部113によって規格化された第1指標に関する第1指標値である対象装置10の動作の段階に係る値(例えば位置)を横軸に、スケール規格化部113によって規格化された第2指標に関する第2指標値である負荷に係る値を縦軸に示している。なお、基準曲線は、例えば、サーボモータの位置と、プレスツールに掛かる負荷との相関図、または、サーボモータの速度と、サーボモータのトルクとの相関図等であってもよい。
FIG. 4 is a graph showing a reference curve set by the
基準曲線は、例えば、以下の(式1)によって示される回帰予測モデルf(x)である折れ線グラフである。yidealは基準曲線上の第2指標値を示す。xnormは規格化された第1指標値を示す。 The reference curve is, for example, a line graph that is a regression prediction model f(x) expressed by (Equation 1) below. y ideal indicates the second index value on the reference curve. x norm indicates a normalized first index value.
![]()
![]()
異常検知部114は、第1指標と、第2指標とを軸とする2次元平面における、第1指標値、及び第2指標値により示される点の、基準曲線からの距離に基づいて、対象装置10の異常を検知する。
The
図5は、第1指標に関する第1指標値と、第2指標に関する第2指標値とに係るパラメータを、回帰予測モデルf(x)による基準曲線上に示した図である。横軸は動作の段階を示す第1指標(x)、縦軸は第2指標(y)である。 FIG. 5 is a diagram showing parameters related to the first index value related to the first index and the second index value related to the second index on a reference curve based on the regression prediction model f(x). The horizontal axis is a first index (x) indicating the stage of operation, and the vertical axis is a second index (y).
スケール規格化部113は、まず、取得部111により取得された、第1指標値の実測値xactと、第2指標値の実測値yactとを、下記の(式2)、(式3)を用いて正規化した、xnormと、ynormとを求める。
The
![]()
![]()
![]()
![]()
ここで、xmin,yminは、それぞれ記憶部120に記憶されている第1指標値、および第2指標値の実測値xact,yactの最小値、または、基準曲線における第1指標値、および第2指標値の最小値の何れであってもよい。また、xmax,ymaxは、それぞれ記憶部120に記憶されている第1指標値、および第2指標値の実測値xact,yactの最大値、または、基準曲線における第1指標値、および第2指標値の最大値の何れであってもよい。規格化は、第1指標のスケールと第2指標のスケールとを一致させるために行われる。
Here, x min and y min are the minimum values of the actual measured values x act and y act of the first index value and second index value stored in the
続いて、異常検知部114は、正規化した第1指標値xnormに対するyidealを(式1)を用いて求める。異常検知部114は、正規化した第2指標値ynormに対するxidealを下記の(式4)を用いて求める。xidealは基準曲線上の第1指標値を示す。g(y)はf(x)の逆関数である。yidealは、対象装置10が正常である場合における第1指標値がxnormであるときの第2指標値(第2指標の理想値)を示す。xidealは、対象装置10が正常である場合における第2指標値がynormであるときの第1指標値(第1指標の理想値)を示す。
Subsequently, the
![]()
![]()
次に、異常検知部114は、正規化した第1指標値xnorm、第2指標値ynormの、それぞれの理想値xideal,yidealからの偏差であるΔxと、Δyとを以下の(式5)、(式6)を用いて求める。
Next, the
![]()
![]()
![]()
![]()
異常検知部114は、第1指標値、第2指標値の、理想値xideal,yidealからの偏差Δx,Δyを用いて、以下の(式7)により、第1指標値、第2指標値により示される点の、基準曲線からの距離Δhを算出する。
The
![]()
![]()
なお、例えば、Δyが所定の値ε以下の場合、または|Δy|が所定の値ε以下の場合、Δh=0として基準曲線からの誤差を無視してもよい。 Note that, for example, when Δy is less than or equal to a predetermined value ε, or when |Δy| is less than or equal to a predetermined value ε, the error from the reference curve may be ignored by setting Δh=0.
このように、異常検知部114は、第1指標と、第2指標とを軸とする2次元平面おける、第1指標値、及び第2指標値により示される点の、予め設定された基準曲線からの距離Δhに基づいて、対象装置10の異常を検知する。これにより、基準曲線において急峻に傾きが変わるような工程位置であっても、異常検知装置100は、適切に異常検知を行うことができ、異常が生じていないにも関わらず異常であると判定されるのを抑制することができる。
In this way, the
図6は、逆回帰予測モデルg(y)による基準曲線を示すグラフである。縦軸は動作の段階を示す第1指標(x)、横軸は第2指標(y)である。図6に示す様に、基準曲線は、回帰予測モデルf(x)によって示される構成に限らず、逆回帰予測モデルg(y)によって示される構成であってもよい。基準曲線が逆回帰予測モデルg(y)で示される場合であっても、異常検知部114は、(式2)~(式8)を用いた上述の方法によって、第1指標値、第2指標値により示される点の、基準曲線からの距離Δhを算出することができる。
FIG. 6 is a graph showing a reference curve based on the inverse regression prediction model g(y). The vertical axis is a first index (x) indicating the stage of operation, and the horizontal axis is a second index (y). As shown in FIG. 6, the reference curve is not limited to the configuration shown by the regression prediction model f(x), but may be the configuration shown by the inverse regression prediction model g(y). Even when the reference curve is represented by the inverse regression prediction model g(y), the
図7は、距離Δhの時間変化を示す図である。横軸は時間(第1指標)、縦軸は距離Δhである。図7に示すように、異常検知部114は、第2指標値(負荷)が基準曲線に対して大きい側である場合には、距離Δhに正の符号を付す。また、異常検知部114は、第2指標値が基準曲線に対して小さい側である場合には、距離Δhに負の符号を付す。このように、異常検知部114は、第2指標値が、基準曲線に対して大きい側であるか、小さい側であるかに応じて、距離Δhに付す符号の正負を切り替える。異常検知部114は、正負の符号が付された距離Δhが予め設定された正常範囲(正常範囲)内であるか否かに基づいて、対象装置10に異常が生じているか否かを判定する。なお、異常検知部114は、正負を区別せずに距離Δhの絶対値に基づいて異常の判定を行ってもよい。
FIG. 7 is a diagram showing changes in distance Δh over time. The horizontal axis is time (first index), and the vertical axis is distance Δh. As shown in FIG. 7, the
ところで、対象装置10の種類によっては、例えば、第2指標値(負荷)が、基準曲線に対して大きい側である場合には、第2指標値が、基準曲線に対して小さい側である場合よりも、異常の可能性が高いことが考えられ得る。このため、異常検知部114は、距離Δhに付された正負の符号に応じて、対象装置10に異常が生じているか否かを判断するために用いる距離Δhの閾値を異ならせてもよい。すなわち、Δhに関する正常範囲の境界を示す正側の閾値と負側の閾値の絶対値とは異なっていてもよい。
By the way, depending on the type of the
このように、異常検知部114は、第1指標値、第2指標値により示される点の、基準曲線からの距離Δhの絶対値ではなく、第2指標値が基準曲線より負荷が大きい側であるか、負荷が小さい側であるかに応じて、正負の符号付した距離Δhに応じて、適切な閾値を選択して、対象装置10に異常が生じているか否かを判断することができる。よって、異常検知部114の構成により、対象装置10に異常が生じていないにも関わらず、異常が生じていると誤判断されるのを抑制することができ、異常判定を適切に行うことができる。
In this way, the
(異常検知装置の処理の流れについて)
図8は、異常検知装置100による基準曲線生成処理の流れを示すフローチャートである。
(About the processing flow of the abnormality detection device)
FIG. 8 is a flowchart showing the flow of the reference curve generation process by the
基準曲線生成処理において、異常検知装置100の制御部110は、まず、取得部111の機能により、第1指標に関する第1指標値と、第2指標に関する第2指標値と、を通信部101を介して、正常状態の対象装置10から取得する(ステップS1)。
In the reference curve generation process, the
制御部110は、取得部111の機能により取得した、第1指標に関する第1指標値と、第2指標に関する第2指標値と、を記憶部120に記憶する(ステップS2)。
The
制御部110は、対象装置10による圧入工程、および加締め工程等の一連の加工動作が終了したか否かを判定する(ステップS3)。制御部110は、対象装置10による一連の加工動作が終了したと判定すると(ステップS3でYES)、ステップS4に進む。制御部110は、対象装置10による一連の加工動作が終了していないと判定すると(ステップS3でNO)、ステップS1に戻り、第1指標に関する第1指標値と、第2指標に関する第2指標値との収集を継続する。
The
制御部110は、基準生成部112の機能により、記憶部120に記憶された、対象装置10による一連の加工動作に係る第1指標に関する第1指標値と、第2指標に関する第2指標値とについて、機械学習を行い、回帰モデルを生成する(ステップS4)。
The
制御部110は、基準生成部112による機械学習の結果を参照して、スケール規格化部113の機能により、第1指標と、第2指標とのスケールを規格化する。基準生成部112は、スケール規格化部113によって規格化されたスケールと、機械学習の結果とに基づいて、対象装置10による一連(動作開始から動作完了までの1ストローク)の加工動作に関する基準曲線(規格化された基準曲線)を設定する(ステップS5)。
The
制御部110は、設定された基準曲線を記憶部120に記憶させる。また、制御部110は、Δhに関する正常範囲を予め設定し、記憶部120に記憶させる。正常範囲は、ユーザによって入力されてもよい。
The
異常検知装置100は、ステップS5にて設定された基準曲線を参照して、異常検知部114の機能により、対象装置10による加工動作を監視し、対象装置10による加工動作に異常が生じた際に、それを検知する。
The
図9は、異常検知装置100による異常検知処理の流れを示すフローチャートである。
FIG. 9 is a flowchart showing the flow of abnormality detection processing by the
異常検知装置100は、対象装置10の加工動作中において、一連の動作の開始タイミングで、異常検知フラグ(Flag)を初期化(Flag=0)する(ステップS11)。
The
対象装置10の動作中、異常検知装置100の制御部110は、取得部111の機能により、通信部101を介して、対象装置10から、第1指標に関する第1指標値と、第2指標に関する第2指標値と、を取得する(ステップS12)。
During operation of the
制御部110は、スケール規格化部113の機能により、取得部111によって取得した第1指標値と、第2指標値とのそれぞれを、上述した(式2)、(式3)を用いて正規化する(ステップS13)。ここで、制御部110のスケール規格化部113は、規格化前の基準曲線における最大値、および最小値を用いて、第1指標値と、第2指標値とのそれぞれを、正規化する。
The
制御部110は、異常検知部114の機能により、上述した(式5)、(式6)を用いて、正規化した第1指標の指標値xnormの理想値xidealからの偏差Δxと、正規化した第2指標の指標値ynormの理想値yidealからの偏差Δyとを算出する(ステップS14)。
The
異常検知部114は、第1指標値の偏差Δxと、第2指標値の偏差Δyと、を用いて、上記の(式7)により、2次元平面における第1指標値、および第2指標値により示される点の、基準曲線からの距離Δhを算出する(ステップS15)。
The
制御部110は、距離Δhを記憶部120に記憶する。
The
続いて、制御部110は、異常検知部114の機能により、距離Δhが正負に応じた所定の正常範囲以内であるか否かを判定する(ステップS16)。制御部110は、異常検知部114によって距離Δhが正常範囲以内であると判定されると(ステップS16でYES)、ステップS18に進む。制御部110は、異常検知部114によって距離Δhが正常範囲外であると判定されると(ステップS16でNO)、ステップS17に進む。
Subsequently, the
制御部110は、距離Δhが正常範囲外である場合には、対象装置10に異常が生じていることを検知し、異常検知フラグ(Flag)をカウントアップ(Flag=Flag+1)し、ステップS18に進む(ステップS17)。Flagは、距離Δhが正常範囲外となった積算期間(積算区間)を表す。
If the distance Δh is outside the normal range, the
制御部110は、ステップS16において、距離Δhが正常範囲以内であると判定した場合には、対象装置10による一連の動作全体が終了したか否かを判定する(ステップS18)。制御部110は、例えば、第1指標の指標値、および第2指標の指標値と、基準曲線と、を参照して、対象装置10による一連の動作全体が終了したか否かを判定してもよい。また、制御部110は、例えば、対象装置10から取得部111を介して、一連の動作全体が終了したか否かの情報を取得してもよい。
When the
制御部110は、対象装置10による一連の動作全体が終了したと判定すると(ステップS18でYES)、ステップS19に進む。制御部110は、対象装置10による一連の動作全体が終了していないと判定すると(ステップS18でNO)、ステップS12に戻り、処理を継続する。これにより、制御部110は、対象装置10の一連の動作中、例えば、所定時間間隔毎に、通信部101を介して、対象装置10から、第1指標に関する第1指標値と、第2指標に関する第2指標値と、の取得を継続して行う。
When the
制御部110は、対象装置10による一連の動作全体が終了すると、異常検知部114の機能により、一連の動作全体におけるΔhの特徴量を算出する(ステップS19)。異常検知部114は、対象装置10による一連の動作中に算出した距離Δhの平均、分散または標準偏差を、特徴量として算出してもよい。また、異常検知部114は、対象装置10による一連の加工動作中に算出した距離Δhの度数分布における特徴量を算出してもよい。ここで、対象装置10の加工動作中の距離Δhの度数分布は、加工動作中の距離Δhをビンとしたヒストグラムであってもよく、異常検知部114は、加工動作中の距離Δhの度数分布における特徴量として、ヒストグラムにおける尖度、または歪度を算出してもよい。
When the entire series of operations by the
制御部110は、異常検知部114の機能により、対象装置10による一連の動作中の距離Δhの特徴量に基づいて、対象装置10の一連の動作全体において異常が生じていなかったどうかを判定する(ステップS20)。
The
異常検知部114は、例えば、距離Δhをビンとしたヒストグラムにおける尖度が所定の閾値よりも小さければ、対象装置10の一連の動作全体において異常が生じていると判定してもよい。また、異常検知部114は、距離Δhをビンとしたヒストグラムの歪み度が所定の閾値よりも大きければ、対象装置10の一連の動作全体において異常が生じていると判定してもよい。また、異常検知部114は、距離Δhの平均、分散または標準偏差が、所定の閾値よりも大きければ、対象装置10の一連の動作全体において異常が生じていると判定してもよい。
For example, the
また、異常検知部114は、距離Δhの特徴量と異常検知フラグのカウント量とに基づいて、対象装置10の一連の動作全体において異常が生じていなかったどうかを判定してもよい。異常検知部114は、距離Δhの特徴量からは対象装置10の異常が疑われる場合であっても、異常検知フラグのカウント量(Flag)が初期値(0)のままであれば、対象装置10の一連の動作には異常が生じていないと判定してもよい。また、異常検知部114は、距離Δhの特徴量からは対象装置10に異常が生じているとは判定されない場合であっても、異常検知フラグのカウント量(Flag)が所定値より大きければ、対象装置10の一連の動作に異常が生じていると判定してもよい。
Furthermore, the
図10~図13は、対象装置10において一連の動作を複数回行った際に収集した第1指標に関する第1指標値と、第2指標に関する第2指標値とに応じた、グラフを示す図である。
10 to 13 are diagrams showing graphs according to the first index value regarding the first index and the second index value regarding the second index collected when the
図10のグラフ61a、62a、63aは、第1指標値(横軸)と、第2指標値(縦軸)とによって対象装置10の動作の過程を示したモーションプロファイルである。図10のグラフ61b、62b、63bのそれぞれは、グラフ61a、62a、63aの第1指標値と、第2指標値とをそれぞれ正規化したグラフである。図10、および図11のグラフ61c、62c、63cのそれぞれは、グラフ61b、62b、63bにそれぞれ示した正規化した第1指標値と、第2指標値とが示す点の、基準曲線からの距離Δhの分布を示すグラフ(横軸は第1指標)である。図11のグラフ61d、62d、63dのそれぞれは、グラフ61c、62c、63cにそれぞれ示した距離Δhをビンとしたヒストグラム(縦軸は距離Δh、横軸は度数)である。
Graphs 61a, 62a, and 63a in FIG. 10 are motion profiles showing the process of operation of the
図10、図11のグラフ61a、61b、61c、61dに示した例は、対象装置10の動作に対して、距離Δhによる異常の判定を行った結果も、距離Δhの度数分布における特徴量による異常の判定を行った結果も、異常ではないと判定される場合を示している。グラフ61c、61dに示すように、距離Δhの度数分布における標準偏差が所定の範囲内である場合、および、距離Δhをビンとしたヒストグラムの尖度、および歪度が所定の範囲内である場合には、異常検知部114は、対象装置10による動作における異常を検知しない(異常はないと判定する)。
In the examples shown in graphs 61a, 61b, 61c, and 61d in FIGS. 10 and 11, the result of determining abnormality based on the distance Δh for the operation of the
図10、図11のグラフ62a、62b、62c、62dに示した例は、対象装置10の動作の過程において、距離Δhが、負側の閾値の範囲外となるときがあった場合を示している。グラフ62c、62dに示すように、距離Δhが、負側の閾値の範囲外となるときがある場合であっても、距離Δhの度数分布における標準偏差は所定の範囲内となることがある。このような場合であっても、異常検知部114は、距離Δhをビンとしたヒストグラムの尖度、または歪度が所定の範囲内であるか否かに基づいて、対象装置10による動作における異常を検知することができる。
The examples shown in the graphs 62a, 62b, 62c, and 62d in FIGS. 10 and 11 show cases in which the distance Δh sometimes falls outside the range of the negative threshold value during the operation process of the
なお、異常検知部114は、距離Δhが、負側の閾値の範囲外となったことを検知した時点で、対象装置10の異常を検知する構成であってもよいし、一連の動作全体における距離Δhの度数分布における標準偏差、および距離Δhをビンとしたヒストグラムの尖度、または歪度に基づいて、対象装置10の異常を検知する構成であってもよい。
The
図10、図11のグラフ63a、63b、63c、63dに示した例は、対象装置10の動作の過程において、距離Δhが、正側および負側の閾値の範囲外となるときがあった場合を示している。グラフ63c、63dに示すように、距離Δhが、正側および負側の閾値の範囲外となった場合であっても、距離Δhの度数分布における標準偏差が所定の範内となることがある。このような場合であっても、異常検知部114は、距離Δhをビンとしたヒストグラムの尖度、または歪度が所定の範囲内であるか否かに基づいて、対象装置10による動作における異常を検知することができる。
The examples shown in the graphs 63a, 63b, 63c, and 63d in FIGS. 10 and 11 are cases in which the distance Δh sometimes falls outside the range of the positive and negative thresholds during the operation of the
図12は、異常が生じている対象装置10における、距離Δhのヒストグラム(縦軸は距離Δh、横軸は度数)の例を示す。図12に示す例では、距離Δhの度数分布における平均が0を大きく下回っている(平均が負側の閾値未満である)。異常検知部114は、距離Δhの度数分布における平均等の統計値が正常範囲であるか否かに応じて、対象装置10の異常を検知してもよい。
FIG. 12 shows an example of a histogram of distance Δh (vertical axis is distance Δh, horizontal axis is frequency) in the
図13は、異常が生じている対象装置10における、距離Δhのヒストグラム(縦軸は距離Δh、横軸は度数)の別の例を示す。図13に示す例では、距離Δhの度数分布における標準偏差が閾値より大きい。異常検知部114は、距離Δhの度数分布における標準偏差等の統計値が正常範囲であるか否かに応じて、対象装置10の異常を検知してもよい。
FIG. 13 shows another example of a histogram of distance Δh (vertical axis is distance Δh, horizontal axis is frequency) in the
(対象装置10の他の例)
上記の説明では、対象装置10がサーボモータを動力源として駆動するプレス機器である場合を例に挙げた。しかしながら、対象装置10はプレス機器に限らず、サーボモータを動力源として駆動するいかなる装置であっても、異常検知装置100により適切に異常を検知することができる。また、異常検知装置100による異常検知処理は、サーボモータに限らず、ステッピングモータや、その他の単なるモータを動力源として駆動する装置にも適用可能である。更に、異常検知装置100による異常検知処理は、モータに限らず、油圧、空気圧等の一般的なアクチュエータを動力源として駆動する装置にも適用可能である。
(Other examples of target device 10)
In the above description, an example is given in which the
図14は、対象装置10がプレス機器ではない装置である場合の第1指標に関する第1指標値と、第2指標に関する第2指標値と、基準曲線とを示す図である。図14の上のグラフは、横軸を時間として、対象装置10の一連の動作における第1指標に関する第1指標値であるサーボモータの回転速度と、第2指標に関する第2指標値であるサーボモータのトルクとの実測値xact,yactを示す図である。図14の下のグラフは、第1の指標をx軸とし、第2の指標をy軸とした2次元平面に、正規化した第1指標値xnorm、第2指標値ynormと、基準曲線とを示したグラフである。
FIG. 14 is a diagram showing a first index value related to the first index, a second index value related to the second index, and a reference curve when the
このように、対象装置10がサーボモータを動力源として駆動するいかなる装置であっても、第1の指標をx軸とし、第2の指標をy軸とした2次元平面上における、正規化した第1指標値xnorm、第2指標値ynormから示される点と、基準曲線との距離Δhに基づいて、異常を検知することができる。
In this way, no matter what device the
〔ソフトウェアによる実現例〕
異常検知装置100の制御ブロック(特に取得部111、基準生成部112、スケール規格化部113、および異常検知部114)は、集積回路(ICチップ)等に形成された論理回路(ハードウェア)によって実現してもよいし、ソフトウェアによって実現してもよい。
[Example of implementation using software]
The control blocks of the anomaly detection device 100 (particularly the
後者の場合、異常検知装置100は、各機能を実現するソフトウェアであるプログラムの命令を実行するコンピュータを備えている。このコンピュータは、例えば1つ以上のプロセッサを備えていると共に、前記プログラムを記憶したコンピュータ読み取り可能な記録媒体を備えている。そして、前記コンピュータにおいて、前記プロセッサが前記プログラムを前記記録媒体から読み取って実行することにより、本発明の目的が達成される。前記プロセッサとしては、例えばCPU(Central Processing Unit)を用いることができる。前記記録媒体としては、「一時的でない有形の媒体」、例えば、ROM(Read Only Memory)等の他、テープ、ディスク、カード、半導体メモリ、プログラマブルな論理回路などを用いることができる。また、前記プログラムを展開するRAM(Random Access Memory)などをさらに備えていてもよい。また、前記プログラムは、該プログラムを伝送可能な任意の伝送媒体(通信ネットワークや放送波等)を介して前記コンピュータに供給されてもよい。なお、本発明の一態様は、前記プログラムが電子的な伝送によって具現化された、搬送波に埋め込まれたデータ信号の形態でも実現され得る。
In the latter case, the
本発明は上述した各実施形態に限定されるものではなく、請求項に示した範囲で種々の変更が可能であり、異なる実施形態にそれぞれ開示された技術的手段を適宜組み合わせて得られる実施形態についても本発明の技術的範囲に含まれる。 The present invention is not limited to the embodiments described above, and various modifications can be made within the scope of the claims, and embodiments obtained by appropriately combining technical means disclosed in different embodiments. are also included within the technical scope of the present invention.
10 対象装置
20 サーボモータ
100 異常検知装置
110 制御部
111 取得部
112 基準生成部
113 スケール規格化部
114 異常検知部
120 記憶部
10
Claims (12)
前記対象装置の動作における第1指標に関する第1指標値と、第2指標に関する第2指標値と、を取得する取得部と、
前記第1指標と、前記第2指標とを軸とする2次元平面における、前記第1指標値、及び前記第2指標値により示される点の、予め設定された基準曲線からの距離、および前記点が前記第2指標において前記基準曲線に対して大きい側であるか、小さい側であるかに基づいて、前記対象装置の異常を検知する異常検知部と、
を備えた異常検知装置。 An abnormality detection device that detects an abnormality in a target device,
an acquisition unit that acquires a first index value regarding a first index and a second index value regarding a second index in the operation of the target device;
a distance from a preset reference curve of a point indicated by the first index value and the second index value in a two-dimensional plane having the first index and the second index as axes, and an abnormality detection unit that detects an abnormality in the target device based on whether the point is on the larger side or smaller side with respect to the reference curve in the second index;
Anomaly detection device equipped with
前記対象装置の動作における第1指標に関する第1指標値と、第2指標に関する第2指標値と、を取得する取得部と、
前記第1指標と、前記第2指標とを軸とする2次元平面における、前記第1指標値、及び前記第2指標値により示される点の、予め設定された基準曲線からの距離に基づいて、前記対象装置の異常を検知する異常検知部と、
を備え、
前記異常検知部は、
前記対象装置の加工動作中の前記距離の度数分布における特徴量に基づいて、前記対象装置の異常を検知する異常検知装置。 An abnormality detection device that detects an abnormality in a target device,
an acquisition unit that acquires a first index value regarding a first index and a second index value regarding a second index in the operation of the target device;
Based on the distance from a preset reference curve of a point indicated by the first index value and the second index value in a two-dimensional plane having the first index and the second index as axes. an abnormality detection unit that detects an abnormality in the target device;
Equipped with
The abnormality detection section is
An abnormality detection device that detects an abnormality in the target device based on a feature amount in the frequency distribution of the distance during a machining operation of the target device.
前記第2指標値は、前記対象装置の動作の負荷に係る値である請求項1または2に記載の異常検知装置。 The first index value is a value related to a stage of operation of the target device,
The abnormality detection device according to claim 1 or 2 , wherein the second index value is a value related to an operation load of the target device.
前記第2指標値が、前記基準曲線に対して負荷が大きい側であるか、負荷が小さい側であるかに応じて、前記距離に付す符号の正負を切り替え、正負が付された前記距離に基づいて前記対象装置の異常を検知する請求項3または4に記載の異常検知装置。 The abnormality detection unit is
Depending on whether the second index value is on the side where the load is large or the side where the load is small with respect to the reference curve, the sign attached to the distance is switched between positive and negative, and the sign attached to the distance is The abnormality detection device according to claim 3 or 4 , wherein the abnormality detection device detects an abnormality in the target device based on the above.
前記距離に付された正負に応じて、前記対象装置の異常の有無に関する判断に用いる閾値であって、前記基準曲線からの距離の閾値を変更する請求項5に記載の異常検知装置。 The abnormality detection unit is
6. The abnormality detection device according to claim 5 , wherein a threshold value for a distance from the reference curve, which is a threshold value used for determining whether or not there is an abnormality in the target device, is changed depending on whether the distance is positive or negative.
前記対象装置の加工動作中の前記距離の標準偏差に基づいて、前記対象装置の異常を検知する請求項1および3から6のいずれか1項に記載の異常検知装置。 The abnormality detection unit is
The abnormality detection device according to any one of claims 1 and 3 to 6 , wherein an abnormality in the target device is detected based on a standard deviation of the distance during a machining operation of the target device.
対象装置の動作における第1指標に関する第1指標値と、第2指標に関する第2指標値と、を取得する指標値取得ステップと、
前記第1指標と、前記第2指標とを軸とする2次元平面における、前記第1指標値、及び前記第2指標値により示される点の、予め設定された基準曲線からの距離、および前記点が前記第2指標において前記基準曲線に対して大きい側であるか、小さい側であるかに基づいて、前記対象装置の異常を検知する異常検知ステップと、を含む異常検知方法。 An anomaly detection method executed in an anomaly detection device that detects an anomaly in a target device, the method comprising:
an index value acquisition step of acquiring a first index value regarding a first index and a second index value regarding a second index in the operation of the target device;
a distance from a preset reference curve of a point indicated by the first index value and the second index value in a two-dimensional plane having the first index and the second index as axes, and An abnormality detection method, comprising: detecting an abnormality in the target device based on whether the point is on the larger side or smaller side with respect to the reference curve in the second index .
対象装置の動作における第1指標に関する第1指標値と、第2指標に関する第2指標値と、を取得する指標値取得ステップと、
前記第1指標と、前記第2指標とを軸とする2次元平面における、前記第1指標値、及び前記第2指標値により示される点の、予め設定された基準曲線からの距離に基づいて、前記対象装置の異常を検知する異常検知ステップと、を含み、
前記異常検知ステップは、前記対象装置の加工動作中の前記距離の度数分布における特徴量に基づいて、前記対象装置の異常を検知する異常検知方法。 An anomaly detection method executed in an anomaly detection device that detects an anomaly in a target device, the method comprising:
an index value acquisition step of acquiring a first index value regarding a first index and a second index value regarding a second index in the operation of the target device;
Based on the distance from a preset reference curve of a point indicated by the first index value and the second index value in a two-dimensional plane having the first index and the second index as axes. and an abnormality detection step of detecting an abnormality in the target device ,
The abnormality detection step is an abnormality detection method for detecting an abnormality in the target device based on a feature amount in the frequency distribution of the distance during a machining operation of the target device.
Priority Applications (5)
| Application Number | Priority Date | Filing Date | Title |
|---|---|---|---|
| JP2019135695A JP7367366B2 (en) | 2019-07-23 | 2019-07-23 | Anomaly detection device, anomaly detection method, and anomaly detection program |
| PCT/JP2020/008498 WO2021014670A1 (en) | 2019-07-23 | 2020-02-28 | Abnormality detecting device, abnormality detecting method, and abnormality detecting program |
| CN202080041120.XA CN113924207B (en) | 2019-07-23 | 2020-02-28 | Abnormality detection device, abnormality detection method, and storage medium |
| EP20844882.9A EP4005785A4 (en) | 2019-07-23 | 2020-02-28 | Abnormality detecting device, abnormality detecting method, and abnormality detecting program |
| US17/621,685 US20220357732A1 (en) | 2019-07-23 | 2020-02-28 | Abnormality detecting device, abnormality detecting method, and storage medium |
Applications Claiming Priority (1)
| Application Number | Priority Date | Filing Date | Title |
|---|---|---|---|
| JP2019135695A JP7367366B2 (en) | 2019-07-23 | 2019-07-23 | Anomaly detection device, anomaly detection method, and anomaly detection program |
Publications (2)
| Publication Number | Publication Date |
|---|---|
| JP2021018753A JP2021018753A (en) | 2021-02-15 |
| JP7367366B2 true JP7367366B2 (en) | 2023-10-24 |
Family
ID=74192721
Family Applications (1)
| Application Number | Title | Priority Date | Filing Date |
|---|---|---|---|
| JP2019135695A Active JP7367366B2 (en) | 2019-07-23 | 2019-07-23 | Anomaly detection device, anomaly detection method, and anomaly detection program |
Country Status (5)
| Country | Link |
|---|---|
| US (1) | US20220357732A1 (en) |
| EP (1) | EP4005785A4 (en) |
| JP (1) | JP7367366B2 (en) |
| CN (1) | CN113924207B (en) |
| WO (1) | WO2021014670A1 (en) |
Families Citing this family (2)
| Publication number | Priority date | Publication date | Assignee | Title |
|---|---|---|---|---|
| JP7347468B2 (en) * | 2021-03-26 | 2023-09-20 | 横河電機株式会社 | Apparatus, method and program |
| US20230280218A1 (en) * | 2022-03-01 | 2023-09-07 | Asmpt Singapore Pte. Ltd. | Force measurement device and method for bonding or encapsulation process and apparatus incorporating the device |
Citations (6)
| Publication number | Priority date | Publication date | Assignee | Title |
|---|---|---|---|---|
| JP2006158031A (en) | 2004-11-26 | 2006-06-15 | Yaskawa Electric Corp | Motor controller and control method for the same |
| JP2016091417A (en) | 2014-11-07 | 2016-05-23 | 株式会社Ihi | Abnormality diagnostic method, abnormality diagnostic apparatus and abnormality diagnostic program |
| US20160239015A1 (en) | 2015-02-16 | 2016-08-18 | Siemens Aktiengesellschaft | Diagnostic Device And Method For Monitoring The Operation Of A Control Loop |
| JP2016209885A (en) | 2015-04-30 | 2016-12-15 | コマツ産機株式会社 | Press system and method for controlling press system |
| JP2019003389A (en) | 2017-06-15 | 2019-01-10 | 株式会社 日立産業制御ソリューションズ | Abnormality diagnosis device, abnormality diagnosis method and abnormality diagnosis program |
| JP2019104039A (en) | 2017-12-14 | 2019-06-27 | 蛇の目ミシン工業株式会社 | Electrically-driven press, and load determination method and program |
Family Cites Families (4)
| Publication number | Priority date | Publication date | Assignee | Title |
|---|---|---|---|---|
| US5119311A (en) * | 1988-07-14 | 1992-06-02 | Coors Brewing Company | Monitor and control assembly for use with a can end press |
| JP3231536B2 (en) * | 1993-02-25 | 2001-11-26 | トヨタ自動車株式会社 | Diagnosis method of press machine abnormality |
| PL2696754T3 (en) * | 2011-04-14 | 2015-03-31 | Koninklijke Philips Nv | Stress-measuring device and method |
| JP6593715B2 (en) * | 2017-10-27 | 2019-10-23 | 株式会社安川電機 | Abnormality judgment system, motor control device |
-
2019
- 2019-07-23 JP JP2019135695A patent/JP7367366B2/en active Active
-
2020
- 2020-02-28 WO PCT/JP2020/008498 patent/WO2021014670A1/en unknown
- 2020-02-28 CN CN202080041120.XA patent/CN113924207B/en active Active
- 2020-02-28 US US17/621,685 patent/US20220357732A1/en active Pending
- 2020-02-28 EP EP20844882.9A patent/EP4005785A4/en active Pending
Patent Citations (6)
| Publication number | Priority date | Publication date | Assignee | Title |
|---|---|---|---|---|
| JP2006158031A (en) | 2004-11-26 | 2006-06-15 | Yaskawa Electric Corp | Motor controller and control method for the same |
| JP2016091417A (en) | 2014-11-07 | 2016-05-23 | 株式会社Ihi | Abnormality diagnostic method, abnormality diagnostic apparatus and abnormality diagnostic program |
| US20160239015A1 (en) | 2015-02-16 | 2016-08-18 | Siemens Aktiengesellschaft | Diagnostic Device And Method For Monitoring The Operation Of A Control Loop |
| JP2016209885A (en) | 2015-04-30 | 2016-12-15 | コマツ産機株式会社 | Press system and method for controlling press system |
| JP2019003389A (en) | 2017-06-15 | 2019-01-10 | 株式会社 日立産業制御ソリューションズ | Abnormality diagnosis device, abnormality diagnosis method and abnormality diagnosis program |
| JP2019104039A (en) | 2017-12-14 | 2019-06-27 | 蛇の目ミシン工業株式会社 | Electrically-driven press, and load determination method and program |
Also Published As
| Publication number | Publication date |
|---|---|
| US20220357732A1 (en) | 2022-11-10 |
| JP2021018753A (en) | 2021-02-15 |
| EP4005785A4 (en) | 2023-07-26 |
| EP4005785A1 (en) | 2022-06-01 |
| CN113924207B (en) | 2024-04-05 |
| CN113924207A (en) | 2022-01-11 |
| WO2021014670A1 (en) | 2021-01-28 |
Similar Documents
| Publication | Publication Date | Title |
|---|---|---|
| CN108500736B (en) | Tool state estimation device and machine tool | |
| US11614728B2 (en) | Machine tool management system that obtains a next maintenance period from a maintenance period model and a refinement algorithm | |
| US10525563B2 (en) | Abnormality-detecting device and method for tool of machine tool | |
| JP7367366B2 (en) | Anomaly detection device, anomaly detection method, and anomaly detection program | |
| US10725465B2 (en) | State diagnostic device | |
| Wang et al. | Sensor fusion for online tool condition monitoring in milling | |
| WO2017111072A1 (en) | Diagnostic device, computer program, and diagnostic system | |
| EP3394693A1 (en) | Diagnostic device, computer program, and diagnostic system | |
| JP2008097363A (en) | Abnormality diagnosis method and device thereof | |
| Choi et al. | Prediction of drill failure using features extraction in time and frequency domains of feed motor current | |
| Tiwari et al. | Tool wear prediction in end milling of Ti-6Al-4V through Kalman filter based fusion of texture features and cutting forces | |
| CN109960232B (en) | Method for selecting leading auxiliary parameter and method for equipment maintenance pre-diagnosis | |
| JP6629672B2 (en) | Processing equipment | |
| WO2020152741A1 (en) | Abnormality cause estimation device, abnormality cause estimation method, and program | |
| Kannan et al. | Multi-sensor data analytics for grinding wheel redress life estimation-an approach towards Industry 4.0 | |
| CN108475047B (en) | Method and control for monitoring a machine tool | |
| JP7134062B2 (en) | Machine tool abnormality diagnosis system, abnormality diagnosis method, abnormality diagnosis program | |
| JP3566014B2 (en) | Processing equipment | |
| CN109643113B (en) | Fault diagnosis device and fault diagnosis method | |
| JP7361573B2 (en) | Abnormality diagnosis method and abnormality diagnosis device for feed shaft device | |
| CN112987682A (en) | Control method, control device and mechanical equipment | |
| US20230305520A1 (en) | Tool diagnostic device and tool diagnostic method | |
| WO2022019249A1 (en) | Abnormality detection device | |
| JP6915763B1 (en) | Abnormality diagnosis system and abnormality diagnosis method | |
| Hill et al. | CNC spindle signal investigation for the prediction of cutting tool health |
Legal Events
| Date | Code | Title | Description |
|---|---|---|---|
| A621 | Written request for application examination |
Free format text: JAPANESE INTERMEDIATE CODE: A621 Effective date: 20220513 |
|
| A131 | Notification of reasons for refusal |
Free format text: JAPANESE INTERMEDIATE CODE: A131 Effective date: 20230411 |
|
| A521 | Request for written amendment filed |
Free format text: JAPANESE INTERMEDIATE CODE: A523 Effective date: 20230522 |
|
| TRDD | Decision of grant or rejection written | ||
| A01 | Written decision to grant a patent or to grant a registration (utility model) |
Free format text: JAPANESE INTERMEDIATE CODE: A01 Effective date: 20230912 |
|
| A61 | First payment of annual fees (during grant procedure) |
Free format text: JAPANESE INTERMEDIATE CODE: A61 Effective date: 20230925 |
|
| R150 | Certificate of patent or registration of utility model |
Ref document number: 7367366 Country of ref document: JP Free format text: JAPANESE INTERMEDIATE CODE: R150 |