JP7106304B2 - Image processing device, image processing method and program - Google Patents
Image processing device, image processing method and program Download PDFInfo
- Publication number
- JP7106304B2 JP7106304B2 JP2018044560A JP2018044560A JP7106304B2 JP 7106304 B2 JP7106304 B2 JP 7106304B2 JP 2018044560 A JP2018044560 A JP 2018044560A JP 2018044560 A JP2018044560 A JP 2018044560A JP 7106304 B2 JP7106304 B2 JP 7106304B2
- Authority
- JP
- Japan
- Prior art keywords
- image
- analysis
- region
- motion contrast
- display
- Prior art date
- Legal status (The legal status is an assumption and is not a legal conclusion. Google has not performed a legal analysis and makes no representation as to the accuracy of the status listed.)
- Active
Links
Images


Description
開示の技術は、画像処理装置、画像処理方法及びプログラムに関する。 The technology disclosed herein relates to an image processing device, an image processing method, and a program.
光干渉断層計(OCT;Optical Coherence Tomography)などの眼部の断層画像撮影装置を用いると、網膜層内部の状態を3次元的に観察できる。この断層画像撮影装置は、疾病の診断をより的確に行うのに有用であることから眼科診療に広く用いられている。OCTの形態として、例えば広帯域な光源とマイケルソン干渉計を組み合わせたTD-OCT(Time domain OCT)がある。これは、参照ミラーの位置を一定速度で移動させて信号アームで取得した後方散乱光との干渉光を計測し、深さ方向の反射光強度分布を得るように構成されている。しかし、このようなTD-OCTでは機械的な走査が必要となるため高速な画像取得は難しい。そこで、より高速な画像取得法として広帯域光源を用い、分光器で干渉信号を取得するSD-OCT(Spectral domain OCT)や高速波長掃引光源を用いることで時間的に分光するSS-OCT(Swept Source OCT)が開発され、より広画角な断層画像を取得できるようになっている。 By using an eye tomography apparatus such as an optical coherence tomography (OCT), it is possible to three-dimensionally observe the state inside the retinal layers. This tomography apparatus is widely used in ophthalmology because it is useful for more accurately diagnosing diseases. As a form of OCT, for example, there is TD-OCT (Time domain OCT) in which a broadband light source and a Michelson interferometer are combined. This is configured to move the position of the reference mirror at a constant speed, measure the interference light with the backscattered light acquired by the signal arm, and obtain the reflected light intensity distribution in the depth direction. However, since such TD-OCT requires mechanical scanning, high-speed image acquisition is difficult. Therefore, as a faster image acquisition method, a broadband light source is used, and SD-OCT (Spectral domain OCT), which acquires interference signals with a spectrometer, or SS-OCT (Swept Source, OCT) has been developed, and it is now possible to acquire a tomographic image with a wider angle of view.
一方、眼科診療では眼底血管の病態を把握するためにこれまで侵襲的な蛍光眼底造影検査が行われてきた。近年は、OCTを用いて非侵襲に眼底血管を3次元で描出するOCT Angiography(以下、OCTAと表記)技術が用いられるようになってきている。OCTAでは測定光で同一位置を複数回走査し、赤血球の変位と測定光との相互作用により得られるモーションコントラストを画像化する。図4は主走査方向が水平(x軸)方向で、副走査方向(y軸方向)の各位置(yi;1≦i≦n)においてr回連続でBスキャンを行うOCTA撮影の例を示している。なおOCTA撮像において同一位置で複数回走査することをクラスタ走査、同一位置で得られた複数枚の断層画像のことをクラスタと呼ぶ。クラスタ単位でモーションコントラストデータを生成し、1クラスタあたりの断層画像数(略同一位置での走査回数)を増やすと、OCTA画像のコントラストが向上することが知られている。 On the other hand, in ophthalmologic practice, invasive fluorescence fundus angiography has been performed to understand the pathological condition of the fundus blood vessels. In recent years, an OCT angiography (hereinafter referred to as OCTA) technique for noninvasively three-dimensionally depicting fundus blood vessels using OCT has been used. In OCTA, the same position is scanned multiple times with the measurement light, and the motion contrast obtained by the interaction between the red blood cell displacement and the measurement light is imaged. FIG. 4 shows an example of OCTA imaging in which the horizontal (x-axis) direction is the main scanning direction and r consecutive B scans are performed at each position (yi; 1≤i≤n) in the sub-scanning direction (y-axis direction). ing. In OCTA imaging, multiple scans at the same position are called cluster scanning, and multiple tomographic images obtained at the same position are called a cluster. It is known that the contrast of an OCTA image is improved by generating motion contrast data for each cluster and increasing the number of tomographic images per cluster (the number of scans at approximately the same position).
ここで、モーションコントラストデータを用いて算出された血管解析マップの表示に関する技術が、特許文献に開示されている。 Here, patent documents disclose techniques for displaying a blood vessel analysis map calculated using motion contrast data.
ところで、OCTA画像を解析する場合には、解析の種類(例えば、血管領域の面積に関する血管密度(Vessel Area Density;VAD)、血管長に関する血管密度(Vessel Length Density;VLD)、無血管領域の面積等)や、解析領域等の条件を設定した上で解析が行われることが望まれる。このとき、解析領域としては、画像全体、ETDRSチャートのような扇形(セクタ)領域、操作者が設定した任意形状の関心領域などが選択されることが望まれる。ここで、例えば、1枚のOCTA画像上の各解析領域で異なる種類の解析を選択可能にした場合を考える。このとき、例えば、1枚のOCTA画像上に、VADマップとVLDセクタマップのような異なる種類の解析による結果を示す画像として解析マップが重畳表示される場合が生じる。このような場合には、操作者がデータの解釈を誤ってしまう可能性がある。 By the way, when analyzing OCTA images, the type of analysis (for example, vessel area density (Vssel Area Density; VAD), vessel length (Vessel Length Density; VLD), avascular area area etc.) and conditions such as the analysis area are set before the analysis is performed. At this time, it is desired that the entire image, a sector area such as an ETDRS chart, an arbitrary-shaped region of interest set by the operator, or the like be selected as the analysis area. Here, for example, consider a case where different types of analysis can be selected for each analysis area on one OCTA image. At this time, for example, an analysis map may be superimposed on one OCTA image as an image showing the results of different types of analysis, such as a VAD map and a VLD sector map. In such cases, the operator may misinterpret the data.
開示の技術は、モーションコントラスト画像上の複数の解析領域に対して実行された解析の結果を示す画像が表示される場合に、複数の解析領域に対する解析の種類として互いに対応する種類の選択が容易に実行されるように構成することを目的の一つとする。 In the disclosed technology, when an image showing the results of analysis performed on a plurality of analysis regions on a motion contrast image is displayed, it is easy to select types of analysis corresponding to each other as types of analysis for the plurality of analysis regions. One of the purposes is to configure it so that it is executed in
なお、上記目的に限らず、後述する発明を実施するための形態に示す各構成により導かれる作用効果であって、従来の技術によっては得られない作用効果を奏することも本件の他の目的の1つとして位置付けることができる。 In addition to the above object, it is also another object of the present invention to achieve functions and effects that are derived from each configuration shown in the mode for carrying out the invention described later and that cannot be obtained by the conventional technology. can be positioned as one.
上記目的を達成するための、開示の画像処理装置の一つは、
眼部のモーションコントラスト画像における第1の領域と、前記第1の領域の部分領域である第2の領域とのうち少なくとも1つに対する解析を実行する解析手段と、
操作者からの指示に応じて前記第1の領域と前記第2の領域とのいずれか一方に対して選択された解析の種類を示す情報を用いて前記一方が解析された結果を示す画像を表示手段に表示させ、前記一方に対する選択の後に操作者からの指示に応じて他方に対して選択された解析の種類と、前記一方に対して選択された解析の種類とが異なる場合には、前記一方が解析された結果を示す画像の表示領域において、前記一方が解析された結果を示す画像の表示を、前記他方に対して選択された解析の種類を示す情報を用いて前記一方及び前記他方が解析された結果を示す画像の表示に変更する制御を実行する表示制御手段と、
を有する。
One of the disclosed image processing apparatuses for achieving the above object is
analysis means for performing analysis on at least one of a first region in a motion contrast image of an eye and a second region that is a partial region of the first region;
An image showing a result of analyzing one of the first area and the second area using information indicating the type of analysis selected for one of the first area and the second area in accordance with an instruction from an operator. When the type of analysis selected for the other in response to an instruction from the operator after being displayed on the display means and the type of analysis selected for the one are different, In the display area of the image showing the analysis result of the one, the display of the image showing the analysis result of the one is displayed using the information indicating the type of analysis selected for the other. a display control means for executing control to change the display to an image showing the analysis result of the other;
have
開示の技術の一つによれば、モーションコントラスト画像上の複数の解析領域に対して実行された解析の結果を示す画像が表示される場合に、複数の解析領域に対する解析の種類として互いに対応する種類の選択が容易に実行されるように構成することができる。 According to one of the disclosed techniques, when an image showing the results of analysis performed on a plurality of analysis regions on a motion contrast image is displayed, the analysis types for the plurality of analysis regions correspond to each other. Kind selection can be configured to be easily performed.
[第一実施形態]
本実施形態に係る画像処理装置の一つは、同一被検眼に対して異なる日時に略同一撮影条件(経過観察を目的とするフォローアップ撮影の条件)で取得したOCTA重ね合わせ画像から生成した網膜表層及び網膜深層の正面モーションコントラスト画像を用いて血管領域特定及び血管密度計測処理を実施する。該特定処理及び計測処理により得られた合成画像及び計測値を複数の深度範囲で時系列並置表示する場合について説明する。なお、本発明において、経過観察を目的とするフォローアップ撮影や、画像の重ね合わせ処理等は必須のものではない。
[First embodiment]
One of the image processing apparatuses according to the present embodiment is a retinal image generated from an OCTA superimposed image acquired under substantially the same imaging conditions (conditions for follow-up imaging for the purpose of follow-up observation) on different dates and times for the same subject eye. Using frontal motion contrast images of the superficial layer and the deep layer of the retina, vascular region identification and vascular density measurement processing are performed. A case will be described in which the composite image and the measured values obtained by the specific processing and the measurement processing are displayed side by side in chronological order in a plurality of depth ranges. In the present invention, follow-up imaging for follow-up observation, image superimposition processing, and the like are not essential.
以下、図面を参照しながら、本発明の第一実施形態に係る画像処理装置を備える画像処理システムについて説明する。 An image processing system including an image processing apparatus according to a first embodiment of the present invention will be described below with reference to the drawings.
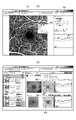
図2は、本実施形態に係る画像処理装置101を備える画像処理システム10の構成を示す図である。図2に示すように、画像処理システム10は、画像処理装置101が、インタフェースを介して断層画像撮影装置100(OCTとも言う)、外部記憶部102、入力部103、表示部104と接続されることにより構成されている。
FIG. 2 is a diagram showing the configuration of an
断層画像撮影装置100は、眼部の断層画像を撮影する装置である。本実施形態においては、断層画像撮影装置100としてSD-OCTを用いるものとする。これに限らず、例えばSS-OCTを用いて構成しても良い。
A tomographic
図2(a)において、測定光学系100-1は前眼部像、被検眼のSLO眼底像、断層画像を取得するための光学系である。ステージ部100-2は、測定光学系100-1を前後左右に移動可能にする。ベース部100-3は、後述の分光器を内蔵している。 In FIG. 2(a), a measurement optical system 100-1 is an optical system for obtaining an anterior segment image, an SLO fundus image of an eye to be examined, and a tomographic image. The stage section 100-2 enables the measurement optical system 100-1 to move forward, backward, leftward, and rightward. The base section 100-3 incorporates a spectroscope, which will be described later.
画像処理装置101は、ステージ部100-2の制御、アラインメント動作の制御、断層画像の再構成などを実行するコンピュータである。外部記憶部102は、断層撮像用のプログラム、患者情報、撮影データ、過去検査の画像データや計測データなどを記憶する。
The
入力部103はコンピュータへの指示を行い、具体的にはキーボードとマウスから構成される。表示部104は、例えばモニタからなる。
An
(断層画像撮影装置の構成)
本実施形態の断層画像撮影装置100における測定光学系及び分光器の構成について図2(b)を用いて説明する。
(Configuration of tomography apparatus)
The configuration of the measurement optical system and the spectroscope in the
まず、測定光学系100-1の内部について説明する。被検眼200に対向して対物レンズ201が設置され、その光軸上に第1ダイクロイックミラー202及び第2ダイクロイックミラー203が配置されている。これらのダイクロイックミラーによってOCT光学系の光路250、SLO光学系と固視灯用の光路251、及び前眼観察用の光路252とに波長帯域ごとに分岐される。
First, the inside of the measurement optical system 100-1 will be described. An
SLO光学系と固視灯用の光路251は、SLO走査手段204、レンズ205及び206、ミラー207、第3ダイクロイックミラー208、APD(Avalanche Photodiode)209、SLO光源210、固視灯211を有している。
An
ミラー207は、穴あきミラーや中空のミラーが蒸着されたプリズムであり、SLO光源210による照明光と、被検眼からの戻り光とを分離する。第3ダイクロイックミラー208はSLO光源210の光路と固視灯211の光路とに波長帯域ごとに分離する。
A
SLO走査手段204は、SLO光源210から発せられた光を被検眼200上で走査するものであり、X方向に走査するXスキャナ、Y方向に走査するYスキャナから構成されている。本実施形態では、Xスキャナは高速走査を行う必要があるためポリゴンミラーで、Yスキャナはガルバノミラーによって構成されている。
The SLO scanning means 204 scans the light emitted from the
レンズ205はSLO光学系及び固視灯211の焦点合わせのため、不図示のモータによって駆動される。SLO光源210は780nm付近の波長の光を発生する。APD209は、被検眼からの戻り光を検出する。固視灯211は可視光を発生して被検者の固視を促すものである。
A
SLO光源210から発せられた光は、第3ダイクロイックミラー208で反射され、ミラー207を通過し、レンズ206及び205を通ってSLO走査手段204によって被検眼200上で走査される。被検眼200からの戻り光は、照明光と同じ経路を戻った後、ミラー207によって反射され、APD209へと導かれ、SLO眼底像が得られる。
Light emitted from the
固視灯211から発せられた光は、第3ダイクロイックミラー208、ミラー207を透過し、レンズ206及び205を通り、SLO走査手段204によって被検眼200上の任意の位置に所定の形状を作り、被検者の固視を促す。
Light emitted from the
前眼観察用の光路252には、レンズ212及び213、スプリットプリズム214、赤外光を検知する前眼部観察用のCCD215が配置されている。このCCD215は、不図示の前眼部観察用照射光の波長、具体的には970nm付近に感度を持つものである。スプリットプリズム214は、被検眼200の瞳孔と共役な位置に配置されており、被検眼200に対する測定光学系100-1のZ軸方向(光軸方向)の距離を、前眼部のスプリット像として検出できる。
OCT光学系の光路250は前述の通りOCT光学系を構成しており、被検眼200の断層画像を撮影するためのものである。より具体的には、断層画像を形成するための干渉信号を得るものである。XYスキャナ216は光を被検眼200上で走査するためのものであり、図2(b)では1枚のミラーとして図示されているが、実際はXY2軸方向の走査を行うガルバノミラーである。
The
レンズ217及び218のうち、レンズ217については光カプラー219に接続されているファイバー224から出射するOCT光源220からの光を、被検眼200に焦点合わせするために不図示のモータによって駆動される。この焦点合わせによって、被検眼200からの戻り光は同時にファイバー224の先端に、スポット状に結像されて入射されることとなる。次に、OCT光源220からの光路と参照光学系、分光器の構成について説明する。220はOCT光源、221は参照ミラー、222は分散補償硝子、223はレンズ、219は光カプラー、224から227は光カプラーに接続されて一体化しているシングルモードの光ファイバー、230は分光器である。
Of the
これらの構成によってマイケルソン干渉計を構成している。OCT光源220から出射された光は、光ファイバー225を通じ、光カプラー219を介して光ファイバー224側の測定光と、光ファイバー226側の参照光とに分割される。測定光は前述のOCT光学系光路を通じ、観察対象である被検眼200に照射され、被検眼200による反射や散乱により同じ光路を通じて光カプラー219に到達する。
These configurations constitute a Michelson interferometer. Light emitted from the OCT
一方、参照光は光ファイバー226、レンズ223、測定光と参照光の波長分散を合わせるために挿入された分散補償ガラス222を介して参照ミラー221に到達し反射される。そして同じ光路を戻り、光カプラー219に到達する。
On the other hand, the reference light reaches the
光カプラー219によって、測定光と参照光は合波され干渉光となる。
The
ここで、測定光の光路長と参照光の光路長がほぼ同一となったときに干渉を生じる。参照ミラー221は、不図示のモータおよび駆動機構によって光軸方向に調整可能に保持され、測定光の光路長に参照光の光路長を合わせることが可能である。干渉光は光ファイバー227を介して分光器230に導かれる。
Here, interference occurs when the optical path length of the measurement light and the optical path length of the reference light are substantially the same. The
また、偏光調整部228、229は、各々光ファイバー224、226中に設けられ、偏光調整を行う。これらの偏光調整部は光ファイバーをループ状に引きまわした部分を幾つか持っている。このループ状の部分をファイバーの長手方向を中心として回転させることでファイバーに捩じりを加え、測定光と参照光の偏光状態を各々調整して合わせることができる。
分光器230はレンズ232、234、回折格子233、ラインセンサ231から構成される。光ファイバー227から出射された干渉光はレンズ234を介して平行光となった後、回折格子233で分光され、レンズ232によってラインセンサ231に結像される。
The
次に、OCT光源220の周辺について説明する。OCT光源220は、代表的な低コヒーレント光源であるSLD(Super Luminescent Diode)である。中心波長は855nm、波長バンド幅は約100nmである。ここで、バンド幅は、得られる断層画像の光軸方向の分解能に影響するため、重要なパラメータである。
Next, the periphery of the OCT
光源の種類は、ここではSLDを選択したが、低コヒーレント光が出射できればよく、ASE(Amplified Spontaneous Emission)等を用いることができる。中心波長は眼を測定することを鑑みると近赤外光が適する。また、中心波長は得られる断層画像の横方向の分解能に影響するため、なるべく短波長であることが望ましい。双方の理由から中心波長は855nmとした。 As for the type of light source, SLD is selected here, but ASE (Amplified Spontaneous Emission) or the like may be used as long as it can emit low coherent light. Near-infrared light is suitable for the center wavelength in view of measuring the eye. Also, since the central wavelength affects the lateral resolution of the obtained tomographic image, it is desirable that the wavelength be as short as possible. For both reasons, the center wavelength was set to 855 nm.
本実施形態では干渉計としてマイケルソン干渉計を用いたが、マッハツェンダー干渉計を用いても良い。測定光と参照光との光量差に応じて、光量差が大きい場合にはマッハツェンダー干渉計を、光量差が比較的小さい場合にはマイケルソン干渉計を用いることが望ましい。 Although a Michelson interferometer is used as an interferometer in this embodiment, a Mach-Zehnder interferometer may be used. It is desirable to use a Mach-Zehnder interferometer when the light amount difference is large and a Michelson interferometer when the light amount difference is relatively small according to the light amount difference between the measurement light and the reference light.
(画像処理装置の構成)
本実施形態の画像処理装置101の構成について図1を用いて説明する。
(Configuration of image processing device)
The configuration of the
画像処理装置101は断層画像撮影装置100に接続されたパーソナルコンピュータ(PC)であり、画像取得部101-01、記憶部101-02、撮影制御部101-03、画像処理部101-04、表示制御部101-05を備える。また、画像処理装置101は演算処理装置CPUが画像取得部101-01、撮影制御部101-03、画像処理部101-04および表示制御部101-05を実現するソフトウェアモジュールを実行することで機能を実現する。本発明はこれに限定されず、例えば画像処理部101-04をASIC等の専用のハードウェアで実現してもよいし、表示制御部101-05をCPUとは異なるGPU等の専用プロセッサを用いて実現してもよい。また断層画像撮影装置100と画像処理装置101との接続はネットワークを介した構成であってもよい。
The
画像取得部101-01は断層画像撮影装置100により撮影されたSLO眼底像や断層画像の信号データを取得する。また画像取得部101-01は断層画像生成部101―11及びモーションコントラストデータ生成部101-12を有する。断層画像生成部101―11は断層画像撮影装置100により撮影された断層画像の信号データ(干渉信号)を取得して信号処理により断層画像を生成し、生成した断層画像を記憶部101-02に格納する。
An image acquisition unit 101-01 acquires signal data of an SLO fundus image and a tomographic image captured by the tomographic
撮影制御部101-03は、断層画像撮影装置100に対する撮影制御を行う。撮影制御には、断層画像撮影装置100に対して撮影パラメータの設定に関して指示することや、撮影の開始もしくは終了に関して指示することも含まれる。
The imaging control unit 101 - 03 performs imaging control on the
画像処理部101-04は、位置合わせ部101-41、合成部101-42、補正部101-43、画像特徴取得部101-44、投影部101-45、解析部101-46を有する。先に述べた画像取得部101-01及び合成部101-42は、取得手段の一例である。合成部101-42はモーションコントラストデータ生成部101-12により生成された複数のモーションコントラストデータを位置合わせ部101-41により得られた位置合わせパラメータに基づいて合成し、合成モーションコントラスト画像を生成する。補正部101-43はモーションコントラスト画像内に生じるプロジェクションアーチファクトを2次元もしくは3次元的に抑制する処理を行う(プロジェクションアーチファクトについてはS304で説明する)。画像特徴取得部101-44は断層画像から網膜や脈絡膜の層境界、中心窩や視神経乳頭中心の位置を取得する。投影部101-45は画像特徴取得部101-44が取得した層境界の位置に基づく深度範囲でモーションコントラスト画像を投影し、正面モーションコントラスト画像を生成する。解析部101-46は、強調部101-461、抽出部101-462、計測部101-463、比較部101-464を有し、正面モーションコントラスト画像から血管領域の抽出や計測処理を行う。ここで、解析部101-46は、眼部のモーションコントラスト画像における第1の領域と第1の領域よりも狭い領域を少なくとも含む第2の領域とのうち少なくとも1つに対する解析を実行する解析手段の一例である。また、第2の領域は、セクタ領域の一例である。また、第1の領域は、セクタ領域よりも広い領域(例えば、画像全体)の一例である。また、解析部101-46は、眼部のモーションコントラスト画像の少なくとも一部の領域に対する解析を実行するものであっても良い。強調部101-461は血管強調処理を実行する。また、抽出部101-462は血管強調画像に基づいて血管領域を抽出する。さらに、計測部101-463は抽出された該血管領域や該血管領域を細線化することで取得した血管中心線データを用いて血管密度等の計測値を算出する。比較部101-464は記憶部101-02もしくは外部記憶部102から異なる検査日に取得された同一被検眼の合成モーションコントラスト画像及び付随する計測データを読み込んで経時比較データを生成する。
The image processing unit 101-04 has an alignment unit 101-41, a synthesis unit 101-42, a correction unit 101-43, an image feature acquisition unit 101-44, a projection unit 101-45, and an analysis unit 101-46. The image acquiring unit 101-01 and synthesizing unit 101-42 described above are examples of acquiring means. Synthesis unit 101-42 synthesizes a plurality of pieces of motion contrast data generated by motion contrast data generation unit 101-12 based on the registration parameters obtained by registration unit 101-41 to generate a composite motion contrast image. . The correction unit 101-43 performs processing for two-dimensionally or three-dimensionally suppressing projection artifacts occurring in the motion contrast image (projection artifacts will be described in S304). The image feature acquisition unit 101-44 acquires the layer boundaries of the retina and choroid, the positions of the fovea centralis, and the center of the optic papilla from the tomographic image. The projection unit 101-45 projects a motion contrast image in a depth range based on the position of the layer boundary acquired by the image feature acquisition unit 101-44 to generate a front motion contrast image. The analysis unit 101-46 has an enhancement unit 101-461, an extraction unit 101-462, a measurement unit 101-463, and a comparison unit 101-464, and performs extraction and measurement processing of the blood vessel region from the front motion contrast image. Here, the analysis unit 101-46 is an analysis means for performing analysis on at least one of a first region and a second region including at least a region narrower than the first region in the motion contrast image of the eye. is an example. Also, the second area is an example of a sector area. Also, the first area is an example of an area wider than the sector area (for example, the entire image). Also, the analysis unit 101-46 may perform analysis on at least a partial region of the motion contrast image of the eye. The enhancement unit 101-461 performs vessel enhancement processing. Also, the extraction unit 101-462 extracts a blood vessel region based on the blood vessel enhanced image. Furthermore, the measurement unit 101-463 calculates the measured values such as the blood vessel density using the blood vessel center line data obtained by thinning the extracted blood vessel region and the blood vessel region. The comparison unit 101-464 reads from the storage unit 101-02 or the
また、表示制御部101-05は、操作者からの指示に応じて第1の領域と第2の領域とのいずれか一方に対して選択された解析の種類を示す情報を用いて一方が解析された結果を示す画像を表示部104に表示させることが好ましい。ここで、選択された解析の種類は、例えば、血管領域の面積に関する血管密度(Vessel Area Density;VAD)や血管長に関する血管密度(Vessel Length Density;VLD)等である。また、解析された結果を示す画像は、例えば、モーションコントラスト正面画像の少なくとも一部の領域に対して解析された結果を示す2次元画像である。また、解析された結果を示す2次元画像は、例えば、VADマップ、VLDマップ、VADセクタマップ、VLDセクタマップ、また、これらの各解析マップがモーションコントラスト正面画像に重畳された画像がある。また、互いに同じ種類の複数の解析マップが重畳された画像や、互いに同じ種類の複数の解析マップがモーションコントラスト正面画像に重畳された画像であっても良い。例えば、VADセクタマップがVADマップに重畳された2次元画像、VADセクタマップ及びVADマップがモーションコントラスト画像に重畳された2次元画像、VLDセクタマップがVLDマップに重畳された2次元画像、VLDセクタマップ及びVLDマップがモーションコントラスト画像に重畳された2次元画像がある。なお、解析部101-46による解析を実行するタイミングは、操作者からの指示に応じて解析の種類が選択されたタイミングでも良いし、解析の種類が選択される前に想定される解析の種類に対応する解析を事前に完了させておいても良い。
Further, the display control unit 101-05 uses information indicating the type of analysis selected for one of the first region and the second region according to an instruction from the operator. It is preferable to cause the
ここで、一方に対する選択の後に操作者からの指示に応じて他方に対して選択された解析の種類と、一方に対して選択された解析の種類とが異なる場合を考える。このとき、表示制御部101-05は、一方が解析された結果を示す画像の表示領域において、一方が解析された結果を示す画像の表示を、他方に対して選択された解析の種類を示す情報を用いて一方及び他方が解析された結果を示す画像の表示に変更する制御を実行することが好ましい。これにより、モーションコントラスト画像上の複数の解析領域に対して実行された解析の結果を示す画像が表示される場合に、複数の解析領域に対する解析の種類として互いに対応する種類の選択が容易に実行されるように構成することができる。例えば、図9(a)右側のMapボタン群902においてVLDマップが選択された後に、Sectorボタン群903においてVADセクタが選択された場合に、VLDマップがモーションコントラスト正面画像に重畳された2次元画像の表示を、VADセクタマップ及びVADマップがモーションコントラスト正面画像に重畳された2次元画像の表示に変更する制御が実行されることが好ましい。これにより、例えば、VADセクタマップ及びVLDマップがモーションコントラスト画像に重畳された2次元画像のように、解析の種類が異なる状態で表示されることがない。すなわち、例えば、重畳される複数の解析マップが同じ解析の種類として確実に選択されるため、解析結果の確認を行い易くすることができる。このとき、当然、解析の種類を示す情報の表示についても、変更する制御が実行されることが好ましい。すなわち、表示制御部101-05は、一方に対する選択の後に操作者からの指示に応じて他方に対して選択された解析の種類と、一方に対して選択された解析の種類とが異なる場合には、一方に対して選択された解析の種類を示す情報の表示を、他方に対して選択された解析の種類を示す情報の表示に変更する別の制御を実行することが好ましい。なお、選択された解析の種類を示す情報の表示は、選択された解析の種類が識別可能なように表示部104に表示されていれば何でも良く、例えば、図9(a)右側のMapボタン群902、Sectorボタン群903がある。また、経過観察を目的とするフォローアップ撮影において、複数の検査日に対応する複数のモーションコントラスト画像が時系列に並べて表示される表示領域において、複数のモーションコントラスト画像のうちの1つの画像に対して実行される上記制御が、他の画像に対しても実行されることが好ましい。また、複数の検査日に対応する複数のモーションコントラスト画像のうちの1つの画像に対して選択される解析の種類を示す情報が、他の画像に対しても適用されることが好ましい。これらにより、例えば、経過観察を目的とするフォローアップ撮影での利便性も向上することができる。なお、セクタ領域には、複数の領域に区分けされていることが好ましく、各領域内には、その領域の解析結果を示す値(例えば、その領域の平均値)をその解析の種類の単位が識別可能な状態で表示させることが好ましい。ここで、Mapボタン群902やSectorボタン群903において、操作者からの指示に応じて「None」が選択されると、解析の種類が非選択の状態となることが好ましい。このとき、解析された結果を示す画像が表示領域において非表示の状態となり、モーションコントラスト画像が表示領域に表示されることが好ましい。また、一方に対して選択された解析の種類が操作者からの指示に応じて非選択に変更された場合には、他方に対して選択された解析の種類は変更されないことが好ましい。
Here, consider a case where the type of analysis selected for the other in response to an instruction from the operator after selection for one is different from the type of analysis selected for the other. At this time, the display control unit 101-05 displays the image showing the result of one analysis in the display area of the image showing the result of one analysis, and indicates the type of analysis selected for the other. Control is preferably performed to change the display of the image showing the results of the analysis of one and the other using the information. This makes it easy to select mutually corresponding types of analysis for multiple analysis regions when an image showing the results of analysis performed on multiple analysis regions on a motion contrast image is displayed. can be configured to For example, when the VLD map is selected in the
また、操作者からの指示に応じて選択された解析の種類を示す情報を用いて、眼部のモーションコントラスト画像における第1の領域に対する解析が実行された場合を考える。このとき、表示制御部101-05は、操作者からの指示に応じてモーションコントラスト画像における第2の領域に対して解析された結果を示す画像の表示が選択された場合には、選択された解析の種類を示す情報を用いて第2の領域に対して解析された結果を示す画像を、第1の領域に対して解析された結果を示す画像に重畳された状態で表示部104に表示させるものであっても良い。これにより、例えば、解析の種類としてVADが選択され、また、セクタ領域の表示として「On」が選択されると、表示領域においてVADセクタマップがVADマップに重畳された2次元画像を表示させることができる。このため、例えば、重畳される複数の解析マップが同じ解析の種類として確実に選択されるため、解析結果の確認を行い易くすることができる。
Also, consider a case where analysis is performed on the first region in the motion contrast image of the eye using information indicating the type of analysis selected in accordance with an instruction from the operator. At this time, the display control unit 101-05 selects display of an image showing the analysis result of the second region in the motion contrast image in accordance with an instruction from the operator. The
また、表示制御部101-05は、操作者からの指示に応じて表示部104に表示される解析結果を示す画像が、解析に適した複数の条件のうちの少なくとも2つの条件が満足されない状態で得られた画像である場合には、少なくとも2つの条件に関する情報を、複数の条件の優先順位に応じて報知する報知手段の一例であっても良い。これにより、解析に適した複数の条件のうち少なくとも2つの条件が満足されない場合であっても、より精度の高い解析結果が得られるように操作者が対処し易くすることができる。ここで、解析に適した複数の条件には、例えば、モーションコントラスト画像が、眼部の同一位置を測定光が走査されるように制御して得た複数の3次元のモーションコントラスト画像が合成された画像である、という条件が、他の条件よりも優先度の高い条件として含まれることが好ましい。これにより、例えば、高画質な画像を用いた解析結果を確認することを操作者にアドバイスすることができる。また、表示制御部101-05は、少なくとも2つの条件に関する情報を表示部104に表示させることが好ましい。このとき、表示制御部101-05は、操作者からの指示に応じて選択された解析の種類を示す情報を用いて解析結果を示す画像を、少なくとも2つの条件に関する情報と並べて表示部104に表示させることが好ましい。また、少なくとも2つの条件のうちの優先度の高い条件に関する警告メッセージであることが好ましい。例えば、図12の右下部に記載されているように、「Averaged OCTA is recommended in calculating VAD or VLD.」という警告メッセージを、解析結果を示す画像が表示される表示画面の端等に表示すればよい。また、上記警告メッセージは、例えば、解析結果を示す画像が表示される表示領域上の端等に、例えば、解析結果を示す画像に重畳された状態で表示されても良い。これらにより、例えば、表示部104の表示画面において、操作者が最も確認したい解析結果を示す画像を表示させつつ、残りのスペースを効果的に用いて操作者に対して解析に適した条件をアドバイスすることができる。もちろん、報知手段は、少なくとも2つの条件に関する情報として、少なくとも2つの条件それぞれに関する警告メッセージを、優先順位で報知しても良い。
In addition, the display control unit 101-05 causes the image showing the analysis result displayed on the
また、外部記憶部102は、被検眼の情報(患者の氏名、年齢、性別など)と、撮影した画像(断層画像及びSLO画像・OCTA画像)や合成画像、撮影パラメータ、血管領域や血管中心線の位置データ、計測値、操作者が設定したパラメータを関連付けて保持している。入力部103は、例えば、マウス、キーボード、タッチ操作画面などであり、操作者は、入力部103を介して、画像処理装置101や断層画像撮影装置100へ指示を行う。
In addition, the
次に、図3を参照して本実施形態の画像処理装置101の処理手順を示す。図3は、本実施形態における本システム全体の動作処理の流れを示すフローチャートである。
Next, the processing procedure of the
<ステップ301>
操作者は過去検査データが保存されている被検眼に関して基準検査を選択する。また、画像処理装置101は選択された基準検査と同一撮影条件になるようにOCTA撮影の撮影条件を設定する。
<Step 301>
The operator selects a reference examination for an eye to be examined for which past examination data is stored. In addition, the
本実施形態においては、図7(a)に示すような患者画面700において、操作者が入力部103を操作することで患者リスト(Patient List)から被検者701を選択する。さらに操作者が該被検者の検査リスト(Examination List)からフォローアップ検査における基準検査(Baseline)を選択することで基準検査を決定する(図7の702)。検査セットやスキャンモードの選択については、操作者が基準検査を選択した状態で撮影画面(OCTCapture)を開くことにより画像処理装置101がフォローアップ検査セットを選択し、スキャンモードを基準検査と同一のスキャンモードに設定する。本実施形態においては、図7(b)の撮影画面710に示すように、検査セットとして「Follow-up」(711)、スキャンモードとして「OCTA」モード712を選択する。ここで、検査セットとは検査目的別に設定した(スキャンモードを含む)撮像手順や、OCT画像やOCTA画像の既定の表示法を指す。
In this embodiment, the operator operates the
画像処理装置は、断層画像撮影装置100に対して指示するOCTA画像の撮影条件を設定する。なお、個々のOCTA撮影に関する撮影条件としては以下の1)~7)に示すような設定項目があり、これらの設定項目を基準検査と同一の値に設定した上で、S302において適宜休憩を挟みながら(同一撮像条件の)OCTA撮影を所定の回数だけ繰り返し実行する。
The image processing apparatus sets OCTA imaging conditions to be instructed to the
本実施形態では7)1クラスタあたりのBスキャン数が4であるようなOCTA撮影を3回繰り返すものとする。
1)走査パターン(Scan Pattern)
2)走査領域サイズ(Scan Size)
3)主走査方向(Scanning Direction)
4)走査間隔(Distance between B-scans)
5)固視灯位置(Fixation Position)
6)コヒーレンスゲート位置(C-Gate Orientation)
7)1クラスタあたりのBスキャン数(B-scans per Clster)
In this embodiment, 7) OCTA imaging with four B-scans per cluster is repeated three times.
1) Scan Pattern
2) Scan area size (Scan Size)
3) Main scanning direction
4) Distance between B-scans
5) Fixation Position
6) Coherence gate position (C-Gate Orientation)
7) Number of B-scans per cluster (B-scans per Clster)
<ステップ302>
操作者は入力部103を操作して図7(b)に示す撮影画面710中の撮影開始(Capture)ボタン713を押下することにより、S301で指定した撮影条件による繰り返しOCTA撮影を開始する。
<Step 302>
The operator operates the
撮影制御部101-03は断層画像撮影装置100に対してS301で操作者が指示した設定に基づいて繰り返しOCTA撮影を実施することを指示し、断層画像撮影装置100が対応するOCT断層画像を取得する。
The imaging control unit 101-03 instructs the
なお、本ステップにおいて断層画像撮影装置100はSLO画像の取得も行い、SLO動画像に基づく追尾処理を実行する。本実施形態において繰り返しOCTA撮影における追尾処理に用いる基準SLO画像は1回目の繰り返しOCTA撮影において設定した基準SLO画像とし、全ての繰り返しOCTA撮影において共通の基準SLO画像を用いる。
Note that in this step, the
本実施形ではクラスタ走査として、中心窩を撮像中心とする3x3mmの矩形領域内を、水平方向を主走査方向として垂直方向(副走査方向)の各位置において4回連続でB-scan撮影する。また、隣接するクラスタ走査の間隔は0.01mmであり、硝子体側にコヒーレンスゲートを設定してOCT断層画像を取得している。なお、本実施形態においてはB-scan1枚が300Aスキャンで構成されるものとする。 In this embodiment, as cluster scanning, B-scan imaging is performed four times continuously at each position in the vertical direction (sub-scanning direction) with the horizontal direction as the main scanning direction within a rectangular area of 3×3 mm centered on the fovea. The interval between adjacent cluster scans is 0.01 mm, and the OCT tomographic image is acquired by setting a coherence gate on the vitreous body side. In this embodiment, it is assumed that one B-scan consists of 300A scans.
またOCTA繰り返し撮影中は、S301で設定した撮影条件に加えて
・左右眼の選択
・追尾処理の実行有無
についても同じ設定値を用いる(変更しない)ものとする。
Also, during OCTA repeated imaging, in addition to the imaging conditions set in S301, the same setting values are used (not changed) for selection of left and right eyes and execution/non-execution of tracking processing.
<ステップ303>
画像取得部101-01及び画像処理部101-04は、S302で取得されたOCT断層画像に基づいてモーションコントラスト画像を生成する。
<Step 303>
The image acquisition unit 101-01 and image processing unit 101-04 generate a motion contrast image based on the OCT tomographic image acquired in S302.
まず断層画像生成部101-11は画像取得部101-01が取得した干渉信号に対して波数変換及び高速フーリエ変換(FFT)、絶対値変換(振幅の取得)を行うことで1クラスタ分の断層画像を生成する。 First, the tomographic image generating unit 101-11 performs wave number transformation, fast Fourier transform (FFT), and absolute value conversion (obtaining amplitude) on the interference signal acquired by the image acquiring unit 101-01, thereby obtaining a tomogram for one cluster. Generate an image.
次に位置合わせ部101-41は同一クラスタに属する断層画像同士を位置合わせし、重ねあわせ処理を行う。画像特徴取得部101-44が該重ね合わせ断層画像から層境界データを取得する。本実施形態では層境界の取得法として可変形状モデルを用いるが、任意の公知の層境界取得手法を用いてよい。なお層境界の取得処理は必須ではなく、例えばモーションコントラスト画像の生成を3次元のみで行い、深度方向に投影した2次元のモーションコントラスト画像を生成しない場合には層境界の取得処理は省略できる。モーションコントラストデータ生成部101-12が同一クラスタ内の隣接する断層画像間でモーションコントラストを算出する。本実施形態では、モーションコントラストとして脱相関値Mxyを以下の式(1)に基づき求める。 Next, the alignment unit 101-41 aligns the tomographic images belonging to the same cluster and superimposes them. An image feature acquisition unit 101-44 acquires layer boundary data from the superimposed tomographic images. In this embodiment, a deformable model is used as a layer boundary acquisition method, but any known layer boundary acquisition method may be used. Note that the layer boundary acquisition process is not essential. For example, when the motion contrast image is generated only in three dimensions and the two-dimensional motion contrast image projected in the depth direction is not generated, the layer boundary acquisition process can be omitted. A motion contrast data generator 101-12 calculates motion contrast between adjacent tomographic images within the same cluster. In this embodiment, the decorrelation value Mxy is obtained as the motion contrast based on the following equation (1).

ここで、Axyは断層画像データAの位置(x,y)における(FFT処理後の複素数データの)振幅、Bxyは断層データBの同一位置(x,y)における振幅を示している。0≦Mxy≦1であり、両振幅値の差異が大きいほど1に近い値をとる。式(1)のような脱相関演算処理を(同一クラスタに属する)任意の隣接する断層画像間で行い、得られた(1クラスタあたりの断層画像数-1)個のモーションコントラスト値の平均を画素値として持つ画像を最終的なモーションコントラスト画像として生成する。 Here, Axy indicates the amplitude (of complex number data after FFT processing) at position (x, y) of tomographic image data A, and Bxy indicates the amplitude of tomographic data B at the same position (x, y). 0≦Mxy≦1, and takes a value closer to 1 as the difference between the two amplitude values increases. Decrelation arithmetic processing such as Equation (1) is performed between arbitrary adjacent tomographic images (belonging to the same cluster), and the average of the obtained (number of tomographic images per cluster - 1) motion contrast values is An image with pixel values is generated as a final motion contrast image.
なお、ここではFFT処理後の複素数データの振幅に基づいてモーションコントラストを計算したが、モーションコントラストの計算法は上記に限定されない。例えば複素数データの位相情報に基づいてモーションコントラストを計算してもよいし、振幅と位相の両方の情報に基づいてモーションコントラストを計算してもよい。あるいは、複素数データの実部や虚部に基づいてモーションコントラストを計算してもよい。 Although the motion contrast is calculated here based on the amplitude of the complex number data after FFT processing, the motion contrast calculation method is not limited to the above. For example, motion contrast may be calculated based on the phase information of complex data, or may be calculated based on both amplitude and phase information. Alternatively, motion contrast may be calculated based on the real and imaginary parts of complex data.
また、本実施形態ではモーションコントラストとして脱相関値を計算したが、モーションコントラストの計算法はこれに限定されない。例えば二つの値の差分に基づいてモーションコントラストを計算しても良いし、二つの値の比に基づいてモーションコントラストを計算してもよい。 Also, in this embodiment, the decorrelation value is calculated as the motion contrast, but the motion contrast calculation method is not limited to this. For example, the motion contrast may be calculated based on the difference between the two values, or the motion contrast may be calculated based on the ratio of the two values.
さらに、上記では取得された複数の脱相関値の平均値を求めることで最終的なモーションコントラスト画像を得ているが、本発明はこれに限定されない。例えば取得された複数の脱相関値の中央値、あるいは最大値を画素値として持つ画像を最終的なモーションコントラスト画像として生成しても良い。 Furthermore, in the above description, the final motion contrast image is obtained by averaging a plurality of acquired decorrelation values, but the present invention is not limited to this. For example, an image having, as a pixel value, the median value or the maximum value of a plurality of acquired decorrelation values may be generated as the final motion contrast image.
<ステップ304>
画像処理部101-04は、繰り返しOCTA撮影を通して得られたモーションコントラスト画像群(図8(a))を3次元的に位置合わせし、加算平均することで図8(b)に示すように高コントラストな合成モーションコントラスト画像を生成する。なお、合成処理は単純加算平均に限定されない。例えば各モーションコントラスト画像の輝度値に対して任意の重みづけをした上で平均した値でもよいし、中央値をはじめとする任意の統計値を算出してもよい。また位置合わせ処理を2次元的に行う場合も本発明に含まれる。
<Step 304>
The image processing unit 101-04 three-dimensionally aligns the motion contrast image group (FIG. 8(a)) obtained through repeated OCTA imaging, and adds and averages them to obtain a high image as shown in FIG. 8(b). Generate a contrasting synthetic motion contrast image. Note that the synthesizing process is not limited to simple averaging. For example, a value obtained by arbitrarily weighting and averaging the luminance values of the respective motion contrast images may be used, or an arbitrary statistical value including a median value may be calculated. The present invention also includes the case where the alignment process is performed two-dimensionally.
なお、合成部101-42が合成処理に不適なモーションコントラスト画像が含まれているか否かを判定した上で、不適と判定したモーションコントラスト画像を除いて合成処理を行うよう構成してもよい。例えば、各モーションコントラスト画像に対して評価値(例えば脱相関値の平均値や、fSNR)が所定の範囲外である場合に、合成処理に不適と判定すればよい。 Note that the synthesizing unit 101-42 may determine whether or not a motion contrast image unsuitable for synthesizing processing is included, and then perform synthesizing processing excluding the motion contrast image determined to be inappropriate. For example, if the evaluation value (for example, the average value of decorrelation values or fSNR) for each motion contrast image is outside a predetermined range, it may be determined that the motion contrast image is unsuitable for synthesis processing.
本実施形態では合成部101-42がモーションコントラスト画像を3次元的に合成した後、補正部101-43がモーションコントラスト画像内に生じるプロジェクションアーチファクトを3次元的に抑制する処理を行う。 In this embodiment, after the synthesizing unit 101-42 three-dimensionally synthesizes the motion contrast images, the correcting unit 101-43 performs processing for three-dimensionally suppressing projection artifacts occurring in the motion contrast images.
ここで、プロジェクションアーチファクトは網膜表層血管内のモーションコントラストが深層側(網膜深層や網膜外層・脈絡膜)に映り込み、実際には血管の存在しない深層側の領域に高い脱相関値が生じる現象を指す。図8(c)に、3次元OCT断層画像上に3次元モーションコントラストデータを重畳表示した例を示す。網膜表層血管領域に対応する高い脱相関値を持つ領域801の深層側(視細胞層)に、高い脱相関値を持つ領域802が生じている。本来視細胞層に血管は存在しないにもかかわらず、網膜表層で生じている血管影の明滅が視細胞層に映り込み、視細胞層の輝度値が変化することでアーチファクト802が生じる。
Here, projection artifact refers to a phenomenon in which the motion contrast in the superficial retinal blood vessels is reflected in the deep layer (deep retina, outer retina, choroid), and a high decorrelation value occurs in the deep layer where no blood vessels actually exist. . FIG. 8(c) shows an example in which 3D motion contrast data is superimposed on a 3D OCT tomographic image. A
補正部101-43は、3次元の合成モーションコントラスト画像上に生じたプロジェクションアーチファクト802を抑制する処理を実行する。任意の公知のプロジェクションアーチファクト抑制手法を用いてよいが、本実施形態ではStep-down Exponential Filteringを用いる。Step-down Exponential Filteringでは、3次元モーションコントラスト画像上の各Aスキャンデータに対して式(2)で表される処理を実行することにより、プロジェクションアーチファクトを抑制する。
The correction unit 101-43 performs processing to suppress

ここで、γは負の値を持つ減衰係数、D(x,y,z)はプロジェクションアーチファクト抑制処理前の脱相関値、DE(x,y,z)は該抑制処理後の脱相関値を表す。 Here, γ is an attenuation coefficient having a negative value, D(x, y, z) is a decorrelation value before projection artifact suppression processing, and D E (x, y, z) is a decorrelation value after the suppression processing. represents
図8(d)にプロジェクションアーチファクト抑制処理後の3次元合成モーションコントラストデータ(灰色)を断層画像上に重畳表示した例を示す。プロジェクションアーチファクト抑制処理前(図8(c))に視細胞層上に見られたアーチファクトが、該抑制処理によって除去されたことがわかる。 FIG. 8D shows an example in which the three-dimensional synthetic motion contrast data (gray) after the projection artifact suppression processing is superimposed on the tomographic image. It can be seen that the artifacts seen on the photoreceptor layer before projection artifact suppression processing (FIG. 8(c)) were removed by the suppression processing.
次に、投影部101-45はS303で画像特徴取得部101-44が取得した層境界の位置に基づく深度範囲でモーションコントラスト画像を投影し、正面モーションコントラスト画像を生成する。任意の深度範囲で投影してよいが、本実施形態においては網膜表層及び網膜深層の深度範囲で2種類の2次元合成モーションコントラスト画像を生成する。また、投影法としては最大値投影(MIP; Maximum Intensity Projection)・平均値投影(AIP; Average Intensity Projection)のいずれかを選択でき、本実施形態では最大値投影で投影するものとする。 Next, the projection unit 101-45 projects a motion contrast image in a depth range based on the position of the layer boundary acquired by the image feature acquisition unit 101-44 in S303 to generate a front motion contrast image. Although it may be projected in any depth range, in this embodiment, two types of two-dimensional synthetic motion contrast images are generated in depth ranges of the superficial layer and the deep layer of the retina. As a projection method, either MIP (Maximum Intensity Projection) or AIP (Average Intensity Projection) can be selected.
最後に、画像処理装置101は取得した画像群(SLO画像や断層画像)と該画像群の撮影条件データや、生成したモーションコントラスト画像と付随する生成条件データを検査日時、披検眼を同定する情報と関連付けて外部記憶部102へ保存する。
Finally, the
<ステップ305>
表示制御部101-05は、S303で生成した断層画像や、S304で合成したモーションコントラスト画像、撮影条件や合成条件に関する情報を表示部104に表示させる。
<Step 305>
The display control unit 101-05 causes the
図8(e)にレポート画面803の例を示す。本実施形態ではSLO画像及び断層画像、S304で合成及び投影することにより生成した異なる深度範囲の正面モーションコントラスト画像、対応する正面OCT画像を表示する。
An example of the
正面モーションコントラスト画像の投影範囲はリストボックスに表示された既定の深度範囲セット(805及び809)から操作者が選択することで変更できる。また、投影範囲の指定に用いる層境界の種類とオフセット位置を806や810のようなユーザインターフェースから変更したり、断層像上に重畳された層境界データ(807及び811)を入力部103から操作して移動させたりすることで投影範囲を変更できる。
The projection range of the frontal motion contrast image can be changed by operator selection from a predefined set of depth ranges (805 and 809) displayed in a list box. Also, the type and offset position of the layer boundary used to specify the projection range can be changed from a user interface such as 806 or 810, or the layer boundary data (807 and 811) superimposed on the tomogram can be manipulated from the
さらに、画像投影法やプロジェクションアーチファクト抑制処理の有無を例えばコンテキストメニューのようなユーザインターフェースから選択することにより変更してもよい。 Furthermore, the image projection method and the presence/absence of projection artifact suppression processing may be changed by selecting from a user interface such as a context menu.
<ステップ306>
操作者が入力部103を用いてOCTA計測処理の開始を指示する。
<Step 306>
The operator uses the
本実施形態では図8(e)のレポート画面803のモーションコントラスト画像上をダブルクリックすることで、図9(a)のようなOCTA計測画面に移行する。モーションコントラスト画像が拡大表示され、適宜画像投影法の種類(最大値投影(MIP)もしくは平均値投影(AIP))や投影深度範囲、プロジェクションアーチファクト除去処理の実施の有無を選択する。次に、図9(a)右側のMapボタン群902、Sectorボタン群903、Measurementボタン904経由で表示される選択画面905、の中から操作者が適切な項目を選択することで計測の種類と対象領域を選択し、解析部101-46が計測処理を開始する。なお、OCTA計測画面を表示させた時点では、いずれの計測対象領域も設定されていない(Mapボタン群902、Sectorボタン群ともNoneが選択され、選択画面905が表示されていない状態)。
In this embodiment, by double-clicking on the motion contrast image on the
計測処理の種類として、本実施形態ではMapボタン群902もしくはSectorボタン群903から
i)None(計測しない)
ii)VAD(血管が占める面積に基づいて算出される血管密度)
iii)VLD(血管の長さの総和に基づいて算出される血管密度)
のいずれかを選択する。これに限らず、例えば血管構造の複雑さを定量化するFractal Dimensionや、血管径の分布(血管の瘤や狭窄の分布)を表すVessel Diameter Indexを選択可能に構成してもよい。また、Measurementボタン904経由で表示される選択画面905からは
i)任意の2点間の距離計測
ii)無血管領域の面積計測
iii)VAD
iv)VLD
のいずれかを選択できる。
As the type of measurement processing, in this embodiment, i) None (do not measure) from the
ii) VAD (vessel density calculated based on area occupied by vessels)
iii) VLD (vessel density calculated based on sum of vessel lengths)
Choose one. For example, Fractal Dimension, which quantifies the complexity of the vascular structure, and Vessel Diameter Index, which represents the distribution of vascular diameters (distribution of aneurysms and stenosis of blood vessels), may be selectable. In addition, from the
iv) VLDs
You can choose either
計測処理の対象領域として、本実施形態ではMapボタン群902の中からNone以外を選択することにより画像全体を設定でき、Sectorボタン群903の中からNone以外を選択することによりセクタ領域(固視位置を中心とし、半径の異なる複数の同心円と該固視位置を通る角度の異なる複数の直線で規定される最小円領域及び扇形領域)を設定できる。また、Measurementボタン904経由で表示される選択画面905から所望の計測の種類を選択した上で入力部103を用いてモーションコントラスト画像上で任意形状の境界位置(図10(b)の灰色線部1001)を指定してOKボタンを押下することで、任意形状の計測対象領域を設定できる。該領域内に示された数値は該領域内で計測した値(この場合はVAD値)を示している。なお、関心領域の手動設定時には指定された境界位置(灰色線部1001)上に該境界位置が編集可能であることを示す丸い制御点が重畳表示され、OKボタンを押下した時点で該丸い制御点は消えて灰色線部1001のみとなり、該境界位置は編集不可の状態になる。
In this embodiment, the entire image can be set as the target area for measurement processing by selecting anything other than None from the
本実施形態ではMapボタン群902、Sectorボタン群903から各々VADを選択することで、VADマップ(計測の種類がVAD、計測対象領域が画像全体)とVADセクタマップ(計測の種類がVAD、計測対象領域がETDRSグリッドに対応するセクタ領域)を選択する場合について説明する。
In this embodiment, by selecting VAD from the
ここで、VADはVessel Area Densityの略であり、計測対象に含まれる血管領域の割合で定義される血管密度(単位:%)である。すなわち、VADは、モーションコントラスト画像において特定される血管領域の面積に関する血管密度の一例である。また、VLDはVessel Length Densityの略であり、単位面積あたりに含まれる血管の長さの総和(単位:mm-1)で定義される血管密度である。すなわち、VLDは、モーションコントラスト画像において特定される血管領域の長さに関する血管密度の一例である。また、VADやVLDは、モーションコントラスト画像において特定される血管領域に関するパラメータの一例である。血管領域に関するパラメータとしては、血管領域の面積、血管長、血管の曲率等が含まれる。ここで、血管密度は、血管の閉塞範囲や血管網の疎密の程度を定量化するための指標であり、VADが最もよく用いられている。ただし、VADでは計測値に占める大血管領域の寄与分が大きくなるため、糖尿病網膜症のように毛細血管の病態に注目して計測したい場合には(より毛細血管の閉塞に敏感な指標として)VLDが用いられる。なお、解析の種類としては、血管領域に関するパラメータ以外にも、例えば、モーションコントラスト画像において特定される無血管領域(Non Perfusion Area;NPA)に関するパラメータ等がある。無血管領域に関するパラメータとしては、無血管領域の面積や形状(長さや円形度)等が含まれる。また、これに限らず、例えば血管構造の複雑さを定量化するFractal Dimensionや、血管径の分布(血管の瘤や狭窄の分布)を表すVessel Diameter Indexを計測してもよい。 Here, VAD is an abbreviation for Vessel Area Density, which is the blood vessel density (unit: %) defined as the ratio of the blood vessel area included in the measurement target. That is, VAD is an example of blood vessel density with respect to the area of the blood vessel region identified in the motion contrast image. Also, VLD is an abbreviation for Vessel Length Density, which is the blood vessel density defined by the total length of blood vessels included per unit area (unit: mm −1 ). That is, the VLD is an example of vessel density with respect to the length of the vessel region identified in the motion contrast image. Also, VAD and VLD are examples of parameters related to blood vessel regions identified in motion contrast images. The parameters relating to the blood vessel region include the area of the blood vessel region, the length of the blood vessel, the curvature of the blood vessel, and the like. Here, the blood vessel density is an index for quantifying the occlusion range of blood vessels and the degree of sparseness of the blood vessel network, and VAD is most often used. However, in VAD, the contribution of the large blood vessel region to the measured value is large, so if you want to focus on the pathology of capillaries such as diabetic retinopathy (as an indicator that is more sensitive to capillary occlusion) VLD is used. In addition to parameters related to blood vessel areas, types of analysis include, for example, parameters related to non-vascular areas (Non Perfusion Areas; NPA) specified in motion contrast images. The parameters relating to the avascular region include the area and shape (length and degree of circularity) of the avascular region. In addition to this, for example, Fractal Dimension, which quantifies the complexity of the vascular structure, or Vessel Diameter Index, which indicates the distribution of vascular diameters (distribution of aneurysms and stenosis of blood vessels), may be measured.
なお、同一のモーションコントラスト画像に対して複数の計測対象領域を設定してもよい。複数の計測対象領域としては、例えば画像全体、セクタ領域、任意形状領域のうちの少なくとも2つや、2以上の深度範囲、あるいはそれらの組み合わせが挙げられる。該複数の計測対象領域に対して異なる種類の計測が選択された場合には、最後に(指定された解析対象領域に対して)選択された解析の種類を他の計測対象領域に対しても連動して適用した上で計測し、該計測結果を表示するように構成してもよい。例えば、VADマップとVADセクタマップが選択された状態でVLDマップに変更する指示を行うと、VLDセクタマップが自動で選択され、画像全体に対するVLD計測とETDRSセクタ領域に対するVLD計測が実行される。このような連動選択操作により、同一画像に対して異なる種類の計測値が重畳されて操作者が表示内容について誤解・混乱することを防止できる。なお、計測の種類のうちNone(計測しない)に関しては、各計測対象領域で独立に選択する(ある計測対象領域に対して「None」が選択された場合に、該「None」の選択は他の計測対象領域に対して連動して適用されない)。また、本発明は最後に選択された解析の種類を全ての解析対象領域に対して連動して適用し、計測・表示することに限定されるものではない。例えば面内方向の複数の計測対象領域に対しては連動させて深度方向の複数の対象領域に対しては連動させない、あるいはその逆(面内方向の複数の計測対象領域に対しては連動させず、深度方向の複数の対象領域に対しては連動させる)になるように適応的に適用して計測し、対応する計測結果を表示するよう構成してもよい。 Note that a plurality of measurement target areas may be set for the same motion contrast image. The multiple measurement target areas include, for example, at least two of the entire image, sector areas, and arbitrary shape areas, two or more depth ranges, or a combination thereof. When different types of measurement are selected for the plurality of measurement target areas, the analysis type selected last (for the specified analysis target area) is also applied to other measurement target areas. It may be configured to perform measurement after being applied in conjunction and to display the measurement result. For example, when an instruction to change to a VLD map is given while the VAD map and the VAD sector map are selected, the VLD sector map is automatically selected, and VLD measurement for the entire image and VLD measurement for the ETDRS sector area are performed. Such an interlocking selection operation can prevent the operator from being misunderstood and confused about the display contents due to superimposition of different types of measurement values on the same image. Among the types of measurement, None (no measurement) is selected independently for each measurement target region (when "None" is selected for a certain measurement target region, the selection of "None" is is not applied in conjunction with the measurement target area of ). Moreover, the present invention is not limited to applying the type of analysis selected last to all analysis target regions in conjunction with measurement and display. For example, multiple measurement target areas in the in-plane direction are interlocked, but multiple target areas in the depth direction are not interlocked, or vice versa (multiple measurement target areas in the in-plane direction are interlocked). It may also be configured to adaptively apply and measure so that a plurality of target regions in the depth direction are interlocked, and to display the corresponding measurement results.
次に、解析部101-46は、計測処理の前処理として画像拡大及びトップハットフィルタ処理を行う。トップハットフィルタを適用することにより、背景成分の輝度ムラを軽減できる。本実施形態では合成モーションコントラスト画像の画素サイズが約3μmになるようにBicubic補間を用いて画像拡大し、円形の構造要素を用いてトップハットフィルタ処理を行うものとする。 Next, the analysis unit 101-46 performs image enlargement and top hat filter processing as preprocessing for measurement processing. Applying the top-hat filter can reduce luminance unevenness of the background component. In the present embodiment, the image is enlarged using Bicubic interpolation so that the pixel size of the synthesized motion contrast image is about 3 μm, and top-hat filtering is performed using circular structuring elements.
<ステップ307>
解析部101-46が血管領域の特定処理を行う。本実施形態では、強調部101-461がヘシアンフィルタ及びエッジ選択鮮鋭化に基づく血管強調処理を行う。次に抽出部101-462が2種類の血管強調画像を用いて2値化処理を行い、整形処理を行うことで血管領域を特定する。
<Step 307>
The analysis unit 101-46 performs processing for identifying the blood vessel region. In this embodiment, the enhancement unit 101-461 performs vessel enhancement processing based on a Hessian filter and edge selective sharpening. Next, the extraction unit 101-462 performs binarization processing using the two types of blood vessel enhanced images, and performs shaping processing to specify the blood vessel region.
血管領域特定処理の詳細はS510~S560で説明する。 The details of the blood vessel region specifying process will be explained in S510 to S560.
<ステップ308>
計測部101-463が、操作者により指定された計測対象領域に関する情報に基づいて単検査の画像に対する血管密度の計測を行う。引き続いて表示制御部101-05が、計測結果を表示部104に表示する。
<Step 308>
The measurement unit 101-463 measures the blood vessel density for the image of the single examination based on the information regarding the measurement target area specified by the operator. Subsequently, the display control unit 101-05 displays the measurement result on the
血管密度としてはVADとVLDの2種類の指標があり、本実施形態ではVADを計算する場合の手順を例に説明する。なお、VLDを計算する場合の手順についても後述する。 As blood vessel density, there are two indices, VAD and VLD, and in this embodiment, a procedure for calculating VAD will be described as an example. The procedure for calculating VLD will also be described later.
操作者が入力部103から血管領域もしくは血管中心線データを修正するよう指示を入力した場合には、解析部101-46が操作者から入力部103を介して指定された位置情報に基づいて血管領域もしくは血管中心線データを修正し、計測値を再計算する。
When the operator inputs an instruction from the
なお、本ステップで所定の条件を満たさずに計測が実施された場合には、表示制御部101-05が所定の計測条件を満たした状態で計測すべき旨のメッセージ(警告表示)を表示部104に出力する。 If the measurement is performed without satisfying the predetermined conditions in this step, the display control unit 101-05 displays a message (warning display) to the effect that the measurement should be performed while the predetermined measurement conditions are satisfied. 104.
VAD計測処理の詳細はS810~S830、VLD計測処理の詳細はS840~S870で各々説明する。 Details of the VAD measurement process will be described in S810 to S830, and details of the VLD measurement process will be described in S840 to S870.
<ステップ309>
解析部101-46は、S307で特定した血管領域や血管中心線のデータを修正するか否かの指示を外部から取得する。この指示は例えば入力部103を介して操作者により入力される。修正処理が指示された場合はS308へ、修正処理が指示されなかった場合はS310へと処理を進める。
<Step 309>
The analysis unit 101-46 acquires from the outside an instruction as to whether or not to correct the data of the blood vessel region and the blood vessel center line specified in S307. This instruction is input by the operator via the
<ステップ310>
比較部101-464は経時変化計測(Progression計測)処理を実行する。図11にProgression計測レポートの例を示す。Progressionモードタブ1101を指定することにより、該レポート画面が表示され、S306で選択した計測の種類及び計測対象領域に基づく経時変化計測処理が開始される。本実施形態ではProgression計測対象画像として検査日が新しいものから順に4検査を自動選択するものとする。これに限らず、例えば最も古い検査日の画像と最新検査の画像、両検査日間に撮影された画像で検査間隔が略等しい画像を選択するよう構成してもよい。ここで、計測対象画像の選択条件は優先度が高い順に
i)固視位置が同じ画像であること
ii)略同一位置における取得断層像数が大きい(例えば4以上)モーションコントラスト画像か、同等のモーションコントラスト画像になるようにOCTA重ね合わせ処理を実施して得られる合成モーションコントラスト画像であること
であり、上記選択条件を満たす画像を優先して選択するものとする。
<Step 310>
The comparison unit 101-464 executes a process of measuring changes over time (progression measurement). FIG. 11 shows an example of the Progression measurement report. By designating the
なお、計測対象画像はこれに限らず、例えば図11の選択ボタン1107を選択して選択画面を表示させ、該選択画面上に表示された画像リストから選択してもよい。 Note that the image to be measured is not limited to this. For example, a selection screen may be displayed by selecting the selection button 1107 in FIG. 11, and the image may be selected from the image list displayed on the selection screen.
次に、比較部101-464はS309で実施した単検査の計測内容に対応する過去検査の画像及び計測値に関するデータを外部記憶部102から取得する。さらに位置合わせ部101-41はS308で計測した単検査の画像と過去検査画像間の位置合わせを行い、比較部101-464が共通した領域に関する計測データ(計測値、計測値マップ、差分マップ、トレンドグラフのうちの少なくとも一つ)を生成する。なお、差分マップは例えば図11の1108に示すような「Show Difference」チェックボックスを指定することにより生成する。
Next, the comparison unit 101-464 acquires from the
<ステップ311>
表示制御部101-05は、S310で実施したProgression計測に関するレポートを表示部104に表示する。
<Step 311>
The display control unit 101-05 displays on the display unit 104 a report regarding the Progression measurement performed in S310.
本実施形態では、図11に示すProgression計測レポートの上段に網膜表層において計測したVADマップとVADセクタマップを重畳表示し、下段に網膜深層において計測したVADマップとVADセクタマップを重畳表示する。これにより異なる深度位置の血管病態の時系列変化を一覧して把握でき、図11の時系列並置表示されたVAD計測結果では、網膜深層に初期病変が生じ、時間の経過とともに網膜表層へ、また中心窩から傍中心窩へ血管閉塞が広がっていく様子が一覧して把握できる。 In this embodiment, the VAD map and the VAD sector map measured in the superficial layer of the retina are superimposed on the upper part of the Progression measurement report shown in FIG. 11, and the VAD map and the VAD sector map measured in the deep retina are superimposed on the lower part. As a result, it is possible to grasp chronological changes in vascular pathology at different depths at a glance, and in the VAD measurement results displayed side by side in chronological order in FIG. It is possible to grasp at a glance how the vascular occlusion spreads from the fovea to the parafovea.
また各計測対象画像に関して、略同一位置における断層画像数やOCTA重ね合わせ処理の実施条件に関する情報、OCT断層画像もしくはモーションコントラスト画像の評価値(画質指標)に関する情報を表示部104に表示させてもよい。図11ではOCTA重ね合わせ処理実施済であることを示す印(左上の「Averaged OCTA」)が表示されている。なお、図11の上部に表示されている矢印1104は現在選択されている検査であることを示す印であり、基準検査(Baseline)はFollow-up撮影の際に選択した検査(図11の一番左画像の画像)である。もちろん、基準検査を示すマークを表示部104に表示させてもよい。またS310で「Show Difference」チェックボックス1108が指定された場合には、基準画像上に基準画像に対する計測値分布(マップもしくはセクタマップ)を表示し、それ以外の検査日に対応する領域に基準画像に対して算出した計測値分布との差分計測値マップを表示する。計測結果としてはレポート画面上にトレンドグラフ(経時変化計測によって得られた各検査日の画像に対する計測値のグラフ)を表示させてもよい。該トレンドグラフの回帰直線(曲線)や対応する数式をレポート画面に表示させてもよい。
For each image to be measured, the number of tomographic images at approximately the same position, information on the execution conditions for OCTA superimposition processing, and information on the evaluation value (image quality index) of the OCT tomographic image or motion contrast image may be displayed on the
なお、本実施形態では異なる深度範囲として網膜表層及び網膜深層の画像及び計測値を時系列で表示したが、これに限らず例えば網膜表層・網膜深層・網膜外層・脈絡膜の4種類の深度範囲の画像及び計測値を時系列で表示してもよい。 In the present embodiment, images and measured values of the retinal surface layer and the retinal deep layer are displayed in chronological order as different depth ranges. Images and measurements may be displayed in chronological order.
あるいは、異なる指標の計測結果を並置して時系列で表示してもよい。例えば、上段にVADマップの時系列表示、下段にVLDマップ(もしくは無血管領域の形状値)の時系列並置表示を行ってもよい。 Alternatively, the measurement results of different indices may be displayed side by side in chronological order. For example, the VAD map may be displayed in chronological order on the upper stage, and the VLD map (or the shape value of the avascular region) may be displayed in parallel on the lower stage in chronological order.
なお、時系列並置表示する場合の投影深度範囲は、S305で説明した図8(e)のユーザインターフェース(805・806や809・810)の場合と同様に、図11の1102・1105・1106のユーザインターフェースを用いて変更できる。また、同様に投影方法(MIP/AIP)やプロジェクションアーチファクト抑制処理についても例えばコンテキストメニューから選択するなどの方法により変更してもよい。さらに、ショートカットメニューから計測の種類及び計測対象領域に関する項目を異なる値に変更することにより、Progression計測の種類及び計測対象領域を変更して再計測できる。 Note that the projection depth range for time-series juxtaposition display is the same as the user interface (805/806 and 809/810) in FIG. Can be changed using the user interface. Similarly, the projection method (MIP/AIP) and projection artifact suppression processing may also be changed by selecting from a context menu, for example. Furthermore, by changing the items related to the type of measurement and the measurement target area from the shortcut menu to different values, the type of Progression measurement and the measurement target area can be changed and re-measured.
例えば、ショートカットメニュー上に図9(a)のMapボタン群902に相当する項目及びSectorボタン群903に相当する項目を表示しておき、各々1項目ずつ(例えば「VLD Map」と「VLD Sector」を)選択する。なお、S306の場合と同様に、複数の計測対象領域が選択され、かつ一方の領域に対する計測の種類が変更された場合は他方の領域に対しても同じ計測の種類が連動して適用され、計測が実行される。また計測対象領域を設定しない(「None」を選択する)指示に関しては、他方の計測対象領域に対して連動して適用されないものとする。
For example, items corresponding to the
また、表示部104に表示されたモーションコントラスト画像や、抽出部101-462や計測部101-463によって生成された血管領域や血管中心線に関する2値画像、計測値や計測マップを外部記憶部102にファイルとして出力し、保存してもよい。なお、比較観察を容易にするため、ファイル出力するモーションコントラスト画像、血管領域や血管中心線に関する2値画像、計測値マップの画像サイズや画素サイズは同一にすることが望ましい。
In addition, the motion contrast image displayed on the
さらに、単検査に対する計測の場合と同様の方法で(詳細はS830で説明する)、所定の条件を満たさない状態で実施された計測結果を計測レポート画面に表示する際には警告メッセージを表示してよい。なお推奨条件としてはS830で示した条件に限定されるものではなく、例えば「選択した経時変化計測対象画像間で略同一位置における取得断層画像数もしくはモーションコントラスト画像の合成条件もしくは画質指標値の相違が所定値未満であること」を推奨条件として設定し、該条件を満たさない場合に警告表示してもよい。 Furthermore, in the same manner as in the case of measurement for a single test (details will be explained in S830), a warning message is displayed when displaying the measurement results on the measurement report screen when the measurement results are performed in a state where the predetermined conditions are not met. you can Note that the recommended conditions are not limited to the conditions shown in S830. is less than a predetermined value" may be set as a recommended condition, and a warning may be displayed if the condition is not met.
<ステップ312>
画像処理装置101はS301からS312に至る一連の処理を終了するか否かの指示を外部から取得する。この指示は入力部103を介して操作者により入力される。処理終了の指示を取得した場合は処理を終了する。一方、処理継続の指示を取得した場合にはS302に処理を戻し、次の披検眼に対する処理(または同一披検眼に対する再処理を)行う。
<Step 312>
The
さらに、図5(a)に示すフローチャートを参照しながら、S307で実行される処理の詳細について説明する。 Furthermore, the details of the processing executed in S307 will be described with reference to the flowchart shown in FIG.
<ステップ510>
強調部101-461は、ステップ306の前処理を実施されたモーションコントラスト画像に対してヘッセ行列の固有値に基づく血管強調フィルタ処理を行う。このような強調フィルタはヘシアンフィルタと総称され、例えばVesselness filterやMulti-scale line filterが挙げられる。本実施形態ではMulti-scale line filterを用いるが、任意の公知の血管強調フィルタを用いてよい。
<Step 510>
The enhancement unit 101-461 performs vessel enhancement filter processing based on the eigenvalues of the Hessian matrix on the motion contrast image preprocessed in step 306. FIG. Such enhancement filters are collectively called Hessian filters, and include, for example, Vesselness filters and multi-scale line filters. Although a multi-scale line filter is used in this embodiment, any known blood vessel enhancement filter may be used.
ヘシアンフィルタは強調したい血管の径に適したサイズで画像を平滑化した上で、該平滑化画像の各画素において輝度値の2次微分値を要素として持つヘッセ行列を算出し、該行列の固有値の大小関係に基づいて局所構造を強調する。ヘッセ行列は式(3)で与えられるような正方行列であり、該行列の各要素は例えば式(4)に示すような画像の輝度値Iを平滑化した画像の輝度値Isの2次微分値で表される。ヘシアンフィルタでは、このようなヘッセ行列の「固有値(λ1、λ2)の一方が0に近く、他方が負かつ絶対値が大きい」場合に線状構造とみなして強調する。これはモーションコントラスト画像上の血管領域が持つ特徴、すなわち「走行方向では輝度変化が小さく、走行方向に直交する方向では輝度値が大きく低下する」が成り立つ画素を線状構造とみなして強調することに相当する。 The Hessian filter smoothes the image with a size suitable for the diameter of the blood vessel to be emphasized, calculates the Hessian matrix having the secondary differential value of the luminance value in each pixel of the smoothed image as an element, and the eigenvalue of the matrix Emphasize the local structure based on the magnitude relationship of The Hessian matrix is a square matrix as given by Equation (3), and each element of the matrix is the second derivative of the brightness value Is of the smoothed image brightness value I as shown in Equation (4), for example. represented by a value. In the Hessian filter, when "one of the eigenvalues (λ1, λ2) of such a Hessian matrix is close to 0 and the other is negative and has a large absolute value", it is regarded as a linear structure and emphasized. This is done by regarding pixels that have a feature of the blood vessel region on the motion contrast image, that is, that the brightness change is small in the running direction and that the brightness value decreases greatly in the direction perpendicular to the running direction, as a linear structure and is emphasized. corresponds to
またモーションコントラスト画像には毛細血管から細動静脈まで様々な径の血管が含まれることから、複数のスケールでガウスフィルタにより平滑化した画像に対してヘッセ行列を用いて線強調画像を生成する。次に式(5)に示すようにガウスフィルタの平滑化パラメータσの二乗を補正係数として乗じた上で最大値演算により合成し、該合成画像Ihessianをヘシアンフィルタの出力とする。 In addition, since motion contrast images contain blood vessels with various diameters from capillaries to arterioles and veins, line-enhanced images are generated using Hessian matrices for images smoothed by Gaussian filters on multiple scales. Next, as shown in equation (5), the correction coefficient is multiplied by the square of the smoothing parameter σ of the Gaussian filter, and then synthesized by calculating the maximum value. The synthesized image Ihessian is the output of the Hessian filter.
ヘシアンフィルタはノイズに強く、血管の連続性が向上するという利点がある。一方で実際には事前に画像に含まれる最大血管径が不明の場合が多いため、特に平滑化パラメータが画像中の最大血管径に対して大きすぎる場合に強調された血管領域が太くなりやすいという欠点がある。 The Hessian filter has the advantage of being resistant to noise and improving the continuity of blood vessels. On the other hand, in many cases, the maximum blood vessel diameter included in the image is unknown in advance, so when the smoothing parameter is too large for the maximum blood vessel diameter in the image, the emphasized blood vessel region tends to become thicker. There are drawbacks.
そこで、本実施形態ではS530で述べる別の血管強調手法で血管領域を強調した画像と演算することにより、血管領域が太くなりすぎることを防止する。 Therefore, in the present embodiment, the blood vessel region is prevented from becoming too thick by computing with an image in which the blood vessel region is emphasized by another blood vessel enhancement method described in S530.


<ステップ520>
抽出部101-462は、S510で生成したヘシアンフィルタによる血管強調画像(以下、ヘシアン強調画像と表記)を2値化する。
<Step 520>
The extraction unit 101-462 binarizes the blood vessel-enhanced image generated in S510 by the Hessian filter (hereinafter referred to as the Hessian-enhanced image).
ヘシアン強調画像の輝度統計値(平均値や中央値等)を閾値として2値化する場合、例えば視神経乳頭部では大血管の高輝度領域の影響を受けて閾値が高くなり、乳頭周囲毛細血管(RPC; Radial Peripapillary Capillary)の抽出不足が生じる場合がある。また、網膜深層のような無血管領域の拡大が生じやすい領域においては、閾値が低すぎて無血管領域を血管として誤検出する場合がある。 When binarizing the brightness statistics (average, median, etc.) of the Hessian-enhanced image as a threshold, for example, in the optic papilla, the threshold becomes high due to the influence of the high-brightness region of the large vessels, and the peripapillary capillaries ( Under-extraction of the RPC (Radial Peripheral Capillary) may occur. In addition, in a region such as the deep layer of the retina where the avascular region tends to expand, the threshold may be too low and the avascular region may be erroneously detected as a blood vessel.
そこで、本実施形態では低スケールの強調画像のみで合成したヘシアン強調画像の平均値を閾値とすることで視神経乳頭部において閾値が高くなりすぎることを防ぐ。また該閾値の下限値を設定することにより無血管領域における誤検出を抑制する。 Therefore, in the present embodiment, the average value of the Hessian-enhanced image synthesized only from the low-scale enhanced images is used as the threshold to prevent the threshold from becoming too high in the optic papilla. By setting the lower limit of the threshold, erroneous detection in an avascular region is suppressed.
ここで、視神経乳頭部で閾値が高くなりすぎるのを防止する方法としては、低スケールの強調画像の統計値を閾値として2値化することに限定されない。例えば、ヘシアン強調画像上の輝度値が所定値以上である場合に所定値であるとみなした場合の平均値を閾値として2値化しても同等の効果が期待できる。あるいは、例えばM-estimatorのようなロバスト推定値を閾値として2値化してもよい。 Here, the method for preventing the threshold from becoming too high in the optic papilla is not limited to binarization using the statistical value of the low-scale enhanced image as the threshold. For example, if the luminance value on the Hessian-enhanced image is equal to or greater than a predetermined value, the same effect can be expected by using the average value as a threshold for binarization. Alternatively, binarization may be performed using a robust estimation value such as M-estimator as a threshold.
また、本実施形態では合成モーションコントラスト画像をヘシアンフィルタで強調しているため、単独のモーションコントラスト画像をヘシアンフィルタで強調する場合に比べて2値化した血管領域の連続性がさらに向上する。 In addition, in this embodiment, since the composite motion contrast image is enhanced with the Hessian filter, the continuity of the binarized blood vessel region is further improved compared to the case where the single motion contrast image is enhanced with the Hessian filter.
<ステップ530>
強調部101-461は、S306で生成したトップハットフィルタ適用後の合成モーションコントラスト画像に対してエッジ選択鮮鋭化処理を行う。
<Step 530>
The enhancement unit 101-461 performs edge selective sharpening processing on the synthetic motion contrast image after application of the top hat filter generated in S306.
ここで、エッジ選択鮮鋭化処理とは画像のエッジ部分に重みを大きく設定した上で重みづけ鮮鋭化処理を行うことを指す。本実施形態では、前記合成モーションコントラスト画像に対してSobelフィルタを適用した画像を重みとしてアンシャープマスク処理を行うことにより、エッジ選択鮮鋭化処理を実施する。 Here, the edge selective sharpening process refers to weighting and sharpening process after setting a large weight to the edge portion of the image. In the present embodiment, edge selective sharpening processing is performed by performing unsharp mask processing on the synthesized motion contrast image using an image obtained by applying a Sobel filter as a weight.
小さなフィルタサイズで鮮鋭化処理を実施すると、細い血管のエッジが強調され2値化した際により正確に血管領域を特定できる(血管領域が太くなる現象を防止できる)。一方で特に同一撮影位置での断層像数が少ないモーションコントラスト画像の場合にはノイズが多いため、特に血管内のノイズも一緒に強調してしまう恐れがある。そこで、エッジ選択鮮鋭化を行うことによってノイズの強調を抑制する。 When the sharpening process is performed with a small filter size, the edge of a thin blood vessel is emphasized and the blood vessel region can be specified more accurately when binarized (the phenomenon that the blood vessel region becomes thicker can be prevented). On the other hand, especially in the case of a motion contrast image in which the number of tomographic images at the same imaging position is small, there is a lot of noise. Therefore, noise enhancement is suppressed by performing edge selective sharpening.
<ステップ540>
抽出部101-462は、S530で生成したエッジ選択鮮鋭化処理を適用した鮮鋭化画像を2値化する。任意の公知の2値化法を用いてよいが、本実施形態では該鮮鋭化画像上の各局所領域内で算出した輝度統計値(平均値もしくは中央値)を閾値として2値化する。
<Step 540>
The extraction unit 101-462 binarizes the sharpened image to which the edge selective sharpening process generated in S530 is applied. Although any known binarization method may be used, in the present embodiment binarization is performed using the brightness statistic value (average value or median value) calculated in each local region on the sharpened image as a threshold.
ただし、視神経乳頭部の大血管領域においては設定される閾値が高すぎて2値画像上の血管領域内に多数の穴が空くため、上記閾値の上限値を設定することにより特に視神経乳頭部において閾値が高くなりすぎるのを防止する。 However, in the large blood vessel region of the optic nerve head, the set threshold is too high and many holes are formed in the blood vessel region on the binary image. Prevent the threshold from being too high.
また、S520の場合と同様に画像中に無血管領域が占める割合が大きい場合には閾値が低すぎて無血管領域の一部を血管として誤検出する場合が生じる。そこで、上記閾値の下限値を設定することにより誤検出を抑制する。 Also, as in the case of S520, when the proportion of the avascular region in the image is large, the threshold value is too low, and a part of the avascular region may be erroneously detected as a blood vessel. Therefore, erroneous detection is suppressed by setting the lower limit of the threshold.
なお、S520の場合と同様に合成モーションコントラスト画像をエッジ選択鮮鋭化しているため、単独のモーションコントラスト画像をエッジ選択鮮鋭化する場合に比べて2値化した場合のノイズ状の誤検出領域をより減らすことができる。 As in the case of S520, since the composite motion contrast image is edge-selectively sharpened, the noise-like erroneous detection area in the case of binarization is more reduced than in the case of edge-selective sharpening of a single motion contrast image. can be reduced.
<ステップ550>
抽出部101-462は、S520で生成したヘシアン強調画像の2値画像の輝度値と、S540で生成したエッジ選択鮮鋭化画像の2値画像の輝度値の双方が0より大きい場合に血管候補領域として抽出する。当該演算処理により、ヘシアン強調画像に見られる血管径を過大評価している領域と、エッジ選択鮮鋭化画像上に見られるノイズ領域がともに抑制され、血管の境界位置が正確かつ血管の連続性が良好な2値画像を取得できる。
<Step 550>
The extraction unit 101-462 extracts the blood vessel candidate region when both the luminance value of the binary image of the Hessian-enhanced image generated in S520 and the luminance value of the binary image of the edge-selected sharpened image generated in S540 are greater than 0. Extract as This arithmetic processing suppresses both the overestimated vascular diameter area seen in the Hessian-enhanced image and the noise area seen in the edge-selected sharpened image, resulting in accurate vascular boundary positions and vascular continuity. A good binary image can be obtained.
また双方の2値画像とも合成モーションコントラスト画像に基づく2値画像であることから、単独のモーションコントラスト画像に基づく2値画像に比べて2値化した場合のノイズ状の誤検出領域が減少するとともに、特に毛細血管領域の連続性が向上する。また、合成モーションコントラスト画像であることから検査間の画質や輝度レベルも安定し、血管の抽出能が検査間で安定しやすい。 In addition, since both binary images are binary images based on the composite motion contrast image, the noise-like false detection area in the case of binarization is reduced compared to the binary image based on the single motion contrast image. , especially the continuity of the capillary region is improved. In addition, since it is a synthetic motion contrast image, the image quality and luminance level are stable between examinations, and the ability to extract blood vessels tends to be stable between examinations.
<ステップ560>
抽出部101-462は、血管領域の整形処理として2値画像のオープニング処理(収縮処理後に膨張処理を行うこと)及びクロージング処理(膨張処理後に収縮処理を行うこと)を実施する。なお、整形処理はこれに限らず例えば2値画像をラベリングした場合の各ラベルの面積に基づく小領域除去を行ってもよい。
<Step 560>
The extraction unit 101-462 performs opening processing (performing expansion processing after contraction processing) and closing processing (performing contraction processing after expansion processing) of a binary image as shaping processing of the blood vessel region. The shaping process is not limited to this, and for example, small area removal based on the area of each label when a binary image is labeled may be performed.
なお、様々な径の血管が含まれるモーションコントラスト画像において血管強調する際のスケールを適応的に決定する方法はS510~S560に述べた方法に限定されない。例えば、図5(b)のS610~S650に示すように、ヘシアン強調画像の輝度値とエッジ選択鮮鋭化による血管強調画像の輝度値を乗じる演算を適用した画像に対する輝度統計値(例えば平均値)を閾値として2値化することによって血管領域を特定してもよい。該閾値には下限値や上限値を設定できる。 Note that the method of adaptively determining the scale when enhancing blood vessels in a motion contrast image containing blood vessels of various diameters is not limited to the method described in S510 to S560. For example, as shown in S610 to S650 in FIG. 5(b), a brightness statistic value (for example, average value) for an image to which an operation of multiplying the brightness value of the Hessian-enhanced image by the brightness value of the blood vessel-enhanced image by edge selective sharpening is applied. may be used as a threshold to specify the blood vessel region. A lower limit value and an upper limit value can be set for the threshold.
あるいは、図5(c)のS710~S740に示すように、画像の固視位置や深度範囲によってヘシアンフィルタ適用時の平滑化パラメータσの範囲を適応的に変えた上でヘシアンフィルタを適用し、2値化することによって血管強調してもよい。例えば、乳頭部網膜表層ではσ=1~10、黄斑部網膜表層ではσ=1~8、黄斑部網膜深層ではσ=1~6のように設定できる。 Alternatively, as shown in S710 to S740 in FIG. 5C, the Hessian filter is applied after adaptively changing the range of the smoothing parameter σ when applying the Hessian filter according to the fixation position and depth range of the image, Blood vessels may be emphasized by binarization. For example, σ=1 to 10 for the papillary retinal surface layer, σ=1 to 8 for the macular retinal surface layer, and σ=1 to 6 for the macular retinal deep layer.
また、2値化処理は閾値処理に限定されるものではなく任意の公知のセグメンテーション手法を用いてよい。 Also, the binarization processing is not limited to threshold processing, and any known segmentation method may be used.
さらに、図6(a)に示すフローチャートを参照しながら、S308で実行される処理の詳細について説明する。 Furthermore, the details of the processing executed in S308 will be described with reference to the flowchart shown in FIG.
<ステップ810>
操作者は、入力部103を介して計測処理における関心領域を設定する。本実施形態ではS306で計測内容(計測の種類と対象領域)としてVADマップ(計測の種類がVADで、計測対象領域が画像全体)とVADセクタマップ(計測の種類がVADで、計測対象領域がETDRSグリッドに対応するセクタ領域)が選択されている。従って、関心領域として(i)画像全体(ii)固視灯位置を中心とするセクタ領域(直径1mmの内円と直径3mmの外円で規定される環状領域内をSuerior・Inferior・Nasal・Temporalの4つの扇形に分割した領域及び該内円領域)を設定する。
<Step 810>
The operator sets the region of interest in the measurement process via the
<ステップ820>
計測部101-463は、S307で得られた血管領域の2値画像に基づいて計測処理を行う。本実施形態では、該2値画像の各画素位置において当該画素を中心とした近傍領域内に占める非0画素(白画素)の割合を当該画素における血管密度(VAD)として算出する。さらに、各画素で算出した血管密度(VAD)の値を持つ画像(VADマップ)を生成する。
<Step 820>
The measurement unit 101-463 performs measurement processing based on the binary image of the blood vessel region obtained in S307. In the present embodiment, at each pixel position of the binary image, the ratio of non-zero pixels (white pixels) in a neighborhood area around the pixel is calculated as the blood vessel density (VAD) at the pixel. Furthermore, an image (VAD map) having a blood vessel density (VAD) value calculated for each pixel is generated.
また、該2値画像上の(S810で設定した)各セクタ領域における非0画素(白画素)の割合を当該セクタにおける血管密度(VAD)として算出する。さらに、各セクタ領域で算出した血管密度(VAD)の値を持つマップ(VADセクタマップ)を生成する。 Also, the ratio of non-zero pixels (white pixels) in each sector area (set in S810) on the binary image is calculated as the blood vessel density (VAD) in the sector. Furthermore, a map (VAD sector map) having values of blood vessel density (VAD) calculated in each sector area is generated.
<ステップ830>
表示制御部101-05は、計測結果としてS820で生成したVADマップ及びVADセクタマップを表示部104に表示する。本実施形態では、図9(b)の906に網膜表層のVADマップ、908に網膜深層のVADマップを表示する。さらに907に網膜表層のVADセクタマップ、909に網膜深層のVADセクタマップを重畳表示する。
<Step 830>
The display control unit 101-05 displays the VAD map and the VAD sector map generated in S820 on the
なお、本実施形態では図9(b)において実施する計測の推奨条件として
i)選択した計測対象画像の中に略同一位置における取得断層画像数が所定値以上のモーションコントラスト画像もしくは該所定値以上相当の合成モーションコントラスト画像、あるいは画質指標値(Quality Index)が所定値以上のモーションコントラスト画像に対する計測であること
ii)最大値投影で生成されたモーションコントラスト画像に対する計測であること
iii)プロジェクションアーチファクト除去処理が実施済であること
iv)網膜表層、網膜深層、放射状乳頭周囲毛細血管(RPC)が含まれる投影深度範囲、のいずれか投影深度範囲で生成されたモーションコントラスト画像に対する計測であること
を設定するものとし、上記i)~iv)の少なくとも一つを満たさない状態で実施された計測結果を計測レポート画面に表示する際には(正確に計測することが期待できないような条件で計測が行われたとみなして)警告表示を行う。
In this embodiment, the recommended conditions for the measurement to be performed in FIG. ii) measured on a motion contrast image generated by maximum intensity projection; iii) projection artifact removal. Processing has been completed iv) Set to be measurement for a motion contrast image generated in any of the projection depth ranges including the superficial retinal layer, the deep retinal layer, and the radial peripapillary capillaries (RPC). However, when displaying the measurement results on the measurement report screen when at least one of the above i) to iv) is not satisfied (measurement is performed under conditions that cannot be expected to be measured accurately) be deemed to have been broken) and display a warning.
例えば、i)を満たさない状態で計測された結果を表示する際には、図9(b)の右下部に「Averaged OCTA is recommended in calculating VAD or VLD.」のように警告メッセージを表示すればよい。(例えば、図12の右下部) For example, when displaying the results measured in a state where i) is not satisfied, a warning message such as "Averaged OCTA is recommended in calculating VAD or VLD." good. (For example, the lower right part of FIG. 12)
また、ii)を満たさない状態で計測された結果を表示する際には、図9(b)の右下部に「MIP is recommended in calculating VAD or VLD.」のように警告メッセージを表示すればよい。 Also, when displaying the results measured in a state where ii) is not satisfied, a warning message such as "MIP is recommended in calculating VAD or VLD." .
同様に、iii)を満たさない状態で計測された結果を表示する際には、図9(b)の右下部に「PAR is recommended in calculating VAD or VLD.」のように警告メッセージを表示すればよい。 Similarly, when displaying the results measured in a state where iii) is not satisfied, a warning message such as "PAR is recommended in calculating VAD or VLD." good.
さらに、iv)を満たさない状態で計測された結果を表示する際には「Superficial Capillary, Deep Capillary, RPC can be analyzed in calculating VAD or VLD.」のように警告メッセージを表示する。該警告メッセージを表示することで、推奨する計測条件を満たさない計測により得られた計測結果は信頼性の低い計測結果となるリスクがあることを周知するとともに、推奨する計測条件を示すことで、より信頼性の高い計測を実施しやすくする。 Furthermore, when displaying the results measured in a state where iv) is not satisfied, a warning message such as "Superficial Capillary, Deep Capillary, RPC can be analyzed in calculating VAD or VLD." is displayed. By displaying the warning message, there is a risk that measurement results obtained by measurements that do not meet the recommended measurement conditions will result in unreliable measurement results. Facilitate more reliable measurements.
なお、レポート画面を多数の警告メッセージが占めるのを避けるために上記推奨条件に優先順位を付け(例えば、i)を最優先、ii)を2番目、iii)を3番目、iv)を4番目に重要な条件とし)満たされていない推奨条件のうち最も優先度の高い条件に関する警告表示を行うよう構成してもよい。また図9(b)のように複数の計測結果を表示する場合には、個別の計測に対して各々警告メッセージを表示してもよいし、表示対象の警告メッセージのうち最も優先度の高い警告メッセージのみ表示させるようにしてもよい。あるいは、計測結果の信頼性に影響が大きい条件を理解しやすくしつつ満たされていない条件に関する警告を漏れなく表示するために、満たされていない計測条件に関する警告を優先順位が識別可能な態様で(色や大きさ等を変えて)表示部104に表示してもよい。複数の計測結果を表示する場合の例として、レポート画面の上下段に各々計測結果を表示する場合や、同一画像に対し複数の計測対象領域を設定して計測した結果を表示する場合が挙げられる。 In order to avoid a large number of warning messages occupying the report screen, the above recommended conditions are prioritized (for example, i) is the highest priority, ii) is the second, iii) is the third, and iv) is the fourth. It may be configured to display a warning regarding the highest priority condition among the recommended conditions that are not satisfied (as important conditions for the system). When displaying a plurality of measurement results as shown in FIG. 9B, a warning message may be displayed for each individual measurement, or the warning message with the highest priority among the warning messages to be displayed may be displayed. Only the message may be displayed. Alternatively, in order to display all warnings related to unsatisfied conditions while making it easy to understand conditions that greatly affect the reliability of measurement results, warnings related to unsatisfied measurement conditions are displayed in a manner in which the priority can be identified. It may be displayed on the display unit 104 (with different colors, sizes, etc.). Examples of displaying multiple measurement results include displaying each measurement result in the upper and lower rows of the report screen, and displaying the results of measurement by setting multiple measurement target areas for the same image. .
なお、警告メッセージは同一のレポート画面内に表示してもよいし、別画面として表示してもよい。また警告メッセージは文字列に限定されるものではなく静止画像や動画像を表示部104に表示したり、音声として出力したりしてもよい。該警告メッセージが表示されたレポート画面をファイル出力したり、印刷出力したりする場合も本発明に含まれる。
Note that the warning message may be displayed within the same report screen, or may be displayed as a separate screen. Moreover, the warning message is not limited to a character string, and a still image or a moving image may be displayed on the
さらに、表示部104に表示された警告メッセージのうち消去する警告メッセージを操作者が入力部103を用いて選択可能にしたり、警告の優先順位の変更や表示対象外とする警告メッセージの指定を行うためのユーザインターフェースを備えたりしてもよい。
Furthermore, the operator can use the
上記では血管密度としてVADを計測する場合の手順を例に説明したが、計測値としてVLDマップやVLDセクタマップを生成する場合は、上記S810~830の代わりに図6(b)に示すS840~870を実行する。 In the above, the procedure for measuring the VAD as the blood vessel density has been described as an example. 870 is executed.
<ステップ840>
計測部101-463は、S307で生成した血管領域の2値画像を細線化処理することにより、血管の中心線に相当する線幅1画素の2値画像(以下、スケルトン画像と表記)を生成する。任意の細線化法もしくはスケルトン処理を用いてよいが、本実施形態では細線化法としてHilditchの細線化法を用いる。
<Step 840>
The measurement unit 101-463 generates a binary image (hereinafter referred to as a skeleton image) with a line width of 1 pixel corresponding to the center line of the blood vessel by thinning the binary image of the blood vessel region generated in S307. do. Any thinning method or skeleton process may be used, but in this embodiment, Hilditch's thinning method is used as the thinning method.
<ステップ850>
操作者は、入力部103を介してS810と場合と同様の関心領域を設定する。本実施形態では計測内容(計測の種類と対象領域)としてVLDマップとVLDセクタマップを算出するものとし、S810ではVADが選択されていたのに対し、本ステップではVLDが選択されていることが異なるだけである。なお、VLDマップもしくはVLDセクタマップをモーションコントラスト画像上に重畳表示したくない場合は、図9(a)のMapもしくはSectorの項目を「None」に設定すればよい。
<Step 850>
The operator sets the region of interest via the
<ステップ860>
計測部101-463はS840で得られたスケルトン画像に基づいて計測処理を行う。本実施形態では、該スケルトン画像の各画素位置において当該画素を中心とした近傍領域における単位面積当たりの非0画素(白画素)の長さの総和[mm-1]を当該画素における血管密度(VLD)として算出する。さらに、各画素で算出した血管密度(VLD)の値を持つ画像(VLDマップ)を生成する。
<Step 860>
The measurement unit 101-463 performs measurement processing based on the skeleton image obtained in S840. In this embodiment, at each pixel position of the skeleton image, the sum [mm −1 ] of the length of non-zero pixels (white pixels) per unit area in a neighboring area centering on the pixel is calculated as the blood vessel density ( VLD). Furthermore, an image (VLD map) having a blood vessel density (VLD) value calculated for each pixel is generated.
また、該スケルトン画像上の(S850で設定した)各セクタ領域における単位面積当たりの非0画素(白画素)の長さの総和[mm-1]を当該セクタにおける血管密度(VLD)として算出する。さらに、各セクタ領域で算出した血管密度(VLD)の値を持つマップ(VLDセクタマップ)を生成する。 In addition, the sum [mm −1 ] of the length of non-zero pixels (white pixels) per unit area in each sector area (set in S850) on the skeleton image is calculated as the blood vessel density (VLD) in the sector. . Furthermore, a map (VLD sector map) having values of blood vessel density (VLD) calculated in each sector area is generated.
<ステップ870>
表示制御部101-05は、計測結果としてS860で生成したVLDマップ及びVLDセクタマップを図9(b)の906・907もしくは908・909に表示する。
<Step 870>
The display control unit 101-05 displays the VLD map and the VLD sector map generated in S860 as the measurement results on 906/907 or 908/909 in FIG. 9(b).
なお、S830の場合と同様に、所定の解析に適した条件を満たさない状態で実施された計測結果を計測レポート画面に表示する際には表示部104に警告メッセージを表示するものとする。
Note that, as in the case of S830, a warning message is displayed on the
また本実施形態では単検査での血管領域特定及び計測結果の表示法として正面モーションコントラスト画像上に計測マップを重畳表示する場合について説明したが、これに限定されるものではない。例えば、特定された血管領域の2値画像やスケルトン画像を図9(b)の906や908に表示させてもよい。あるいは、906や908にモーションコントラスト画像を表示しておき、その上に特定された血管領域の2値画像もしくはスケルトン画像を色もしくは透明度を適宜調整した上で重畳表示するよう構成する場合も本発明に含まれる。また2値画像は正面画像として表示することに限定されず、例えばBスキャン断層画像上に特定された血管領域の2値画像もしくはスケルトン画像を色もしくは透明度を適宜調整した上で重畳表示してもよい。 In addition, in the present embodiment, a method of displaying a blood vessel region identification and a measurement result in a single examination has been described in which a measurement map is superimposed and displayed on a frontal motion contrast image, but the present invention is not limited to this. For example, a binary image or skeleton image of the identified blood vessel region may be displayed in 906 and 908 in FIG. 9B. Alternatively, a motion contrast image may be displayed in 906 or 908, and a binary image or skeleton image of the specified blood vessel region may be superimposed thereon after appropriately adjusting the color or transparency. include. The binary image is not limited to being displayed as a front image. For example, a binary image or a skeleton image of the blood vessel region specified on the B-scan tomographic image may be displayed superimposed after appropriately adjusting the color or transparency. good.
なお、S309で操作者が入力部103から血管領域もしくは血管中心線データを修正するよう指示を入力した場合には以下のような手順で修正する。
If the operator inputs an instruction from the
すなわち、図10(a)に示すような合成モーションコントラスト画像に対して同図(c)に示すような過抽出領域を含む2値画像が得られた場合に、操作者が入力部103を経由して指定した位置の白画素を解析部101-46が削除する。追加/削除位置の指定方法の例としては、例えば削除の場合は「d」キーを押しながら、追加の場合は「a」キーを押しながらマウスでクリックする方法が挙げられる。あるいは、同図(d)に示すようにモーションコントラスト画像に基づく画像上に修正対象である2値画像(血管領域もしくは血管中心線)の色や透明度を調整して重畳表示し、過抽出もしくは抽出不足の領域が判別しやすい状態にしておく。同図(d)の矩形領域1002内を拡大した画像を同図(e)に示す。灰色が過抽出した領域で、白色が元のモーションコントラスト画像の脱相関値を示す。該過抽出/抽出不足の領域を操作者が入力部103を用いて指定することにより、正確かつ効率的に2値画像上の血管もしく血管中心線領域を修正するよう構成してもよい。なお、2値画像の修正処理は正面画像に限定されない。例えば図9(a)の910に示すような任意のスライス位置のBスキャン断層像上にモーションコントラストデータや血管領域の2値データもしくは血管中心線領域を色や透明度の調整後に重畳する。このように過抽出もしくは抽出不足の領域が判別しやすい状態にした上で、操作者が修正(追加/削除)する2値データの3次元位置(x,y,z座標)を入力部103により指定して修正してもよい。
That is, when a binary image including an over-extracted region as shown in FIG. The analysis unit 101-46 deletes the white pixel at the position designated by the As an example of the method of specifying the addition/deletion position, for example, a method of clicking with a mouse while pressing the "d" key for deletion and pressing the "a" key for addition can be mentioned. Alternatively, as shown in Fig. 4(d), a binary image (blood vessel region or blood vessel center line) to be modified is displayed superimposed on an image based on the motion contrast image by adjusting the color and transparency to over-extract or extract the image. Make it easy to identify the missing area. An enlarged image of the inside of the
さらに、2値画像(血管領域の2値画像もしくはスケルトン画像)が修正済であることを示す情報もしくは修正位置に関する情報を該2値画像と関連付けて外部記憶部102に保存しておき、S870もしくはS311で血管特定結果及び計測結果を表示部104に表示する際に該修正済であることを示す情報もしくは修正位置に関する情報を表示部104に表示してもよい。
Further, information indicating that the binary image (binary image or skeleton image of the blood vessel region) has been corrected or information regarding the corrected position is stored in the
また、本実施形態では合成部101-42が繰り返しOCTA撮影終了時に合成モーションコントラスト画像を生成する場合について説明したが、合成モーションコントラスト画像の生成手順はこれに限定されない。例えば図8(e)のレポート画面803上に合成モーションコントラスト画像生成指示ボタン812を配置しておく。OCTA撮影完了後(撮影日より後の日でもよい)に操作者が明示的に該生成指示ボタン812を押下した場合に合成部101-42が合成モーションコントラスト画像を生成するよう画像処理装置101を構成してもよい。操作者が明示的に合成画像生成指示ボタン812を押下して合成画像を生成する場合、図8(e)に示すようなレポート画面803上に合成モーションコントラスト画像804や合成条件データ、検査画像リスト上に合成画像に関する項目を表示させる。
Also, in the present embodiment, a case has been described in which the combining unit 101-42 generates a composite motion contrast image at the end of repeated OCTA imaging, but the procedure for generating a composite motion contrast image is not limited to this. For example, a synthetic motion contrast image
また操作者が明示的に該生成指示ボタン812を押下する場合は、表示制御部101-05が以下の処理を行う。すなわち、合成対象画像選択画面を表示させ、操作者が入力部103を操作して合成対象画像群を指定し、許容ボタンを押下した場合に合成部101-42が合成モーションコントラスト画像を生成し、表示部104に表示させる。なお、生成済の合成モーションコントラスト画像を選択して合成する場合も本発明に含まれる。
When the operator explicitly presses the
また操作者が合成画像生成指示ボタン812を押下した場合、3次元モーションコントラスト画像を投影した2次元画像同士を合成することにより2次元合成画像を生成してもよいし、3次元合成画像を生成後に投影することで2次元合成画像を生成してもよい。
Further, when the operator presses the composite image
以上述べた構成によれば、画像処理装置101は同一被検眼に対して異なる日時に略同一撮影条件で取得したOCTA重ね合わせ画像から生成した網膜表層及び網膜深層の正面モーションコントラスト画像を用いて血管領域特定及び血管密度計測処理を実施する。該特定処理及び計測処理により得られた合成画像及び計測値を複数の深度範囲で時系列並置表示する。これにより、例えば、検査ごとのOCT断層画像の信号強度や画質のばらつきの影響を抑制しながら、血管病態(血管閉塞・新生血管・血管瘤等)の変化を正確に特定・計測できる。また、1枚のOCTA画像に対して解析することにより、例えば、血管病変の分布を定量的に把握することができる。
According to the configuration described above, the
[第二実施形態]
本実施形態に係る画像処理装置の一つは、第一実施形態における血管領域特定及び計測処理を3次元で実施し、得られた画像及び計測データ(血管領域や血管中心線・計測データ)を時系列で並置表示するよう構成したものである。
[Second embodiment]
One of the image processing apparatuses according to the present embodiment executes the vascular region identification and measurement processing in the first embodiment in three dimensions, and converts the obtained image and measurement data (blood vessel region, blood vessel center line, and measurement data) into It is configured to be displayed side by side in chronological order.
具体的には、脈絡膜新生血管(CNV;Choroidal NeoVasucularization)を含む3次元の合成モーションコントラスト画像に対してモーションアーチファクト抑制処理を実施する。次に3次元のモルフォロジーフィルタ及び血管強調フィルタを適用し、2値化することにより3次元でCNVを含む血管領域を特定する。さらに網膜表層及び網膜深層で算出した血管密度と、網膜外層で特定及び計測した脈絡膜新生血管領域の2値画像及び体積値を時系列表示する場合について説明する。 Specifically, motion artifact suppression processing is performed on a three-dimensional synthetic motion contrast image including choroidal neovascularization (CNV). Next, a three-dimensional morphology filter and a blood vessel enhancement filter are applied, and binarization is performed to identify the blood vessel region containing the CNV in three dimensions. Furthermore, a case will be described in which blood vessel densities calculated in the superficial layer and deep layer of the retina and binary images and volume values of the choroidal neovascular region specified and measured in the outer retina are displayed in chronological order.
本実施形態に係る画像処理装置101を備える画像処理システム10の構成及び画像処理フローは第一実施形態の場合と同様であるので省略する。
The configuration and image processing flow of the
また、本実施形態での画像処理フローのうち図3のS306~S308、S310~S311以外は第一実施形態の場合と同様であるので説明は省略する。 Also, the image processing flow of this embodiment is the same as that of the first embodiment except for S306 to S308 and S310 to S311 in FIG. 3, so description thereof will be omitted.
<ステップ306>
操作者が入力部103を用いてOCTA計測処理の開始を指示する。
<Step 306>
The operator uses the
本実施形態では図8(e)のレポート画面803のモーションコントラスト画像上をダブルクリックすることで、図9(a)のようなOCTA計測画面に移行する。モーションコントラスト画像が拡大表示され、適宜画像投影法の種類(最大値投影(MIP)もしくは平均値投影(AIP))や投影深度範囲、プロジェクションアーチファクト除去処理の実施の有無を選択する。次に、図9(a)右側のMapボタン群902、Sectorボタン群903、Measurementボタン904経由で表示される選択画面905、の中から操作者が適切な項目を選択することで計測の種類と対象領域を選択し、解析部101-46が計測処理を開始する。
In this embodiment, by double-clicking on the motion contrast image on the
計測処理の種類として、本実施形態ではMapボタン群もしくはSectorボタン群から
i)None(計測しない)
ii)VAD(血管が占める面積に基づいて算出される血管密度)
iii)VLD(血管の長さの総和に基づいて算出される血管密度)
iv)Volume(血管領域の体積)
のいずれかを選択する。これに限らず任意の種類の計測を実施してよい。
As the type of measurement processing, in this embodiment, i) None (no measurement) from the Map button group or the Sector button group
ii) VAD (vessel density calculated based on area occupied by vessels)
iii) VLD (vessel density calculated based on sum of vessel lengths)
iv) Volume (volume of blood vessel area)
Choose one. Any type of measurement may be performed without limitation.
例えば、iv)のVolumeの代わりに(2次元モーションコントラスト画像上で特定したり、特定した3次元血管領域を所定の深度範囲(例えば網膜外層)で投影したりして得られる)血管領域(例えば脈絡膜毛細血管)の面積を計測する場合も本発明に含まれる。 For example, instead of iv) Volume (obtained by specifying it on a two-dimensional motion contrast image or projecting the specified three-dimensional blood vessel region in a predetermined depth range (for example, the outer layer of the retina)) blood vessel region (for example, The present invention also includes the case of measuring the area of choroidal capillaries.
また、Measurementボタン経由で表示される選択画面からは
i)無血管領域の面積計測
ii)血管密度(VAD)
iii)血管密度(VLD)
iv)血管領域の体積(Volume)
のいずれかを選択する。これに限らず、例えば(2次元モーションコントラスト画像上で特定したり、特定した3次元血管領域を所定の深度範囲(例えば網膜外層)で投影したりして得られる)血管領域(例えば脈絡膜毛細血管)の面積を計測してもよい。
In addition, from the selection screen displayed via the Measurement button, i) Area measurement of avascular region ii) Blood vessel density (VAD)
iii) vascular density (VLD)
iv) Volume of blood vessel region
Choose one. Not limited to this, for example (obtained by specifying on a two-dimensional motion contrast image or projecting the specified three-dimensional blood vessel region in a predetermined depth range (for example, the outer layer of the retina)) blood vessel region (for example, choroidal capillaries ) may be measured.
なお、3次元画像処理による計測は大きく
1)3次元で強調し、2次元投影した該強調画像上で特定した血管領域もしくは血管中心線データに対する2次元計測
2)3次元で強調及び特定した血管領域もしくは血管中心線データを投影した場合の2次元計測
3)3次元で強調及び特定された血管領域もしくは血管中心線データに対する3次元計測
に大別できる。
1) Two-dimensional measurement of the blood vessel region or blood vessel center line data specified on the enhanced image that is three-dimensionally enhanced and two-dimensionally projected 2) Three-dimensionally enhanced and specified blood vessel Two-dimensional measurement when region or blood vessel center line data is projected 3) Three-dimensional measurement of three-dimensionally emphasized and specified blood vessel region or blood vessel center line data can be roughly classified.
1)及び2)の例として、投影画像上で上記無血管領域の面積や血管密度、血管領域の面積や径、長さ、曲率を計測することが挙げられる。計測内容は正面モーションコントラスト画像に対する計測と同様であるものの、正面モーションコントラスト画像を強調・特定して計測する場合よりも血管抽出能が向上するため計測精度が向上する。 Examples of 1) and 2) include measuring the area and blood vessel density of the avascular region and the area, diameter, length, and curvature of the blood vessel region on the projection image. Although the measurement contents are the same as the measurement for the front motion contrast image, the blood vessel extraction performance is improved compared to the case where the front motion contrast image is emphasized and specified, and the measurement accuracy is improved.
また、3)の例として
3-1)血管の体積計測
3-2)任意方向の断面画像もしくは曲断面画像上の計測
(血管の径もしくは断面積計測も含む)
3-3)血管の長さや曲率計測
が挙げられる。
Also, as examples of 3), 3-1) Measurement of the volume of a blood vessel 3-2) Measurement on a cross-sectional image in an arbitrary direction or a curved cross-sectional image (including measurement of the diameter or cross-sectional area of a blood vessel)
3-3) Measurement of blood vessel length and curvature.
本実施形態では、3次元で血管強調及び血管領域の特定処理を実行した後、網膜表層及び網膜深層の深度範囲で投影した各2値画像上でVAD、網膜外層の深度範囲で血管領域(脈絡膜新生血管領域)の体積を各々計測する。 なお、第一実施形態の場合と同様に、Mapボタン群から選択した計測の種類、Sectorボタン群から選択した計測の種類のいずれか一方が変更された場合に、他方も連動して(同じ計測の種類に)変更されるように構成してもよい。次に、解析部101-46は、計測処理の前処理として画像拡大及びトップハットフィルタ処理を行う。本実施形態では、いずれも3次元のBicubic補間及びトップハットフィルタ処理を実行する。 In this embodiment, after three-dimensional vascular enhancement and vascular region identification processing are performed, VAD is projected on each binary image projected in the depth range of the superficial and deep retina, and the vascular region (choroid The volume of each neovascular area) is measured. As in the case of the first embodiment, when either one of the measurement type selected from the Map button group and the measurement type selected from the Sector button group is changed, the other is also linked (same measurement type) may be configured to be changed. Next, the analysis unit 101-46 performs image enlargement and top hat filter processing as preprocessing for measurement processing. In this embodiment, both three-dimensional Bicubic interpolation and top-hat filtering are performed.
<ステップ307>
解析部101-46が血管領域の特定処理を行う。本実施形態では、強調部101-461が3次元ヘシアンフィルタ及び3次元エッジ選択鮮鋭化フィルタ処理に基づく血管強調処理を行う。次に抽出部101-462が第一実施形態の場合と同様に2種類の血管強調画像を用いて2値化処理を行い、整形処理を行うことで血管領域を特定する。血管領域特定処理の詳細はS510~S560で説明する。
<Step 307>
The analysis unit 101-46 performs processing for identifying the blood vessel region. In this embodiment, the enhancement unit 101-461 performs vessel enhancement processing based on a three-dimensional Hessian filter and three-dimensional edge selective sharpening filter processing. Next, the extraction unit 101-462 performs binarization processing using the two types of blood vessel-enhanced images as in the first embodiment, and performs shaping processing to specify the blood vessel region. The details of the blood vessel region specifying process will be explained in S510 to S560.
<ステップ308>
計測部101-463が、操作者により指定された計測対象領域に関する情報に基づいて単検査の画像に対する計測を行う。引き続いて表示制御部101-05が、計測結果を表示部104に表示する。なお、第一実施形態の場合と同様に、所定の解析に適した条件を満たさない状態で実施された計測結果を計測レポート画面に表示する際には表示部104に警告メッセージを表示するものとする。また、操作者が入力部103から血管領域もしくは血管中心線データを修正するよう指示を入力した場合には、第一実施形態の場合と同様に解析部101-46が操作者から入力部103を介して指定された位置情報に基づいて血管領域もしくは血管中心線データを修正し、計測値を再計算する。網膜表層及び網膜深層におけるVAD計測、網膜外層における脈絡膜新生血管の体積計測についてはS810~S830、網膜表層及び網膜深層におけるVLD計測、網膜外層における脈絡膜新生血管の総血管長計測についてはS840~S870で各々説明する。
<Step 308>
The measurement unit 101-463 performs measurement on the image of the single examination based on the information regarding the measurement target area specified by the operator. Subsequently, the display control section 101-05 displays the measurement result on the
<ステップ310>
比較部101-464は、第一実施形態の場合と同様の操作で、経時変化計測(Progression計測)処理を実行する。
<Step 310>
The comparison unit 101-464 executes the time-dependent change measurement (progression measurement) process by the same operation as in the first embodiment.
<ステップ311>
表示制御部101-05は、S310で実施したProgression計測に関するレポートを表示部104に表示する。本実施形態では、Progression計測レポートの最上段に網膜表層において計測したVADマップを表示し、2段目に網膜深層において計測したVADマップ、3段目に網膜外層において計測した脈絡膜新生血管領域の
i)2値画像(もしくは該2値画像の基準画像との差分画像)
ii)体積値もしくは総血管長(もしくは該2値画像の基準画像との差分値)
を時系列で並置表示する。これに限らず、例えば4段目に脈絡膜における血管密度(VADもしくはVLD)マップを時系列で並置表示してもよい。これにより、眼底血管の3次元的な病態に関する時系列変化を一覧して把握できる。
<Step 311>
The display control unit 101-05 displays on the display unit 104 a report regarding the Progression measurement performed in S310. In this embodiment, the VAD map measured in the superficial layer of the retina is displayed at the top of the Progression measurement report, the VAD map measured in the deep layer of the retina is displayed in the second line, and the choroidal neovascular area measured in the outer layer of the retina is displayed in the third line. ) Binary image (or difference image of the binary image with the reference image)
ii) Volume value or total blood vessel length (or difference value between the binary image and the reference image)
are displayed side by side in chronological order. Not limited to this, for example, a blood vessel density (VAD or VLD) map in the choroid may be displayed side by side in chronological order on the fourth stage. As a result, time-series changes in the three-dimensional pathological condition of the fundus blood vessels can be grasped at a glance.
また、第一実施形態と同様に、各計測対象画像に関して略同一位置における断層画像数、OCTA重ね合わせ処理実施の有無、OCTA重ね合わせ処理の実施条件、OCT断層画像もしくはモーションコントラスト画像の評価値の情報を表示部104に表示させてもよい。さらに、ショートカットメニューから計測の種類及び計測対象領域に関する項目を異なる値に変更することにより、Progression計測の種類及び計測対象領域を変更して再計測できる。第一実施形態と同様に、複数の計測対象領域が選択され、かつ一方の領域に対する計測の種類が変更された場合は他方の領域に対しても同じ計測の種類が連動して適用され、計測が実行される。さらに、第一実施形態と同様の方法で、所定の条件を満たさない状態で実施された計測結果を計測レポート画面に表示する際には警告メッセージを表示してよい。
In addition, as in the first embodiment, the number of tomographic images at approximately the same position for each measurement target image, whether or not OCTA superimposition processing is performed, the conditions for performing OCTA superimposition processing, and the evaluation value of OCT tomographic images or motion contrast images. Information may be displayed on the
なお、本発明は、異なる深度範囲の正面画像及び該正面画像に対する計測値分布の時系列表示に限られるものではなく、例えば、該正面画像に直交する画像及び該正面画像に直交する画像に対する計測値分布、ボリュームレンダリングした3次元画像及び該3次元画像に対する計測値分布を時系列表示してもよい。 The present invention is not limited to front images in different depth ranges and time-series display of the measurement value distribution for the front images. The value distribution, the volume-rendered three-dimensional image, and the measurement value distribution for the three-dimensional image may be displayed in chronological order.
さらに、図5(a)に示すフローチャートを参照しながら、S307で実行される処理の詳細について説明する。 Furthermore, the details of the processing executed in S307 will be described with reference to the flowchart shown in FIG.
<ステップ510>
強調部101-461は、ステップ306の前処理を実施された3次元モーションコントラスト画像に対してヘッセ行列の固有値に基づく3次元血管強調フィルタ処理を行う。本実施形態では3次元のMulti-scale line filterを用いるが、任意の公知の血管強調フィルタを用いてよい。なお、3次元のヘシアンフィルタでは3次元画像上の各画素において算出したヘッセ行列((6)式)の「固有値(λ1、λ2、λ3)のうち1つが0に近く、残り2つが負かつ絶対値が大きい」場合に線状構造とみなして強調する。
<Step 510>
The enhancement unit 101-461 performs 3D vessel enhancement filter processing based on the eigenvalues of the Hessian matrix on the 3D motion contrast image preprocessed in step 306 . Although a three-dimensional multi-scale line filter is used in this embodiment, any known blood vessel enhancement filter may be used. In the three-dimensional Hessian filter, one of the eigenvalues (λ1, λ2, λ3) of the Hessian matrix (Equation (6)) calculated for each pixel on the three-dimensional image is close to 0, and the remaining two are negative and absolute. When the value is large, it is regarded as a linear structure and emphasized.

3次元ヘシアンフィルタを用いると、深度方向に屈曲した血管に関しても
「血管走行方向の輝度変化が小さく、血管走行方向に直交する2方向の輝度が大きく低下する」という性質が成り立つため、良好に血管強調できるという利点がある。眼底血管の中には、深度方向に屈曲した血管として例えば
・脈絡膜側から網膜内に侵入する脈絡膜新生血管(CNV)
・視神経乳頭部の血管
・網膜表層毛細血管と網膜深層毛細血管との接続部
が挙げられる。上記血管に対して正面モーションコントラスト画像上で2次元のヘシアンフィルタを適用すると、2次元平面内では「該平面内での血管走行方向の輝度変化が小さく、血管走行方向に直交する方向の輝度が大きく低下する」という性質が成り立たないため十分強調されず、血管領域として特定できないという課題がある。3次元ヘシアンフィルタを用いると上記血管についても良好に強調でき、血管検出能が向上する。
When the three-dimensional Hessian filter is used, even for blood vessels that are curved in the depth direction, the property that "the luminance change in the blood vessel running direction is small and the luminance in the two directions perpendicular to the blood vessel running direction is greatly reduced" holds true, so that the blood vessels can be detected satisfactorily. It has the advantage of being emphasized. Among the fundus blood vessels, there are blood vessels curved in the depth direction, such as ・Choroidal neovascularization (CNV) that invades the retina from the choroid side
・Vessels in the optic nerve papilla ・Connections between superficial retinal capillaries and deep retinal capillaries. When a two-dimensional Hessian filter is applied to the above-mentioned blood vessels on the frontal motion contrast image, in the two-dimensional plane, the change in brightness in the blood vessel running direction is small, and the brightness in the direction perpendicular to the blood vessel running direction is small. There is a problem that it cannot be sufficiently emphasized and cannot be specified as a blood vessel region because the property of "reduced greatly" does not hold. By using the three-dimensional Hessian filter, the blood vessels can also be favorably emphasized, improving the blood vessel detection capability.
<ステップ520>
抽出部101-462は、S510で生成した3次元ヘシアンフィルタによる血管強調画像(以下、3次元ヘシアン強調画像と表記)を2値化する。2値化の手順は第一実施形態の場合と同様であるが、3次元データの2値化であるという点が第一実施形態の場合と異なる。また、合成モーションコントラスト画像をヘシアンフィルタで強調処理した画像であるため、単独のモーションコントラスト画像をヘシアンフィルタで強調した場合に比べて2値化した血管領域の連続性が向上する。
<Step 520>
The extraction unit 101-462 binarizes the blood vessel-enhanced image generated in S510 by the three-dimensional Hessian filter (hereinafter referred to as a three-dimensional Hessian-enhanced image). The binarization procedure is the same as in the first embodiment, but differs from the first embodiment in that three-dimensional data is binarized. In addition, since the combined motion contrast image is an image obtained by performing enhancement processing with the Hessian filter, the continuity of the binarized blood vessel region is improved compared to the case where a single motion contrast image is enhanced with the Hessian filter.
<ステップ530>
強調部101-461は、S306で生成したトップハットフィルタ適用後の合成モーションコントラスト画像に対して3次元エッジ選択鮮鋭化処理を行う。本実施形態では、3次元モーションコントラスト画像に対して3次元のSobelフィルタを適用した画像を重みとして3次元のアンシャープマスク処理を行うことにより、エッジ選択鮮鋭化処理を実施する。
<Step 530>
The enhancement unit 101-461 performs a three-dimensional edge selective sharpening process on the synthesized motion contrast image after application of the top hat filter generated in S306. In the present embodiment, edge selective sharpening processing is performed by performing three-dimensional unsharp mask processing using an image obtained by applying a three-dimensional Sobel filter to a three-dimensional motion contrast image as a weight.
<ステップ540>
抽出部101-462は、S530で生成したエッジ選択鮮鋭化処理を適用した鮮鋭化画像を2値化する。任意の公知の2値化法を用いてよいが、本実施形態では該3次元鮮鋭化画像上の各3次元局所領域内で算出した輝度統計値(平均値もしくは中央値)を閾値として2値化する。第一実施形態の場合と同様に、該閾値の上限及び下限値を設定することにより、血管領域内における抽出不足や無血管領域における誤抽出を抑制する。また、S520の場合と同様、合成モーションコントラスト画像をエッジ選択鮮鋭化した画像であるため、単独のモーションコントラスト画像をエッジ選択鮮鋭化した場合に比べて2値化した場合のノイズ状の誤検出領域が減少する。
<Step 540>
The extraction unit 101-462 binarizes the sharpened image to which the edge selective sharpening process generated in S530 is applied. Any known binarization method may be used, but in the present embodiment, the brightness statistic value (average value or median value) calculated in each three-dimensional local region on the three-dimensional sharpened image is used as a threshold value for binarization. become As in the case of the first embodiment, by setting the upper and lower limits of the threshold, insufficient extraction in the blood vessel region and erroneous extraction in the non-vascular region are suppressed. In addition, as in the case of S520, since the composite motion contrast image is an image obtained by edge-selectively sharpening, the noise-like false detection area in the case of binarization compared to the case of edge-selectively sharpening a single motion contrast image decreases.
<ステップ550>
抽出部101-462は、S520で生成した3次元ヘシアン強調画像の2値画像の輝度値と、S540で生成した3次元エッジ選択強調画像の2値画像の輝度値の双方が0より大きい場合に血管候補領域として抽出する。当該演算処理により、ヘシアン強調画像に見られる血管径を過大評価している領域と、エッジ選択強調画像上に見られるノイズ領域がともに抑制され、血管の境界位置が正確かつ血管の連続性が良好な2値画像を取得できる。また、双方の2値画像とも合成モーションコントラスト画像に基づく2値画像であることから、単独のモーションコントラスト画像に基づく2値画像に比べて2値化した場合のノイズ状の誤検出領域が減少するとともに、特に毛細血管領域の連続性が向上する。また、合成モーションコントラスト画像であることから検査間の画質や輝度レベルも安定し、血管の抽出能が検査間で安定しやすい。
<Step 550>
The extraction unit 101-462 extracts the 3D Hessian-enhanced binary image generated in S520 and the 3D edge-selection-enhanced binary image generated in S540 when both the luminance values of the binary image are greater than 0. Extract as a blood vessel candidate region. This arithmetic processing suppresses both the overestimated vascular diameter area seen in the Hessian-enhanced image and the noise area seen in the edge-selection-enhanced image, resulting in accurate blood vessel boundary positions and good blood vessel continuity. binary image can be obtained. In addition, since both binary images are binary images based on the composite motion contrast image, the noise-like false detection area in the case of binarization is reduced compared to the binary image based on the single motion contrast image. At the same time, the continuity of the capillary region is particularly improved. In addition, since it is a synthetic motion contrast image, the image quality and luminance level are stable between examinations, and the ability to extract blood vessels tends to be stable between examinations.
<ステップ560>
抽出部101-462は、血管領域の整形処理として3次元のオープニング処理(収縮処理後に膨張処理を行うこと)及びクロージング処理(膨張処理後に収縮処理を行うこと)を実施する。なお、整形処理はこれに限らず2値画像をラベリングした場合の各ラベルの面積に基づく小領域除去を行ってもよい。
<Step 560>
The extraction unit 101-462 performs three-dimensional opening processing (performing expansion processing after contraction processing) and closing processing (performing contraction processing after expansion processing) as shaping processing of the blood vessel region. Note that the shaping process is not limited to this, and small area removal may be performed based on the area of each label when a binary image is labeled.
なお、第一実施形態の場合と同様に、様々な径の血管が含まれるモーションコントラスト画像において血管強調する際のスケールを適応的に決定する方法はS510~S560に述べた方法に限定されない。例えば図5(b)のS610~S650に示すように、3次元ヘシアン強調画像の輝度値と3次元エッジ選択鮮鋭化による血管強調画像の輝度値を乗じる演算を適用した画像に対する輝度統計値(例えば平均値)を閾値として2値化することによって血管領域を特定してもよい。該閾値には下限値や上限値を設定できる。あるいは、図5(c)のS710~S740に示すように、各画素の3次元位置(固視位置や深度範囲のデータでもよい)に基づいてヘシアンフィルタ適用時の平滑化フィルタのパラメータ(ガウスフィルタの平滑化パラメータσ)を適応的に変えた上でヘシアンフィルタを適用し、2値化することによって血管強調してもよい。また、2値化処理は閾値処理に限定されるものではなく任意の公知のセグメンテーション手法を用いることができる。 As in the case of the first embodiment, the method of adaptively determining the scale when enhancing blood vessels in a motion contrast image containing blood vessels of various diameters is not limited to the method described in S510 to S560. For example, as shown in S610 to S650 in FIG. 5(b), a luminance statistical value (for example, The blood vessel region may be specified by binarizing the mean value) as a threshold. A lower limit value and an upper limit value can be set for the threshold. Alternatively, as shown in S710 to S740 in FIG. 5(c), parameters of a smoothing filter (Gaussian filter After adaptively changing the smoothing parameter σ) of , a Hessian filter may be applied and binarized to enhance blood vessels. Also, the binarization processing is not limited to threshold processing, and any known segmentation method can be used.
さらに、図6(a)に示すフローチャートを参照しながら、S308で実行される処理の詳細について説明する。 Furthermore, the details of the processing executed in S308 will be described with reference to the flowchart shown in FIG.
<ステップ810>
操作者は、入力部103を介して計測処理における関心領域を設定する。
<Step 810>
The operator sets the region of interest in the measurement process via the
本実施形態では計測内容として
1)網膜表層及び網膜深層におけるVADマップ及びVADセクタマップ
2)網膜外層における脈絡膜新生血管の体積
を算出する。従って、関心領域として網膜表層及び網膜深層においては画像全体及び固視灯位置を中心とするセクタ領域を選択する。また網膜外層においては網膜外層に相当する層境界(OPL/ONL境界と、ブルッフ膜境界を該境界深層側に20μm移動させた位置で囲まれる範囲)を指定する。
In the present embodiment, as measurement contents, 1) VAD map and VAD sector map in the superficial layer and deep layer of the retina, and 2) Volume of choroidal neovascularization in the outer layer of the retina is calculated. Therefore, in the retinal surface layer and the retinal deep layer, the entire image and the sector area centering on the position of the fixation lamp are selected as the region of interest. In the outer retina, a layer boundary corresponding to the outer retina (range surrounded by the OPL/ONL boundary and the Bruch's membrane boundary moved 20 μm to the deep layer side of the boundary) is specified.
<ステップ820>
計測部101-463は、S307で得られた血管領域の2値画像に基づいて計測処理を行う。網膜表層及び網膜深層における計測内容(VADマップ及びVADセクタマップ生成)は基本的に第一実施形態と同様であるが、網膜表層及び網膜深層において特定された3次元血管領域を正面像として投影してから計測する点が異なる。網膜外層では、S810で設定した網膜外層に相当する関心領域内における非0画素(白画素)の体積を算出する。
<Step 820>
The measurement unit 101-463 performs measurement processing based on the binary image of the blood vessel region obtained in S307. The measurement contents (VAD map and VAD sector map generation) in the retinal surface layer and retinal deep layer are basically the same as in the first embodiment, but the three-dimensional blood vessel regions specified in the retinal surface layer and retinal deep layer are projected as front images. The difference is that the measurement is made from For the outer retina, the volume of non-zero pixels (white pixels) in the region of interest corresponding to the outer retina set in S810 is calculated.
<ステップ830>
表示制御部101-05は、計測結果としてS820で生成した網膜表層及び網膜深層におけるVADマップ及びVADセクタマップ、網膜外層における血管領域の2値画像と該血管領域の体積値を表示部104に表示する。なお、第一実施形態と同様の方法で、推奨する計測条件の少なくとも一つを満たさない状態で実施された計測結果を計測レポート画面に表示する際には(正確に計測することが期待できないような条件で計測が行われたとみなして)警告表示を行ってよい。
<Step 830>
The display control unit 101-05 displays, on the
上記では特定された3次元血管領域に基づいて体積を計測する場合の手順を例に説明したが、3次元の血管中心線に基づいて計測する場合には、上記S810~830の代わりに図6(b)に示すS840~870を実行する。 The procedure for measuring the volume based on the specified three-dimensional blood vessel region has been described above as an example. S840-870 shown in (b) are executed.
<ステップ840>
計測部101-463は、S820で生成した血管領域の2値画像を3次元細線化処理することにより、血管の中心線に相当する線幅1画素のスケルトン画像を生成する。
<Step 840>
The measurement unit 101-463 generates a skeleton image with a line width of 1 pixel corresponding to the center line of the blood vessel by performing a three-dimensional thinning process on the binary image of the blood vessel region generated in S820.
<ステップ850>
操作者は、入力部103を介してS810と場合と同様の関心領域を設定する。なお、本実施形態では計測内容として
1)網膜表層及び網膜深層におけるVLDマップ及びVLDセクタマップ
2)網膜外層における脈絡膜新生血管の総血管長
を算出する。
<Step 850>
The operator sets the region of interest via the
<ステップ860>
計測部101-463はS840で得られたスケルトン画像に基づいて計測処理を行う。網膜表層及び網膜深層における計測内容(VLDマップ及びVLDセクタマップ生成)は基本的に第一実施形態と同様であるが、網膜表層及び網膜深層において特定された3次元スケルトンを正面像として投影してから計測する点が異なる。なお、S307で特定した3次元血管領域を正面像として投影してから2次元細線化処理を実行して計測してもよい。網膜外層では、S810で設定した網膜外層に相当する関心領域内における非0画素(白画素)の長さの総和を算出する。
<Step 860>
The measurement unit 101-463 performs measurement processing based on the skeleton image obtained in S840. The measurement contents (VLD map and VLD sector map generation) in the retinal surface layer and retinal deep layer are basically the same as in the first embodiment, but the three-dimensional skeleton specified in the retinal surface layer and retinal deep layer is projected as a front image. The difference is that the measurement is made from It should be noted that the three-dimensional blood vessel region specified in S307 may be projected as a front image, and then two-dimensional thinning processing may be performed for measurement. For the outer retina, the sum of the lengths of non-zero pixels (white pixels) in the region of interest corresponding to the outer retina set in S810 is calculated.
<ステップ870>
表示制御部101-05は、計測結果としてS860で生成した網膜表層及び網膜深層におけるVLDマップ及びVLDセクタマップ、網膜外層におけるスケルトン画像と該スケルトンの長さの総和を表示部104に表示する。また、S830の場合と同様に、所定の解析に適した条件を満たさない状態で実施された計測結果を計測レポート画面に表示する際には警告メッセージを表示するものとする。
<Step 870>
The display control unit 101-05 displays, on the
なお、本実施形態では脈絡膜新生血管を3次元抽出して体積や血管長の総和を時系列表示する場合の手順について説明したが、本発明はこれに限定されない。例えば、図11の「Show Difference」チェックボックスを押下して基準画像における該新生血管の体積とその他の画像における該新生血管の体積との差分画像及び差分値を生成して時系列で表示してもよい。あるいは、視神経乳頭部の深度方向に屈曲した動静脈領域を本実施形態で説明した手順と同様にして特定し、血管径や血管断面積、血管中心線の曲率といった血管形状を計測してもよい。あるいは、網膜表層の毛細血管と網膜深層の毛細血管の連結部を3次元的に抽出して強調表示させたり、連結部の本数を計数したりしてもよい。 In this embodiment, a procedure for three-dimensionally extracting choroidal neovascularization and displaying the total volume and blood vessel length in chronological order has been described, but the present invention is not limited to this. For example, by pressing the "Show Difference" check box in FIG. 11, a difference image and a difference value between the volume of the new blood vessel in the reference image and the volume of the new blood vessel in the other images are generated and displayed in chronological order. good too. Alternatively, an arteriovenous region bent in the depth direction of the optic papilla may be specified in the same manner as the procedure described in this embodiment, and the shape of the blood vessel such as the diameter, cross-sectional area, and curvature of the center line of the blood vessel may be measured. . Alternatively, connecting portions between capillaries in the superficial layer of the retina and capillaries in the deep layer of the retina may be three-dimensionally extracted and highlighted, or the number of connecting portions may be counted.
以上述べた構成によれば、画像処理装置101は3次元の合成モーションコントラスト画像に対してモーションアーチファクト抑制処理を実施後、3次元のモルフォロジーフィルタ及び血管強調フィルタを適用し、2値化することにより3次元で血管領域を特定する。さらに特定した血管領域の体積を算出して血管領域の2値画像と体積値を時系列表示する。これにより、例えば、検査ごとのOCT断層画像の信号強度や画質のばらつきの影響を抑制しながら、血管病態の変化を正確に特定・計測できる。
According to the configuration described above, the
[その他の実施形態]
上記の各実施形態では、本発明を画像処理装置101として実現したが、本発明の実施形態は画像処理装置101のみに限定されるものではない。例えば、本発明はシステム、装置、方法、プログラムもしくは記憶媒体等としての実施態様をとることができる。
[Other embodiments]
Although the present invention is implemented as the
Claims (17)
操作者からの指示に応じて前記第1の領域と前記第2の領域とのいずれか一方に対して選択された解析の種類を示す情報を用いて前記一方が解析された結果を示す画像を表示手段に表示させ、前記一方に対する選択の後に操作者からの指示に応じて他方に対して選択された解析の種類と、前記一方に対して選択された解析の種類とが異なる場合には、前記一方が解析された結果を示す画像の表示領域において、前記一方が解析された結果を示す画像の表示を、前記他方に対して選択された解析の種類を示す情報を用いて前記一方及び前記他方が解析された結果を示す画像の表示に変更する制御を実行する表示制御手段と、
を有することを特徴とする画像処理装置。 analysis means for performing analysis on at least one of a first region in a motion contrast image of an eye and a second region that is a partial region of the first region;
An image showing a result of analyzing one of the first area and the second area using information indicating the type of analysis selected for one of the first area and the second area in accordance with an instruction from an operator. When the type of analysis selected for the other in response to an instruction from the operator after being displayed on the display means and the type of analysis selected for the one are different, In the display area of the image showing the analysis result of the one, the display of the image showing the analysis result of the one is displayed using the information indicating the type of analysis selected for the other. a display control means for executing control to change the display to an image showing the analysis result of the other;
An image processing device comprising:
前記第1の領域は、前記モーションコントラスト画像の全体領域であることを特徴とする請求項1乃至9のいずれか1項に記載の画像処理装置。 the second area is a sector area,
10. The image processing apparatus according to any one of claims 1 to 9, wherein the first area is the entire area of the motion contrast image .
前記解析された結果を示す画像は、前記モーションコントラスト正面画像の少なくとも一部の領域に対して解析された結果を示す2次元画像であることを特徴とする請求項1乃至11のいずれか1項に記載の画像処理装置。 The motion-contrast image is a motion-contrast front image of the eye generated using a three-dimensional motion-contrast image of the eye and information on a depth range set according to an instruction from an operator. and
12. The image showing the analysis result is a two-dimensional image showing the analysis result of at least a partial region of the motion contrast front image. The image processing device according to .
操作者からの指示に応じて前記第1の領域と前記第2の領域とのいずれか一方に対して選択された解析の種類を示す情報を用いて前記一方が解析された結果を示す画像を表示手段に表示させ、前記一方に対する選択の後に操作者からの指示に応じて他方に対して選択された解析の種類と、前記一方に対して選択された解析の種類とが異なる場合には、前記一方が解析された結果を示す画像の表示領域において、前記一方が解析された結果を示す画像の表示を、前記他方に対して選択された解析の種類を示す情報を用いて前記一方及び前記他方が解析された結果を示す画像の表示に変更する制御を実行する工程と、
を有することを特徴とする画像処理方法。 performing an analysis on at least one of a first region in a motion contrast image of the eye and a second region that is a subregion of the first region;
An image showing a result of analyzing one of the first area and the second area using information indicating the type of analysis selected for one of the first area and the second area in accordance with an instruction from an operator. When the type of analysis selected for the other in response to an instruction from the operator after being displayed on the display means and the type of analysis selected for the one are different, In the display area of the image showing the analysis result of the one, the display of the image showing the analysis result of the one is displayed using the information indicating the type of analysis selected for the other. executing control to change the display of the image showing the result of the analysis of the other;
An image processing method characterized by comprising:
Priority Applications (2)
| Application Number | Priority Date | Filing Date | Title |
|---|---|---|---|
| JP2018044560A JP7106304B2 (en) | 2018-03-12 | 2018-03-12 | Image processing device, image processing method and program |
| US16/289,224 US20190274538A1 (en) | 2018-03-12 | 2019-02-28 | Image processing device, image processing method, and program |
Applications Claiming Priority (1)
| Application Number | Priority Date | Filing Date | Title |
|---|---|---|---|
| JP2018044560A JP7106304B2 (en) | 2018-03-12 | 2018-03-12 | Image processing device, image processing method and program |
Publications (3)
| Publication Number | Publication Date |
|---|---|
| JP2019154716A JP2019154716A (en) | 2019-09-19 |
| JP2019154716A5 JP2019154716A5 (en) | 2021-04-22 |
| JP7106304B2 true JP7106304B2 (en) | 2022-07-26 |
Family
ID=67993257
Family Applications (1)
| Application Number | Title | Priority Date | Filing Date |
|---|---|---|---|
| JP2018044560A Active JP7106304B2 (en) | 2018-03-12 | 2018-03-12 | Image processing device, image processing method and program |
Country Status (1)
| Country | Link |
|---|---|
| JP (1) | JP7106304B2 (en) |
Families Citing this family (2)
| Publication number | Priority date | Publication date | Assignee | Title |
|---|---|---|---|---|
| JP7195745B2 (en) * | 2018-03-12 | 2022-12-26 | キヤノン株式会社 | Image processing device, image processing method and program |
| CN116758527B (en) * | 2023-08-16 | 2023-11-10 | 山东巨野盛鑫电器材料有限公司 | Quality identification system of polyimide insulating film with low expansion coefficient |
Citations (7)
| Publication number | Priority date | Publication date | Assignee | Title |
|---|---|---|---|---|
| WO2015064545A1 (en) | 2013-10-29 | 2015-05-07 | 株式会社ニデック | Ophthalmologic observation device and ophthalmologic observation program |
| JP2017046976A (en) | 2015-09-02 | 2017-03-09 | 株式会社ニデック | Ophthalmic imaging apparatus and ophthalmic imaging program |
| JP2017077414A (en) | 2015-10-21 | 2017-04-27 | 株式会社ニデック | Ophthalmic analysis apparatus and ophthalmic analysis program |
| WO2017150583A1 (en) | 2016-03-04 | 2017-09-08 | 株式会社ニデック | Ophthalmologic information processing device and ophthalmologic information processing program |
| JP2017170193A (en) | 2017-06-12 | 2017-09-28 | 株式会社ニデック | Ophthalmological analysis device and ophthalmological analysis program |
| JP2017221525A (en) | 2016-06-16 | 2017-12-21 | 株式会社ニデック | Optical coherence tomography apparatus and optical coherence tomography control program |
| JP2019154718A (en) | 2018-03-12 | 2019-09-19 | キヤノン株式会社 | Image processing apparatus, image processing method, and program |
-
2018
- 2018-03-12 JP JP2018044560A patent/JP7106304B2/en active Active
Patent Citations (7)
| Publication number | Priority date | Publication date | Assignee | Title |
|---|---|---|---|---|
| WO2015064545A1 (en) | 2013-10-29 | 2015-05-07 | 株式会社ニデック | Ophthalmologic observation device and ophthalmologic observation program |
| JP2017046976A (en) | 2015-09-02 | 2017-03-09 | 株式会社ニデック | Ophthalmic imaging apparatus and ophthalmic imaging program |
| JP2017077414A (en) | 2015-10-21 | 2017-04-27 | 株式会社ニデック | Ophthalmic analysis apparatus and ophthalmic analysis program |
| WO2017150583A1 (en) | 2016-03-04 | 2017-09-08 | 株式会社ニデック | Ophthalmologic information processing device and ophthalmologic information processing program |
| JP2017221525A (en) | 2016-06-16 | 2017-12-21 | 株式会社ニデック | Optical coherence tomography apparatus and optical coherence tomography control program |
| JP2017170193A (en) | 2017-06-12 | 2017-09-28 | 株式会社ニデック | Ophthalmological analysis device and ophthalmological analysis program |
| JP2019154718A (en) | 2018-03-12 | 2019-09-19 | キヤノン株式会社 | Image processing apparatus, image processing method, and program |
Also Published As
| Publication number | Publication date |
|---|---|
| JP2019154716A (en) | 2019-09-19 |
Similar Documents
| Publication | Publication Date | Title |
|---|---|---|
| US11935241B2 (en) | Image processing apparatus, image processing method and computer-readable medium for improving image quality | |
| US20190274542A1 (en) | Image processing apparatus, image processing method, and non-transitory computer readable medium | |
| JP5941761B2 (en) | Ophthalmic photographing apparatus and ophthalmic image processing apparatus | |
| JP7374615B2 (en) | Information processing device, information processing method and program | |
| WO2020137678A1 (en) | Image processing device, image processing method, and program | |
| JP6815798B2 (en) | Ophthalmic imaging equipment and ophthalmic image processing equipment | |
| JP2015160105A (en) | Image processing device, image processing method and program | |
| JP7195745B2 (en) | Image processing device, image processing method and program | |
| WO2020050308A1 (en) | Image processing device, image processing method and program | |
| JP2021122559A (en) | Image processing device, image processing method, and program | |
| JP7106304B2 (en) | Image processing device, image processing method and program | |
| JP7009265B2 (en) | Image processing equipment, image processing methods and programs | |
| WO2019230643A1 (en) | Information processing device, information processing method, and program | |
| US20190274538A1 (en) | Image processing device, image processing method, and program | |
| WO2020075719A1 (en) | Image processing device, image processing method, and program | |
| JP2020054812A (en) | Image processing device, image processing method and program | |
| JP7005382B2 (en) | Information processing equipment, information processing methods and programs | |
| JP2019103762A (en) | Oct data analysis device, and oct data analysis program | |
| JP2018191761A (en) | Information processing device, information processing method, and program | |
| JP7246862B2 (en) | IMAGE PROCESSING DEVICE, CONTROL METHOD AND PROGRAM OF IMAGE PROCESSING DEVICE | |
| JP7204345B2 (en) | Image processing device, image processing method and program | |
| JP7262929B2 (en) | Image processing device, image processing method and program | |
| JP7387812B2 (en) | Image processing device, image processing method and program | |
| JP7297952B2 (en) | Information processing device, information processing method and program | |
| JP2019154715A (en) | Image processing apparatus, image processing method, and program |
Legal Events
| Date | Code | Title | Description |
|---|---|---|---|
| A521 | Request for written amendment filed |
Free format text: JAPANESE INTERMEDIATE CODE: A523 Effective date: 20210310 |
|
| A621 | Written request for application examination |
Free format text: JAPANESE INTERMEDIATE CODE: A621 Effective date: 20210310 |
|
| A977 | Report on retrieval |
Free format text: JAPANESE INTERMEDIATE CODE: A971007 Effective date: 20211207 |
|
| A131 | Notification of reasons for refusal |
Free format text: JAPANESE INTERMEDIATE CODE: A131 Effective date: 20211221 |
|
| A521 | Request for written amendment filed |
Free format text: JAPANESE INTERMEDIATE CODE: A523 Effective date: 20220216 |
|
| TRDD | Decision of grant or rejection written | ||
| A01 | Written decision to grant a patent or to grant a registration (utility model) |
Free format text: JAPANESE INTERMEDIATE CODE: A01 Effective date: 20220614 |
|
| A61 | First payment of annual fees (during grant procedure) |
Free format text: JAPANESE INTERMEDIATE CODE: A61 Effective date: 20220713 |
|
| R151 | Written notification of patent or utility model registration |
Ref document number: 7106304 Country of ref document: JP Free format text: JAPANESE INTERMEDIATE CODE: R151 |