JP6922151B2 - Ophthalmology analyzer, ophthalmology analysis program - Google Patents
Ophthalmology analyzer, ophthalmology analysis program Download PDFInfo
- Publication number
- JP6922151B2 JP6922151B2 JP2015207571A JP2015207571A JP6922151B2 JP 6922151 B2 JP6922151 B2 JP 6922151B2 JP 2015207571 A JP2015207571 A JP 2015207571A JP 2015207571 A JP2015207571 A JP 2015207571A JP 6922151 B2 JP6922151 B2 JP 6922151B2
- Authority
- JP
- Japan
- Prior art keywords
- blood vessel
- data
- region
- analysis
- cpu
- Prior art date
- Legal status (The legal status is an assumption and is not a legal conclusion. Google has not performed a legal analysis and makes no representation as to the accuracy of the status listed.)
- Active
Links
Images


Classifications
-
- A—HUMAN NECESSITIES
- A61—MEDICAL OR VETERINARY SCIENCE; HYGIENE
- A61B—DIAGNOSIS; SURGERY; IDENTIFICATION
- A61B3/00—Apparatus for testing the eyes; Instruments for examining the eyes
- A61B3/10—Objective types, i.e. instruments for examining the eyes independent of the patients' perceptions or reactions
- A61B3/102—Objective types, i.e. instruments for examining the eyes independent of the patients' perceptions or reactions for optical coherence tomography [OCT]
Description
本開示は、被検眼の血管情報を含む被検眼データを解析するための眼科解析装置、眼科解析プログラムに関する。 The present disclosure relates to an ophthalmology analysis device and an ophthalmology analysis program for analyzing eye data to be inspected including vascular information of the eye to be inspected.
近年では、OCT技術を利用して、被検眼のモーションコントラストデータを得る技術が注目されている(非特許文献1参照)。 In recent years, a technique for obtaining motion contrast data of an eye to be inspected by using an OCT technique has attracted attention (see Non-Patent Document 1).
しかしながら、モーションコントラストデータの画像化については、種々の改良が行われているが、解析関係については、種々の面で改善の余地がありうる。 However, although various improvements have been made to the imaging of motion contrast data, there may be room for improvement in various aspects regarding the analysis relationship.
例えば、モーションコントラストデータによって血管の状態が可視化されるが、モーションコントラストデータを観察するのみでは、血管の状態を把握するのは容易ではない。 For example, the state of blood vessels is visualized by motion contrast data, but it is not easy to grasp the state of blood vessels only by observing the motion contrast data.
本開示は、従来技術の問題点の少なくとも一つを鑑み、OCTモーションコントラストデータを用いた血管解析を好適に行うことができる眼科解析装置、及び眼科解析プログラムを提供することを技術課題とする。 In view of at least one of the problems of the prior art, it is a technical subject of the present disclosure to provide an ophthalmic analysis apparatus and an ophthalmic analysis program capable of suitably performing blood vessel analysis using OCT motion contrast data.
上記課題を解決するために、本発明は以下のような構成を備えることを特徴とする。 In order to solve the above problems, the present invention is characterized by having the following configurations.
(1)
被検眼の血管領域を含むOCTモーションコントラストデータを解析するための眼科解析装置であって、
前記OCTモーションコントラストデータを解析するための解析処理手段であって、前記OCTモーションコントラストデータに含まれる前記血管領域に関する動静脈情報として、前記OCTモーションコントラストデータに含まれる少なくとも一つの血管が動脈であるか静脈であるかを判別するための判別情報であって、前記OCTモーションコントラストデータとは異なるデータである、光干渉断層計によって取得されたOCTデータ又は光干渉断層計とは異なる撮影手段によって取得された画像データに基づく判別情報を取得し、取得された前記判別情報に基づいて、前記OCTモーションコントラストデータの血管領域に対して動脈であるか静脈であるかを付与する解析処理手段と、
取得された前記判別情報に基づいて前記OCTモーションコントラストデータに対して画像処理を施し、前記血管領域に対して動脈であるか静脈であるかを含む前記OCTモーションコントラストデータを表示部に表示する表示制御手段と、
を備えることを特徴とする眼科解析装置。
(2)
(1)に記載の眼科解析装置の各種処理手段としてコンピュータを機能させるための眼科解析プログラム。
(1)
An ophthalmic analyzer for analyzing OCT motion contrast data including the blood vessel region of the eye to be inspected.
A analysis means for analyzing the OCT motion contrast data, as arteriovenous information on the blood vessel region included in the OCT motion contrast data, at least one blood vessel included in the OCT motion contrast data is arterial Discrimination information for discriminating whether it is a blood vessel or a blood vessel, which is data different from the OCT motion contrast data, acquired by OCT data acquired by an optical interference tomography or by an imaging means different from the optical interference tomometer. An analysis processing means for acquiring discrimination information based on the obtained image data and assigning whether the blood vessel region of the OCT motion contrast data is an artery or a vein based on the acquired discrimination information.
Based on the acquired discrimination information, the OCT motion contrast data is subjected to image processing, and the OCT motion contrast data including whether it is an artery or a vein with respect to the blood vessel region is displayed on the display unit. Control means and
Ophthalmic analysis apparatus, characterized in that it comprises a.
(2)
An ophthalmic analysis program for operating a computer as various processing means of the ophthalmic analysis apparatus according to (1).
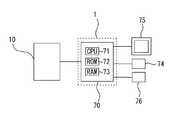
以下、本実施形態の眼科解析装置について図面を用いて説明する。なお、以下では、眼科解析装置として、OCTモーションコントラストデータ解析装置を一例として説明する。図1に示すOCTモーションコントラストデータ解析装置(以下、OCT解析装置)1は、OCTデバイス10によって取得されたモーションコントラストデータを解析処理する。OCTモーションコントラストデータは、例えば、被検眼の血管情報を含む。
Hereinafter, the ophthalmic analyzer of this embodiment will be described with reference to the drawings. In the following, the OCT motion contrast data analysis device will be described as an example of the ophthalmology analysis device. The OCT motion contrast data analysis device (hereinafter, OCT analysis device) 1 shown in FIG. 1 analyzes the motion contrast data acquired by the
OCT解析装置1は、例えば、制御部70を備える。制御部70は、例えば、一般的なCPU(Central Processing Unit)71、ROM72、RAM73、等で実現される。ROM72には、例えば、モーションコントラストデータを処理するための解析処理プログラム、OCTデバイス10の動作を制御してモーションコントラストデータを得るためのプログラム、初期値等が記憶される。RAM73は、例えば、各種情報を一時的に記憶する。
The
制御部70には、図1に示すように、例えば、記憶部(例えば、不揮発性メモリ)74、操作部76、および表示部75等が電気的に接続されている。記憶部74は、例えば、電源の供給が遮断されても記憶内容を保持できる非一過性の記憶媒体である。例えば、ハードディスクドライブ、フラッシュROM、着脱可能なUSBメモリ等を記憶部74として使用することができる。
As shown in FIG. 1, the
操作部76には、検者による各種操作指示が入力される。操作部76は、入力された操作指示に応じた信号をCPU71に出力する。操作部76には、例えば、マウス、ジョイスティック、キーボード、タッチパネル等の少なくともいずれかのユーザーインターフェイスを用いればよい。
Various operation instructions by the inspector are input to the
表示部75は、装置1の本体に搭載されたディスプレイであってもよいし、本体に接続されたディスプレイであってもよい。例えば、パーソナルコンピュータ(以下、「PC」という)のディスプレイを用いてもよい。表示部75は、例えば、OCTデバイス10によって取得されたOCTデータ、モーションコントラストデータ等を表示する。
The
なお、本実施例のOCT解析装置1には、例えば、OCTデバイス10が接続されている。なお、OCT解析装置1は、例えば、OCTデバイス10と同一の筐体に収納された一体的な構成であってもよいし、別々の構成であってもよい。制御部70は、接続されたOCTデバイス10からモーションコントラストデータを取得してもよい。制御部70は、OCTデバイス10によって取得されたモーションコントラストデータを記憶媒体を介して取得してもよい。
An
<OCTデバイス>
以下、図2に基づいてOCTデバイス10の概略を説明する。例えば、OCTデバイス10は、被検眼Eに測定光を照射し、その反射光と参照光とによって取得されたOCT信号を取得する。OCTデバイス10は、例えば、OCT光学系100を主に備える。
<OCT device>
Hereinafter, the outline of the
<OCT光学系>
OCT光学系100は、被検眼Eに測定光を照射し、その反射光と参照光との干渉信号を検出する。OCT光学系100は、例えば、測定光源102と、カップラー(光分割器)104と、測定光学系106と、参照光学系110と、検出器120等を主に備える。なお、OCT光学系の詳しい構成については、例えば、特開2015−131107号を参考にされたい。
<OCT optical system>
The OCT
OCT光学系100は、いわゆる光断層干渉計(OCT:Optical coherence tomography)の光学系である。OCT光学系100は、測定光源102から出射された光をカップラー104によって測定光(試料光)と参照光に分割する。分割された測定光は測定光学系106へ、参照光は参照光学系110へそれぞれ導光される。測定光は測定光学系106を介して被検眼Eの眼底Efに導かれる。その後、被検眼Eによって反射された測定光と,参照光との合成による干渉光を検出器120に受光させる。
The OCT
測定光学系106は、例えば、走査部(例えば、光スキャナ)108を備える。走査部108は、例えば、眼底上でXY方向(横断方向)に測定光を走査させるために設けられてもよい。例えば、CPU71は、設定された走査位置情報に基づいて走査部108の動作を制御し、検出器120によって検出された受光信号に基づいてOCT信号を取得する。参照光学系110は、眼底Efでの測定光の反射によって取得される反射光と合成される参照光を生成する。参照光学系110は、マイケルソンタイプであってもよいし、マッハツェンダタイプであっても良い。
The measurement
検出器120は、測定光と参照光との干渉状態を検出する。フーリエドメインOCTの場合では、干渉光のスペクトル強度が検出器120によって検出され、スペクトル強度データに対するフーリエ変換によって所定範囲における深さプロファイル(Aスキャン信号)が取得される。
The
なお、OCTデバイス10として、例えば、Spectral-domain OCT(SD−OCT)、Swept-source OCT(SS−OCT)、Time-domain OCT(TD−OCT)等が用いられてもよい。
As the
<正面撮影光学系>
正面撮影光学系200は、例えば、被検眼Eの眼底Efを正面方向(例えば、測定光の光軸方向)から撮影し、眼底Efの正面画像を得る。正面撮影光学系200は、例えば、走査型レーザ検眼鏡(SLO)の装置構成であってもよいし(例えば、特開2015−66242号公報参照)、いわゆる眼底カメラタイプの構成であってもよい(特開2011−10944参照)。なお、正面撮影光学系200としては、OCT光学系100が兼用してもよく、検出器120からの検出信号に基づいて正面画像が取得されてもよい。
<Front photography optical system>
The frontal imaging
<固視標投影部>
固視標投影部300は、眼Eの視線方向を誘導するための光学系を有する。投影部300は、眼Eに呈示する固視標を有し、眼Eを誘導できる。例えば、固視標投影部300は、可視光を発する可視光源を有し、固視標の呈示位置を二次元的に変更させる。これによって、視線方向が変更され、結果的にOCTデータの取得部位が変更される。
<Fixed target projection unit>
The fixation
<モーションコントラストデータの取得>
本実施例のOCT解析装置1は、例えば、OCTデバイス10によって検出されたOCTデータを処理してモーションコントラストデータを取得してもよい。CPU71は、走査部108の駆動を制御し、眼底Ef上の領域A1において測定光を走査させる。なお、図3(a)において、z軸の方向は、測定光の光軸の方向とする。x軸の方向は、z軸に垂直であって被検者の左右方向とする。y軸の方向は、z軸に垂直であって被検者の上下方向とする。
<Acquisition of motion contrast data>
The
例えば、CPU71は、領域A1において走査ラインSL1,SL2,・・・,SLnに沿ってx方向に測定光を走査させる。なお、測定光の光軸方向に交差する方向(例えば、x方向)に測定光を走査させることを「Bスキャン」と呼ぶ。そして、1回のBスキャンによって得られた二次元OCTデータを1フレームの二次元OCTデータとして説明する。CPU71は、例えば、xy方向に2次元的に測定光を走査させ、各走査位置においてz方向のAスキャン信号を得てもよい。
For example, the
CPU71は、OCTデータに基づいてモーションコントラストデータを取得してもよい。モーションコントラストは、例えば、被検眼の血流、網膜組織の変化などを捉えた情報であってもよい。モーションコントラストデータを取得する場合、CPU71は、被検眼の同一位置に関して時間的に異なる少なくとも2つのOCTデータを取得する。例えば、各走査ラインにおいて、CPU71は、時間の異なる複数回のBスキャンを行い、時間の異なる複数のOCTデータをそれぞれ取得する。
The
例えば、図3(b)は、走査ラインSL1,SL2,・・・,SLnにおいて時間の異なる複数回のBスキャンを行った場合に取得されたOCT信号を示している。例えば、図3(b)は、走査ラインSL1を時間T11,T12,・・・,T1Nで走査し、走査ラインSL2を時間T21,T22,・・・,T2Nで走査し、走査ラインSLnを時間Tn1,Tn2,・・・,TnNで走査した場合を示している。例えば、CPU71は、各走査ラインにおいて、時間の異なる複数のOCTデータを取得し、そのOCTデータを記憶部74に記憶させる。
For example, FIG. 3B shows an OCT signal acquired when a plurality of B scans having different times are performed on the scanning lines SL1, SL2, ..., SLn. For example, FIG. 3B scans the scanning line SL1 at time T11, T12, ..., T1N, scans scanning line SL2 at time T21, T22, ..., T2N, and scans scanning line SLn for time. The case where scanning is performed with Tn1, Tn2, ..., TnN is shown. For example, the
CPU71は、上記のように、同一位置に関して時間的に異なる複数のOCTデータを取得すると、OCTデータを処理してモーションコントラストデータを取得する。モーションコントラストを取得するためのOCTデータの演算方法としては、例えば、複素OCTデータの強度差もしくは振幅差を算出する方法、複素OCTデータの強度もしくは振幅の分散もしくは標準偏差を算出する方法(Speckle variance)、複素OCTデータの位相差もしくは分散を算出する方法、複素OCTデータのベクトル差分を算出する方法、複素OCT信号の位相差及びベクトル差分を掛け合わせる方法が挙げられる。なお、演算手法の一つとして、例えば、特開2015−131107号公報を参照されたい。
As described above, when the
CPU71は、異なる走査ラインでのモーションコントラストデータを並べることによって、被検眼Eの3次元モーションコントラストデータを取得してもよい。なお、前述のように、モーションコントラストデータとしては、位相差に限らず、強度差、ベクトル差分等が取得されてもよい。
The
<モーションコントラストデータの解析処理>
上記のように取得されたモーションコントラストデータの解析処理の一例を、以下に説明する。
<Analysis processing of motion contrast data>
An example of the analysis processing of the motion contrast data acquired as described above will be described below.
CPU71は、モーションコントラストデータに対する解析領域を設定し、設定された解析領域に関して解析処理を行うことによって少なくとも一つの解析結果を取得してもよい。この場合、CPU71は、モーションコントラストデータとは異なる画像データである第2の画像データ上の解析チャートの位置情報を基準として、モーションコントラストデータでの解析領域を設定してもよい。
The
以下、解析結果の一例として、モーションコントラストデータに対する解析処理によって被検眼の血管領域を抽出する場合について説明する。この場合、モーションコントラストデータに対する解析領域として血管解析領域が設定され、少なくとも血管解析領域において血管領域を抽出するための解析処理を行われてもよい。 Hereinafter, as an example of the analysis result, a case where the blood vessel region of the eye to be inspected is extracted by the analysis processing for the motion contrast data will be described. In this case, a blood vessel analysis region may be set as an analysis region for the motion contrast data, and analysis processing for extracting the blood vessel region may be performed at least in the blood vessel analysis region.
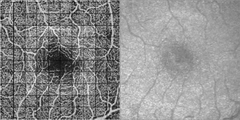
図4は、血管領域を抽出する際の解析画面の一例を示す図である。CPU71は、例えば、解析画面において、モーションコントラスト表示領域(以下、MC表示領域)400、第2の画像表示領域500を表示部75の表示画面に表示するようにしてもよい。この場合、MC表示領域400、第2の画像表示領域500が同時に表示されてもよいし、別タイミングで表示されてもよい。
FIG. 4 is a diagram showing an example of an analysis screen when extracting a blood vessel region. For example, the
MC表示領域400は、モーションコントラストデータ(以下、MCデータ)402を表示するための領域であり、例えば、MCデータ402として、図4に示すように、正面MCデータ(エンフェイスMCデータともいう)が表示されてもよい。正面MCデータは、例えば、深さ方向の少なくとも一部の領域に関して3次元MCデータを取り出す(例えば、特願2015−121574号公報参照)ことによって取得されてもよい。例えば、MCデータにおける深さ方向での積算値又は最大値によって正面MCデータが生成されてもよい。もちろん、MCデータ402として、一次元MCデータ、二次元MCデータ、3次元MCデータが表示されてもよい。
The
CPU71は、MCデータ402上での血管解析領域を示す表示(例えば、グラフィック404)を、MCデータ402上に表示するようにしてもよい。血管解析領域を示す表示としては、図4のグラフィック404のように血管解析領域の外縁を示す枠表示であってもよいし、血管解析領域と非血管解析領域とが色分けされた表示であってもよい。
The
第2の画像表示領域500は、MCデータ402とは異なる画像データである第2の画像データ502を表示するための領域であってもよい。第2の画像表示領域には、例えば、正面画像、解析マップの少なくともいずれかが表示されてもよい。第2の画像データ502は、取得部位に関して、MCデータ402と少なくとも一部が重複する画像データが用いられる。例えば、MCデータ402が黄斑部位を中心とするデータの場合、黄斑に関する第2の画像データ502が表示され、MCデータ402が乳頭部位を中心とするデータの場合、乳頭に関する第2の画像データ502が表示されてもよい。
The second
解析マップとしては、例えば、眼底に関する計測結果の二次元分布を示すマップであってもよい。この場合、例えば、計測値に応じて色分けされたカラーマップであってもよい。解析マップとしては、例えば、層厚を示す厚みマップ、被検眼の層厚と正常眼データベースに記憶された正常眼の層厚との比較結果を示す比較マップ、被検眼の層厚と正常眼データベースに記憶された正常眼の層厚とのずれを標準偏差にて示すデビエーションマップ、各検査日との厚みの差分を示す検査日比較厚み差分マップ、であってもよい。なお、層厚を求める場合、例えば、OCTデータに対する画像処理(例えば、セグメンテーション処理)によってOCTデータが層毎に分割処理され、層境界の間隔に基づいて各層の厚みが計測される。もちろん、層厚に限定されず、解析マップとしては、層厚に限定されず、例えば、眼底の曲率分布を示すマップであってよい。 The analysis map may be, for example, a map showing a two-dimensional distribution of measurement results relating to the fundus. In this case, for example, the color map may be color-coded according to the measured value. The analysis map includes, for example, a thickness map showing the layer thickness, a comparison map showing the comparison result between the layer thickness of the eye to be examined and the layer thickness of the normal eye stored in the normal eye database, and the layer thickness of the eye to be examined and the normal eye database. It may be a deviation map showing the deviation from the layer thickness of the normal eye stored in the standard deviation, or an examination date comparison thickness difference map showing the difference in thickness from each examination date. When determining the layer thickness, for example, the OCT data is divided into layers by image processing (for example, segmentation processing) on the OCT data, and the thickness of each layer is measured based on the interval between the layer boundaries. Of course, it is not limited to the layer thickness, and the analysis map is not limited to the layer thickness, and may be, for example, a map showing the curvature distribution of the fundus.
正面画像は、例えば、正面撮影光学系200によって撮影された正面画像であってもよいし、OCT3次元データから生成される正面OCTデータ(エンフェイスOCTデータともいう)であってもよい。3次元OCTデータの場合、3次元モーションコントラストデータの基礎となる3次元OCTデータであってもよい。解析マップは、例えば、被検眼上の解析結果(例えば、眼底層の厚み、曲率など)を二次元的に表現するカラーマップであってもよい。図4では、第2の画像データ502として、正面画像に解析マップが重畳された画像が表示されている。
The front image may be, for example, a front image taken by the front photographing
<解析チャート>
CPU71は、解析チャート504を、第2の画像データ502上に重畳して表示してもよい。この場合、第2の画像データ502は、3次元OCTデータに対する解析結果に基づく計測結果(例えば、解析マップの計測データ)と予め関連付けられてもよく(レジストレーション)、解析チャート504が設定された領域に対応する計測結果が出力される。この場合、第2の画像データ502が3次元OCTデータと関連付けされ、解析チャートが設定された領域に関して解析処理が実行されてもよく、解析結果に基づいて計測結果が出力されてもよい。この場合、3次元OCTデータは、MCデータの基礎となる3次元OCTデータであることが好ましい。なぜなら、MCデータと第2の画像データとの位置的な対応付け(レジストレーション)が容易かつ正確であるからである。
<Analysis chart>
The
例えば、解析チャート504は、予め設定されたセクションでの計測結果の基本統計量を計測するための解析チャートであってもよく、セクション内での基本統計量が計測されてもよい。解析チャート504を形成するセクションは、一つの領域であってもよいし、複数のセクションであってもよい。複数のセクションの場合、分割されたセクション毎に基本統計量が計測されてもよい。基本統計量としては、代表値(平均値、中央値、最頻値、最大値、最小値、など)、散布度(分散、標準偏差、変動係数)などであってもよい。
For example, the
例えば、解析チャート504は、眼底の層厚の二次元的な分布につき、領域毎の平均を求めるチャートであってもよい。また、解析チャート504には、所定領域での層厚を数値にて表示する数値表示領域が付されてもよい。数値表示の代わりに、セクション単位での、計測結果に応じた色分けが行われてもよい。層厚データは、各層の合計であってもよいし、ある層(例えば、視神経線維層)での厚みであってもよい。
For example, the
解析チャート504は任意に選択可能であり、厚みマップが黄斑マップの場合、解析チャート504として、例えば、検者は、GCHART(具体的には、半径方向に3分割されると共に、上下左右にそれぞれ分割されたチャート)、S/Iチャート、ETDRSから選択可能である。なお、厚みマップが乳頭マップの場合、解析チャートとして、例えば、全体チャート、上下チャート(2分割)、TSNIT(Temporal Superior Nasal Inferior Temporal)チャート(4分割)、ClockHourチャート(12分割)から選択可能である。
The
CPU71は、操作部76からの操作信号を受け付け、第2の画像データ502上での解析チャート504の表示位置を変更してもよい。これによって、第2の画像データ502上での解析チャート504による解析領域が変更される。CPU71は、解析チャート504の表示位置の変更に連動して、変更後の解析領域における解析結果を求めてもよい。なお、解析チャートの一部が、第2の画像データ502をはみ出してもよい。
The
例えば、検者は、操作部76を用いて解析チャート504を移動させることによって、解析チャートの中心504cを、眼底の基準部位(例えば、中心窩中心(図4中のM参照)、視神経乳頭中心、異常部位)に設定してもよい。これによって、例えば、眼底の基準部位を中心として、解析チャート504による計測結果が得られる。例えば、基準部位を中心とするチャート内全体の平均層厚、基準部位の層厚、基準部位を中心とする所定エリア内での平均層厚(例えば、1、2、3mm)等が計測されてもよい。これによって、眼底上の基準部位を中心とする計測結果が得られるので、臨床的にも有用である。
For example, the examiner moves the
<解析チャートと血管解析領域の連動>
例えば、CPU71は、解析チャート504の位置情報を用いて、MCデータ上での血管領域の抽出を行うようにしてもよい。より詳細には、CPU71は、解析チャート504の移動に連動して、MCデータ上での血管解析領域の位置を移動させるようにしてもよい。この場合、CPU71は、血管解析領域を示す表示(例えば、グラフィック404)を、MCデータ402上で移動させてもよい。つまり、解析チャート504による解析領域の移動に連動して、血管解析領域の位置が変化する。
<Linkage between analysis chart and blood vessel analysis area>
For example, the
血管解析領域の移動の結果、MCデータ上での血管解析領域が変更される。そこで、CPU71は、血管解析領域の変更に連動して、変更後の血管解析領域における解析結果を求めてもよい(血管解析の手法については後述する)。
As a result of the movement of the blood vessel analysis area, the blood vessel analysis area on the MC data is changed. Therefore, the
解析チャートと血管解析領域を連動させる場合、CPU71は、第2の画像データ502での解析チャート504の中心504cと、MCデータ402での血管解析領域の中心404cとが、解析上の同一位置に配置されるように、血管解析領域を移動させてもよい。つまり、CPU71は、MCデータ402において、第2の画像データ502における解析チャート504の中心位置に対応する位置に解析領域の中心を設定してもよい。この場合、第2の画像データ502とMCデータ402との間で位置的に関連付け(レジストレーション)されていることが好ましい。
When linking the analysis chart and the blood vessel analysis region, the
ここで、例えば、検者が、解析チャート504の中心504cを、眼底の基準部位(例えば、中心窩中心、視神経乳頭中心、異常部位)に設定した場合、血管解析領域の中心が、眼底の基準部位に自動的に設定される。これによって、MCデータ402上で改めて解析領域を変更しなくとも、解析の基準位置を、解析チャート504による解析とMCデータ402に対する解析との間で一致させることができる。
Here, for example, when the examiner sets the
<血管解析領域の設定>
血管解析領域は、検者が任意に設定できてもよい。例えば、CPU71は、操作部76からの操作信号を受け付け、MCデータ上での血管解析領域の位置を変更してもよい。この場合、血管解析領域を示す表示の位置を変更してもよい。CPU71は、血管解析領域の変更に応じて、変更後の血管解析領域における解析結果を求めてよい。この場合、CPU71は、血管解析領域の移動に連動して、第2の画像データ502上での解析チャート504の位置を移動させるようにしてもよい。この結果、解析チャート504の位置調整の手間を省くことができる。
<Setting of blood vessel analysis area>
The blood vessel analysis area may be arbitrarily set by the examiner. For example, the
なお、複数のモーションコントラストデータの解析を行う場合、第1のモーションコントラストデータにおける血管解析領域の位置の変更に連動して、第2のモーションコントラストデータにおける血管解析領域の位置の設定に用いてもよい。例えば、眼底の深さ方向に関して異なる複数のモーションコントラストデータの解析において適用可能である。また、CPU71は、第1のモーションコントラストデータ上で設定された第1のデータ領域を利用して、第2のモーションコントラストデータの中で第1のデータ領域に位置的に対応する第2のデータ領域でのアーチファクトを除去してもよい(例えば、第2のデータ領域の各画素の輝度において第1のデータ領域の各輝度の輝度を差し引く)。
When analyzing a plurality of motion contrast data, it may be used to set the position of the blood vessel analysis region in the second motion contrast data in conjunction with the change in the position of the blood vessel analysis region in the first motion contrast data. good. For example, it can be applied in the analysis of a plurality of motion contrast data different in the depth direction of the fundus. Further, the
血管解析領域の範囲(サイズ)が検者によって設定できてもよい。血管解析領域の範囲は、眼底上でのMCデータ402の取得領域に応じて設定可能であってもよい。取得領域としては、眼底の表面方向に関して異なる取得領域に応じて設定可能であってもよい。例えば、黄斑部位、乳頭部位に関して、範囲がそれぞれ設定されてもよい。
The range (size) of the blood vessel analysis area may be set by the examiner. The range of the blood vessel analysis region may be set according to the acquisition region of
取得領域に応じた設定としては、眼底の深さ方向に関して異なる取得領域に応じて設定可能であってもよい。例えば、異なる血管層に関して、範囲がそれぞれ設定されてもよい。もちろん、血管層に限定されず、異なる網膜層(又は脈絡膜層)に関して、範囲がそれぞれ設定されてもよい。これによって、眼底上での取得領域に応じた血管解析が可能となる。正面MCデータが血管層毎に複数生成される場合、各血管層の正面MCデータでそれぞれ血管解析領域の範囲が予め設定可能であってもよい。これによって、各血管層に応じた血管解析が可能となる。 As the setting according to the acquisition area, it may be possible to set according to different acquisition areas in the depth direction of the fundus. For example, ranges may be set for different vascular layers. Of course, the range is not limited to the vascular layer, and the range may be set for different retinal layers (or choroidal layers). This enables blood vessel analysis according to the acquisition region on the fundus. When a plurality of frontal MC data are generated for each blood vessel layer, the range of the blood vessel analysis region may be preset in the frontal MC data of each blood vessel layer. This enables blood vessel analysis according to each blood vessel layer.
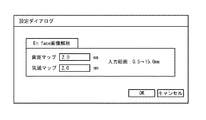
図5は設定画面の例であり、黄斑マップは、黄斑を中心とするモーションコントラストデータ、乳頭マップは、乳頭を中心とするモーションコントラストデータを示しており、マップ単位で、範囲(例えば、直径)が設定される。なお、範囲を設定する場合、例えば、CPU71は、操作部76からの操作信号を受け付けることによってグラフィック404の範囲(サイズ)を変更してもよい。また、血管解析領域の範囲は、解析チャート504と同じ範囲であってもよい。また、解析チャート504の範囲に基づいて、血管解析領域の範囲が設定されてもよい。
FIG. 5 is an example of a setting screen, in which the macula map shows motion contrast data centered on the macula and the papillary map shows motion contrast data centered on the papillary, and the range (for example, diameter) is shown in map units. Is set. When setting the range, for example, the
なお、上記説明においては、血管解析領域の変更パラメータとして、血管解析領域の位置、範囲(サイズ)を設定可能としたが、これに限定されない。例えば、血管解析領域の形状を設定可能であってもよい(例えば、円、楕円、矩形等)。この場合、眼底上でのMCデータ402の取得領域に応じて、血管解析領域の形状が設定可能であってもよい。
In the above description, the position and range (size) of the blood vessel analysis region can be set as the change parameters of the blood vessel analysis region, but the present invention is not limited to this. For example, the shape of the blood vessel analysis region may be set (eg, circle, ellipse, rectangle, etc.). In this case, the shape of the blood vessel analysis region may be set according to the acquisition region of the
血管解析領域は、複数のセクションに分割された領域であってもよく、各セクションにおいて血管解析が実行されてもよい。各セクションの配置位置又は範囲(サイズ)のいずれかが異なる複数の血管解析領域が選択可能であってもよい。 The blood vessel analysis region may be a region divided into a plurality of sections, and blood vessel analysis may be performed in each section. A plurality of blood vessel analysis regions having different arrangement positions or ranges (sizes) of each section may be selectable.
この場合、眼底上でのMCデータ402の取得領域に応じて、血管解析領域の分割パターンが設定可能であってもよい。例えば、Superficial Capillary Plexusは、全体チャート(セクション一つ)、Intermediate Capillary PlexusはS/Iチャート(上下2分割セクション)であってもよい。この場合、血管解析領域の各セクションの配置位置及び範囲は、解析チャート504の各セクションの配置位置及び範囲と同一となるように設定されてもよい。これによって、解析チャート504の各セクションの解析結果と、血管解析領域での各セクションの解析結果とを対応付けて評価できる。よって、眼底の血管解析結果と、眼底の形態解析結果(例えば、層厚)との関連性を、セクション単位で確認できる。
In this case, the division pattern of the blood vessel analysis region may be set according to the acquisition region of the
<血管抽出処理、血管計測>
CPU71は、前述のように設定された血管解析領域にてMCデータ402を解析することによって、設定された血管解析領域での計測結果を表示部75上に表示してもよい。このようにすれば、解析チャートでの計測とMCデータ402に対する計測とをスムーズに行うことができる。なお、解析結果は、例えば、MC表示領域400上に数値406として表示されてもよい。
<Blood vessel extraction processing, blood vessel measurement>
The
例えば、CPU71は、MCデータ上の血管解析領域として設定された領域に関して画像処理による解析を行うことによって、血管領域と非血管領域との判別処理を行う。判別処理によって、血管領域が抽出される。この場合、判別処理によって、非血管領域が抽出されてもよい。
For example, the
判別処理としては、例えば、閾値処理であってもよく、閾値を満たす画素を血管領域とし、閾値を満たさない画素を非血管領域として判別してもよい。閾値自体は、検者によって任意に設定できてもよいし、固定値として予め決定されていてもよい。また、閾値は、MCデータ402に対する画像解析処理を経て設定されてもよい。
The discrimination process may be, for example, a threshold value process, and the pixels that satisfy the threshold value may be defined as the blood vessel region, and the pixels that do not satisfy the threshold value may be discriminated as the non-blood vessel region. The threshold value itself may be arbitrarily set by the examiner, or may be predetermined as a fixed value. Further, the threshold value may be set after performing an image analysis process on the
例えば、CPU71は、判別処理の結果に基づいて血管領域に関する計測を行うようにしてもよい。CPU71は、判別処理によって抽出された血管領域に基づいて、血管領域を計測してもよい。計測結果としては、例えば、血管密度、血管面積であってもよい。血管領域の密度としては、例えば、血管解析領域全体における血管領域の比率を求めることによって、単位面積当たりの血管の面積(血管量)が求められる。計測結果としては、これに限定されず、例えば、血管総量、血管蛇行度、血管の規則性等であってもよい。なお、血管解析領域が、複数のセクションに分割された場合、CPU71は、各セクション間での計測結果の比率、差分を求めてもよい。これによって、例えば、血管の対称性等を求めることができる。
For example, the
<毛細血管の判別>
以下、毛細血管領域に関する計測結果を取得する処理について説明する。毛細血管領域に関する計測を行う場合、CPU71は、血管領域と非血管領域との判別処理後、さらに、血管領域として判別された領域に関して画像処理による解析を行うことによって、大血管と毛細血管との判別処理を行うようにしてもよい。判別処理によって、毛細血管領域が抽出される。
<Discrimination of capillaries>
Hereinafter, the process of acquiring the measurement result regarding the capillary region will be described. When measuring the capillary region, the
判別処理としては、例えば、血管径による判別処理であってもよく、血管径が閾値を下回る血管を毛細血管領域とし、血管径が閾値を超える血管を大血管領域として判別してもよい。これは、血管径に関して、毛細血管が細く、大血管が太いことを利用したものである。血管径を利用することで、血管径が細い毛細血管と、血管径が太い大血管とが的確に区別されうる。なお、血管径を求める場合、CPU71は、血管領域に含まれる各血管径を画像処理によって計測してもよい。例えば、CPU71は、MCデータから検出された血管領域に対し細線化を行い、細線化した線から元の血管径を計測してもよい。血管径の計測手法については、これに限定されず、例えば、血管壁間の距離(例えば、内膜間距離)を計測するようにしてもよい。
The discriminating process may be, for example, a discriminating process based on the blood vessel diameter, and a blood vessel having a blood vessel diameter below the threshold value may be defined as a capillary region, and a blood vessel having a blood vessel diameter exceeding the threshold value may be discriminated as a macrovascular region. This utilizes the fact that the capillaries are thin and the large blood vessels are thick in terms of blood vessel diameter. By using the blood vessel diameter, it is possible to accurately distinguish between a capillary having a small blood vessel diameter and a large blood vessel having a large blood vessel diameter. When determining the blood vessel diameter, the
判別処理としては、例えば、血管の分岐数による判別処理であってもよく、血管の分岐数が閾値を超える血管を毛細血管領域とし、血管の分岐数が閾値を下回る血管を大血管領域として判別してもよい。これは、血管の分岐数に関して、毛細血管が多く、大血管が少ないことを利用したものである。分岐数を利用することで、比較的末端に位置する毛細血管と、比較的基端に位置する大血管とが的確に区別されうる。この場合、乳頭部からの血管の分岐数が基準であってもよいし、大血管の中でも上位の大きさを持つ大血管からの分岐数が基準であってもよい。血管の分岐数を求める場合、CPU71は、血管の分岐点を画像処理によって抽出し、各血管に関する分岐点の数を計測するようにしてもよい。なお、血管径と血管の分岐数を統合して判別処理を行うようにしてもよい。これにより、判別精度が向上される。
The discrimination process may be, for example, a discrimination process based on the number of blood vessel branches. A blood vessel in which the number of blood vessel branches exceeds the threshold is defined as a capillary region, and a blood vessel in which the number of blood vessel branches is below the threshold is defined as a macrovascular region. You may. This utilizes the fact that there are many capillaries and few large blood vessels in terms of the number of branches of blood vessels. By using the number of branches, it is possible to accurately distinguish between capillaries located at the relatively terminal end and large blood vessels located at the relatively base end. In this case, the number of branches of the blood vessel from the papilla may be the reference, or the number of branches from the large blood vessel having the upper size among the large blood vessels may be the reference. When determining the number of branch points of a blood vessel, the
なお、上記説明では、大血管と毛細血管との判別処理として、血管径と分岐数を例にとって説明したが、これに限定されない。例えば、血管の血流速度の違いによる判別処理であってもよい。より詳細には、血流速度が閾値を下回る血管を毛細血管領域とし、血流速度が閾値を超える血管を大血管領域として判別してもよい。これは、血流速度に関して、毛細血管が遅く、大血管が速いことを利用できる。なお、血流速度は、例えば、MCデータにおける毛細血管と大血管との間での輝度の違いを利用して検出されてもよい。この場合、毛細血管が相対的に明るく画像化され、大血管が相対的に暗く画像化される。 In the above description, the blood vessel diameter and the number of branches have been described as an example as a process for discriminating between a large blood vessel and a capillary, but the present invention is not limited to this. For example, it may be a discrimination process based on the difference in blood flow velocity of blood vessels. More specifically, a blood vessel having a blood flow velocity below the threshold value may be determined as a capillary region, and a blood vessel having a blood flow velocity exceeding the threshold value may be determined as a macrovascular region. This can take advantage of slow capillaries and fast macrovascular blood flow velocities. The blood flow velocity may be detected by using, for example, the difference in brightness between the capillaries and the large blood vessels in the MC data. In this case, the capillaries are imaged relatively brightly and the large blood vessels are imaged relatively darkly.
なお、判別処理において血管径、分岐数等に関する閾値が用いられる場合、閾値自体は、検者によって任意に設定できてもよいし、固定値として予め決定されてもよい。固定値の場合、被検体の特性(例えば、年齢、性別のいずれか)に応じて閾値が変動されてもよい。つまり、大血管と毛細血管の判別基準は、検者によって設定されてもよい。なお、大血管と毛細血管の判別処理は、検者の操作を介して行われてもよく、検者がMCデータ上で毛細血管領域を指定していくことによって判別結果が取得されてもよい。もちろん、大血管を指定することで、結果として、大血管以外の毛細血管領域が特定されてもよい。 When a threshold value related to the blood vessel diameter, the number of branches, or the like is used in the discrimination process, the threshold value itself may be arbitrarily set by the examiner or may be predetermined as a fixed value. In the case of a fixed value, the threshold value may be changed according to the characteristics of the subject (for example, either age or gender). That is, the criteria for distinguishing between macrovasculars and capillaries may be set by the examiner. The process of discriminating between macrovasculars and capillaries may be performed through the operation of the examiner, and the discriminant result may be obtained by the examiner designating the capillary region on the MC data. .. Of course, by designating a large blood vessel, a capillary region other than the large blood vessel may be specified as a result.
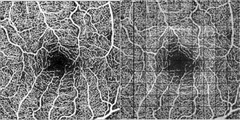
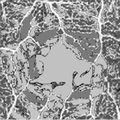
図6は、判別処理の結果の一例であり、図6に示すように、血管全体に関するMCデータ(上図)が、毛細血管に関するMCデータ(中図)と大血管に関するMCデータ(下図)に判別されてもよい。なお、上記処理において、毛細血管領域が抽出されればよく、大血管領域が抽出される必要は必ずしもない。 FIG. 6 is an example of the result of the discrimination process. It may be determined. In the above treatment, the capillary region may be extracted, and the macrovascular region does not necessarily have to be extracted.
<大血管の影響を軽減した毛細血管の計測>
CPU71は、MCデータを解析して毛細血管領域に関する計測結果を取得してもよい。例えば、CPU71は、毛細血管よりも血管径の大きい大血管による計測結果への影響を軽減するための軽減処理を介して毛細血管領域に関する計測結果を取得してもよい。
<Measurement of capillaries with reduced effects of large blood vessels>
The
軽減処理としては、例えば、一定の血管径よりも小さい血管領域に特定した解析処理であってもよい。また、CPU71は、MCデータから毛細血管領域を特定する処理を行うようにしてもよく、特定された毛細血管領域に基づいて毛細血管領域に関する計測結果を取得してもよい。また、CPU71は、血管領域において、大血管領域と毛細血管領域を判別して処理を行い、毛細血管領域として判別された領域に関して計測処理を行うようにしてもよい。つまり、上記判別結果が用いられてもよい。また、血管領域に囲まれた領域を特定し、特定された領域に基づいて毛細血管に関する計測結果を取得してもよい。また、MCデータと眼底正面画像の差分によって毛細血管を特定してもよい。眼底正面画像としては、眼底カメラ又はSLOによって取得された正面画像が用いられてもよい。
The mitigation process may be, for example, an analysis process specific to a blood vessel region smaller than a certain blood vessel diameter. Further, the
以下に、軽減処理の一例を以下に示す。例えば、CPU71は、判別処理の結果に基づいて毛細血管領域に関する計測を行うようにしてもよい。この場合、CPU71は、判別処理によって判別された毛細血管領域に基づいて、毛細血管の血管領域を計測してもよい。計測結果としては、例えば、毛細血管の血管密度、毛細血管の血管面積であってもよい。毛細血管の血管密度としては、例えば、血管解析領域全体における毛細血管領域の比率を求めることによって、単位面積当たりの毛細血管の面積(血管量)が求められる。計測結果としては、これに限定されず、例えば、毛細血管の総量、毛細血管の蛇行度、毛細血管の規則性等であってもよい。なお、血管解析領域が、複数のセクションに分割された場合、CPU71は、各セクション間での計測結果の比率、差分を求めてもよい。これによって、例えば、毛細血管の対称性等を求めることができる。
An example of mitigation processing is shown below. For example, the
上記計測処理によれば、例えば、毛細血管に特定した計測が行われるので、大血管の影響が軽減され、毛細血管の計測をより的確に行うことができる。よって、例えば、毛細血管に係る眼疾患をより的確に評価できる。一方、大血管を含めた計測の場合、大血管は、血管領域全体において一定の比重を占めており、毛細血管に係る計測血管を埋没・変動させる要因となりうる。 According to the above measurement process, for example, since the measurement specific to the capillaries is performed, the influence of the large blood vessels is reduced, and the capillaries can be measured more accurately. Therefore, for example, an eye disease related to capillaries can be evaluated more accurately. On the other hand, in the case of measurement including a large blood vessel, the large blood vessel occupies a certain specific gravity in the entire blood vessel region, and can be a factor for burying and fluctuating the measurement blood vessel related to the capillaries.
なお、上記説明においては、大血管領域と毛細血管領域を判別し、毛細血管領域として判別された領域に対して計測結果を取得したが、これに限定されず、CPU71は、重み付け演算等によって大血管領域の比重を低減するように構築された演算処理を用いて、大血管領域と毛細血管領域を含めた計測処理を行ってもよい。この場合、CPU71は、大血管領域として判別された領域を、毛細血管と同程度に細線化する画像処理を行った後、大血管領域と毛細血管領域を含めた計測処理を行ってもよい。上記のような処理によっても、大血管の影響が軽減された計測結果が得られる。なお、上記説明においては、毛細血管領域に関する計測を行う例を示したが、これに限定されず、判別処理を介して抽出された大血管領域に関する計測を行うようにしてもよい。
In the above description, the macrovascular region and the capillary region are discriminated, and the measurement result is acquired for the region discriminated as the capillary region, but the measurement result is not limited to this, and the
<毛細血管の二次元計測、血管解析マップの取得>
CPU71は、毛細血管領域に関する計測結果を2次元的又は3次元的に求めてもよい。また、CPU71は、毛細血管領域に関する各位置での計測結果に応じて色分けされたカラーマップを出力してもよい。
<Two-dimensional measurement of capillaries, acquisition of blood vessel analysis map>
The
例えば、CPU71は、毛細血管領域の各二次元位置に関して計測処理を行うようにしてもよい。この場合、例えば、毛細血管領域を形成する一画素毎あるいは複数の画素からなる画素群毎に計測処理を行ってもよい。なお、計測範囲としては、例えば、MCデータ上の一部に設定された設定範囲内であってもよいし、MCデータ全体であってもよい。MCデータの一部に設定される設定範囲としては、眼底の基準部位(例えば、中心窩、視神経乳頭中心、異常部位)を中心として設定されてもよい。設定範囲としては、予め設定された所定範囲であってもよいし、検者によって任意に設定された範囲であってもよい。また、設定範囲の形状が任意に変更されてもよい。
For example, the
例えば、CPU71は、毛細血管領域を複数のセクションに分割し、分割された各セクションに関して計測処理を行うようにしてもよい(例えば、図7参照)。この場合、例えば、CPU71は、微小領域毎に計測結果を取得してもよい。より具体的には、256×256の二次元MCデータを、8×8の二次元MCデータ単位で分割することによって、各セクションでの計測結果を求めてもよい。また、CPU71は、比較的広い領域(例えば、2次元)毎に計測結果を取得してもよい。より具体的には、256×256の二次元MCデータを、縦横方向にそれぞれ分割する(例えば、縦横それぞれ3分割、縦横それぞれ4分割)ことによって、各セクションでの計測結果を求めてもよい。なお、毛細血管の計測処理において、定量的な計測値として取得される必要は必ずしもなく、計測結果を段階的に求める手法(例えば、グレード分け)であってもよい。
For example, the
CPU71は、毛細血管領域に関する計測結果に基づいて、血管解析マップを取得するようにしてもよい(例えば、図7参照)。血管解析マップは、表示部75の画面上に表示されてもよい。
The
血管解析マップは、例えば、毛細血管に関する計測結果の二次元分布を示すマップであってもよい。血管解析マップは、例えば、各二次元位置での計測値に応じて色分けされたカラーマップであってもよい。この場合、CPU71は、各二次元位置での計測値に応じた表示色を決定し、決定された表示色にて各位置を表示してもよい。なお、表示色については、計測結果の大小に応じて予め設定された表示色であってもよいし、計測結果に応じて検者が任意に設定してもよい。より詳細には、血管解析マップは、例えば、各セクションでの計測結果に応じて色分けされたカラーマップであってもよい。CPU71は、各セクションに関する計測結果に応じた表示色を決定し、決定された表示色にて各セクションを表示してもよい。
The blood vessel analysis map may be, for example, a map showing a two-dimensional distribution of measurement results relating to capillaries. The blood vessel analysis map may be, for example, a color map color-coded according to the measured values at each two-dimensional position. In this case, the
なお、血管解析マップにおいて、大血管に関して色分け表示が行われないようにしてもよい。また、毛細血管の計測結果に応じて色分けとは異なる色にて大血管に関する計測結果が表示されてもよい。これによって、検者は、毛細血管と大血管が判別されているので、毛細血管の評価を的確に行うことができる。また、血管解析マップは、MCデータに重畳して表示されてもよく、この場合、MCデータの大血管上にはマップによる色分けが重畳表示されない、或いは毛細血管領域とは判別可能な色にて重畳表示が行われてもよい。 In the blood vessel analysis map, the large blood vessels may not be color-coded. Further, the measurement result regarding the large blood vessel may be displayed in a color different from the color coding according to the measurement result of the capillaries. As a result, the examiner can accurately evaluate the capillaries because the capillaries and the large blood vessels are discriminated from each other. Further, the blood vessel analysis map may be displayed by superimposing it on the MC data. In this case, the color coding by the map is not superimposed and displayed on the large blood vessel of the MC data, or the color can be distinguished from the capillary region. Overlapping display may be performed.
なお、血管解析マップの種類としては、例えば、基本マップ、比較マップ、差分マップ、検査日差分マップの少なくともいずれかであってもよい。より詳細には、基本マップは、被検眼の毛細血管に関する計測値の大小が二次元的に表現された基本マップ(例えば、血管密度マップ)であってもよい。比較マップは、毛細血管に関する被検眼の計測値と、正常眼データベースに記憶された毛細血管に関する正常眼データとの比較結果を示す比較マップであってもよい。差分マップは、毛細血管に関する被検眼の計測値と、血管情報データベースに記憶された毛細血管に関する正常眼データとのずれを示すデビエーションマップ(差分マップ)であってもよい。検査日差分マップは、毛細血管に関する被検眼の計測値に関して異なる検査日との差分を示す検査日差分マップであってもよい。 The type of blood vessel analysis map may be, for example, at least one of a basic map, a comparison map, a difference map, and an examination date difference map. More specifically, the basic map may be a basic map (for example, a blood vessel density map) in which the magnitude of the measured value regarding the capillaries of the eye to be examined is two-dimensionally expressed. The comparison map may be a comparison map showing the comparison result between the measured value of the eye to be examined for the capillaries and the normal eye data for the capillaries stored in the normal eye database. The difference map may be a deviation map (difference map) showing the deviation between the measured value of the eye to be examined for the capillaries and the normal eye data for the capillaries stored in the blood vessel information database. The examination date difference map may be an examination date difference map showing the difference between different examination dates and the measured values of the eye to be inspected for capillaries.
血管解析マップを得る場合、例えば、MCデータが層毎に分割処理され、少なくとも一つの層に関して血管解析マップが取得されてもよい。この場合、層領域が異なる複数の血管解析マップが取得されてもよい。また、複数の層領域での血管解析マップが取得されてもよい。なお、層毎の分割処理は、MCデータに対する画像処理(例えば、セグメンテーション)によって行ってもよいし、MCデータの基礎となるOCTデータに対する画像処理(例えば、セグメンテーション)の結果をMCデータに適用してもよい。 When obtaining a blood vessel analysis map, for example, MC data may be divided into layers and a blood vessel analysis map may be obtained for at least one layer. In this case, a plurality of blood vessel analysis maps with different layer regions may be acquired. In addition, blood vessel analysis maps in a plurality of layer regions may be acquired. The layer-by-layer division processing may be performed by image processing (for example, segmentation) on the MC data, or the result of image processing (for example, segmentation) on the OCT data that is the basis of the MC data is applied to the MC data. You may.
なお、血管解析マップを表示する場合、例えば、CPU71は、血管解析マップと、血管解析マップの基礎となるMCデータ(例えば、2次元MCデータ)とを表示部75の同一画面上に同時に表示してもよい(例えば、図8参照)。
When displaying the blood vessel analysis map, for example, the
例えば、CPU71は、得られた血管解析マップを、被検眼のMCデータに重畳させてもよい。これによって、MCデータ上での血管の消失領域を容易に確認できる。なお、血管解析マップを重畳させる場合、CPU71は、正常眼データにおける正常範囲を超えた領域を、異常領域として強調する表示を行うようにしてもよい。例えば、CPU71は、得られた血管解析マップを、被検眼の正面画像に重畳させてもよい。眼底正面画像としては、赤外正面画像、カラー正面画像、OCTデータに基づく正面画像であってもよい。
For example, the
なお、CPU71は、計測部位に応じて血管解析マップを変更してもよい。この場合、出力されるマップが、計測部位に応じて予め設定されていてもよいし、検者が任意に設定できてもよい。
The
例えば、計測部位に応じて、血管解析マップにおけるセクションの数を変更してもよい。より詳細には、例えば、黄斑部位のMCデータについては、分割するセクション数が比較的多く、乳頭部位のMCデータについては、分割するセクション数が比較的に少なく設定されてもよい。これは、黄斑部については、詳細な計測結果が求められ、乳頭部については、全体的な計測結果が求められる可能性があるからである。また、計測部位に応じて、血管解析マップの基礎となるMCデータの深さ領域を変更してもよい。より詳細には、例えば、黄斑部位のMCデータについては、網膜の手前の領域(例えば、NFL〜IPL)に関する血管解析マップが設定され、乳頭部位については、網膜全体の領域(例えば、NFL〜RPE)に関する血管解析マップが設定されてもよい。 For example, the number of sections in the blood vessel analysis map may be changed depending on the measurement site. More specifically, for example, the number of sections to be divided may be set to be relatively large for the MC data of the macula site, and the number of sections to be divided may be set to be relatively small for the MC data of the papillary site. This is because detailed measurement results may be required for the macula, and overall measurement results may be required for the papilla. Further, the depth region of the MC data, which is the basis of the blood vessel analysis map, may be changed according to the measurement site. More specifically, for example, for the MC data of the macula site, a vascular analysis map for the region in front of the retina (eg, NFL to IPL) is set, and for the papillary site, the region of the entire retina (eg, NFL to RPE). ) May be set.
また、CPU71は、解析疾患に応じて血管解析マップを変更してもよい。この場合、出力されるマップが、計測部位に応じて予め設定されていてもよいし、検者が任意に設定できてもよい。
Further, the
例えば、解析疾患に応じて、血管解析マップにおけるセクションの数、セクションの配置位置、血管解析マップの基礎となるMCデータの深さ領域の少なくともいずれかを変更してもよい。例えば、糖尿病性網膜症の場合、網膜上において比較的に浅い領域(手前側)において虚血が生じる。 For example, depending on the analysis disease, at least one of the number of sections in the blood vessel analysis map, the position of the sections, and the depth region of the MC data on which the blood vessel analysis map is based may be changed. For example, in the case of diabetic retinopathy, ischemia occurs in a relatively shallow region (front side) on the retina.
一方、BRVO(Branch retinal vein occlusion: 網膜静脈分枝閉塞症)、CRVO (Central retinal vein occlusion: 網膜中心静脈閉塞症)、BRAO (Branch retinal artery occlusion: 網膜動脈分枝閉塞症)、CRAO (Central retinal artery occlusion: 網膜中心動脈閉塞症) の場合、網膜全体において虚血が生じる。そこで、病変に応じてMCデータの深さ領域を変更することで、病変の評価を好適に行うことができる。 On the other hand, BRVO (Branch retinal vein occlusion: branch retinal vein occlusion), CRVO (Central retinal vein occlusion: central retinal vein occlusion), BRAO (Branch retinal artery occlusion: branch retinal vein occlusion), CRAO (Central retinal) In the case of artery occlusion), ischemia occurs throughout the retina. Therefore, the lesion can be evaluated suitably by changing the depth region of the MC data according to the lesion.
また、血管解析マップにおけるセクションの数については、例えば、CRVOの場合、乳頭辺りが起因とされるので、正面方向(深さ方向と直交する方向)に関して眼底全体に均一にセクションが設定されてもよい。一方、BRVOの場合、上耳側に発症するとされているので、上耳側に関してセクションの数が多く、他の領域に関してセクションの数を少なくしてもよい。つまり、病変に応じて、セクションの数、セクションの配置位置の少なくともいずれかを変更してもよい。 Regarding the number of sections in the blood vessel analysis map, for example, in the case of CRVO, the area around the papilla is considered to be the cause, so even if the sections are set uniformly over the entire fundus in the front direction (direction orthogonal to the depth direction). good. On the other hand, in the case of BRVO, since it is said that the onset occurs on the upper ear side, the number of sections may be large on the upper ear side and may be small on the other regions. That is, at least one of the number of sections and the arrangement position of the sections may be changed according to the lesion.
<血管密度マップの例>
以下に、血管解析マップの一例として、毛細血管に関する血管密度の二次元分布を示す血管密度マップを示す(図7、図9参照)。
<Example of blood vessel density map>
Below, as an example of the blood vessel analysis map, a blood vessel density map showing a two-dimensional distribution of blood vessel density with respect to capillaries is shown (see FIGS. 7 and 9).
図7のマップは、各セクションでの計測値(血管密度)に応じて色分けされたカラーマップの一例である。例えば、CPU71は、予め設定されたセクション毎の計測値に応じたカラーマップを生成し、生成されたカラーマップを表示部75上に表示してもよい。計測値に応じて表示色を変えることで、血管の消失を容易に把握できる。
The map of FIG. 7 is an example of a color map color-coded according to the measured value (blood vessel density) in each section. For example, the
さらに、上記のようにセクション単位でカラーマップを表示する場合、セクションの形状、数の少なくともいずれかが任意に変更されてもよい。これによって、疾患に応じた密度表示を行うようにしてもよい。 Further, when the color map is displayed in section units as described above, at least one of the shape and the number of sections may be arbitrarily changed. As a result, the density may be displayed according to the disease.
なお、CPU71は、得られた血管密度マップと同一範囲に関して、血管情報データベースに記憶された正常眼の血管密度分布データと、被検眼の血管密度分布データとを比較してもよく、比較結果の表示によって、検者は、正常眼に対する被検眼の血管の消失状態を容易に確認できる。比較結果を表示する場合、正常眼データと被検眼データとの差分マップが有用である。また、CPU71は、比較結果として、正常眼データに基づく血管密度マップと、被検眼データに基づく血管密度マップとを表示部75上に同時に表示してもよい。
The
また、CPU71は、得られた血管密度マップと同一範囲に関して、血管情報データベースに記憶された被検眼の過去の血管密度分布データと、被検眼の現在の血管密度分布データとを比較してもよく、比較結果の表示によって、検者は、血管の消失状態に関する経時的な変化を容易に確認できる。比較結果を表示する場合、過去の被検眼データと現在の被検眼データとの差分マップが有用である。また、CPU71は、比較結果として、過去の被検眼データに基づく血管密度マップと、現在の被検眼データに基づく血管密度マップとを表示部75上に同時に表示してもよい。
Further, the
なお、血管解析マップの表示手法として、例えば、CPU71は、図9に示すように、MCデータにおける血管領域に基づいて血管で囲まれた領域を特定することによって、結果的に、毛細血管に関する計測結果の二次元分布を求めてもよい。
As a method of displaying the blood vessel analysis map, for example, as shown in FIG. 9, the
この場合、CPU71は、例えば、各血管の連結性を画像処理によって判定し、非血管領域の周囲が血管によって囲まれているか否かによって、血管で囲まれた領域を特定してもよい。この場合、必ずしも非血管領域が360度囲まれている必要はなく、一定量囲まれた状態であれば、血管で囲まれた領域であると判別してもよい。
In this case, the
より詳細には、CPU71は、血管で囲まれた領域の面積を算出してもよい。CPU71は、各領域において、算出された面積に応じた色分け表示を行うようにしてもよい。色分けとしては、少なくとも2色が用いられる。例えば、図9のように、狭い領域が第1の色(例えば、赤)で表示され、広い領域が第2の色(例えば、緑)で表示されてもよい。毛細血管が消失するにつれ、第1の色の領域が減少し第2の色の領域が増えるので、これらの色分布によって、毛細血管の消失を容易に把握できる。このような表示手法によれば、血管自体は面積としてカウントされないので、結果として、大血管による影響が軽減され、毛細血管の消失状態を的確に把握できる。
More specifically, the
なお、毛細血管の消失状態を求める場合、非血管領域のうち、最も近い血管からの距離が閾値以上である部分を色分けしてもよい。 When determining the disappearance state of capillaries, the portion of the non-vascular region where the distance from the nearest blood vessel is equal to or greater than the threshold value may be color-coded.
なお、上記説明においては、血管密度マップを例として説明したが、これに限定されず、上記のような表示形態においては、他の血管解析マップにおいても適用可能であることはいうまでもない。 In the above description, the blood vessel density map has been described as an example, but the present invention is not limited to this, and it goes without saying that the above display form can be applied to other blood vessel analysis maps.
<血管情報データベース>
記憶部74には、血管情報データベースが記憶されてもよい。血管情報データベースに記憶されたデータは、例えば、取得された被検眼の計測結果との比較に用いられてもよく、血管に関する計測結果である血管計測結果(例えば、血管密度、血管面積、毛細血管の総量、毛細血管の蛇行度、毛細血管の規則性等)の少なくともいずれかがデータベースとして記憶される。
<Blood vessel information database>
The blood vessel information database may be stored in the
血管情報データベースとしては、例えば、正常眼データベースであってもよく、正常眼の血管計測結果が記憶される。正常眼データベースは、例えば、実際に計測された被検眼の計測結果との比較に用いられてもよい。 The blood vessel information database may be, for example, a normal eye database, and the blood vessel measurement results of the normal eye are stored. The normal eye database may be used, for example, for comparison with the actually measured measurement results of the eye to be inspected.
正常眼データベースは、多数の正常眼の血管計測結果を統合することによって作成されてもよく、例えば、多数の正常眼の血管計測結果から取得された統計的な計測値が記憶されてもよい。この場合、例えば、多数の眼についての血管計測結果を取得し、正常眼の血管計測結果を統合することによって、正常眼データベースが構築されてもよい。なお、上記のような正常眼データベースは、人種、性別、眼特性(例えば、眼軸長)毎に構築され、記憶部74に記憶されてもよい。
The normal eye database may be created by integrating a large number of normal eye blood vessel measurement results, and for example, statistical measurement values obtained from a large number of normal eye blood vessel measurement results may be stored. In this case, for example, a normal eye database may be constructed by acquiring blood vessel measurement results for a large number of eyes and integrating the blood vessel measurement results of normal eyes. The normal eye database as described above may be constructed for each race, gender, and eye characteristic (for example, axial length) and stored in the
血管情報データベースとしては、例えば、経過観察(フォローアップ)用データベースであってもよく、各被検眼の過去の血管計測結果が記憶される。経過観察用データベースは、例えば、新たに取得された被検眼の計測結果との比較に用いられてもよいし、異なる時期に取得された過去の計測結果の比較に用いられてもよい。経過観察用データベースとしては、例えば、経過観察において取得される計測結果が計測時期(例えば、日時)と共に、被検者毎に記憶されてもよい。 The blood vessel information database may be, for example, a follow-up database, and the past blood vessel measurement results of each eye to be examined are stored. The follow-up database may be used, for example, for comparison with newly acquired measurement results of the eye to be inspected, or for comparison with past measurement results acquired at different times. As the follow-up database, for example, the measurement results acquired in the follow-up observation may be stored for each subject together with the measurement time (for example, the date and time).
上記のような血管情報データベースにおいて、大血管の影響を軽減した状態で計測結果を取得しデータベース化することによって、大血管の影響が軽減されたデータベースが構築される。このような血管情報データベースを活用することによって、被検眼の毛細血管の解析をより的確に行うことができる。 In the above-mentioned blood vessel information database, a database in which the influence of large blood vessels is reduced is constructed by acquiring measurement results in a state where the influence of large blood vessels is reduced and creating a database. By utilizing such a blood vessel information database, it is possible to more accurately analyze the capillaries of the eye to be inspected.
<深さ方向を考慮した血管計測>
血管計測を行う場合、CPU71は、MCデータを解析して、特定の深さ領域での血管領域に関する計測結果を取得してもよい。さらに、CPU71は、深さ領域の計測範囲に基づいて計測結果を補正してもよい。特定の深さ領域での血管領域としては、所定の層(網膜層全体でもよいし、脈絡膜全体でもよい)であってもよいし、3次元データにおける一部の深さ領域が抽出されたデータであってもよい。
<Measurement of blood vessels considering the depth direction>
When performing blood vessel measurement, the
例えば、CPU71は、深さ方向における計測範囲を考慮して、血管領域に関する計測を行うようにしてもよい。例えば、CPU71は、MCデータに基づいて算出された血管領域の計測結果を、深さ方向における計測範囲に基づいて補正してもよい。例えば、正面MCデータに基づいて算出された血管領域に関する二次元的な計測結果を、深さ方向における計測範囲に基づいて補正してもよい。
For example, the
深さ方向における計測範囲としては、例えば、図10に示すように、血管計測に用いた正面MCデータに対応する深さ方向での計測範囲D1の大きさ(サイズ)であってもよい。この場合、CPU71は、正面MCデータに基づいて算出された血管領域の計測結果を、計測範囲D1の大きさによって補正してもよい。
The measurement range in the depth direction may be, for example, the size of the measurement range D1 in the depth direction corresponding to the front MC data used for the blood vessel measurement, as shown in FIG. In this case, the
特定の深さ領域に関するMCデータとしては、特定の深さ領域での3次元モーションコントラストデータに基づくOCT正面モーションコントラストデータであってもよく、CPU71は、深さ領域の計測範囲に基づいて、特定の深さ領域での血管領域に関する二次元的な計測結果を補正してもよい。
The MC data relating to the specific depth region may be OCT frontal motion contrast data based on the three-dimensional motion contrast data in the specific depth region, and the
より詳細には、3次元MCデータ全体から深さ方向の部分領域に関する3次元MCデータを選択することによって、正面MCデータが生成される場合、CPU71は、深さ計測範囲として、当該部分領域の深さ方向での大きさを得るようにしてもよい。
More specifically, when the front MC data is generated by selecting the 3D MC data relating to the partial region in the depth direction from the entire 3D MC data, the
ここで、CPU71は、基準となる計測範囲の大きさよりも計測範囲D1が大きい場合、基準に対して深さ方向における計測範囲が増分するので、増分に応じて計測結果を低く算出してもよい。一方、CPU71は、基準となる計測範囲の大きさよりも計測範囲D1が小さい場合、基準眼に対して深さ方向における計測範囲が減少するので、減少分に応じて計測結果を高く算出してもよい。
Here, when the measurement range D1 is larger than the size of the reference measurement range, the
上記補正によれば、深さ方向での計測範囲の大きさの違いによる計測結果の変動が補正され、血管領域をより定量的に計測できる。例えば、血管の消失状態の評価において、正面MCデータのみによって計測値を得る場合、深さ方向の情報が考慮されない。したがって、血管に関する計測値が一定の場合、計測範囲の大きさが違っても、同じ結果として出力されてしまうので、血管密度等の評価において改善の余地がある。上記構成によれば、計測範囲の違いを考慮した計測が可能であり、血管密度等をより的確に求めることができる。なお、計測結果が取得される各二次元位置(例えば、セクション)にて深さ方向における計測範囲が取得され、二次元位置毎に補正が行われてもよい。 According to the above correction, the fluctuation of the measurement result due to the difference in the size of the measurement range in the depth direction is corrected, and the blood vessel region can be measured more quantitatively. For example, in the evaluation of the disappearance state of blood vessels, when the measured value is obtained only from the front MC data, the information in the depth direction is not considered. Therefore, when the measured value for blood vessels is constant, the same result is output even if the size of the measurement range is different, so there is room for improvement in the evaluation of blood vessel density and the like. According to the above configuration, it is possible to perform measurement in consideration of the difference in measurement range, and it is possible to obtain blood vessel density and the like more accurately. The measurement range in the depth direction may be acquired at each two-dimensional position (for example, a section) from which the measurement result is acquired, and correction may be performed for each two-dimensional position.
特定の深さ領域に関するMCデータとしては、特定の層領域に関するOCT正面モーションコントラストデータであってもよく、CPU71は、層領域の厚みデータに基づいて、特定の深さ領域での血管領域に関する二次元的な計測結果を補正してもよい。
The MC data relating to the specific depth region may be OCT frontal motion contrast data relating to the specific layer region, and the
より詳細には、正面MCデータが、所定の網膜層(例えば、視神経線維層:NFL)での3次元MCデータに基づいて取得された場合、CPU71は、例えば、被検眼における所定の網膜層の厚みデータを取得し、取得された厚みデータによって計測結果を補正してもよい。
More specifically, when frontal MC data is acquired based on three-dimensional MC data in a given retinal layer (eg, optic nerve fiber layer: NFL), the
ここで、CPU71は、基準の厚みデータ(例えば、血管情報データベースの正常眼データに対応する所定網膜層の計測値)に対して被検眼の網膜厚が大きい場合、基準眼でのデータに対して所定網膜層の体積が増分するので、厚みの増分に応じて計測結果を低く算出してもよい。一方、CPU71は、基準の厚みデータに対して被検眼の網膜厚が小さい場合、基準眼でのデータに対して所定網膜層の体積が減少するので、厚みの増分に応じて計測結果を高く算出してもよい。なお、所定網膜層の厚みデータは、MCデータの基礎となるOCTデータに基づいて取得されてもよいし、3次元MCデータにおける血管網間の距離に基づいて取得されてもよい。
Here, when the retina thickness of the eye to be inspected is large with respect to the reference thickness data (for example, the measured value of the predetermined retinal layer corresponding to the normal eye data of the blood vessel information database), the
上記補正によれば、網膜層の厚みの違いによる計測結果の変動が補正され、血管領域をより定量的に計測できる。例えば、血管の消失状態の評価において、正面MCデータのみによって計測値を得る場合、深さ方向の情報が考慮されない。したがって、血管に関する計測値が一定の場合、網膜厚が違っても、同じ結果として出力されてしまうので、血管密度等の評価において改善の余地がある。上記構成によれば、網膜厚の違いを考慮した計測が可能であり、血管密度等をより的確に求めることができる。 According to the above correction, the fluctuation of the measurement result due to the difference in the thickness of the retinal layer is corrected, and the blood vessel region can be measured more quantitatively. For example, in the evaluation of the disappearance state of blood vessels, when the measured value is obtained only from the front MC data, the information in the depth direction is not considered. Therefore, when the measured value for blood vessels is constant, the same result is output even if the retina thickness is different, so there is room for improvement in the evaluation of blood vessel density and the like. According to the above configuration, it is possible to perform measurement in consideration of the difference in retina thickness, and it is possible to more accurately obtain the blood vessel density and the like.
例えば、ある眼疾患の初期段階等において、血管密度の減少よりも組織の減少の方が早いような場合、上記補正を行うことで、血管密度結果が増加する方向となる。逆に、例えば、ある眼疾患の初期段階等において、組織の減少よりも血管密度の減少の方が早いような場合、上記補正を行うことで、血管密度結果が減少する方向となる。この場合、補正された計測結果を用いて経過観察を行うことで、眼疾患の早期発見につながる可能性がありうる。 For example, in the initial stage of a certain eye disease or the like, when the decrease in tissue is faster than the decrease in blood vessel density, the above correction tends to increase the blood vessel density result. On the contrary, for example, in the initial stage of a certain eye disease, when the decrease in blood vessel density is faster than the decrease in tissue, the above correction tends to decrease the blood vessel density result. In this case, follow-up observation using the corrected measurement result may lead to early detection of eye disease.
なお、上記説明においては、所定の網膜層としてNFLを例としたが、これに限定されず、CPU71は、眼底の層領域(例えば、他の網膜層又は脈絡膜層)において、上記実施例を適用してもよい。層領域としては、単一の層からなる領域であってもよいし、複数の層からなる領域であってもよい。
In the above description, the NFL is taken as an example as the predetermined retinal layer, but the
なお、上記説明においては、深さ方向での計測範囲を考慮して計測結果を補正したが、これに限定されない。例えば、CPU71は、3次元MCデータに基づいて3次元的な計測を行うようにしてもよい。
In the above description, the measurement result is corrected in consideration of the measurement range in the depth direction, but the present invention is not limited to this. For example, the
より詳細には、CPU71は、血管計測結果(例えば、血管密度)の分布を3次元的に求めるようにしてもよい。この場合、CPU71は、3次元MCデータを処理して所定の深さ領域(例えば、所定の網膜層)における血管領域を3次元的に抽出すると共に、抽出された血管領域の計測結果を3次元的に求めてもよい。CPU71は、抽出された3次元的な血管領域を複数のブロックに分割し、分割された各ブロックに関して計測処理を行うようにしてもよい。この場合、例えば、CPU71は、微小領域毎に計測結果を取得してもよい。より具体的には、256×256×256の三次元MCデータを、8×8×8の三次元MCデータ単位で分割することによって、各ブロックでの計測結果を求めてもよい(例えば、図11参照)。また、CPU71は、比較的広い領域毎に計測結果を取得してもよい。より具体的には、256×256×256の三次元MCデータを、3次元方向にそれぞれ分割(例えば、3〜10分割)することによって、各ブロックでの計測結果を求めてもよい。
More specifically, the
3次元的に求められる結果としては、例えば、血管領域の体積、血管領域の3次元的な血管密度分布であってもよい。3次元的な血管密度分布を求める場合、CPU71は、3次元MCデータを処理して所定の深さ領域における血管領域の体積を求めると共に、所定の深さ領域における3次元MCデータの体積を血管領域の体積で割ることによって、血管領域の3次元的な密度を求めることができる。
The result obtained three-dimensionally may be, for example, the volume of the blood vessel region and the three-dimensional blood vessel density distribution of the blood vessel region. When obtaining the three-dimensional blood vessel density distribution, the
CPU71は、3次元的に求められた計測結果の分布をカラーマップとして表示してもよい。例えば、CPU71は、前述のように求められる各ブロックでの計測結果に応じて色分けされた3次元画像を表示してもよい。また、CPU71は、血管で囲まれた領域を3次元的に計測することによって、結果的に、毛細血管に関する計測結果の3次元分布を求めてもよい。この場合、CPU71は、例えば、各血管の連結性を画像処理によって判定し、非血管領域の周囲が血管によって囲まれているか否かによって、血管で囲まれた領域を抽出してもよい。この場合、必ずしも非血管領域が3次元方向において360度囲まれている必要はなく、一定量囲まれた状態であれば、血管で囲まれた領域であると判別してもよい。より詳細には、CPU71は、血管で囲まれた領域の体積を算出してもよい。CPU71は、各領域において、算出された体積に応じた色分け表示を行うようにしてもよい。
The
<OCT血管解析マップとOCT形態解析マップの表示>
CPU71は、OCTによって取得されたMCデータに基づく血管解析マップと、眼科OCTデータに基づく形態解析マップと、をモニタ上に同時に表示してもよい。
<Display of OCT blood vessel analysis map and OCT morphological analysis map>
The
例えば、被検眼の血管計測結果に関する血管解析マップを表示する場合、CPU71は、被検眼の形態計測結果に関する形態解析マップ(例えば、網膜厚に関するマップ)と同時に表示するようにしてもよい(例えば、図12参照)。例えば、CPU71は、血管解析マップと形態解析マップとを並列して表示してもよい。
For example, when displaying the blood vessel analysis map regarding the blood vessel measurement result of the eye to be inspected, the
例えば、CPU71は、眼底における共通の層領域に関して血管解析マップと形態解析マップを同時に表示してもよい。この場合、深さ方向に関して共通する領域に関して、被検眼の血管情報と形態情報との相関性を容易に求めることができる。
For example, the
例えば、所定の網膜層の厚みに関する形態解析マップにおいて、網膜層の厚みが薄い場合、血管解析マップを同時に確認することによって、厚み減少が、血管の減少によるものか、あるいは他の要因によるものか否かを容易に把握できる。この場合、CPU71は、計測時期が異なる血管解析マップと形態解析マップとを取得しておき、血管解析マップと形態解析マップとを時系列に同時に表示するようにしてもよい。
For example, in the morphological analysis map relating to the thickness of a predetermined retinal layer, when the thickness of the retinal layer is thin, by checking the blood vessel analysis map at the same time, whether the thickness decrease is due to the decrease in blood vessels or due to other factors. Whether or not it can be easily grasped. In this case, the
なお、血管解析マップの種類としては、例えば、前述のように、基本マップ、比較マップ、差分マップ、検査日差分マップが考えられる。また、形態解析マップとしては、例えば、眼底に関する形態計測結果の二次元分布を示すマップであってもよい。この場合、例えば、例えば、計測値に応じて色分けされたカラーマップであってもよい。解析マップとしては、例えば、層厚を示す厚みマップ(基本マップ)、被検眼の層厚と正常眼データベースに記憶された正常眼の層厚との比較結果を示す比較マップ、被検眼の層厚と正常眼データベースに記憶された正常眼の層厚とのずれを標準偏差にて示す差分マップ(デビエーションマップ)、各検査日との厚みの差分を示す検査日比較厚み差分マップ、であってもよい。 As the type of the blood vessel analysis map, for example, as described above, a basic map, a comparison map, a difference map, and an examination date difference map can be considered. Further, the morphological analysis map may be, for example, a map showing a two-dimensional distribution of morphological measurement results relating to the fundus. In this case, for example, a color map that is color-coded according to the measured value may be used. Examples of the analysis map include a thickness map (basic map) showing the layer thickness, a comparison map showing the comparison result between the layer thickness of the eye to be inspected and the layer thickness of the normal eye stored in the normal eye database, and the layer thickness of the eye to be inspected. Even if it is a difference map (deviation map) that shows the deviation from the layer thickness of the normal eye stored in the normal eye database by the standard deviation, and an examination date comparison thickness difference map that shows the difference in thickness from each examination date. good.
層厚を求める場合、例えば、OCTデータに対する画像処理(例えば、セグメンテーション処理)によってOCTデータが層毎に分割処理され、層境界の間隔に基づいて各層の厚みが計測されてもよい。もちろん、形態計測結果としては、層厚に限定されない。また、解析マップとしては、層厚マップに限定されず、例えば、眼底の曲率分布を示すマップであってよい。 When determining the layer thickness, for example, the OCT data may be divided into layers by image processing (for example, segmentation processing) on the OCT data, and the thickness of each layer may be measured based on the interval between the layer boundaries. Of course, the morphological measurement result is not limited to the layer thickness. The analysis map is not limited to the layer thickness map, and may be, for example, a map showing the curvature distribution of the fundus.
ここで、血管解析マップが形態解析マップと共に表示部75に同時に表示される場合、同じ特性のマップを同時に表示することによって、形態情報と血管情報での比較を目的に応じてより的確に行うことができる。例えば、血管解析マップの基本マップと、形態解析マップの基本マップとが同時に表示されてもよい。同様に、各比較マップが同時に表示されてもよいし、各差分マップが同時に表示されてもよいし、各検査日差分マップが同時に表示されてもよい。
Here, when the blood vessel analysis map is simultaneously displayed on the
なお、形態解析マップは、眼底正面画像にカラーマップ(例えば、層厚に関するマップ)が重畳された表示形式であってもよい。眼底正面画像は、眼底カメラ、SLOによって取得されてもよいし、OCTデータに基づいて取得されたOCT正面画像であってもよい。また、正面MC画像にカラーマップ(例えば、層厚に関するマップ)が重畳された表示形式であってもよい。 The morphological analysis map may be in a display format in which a color map (for example, a map related to layer thickness) is superimposed on the frontal image of the fundus. The fundus frontal image may be acquired by a fundus camera, SLO, or may be an OCT frontal image acquired based on OCT data. Further, a display format in which a color map (for example, a map related to layer thickness) is superimposed on the front MC image may be used.
また、血管解析マップと形態解析マップとが同時に表示される場合、各マップは、正面MCデータにカラーマップが重畳された形式であってもよい。このような表示によって、MCデータの画像に対し、血管解析結果と形態解析血管の相関を容易に求めることができる。この場合、MCデータと、血管解析マップと、形態解析マップとが同時に表示されてもよい。また、各マップは、眼底正面画像にカラーマップが重畳された形式であってもよい。このような表示によって、眼底正面画像に対し、血管解析結果と形態解析血管の相関を容易に求めることができる。眼底正面画像としては、赤外正面画像、カラー正面画像、OCTデータに基づく正面画像であってもよい。 When the blood vessel analysis map and the morphological analysis map are displayed at the same time, each map may be in a format in which a color map is superimposed on the front MC data. With such a display, the correlation between the blood vessel analysis result and the morphological analysis blood vessel can be easily obtained for the image of the MC data. In this case, the MC data, the blood vessel analysis map, and the morphological analysis map may be displayed at the same time. Further, each map may be in a format in which a color map is superimposed on the frontal image of the fundus. With such a display, the correlation between the blood vessel analysis result and the morphological analysis blood vessel can be easily obtained for the frontal image of the fundus. The frontal image of the fundus may be an infrared frontal image, a color frontal image, or a frontal image based on OCT data.
<血管計測結果と形態計測結果の統合>
CPU71は、被検眼の血管計測結果と、被検眼の形態計測結果とを統合した計測処理を行うようにしてもよい。二次元分布として各計測結果が取得される場合、例えば、CPU71は、統合計測処理の結果を、単一のカラーマップ又は解析チャートとして表示するようにしてもよい(例えば、図13参照)。CPU71は、被検眼の血管計測結果と、被検眼の形態計測結果とを統合した統合値を求めても良い。
<Integration of blood vessel measurement results and morphological measurement results>
The
統合計測を行う場合、CPU71は、血管計測結果と形態計測結果の各計測値の代表値(例えば、平均値、合算値)を求めてもよいし、各計測値との間で一定の重み付けを行う重みづけ演算であってもよい。この場合、各計測値の単位が一致しない場合(例えば、密度と厚み)、所定の統合パラメータが設定され、血管計測結果と形態計測結果と間で、任意の係数が設定されてもよい。
When performing integrated measurement, the
また、上記と同様に、CPU71は、被検眼の視野計測の結果と、被検眼の血管計測の結果とを、同一画面上に同時に表示してもよい。また、CPU71は、被検眼の視野計測の結果と、被検眼の血管計測の結果とを統合した計測処理を行い、統合計測結果を表示するようにしてもよい。
Further, similarly to the above, the
もちろん、CPU71は、被検眼の形態計測の結果と、被検眼の視野計測の結果と、被検眼の血管計測の結果とを、同一画面上に同時に表示してもよい。また、CPU71は、被検眼の形態計測の結果と、被検眼の視野計測の結果と、被検眼の血管計測の結果とを統合した計測処理を行い、統合計測結果を表示するようにしてもよい。
Of course, the
<血管解析チャート>
なお、上記説明によれば、計測結果を血管解析マップとして表示したが、これに限定されず、血管解析チャートとして出力してもよい。
<Blood vessel analysis chart>
According to the above description, the measurement result is displayed as a blood vessel analysis map, but the present invention is not limited to this, and the measurement result may be output as a blood vessel analysis chart.
例えば、血管解析チャートは、予め設定されたセクションでの血管計測結果の基本統計量を計測するための血管解析チャートであってもよく、セクション内での基本統計量が計測されてもよい。血管解析チャートを形成するセクションは、一つの領域であってもよいし、複数のセクションであってもよい。複数のセクションの場合、分割されたセクション毎に基本統計量が計測されてもよい。基本統計量としては、代表値(平均値、中央値、最頻値、最大値、最小値、など)、散布度(分散、標準偏差、変動係数)などであってもよい。 For example, the blood vessel analysis chart may be a blood vessel analysis chart for measuring the basic statistic of the blood vessel measurement result in a preset section, or the basic statistic in the section may be measured. The sections forming the blood vessel analysis chart may be one region or a plurality of sections. In the case of a plurality of sections, the basic statistic may be measured for each divided section. The basic statistic may be a representative value (mean value, median value, mode value, maximum value, minimum value, etc.), dispersal degree (variance, standard deviation, coefficient of variation), or the like.
例えば、血管解析チャートは、血管計測結果の二次元的な分布につき、領域毎の平均を求めるチャートであってもよい。血管解析チャートには、所定領域での血管計測結果を数値にて表示する数値表示領域が付されてもよい。 For example, the blood vessel analysis chart may be a chart for obtaining the average for each region for the two-dimensional distribution of the blood vessel measurement results. The blood vessel analysis chart may be provided with a numerical display area for displaying the blood vessel measurement result in a predetermined area numerically.
<経過観察>
なお、CPU71は、MCデータに基づく血管計測結果を時系列データを記憶部74から取得し、取得された血管計測結果を経時的に表示するようにしてもよい(例えば、図14参照)。例えば、CPU71は、血管計測結果の経時変化を示すグラフを表示してもよいし、取得時期が異なる複数の血管解析マップを時系列で並べるようにしてもよい。取得時期が異なる複数の血管解析マップをタイムラプス画像として表示してもよい。CPU71は、血管計測結果に関して、第1の取得時期と第2の取得時期との間の差分を求めるようにしてもよい。CPU71は、血管計測結果の二次元分布において第1の取得時期と第2の取得時期との間の差分を求めることによって、二次元分布の差分マップを表示してもよい。
<Follow-up>
The
なお、上記説明においては、大血管の影響を軽減して計測を行う点について説明したが、<血管解析マップ>、<血管密度マップ>、<血管情報データベース>、<深さ方向を考慮した血管計測>、<血管解析マップと厚み解析マップの表示>、<血管計測結果と形態計測結果の統合>、<血管解析チャート>、<経過観察>等の項目、また以下に説明される項目、あるいは、他の部分で示した技術内容につき、大血管を含めた計測においても適用できる手法について実施可能である。もちろん、大血管に特定した血管計測を行うようにしてもよい。同様に、他の項目についても、並列的に実施されてもよいし、独立して実施されてもよい。 In the above explanation, the point that the influence of the large blood vessel is reduced and the measurement is performed has been described, but <blood vessel analysis map>, <blood vessel density map>, <blood vessel information database>, <blood vessel considering the depth direction Items such as <Measurement>, <Display of blood vessel analysis map and thickness analysis map>, <Integration of blood vessel measurement result and morphological measurement result>, <Vessel analysis chart>, <Follow-up>, or items explained below, or , Regarding the technical contents shown in other parts, it is possible to implement a method that can be applied to measurement including large blood vessels. Of course, blood vessel measurement specific to a large blood vessel may be performed. Similarly, other items may be implemented in parallel or independently.
なお、上記説明においては、OCTによって取得されたMCデータを例として説明したが、被検眼の眼底正面画像を撮像する眼底撮像装置(例えば、眼底カメラ、走査型レーザ検眼鏡(SLO))によって取得される眼底正面画像に含まれる眼底血管の計測においても、上記実施形態の適用は可能である。この場合、眼底正面画像としては、被検眼からの反射光による正面画像データ(例えば、カラー眼底画像)、被検眼からの蛍光による正面画像データの少なくともいずれかであってもよい。また、OCTモーションコントラストデータとこれらの組み合わせた解析が行われてもよい。 In the above description, the MC data acquired by OCT has been described as an example, but it is acquired by a fundus imaging device (for example, a fundus camera, a scanning laser ophthalmoscope (SLO)) that captures a frontal image of the fundus of the eye to be inspected. The above embodiment can also be applied to the measurement of the fundus blood vessels included in the fundus anterior image. In this case, the frontal image of the fundus may be at least one of frontal image data (for example, a color fundus image) due to reflected light from the eye to be inspected and frontal image data due to fluorescence from the eye to be inspected. Moreover, the analysis which combined these with the OCT motion contrast data may be performed.
なお、血管領域と非血管領域との判別処理を自動的に行う場合、CPU71は、MCデータ402の輝度値から二値化処理(例えば、判別分析法)を適用することによって、血管・非血管領域を定めてもよい。また、血管解析領域が複数のセクションに分割されている場合、各セクションに対応する領域単位で閾値が設定されてもよいし、血管解析領域全体で閾値が設定されてもよい。
When automatically discriminating between the blood vessel region and the non-blood vessel region, the
<血管情報のMCデータへの展開>
CPU71は、MCデータに含まれる血管領域に関する血管情報を取得してもよい。さらに、CPU71は、取得された血管情報を、MCデータに含まれる血管領域に対して付与してもよい。この場合、血管領域に含まれる少なくとも一つの血管に関して血管情報が取得されればよく、MCデータに含まれる一本の血管に関して血管情報が取得されて血管情報が付与されてもよいし、MCデータに含まれる複数の血管に関して血管情報がそれぞれ取得され、血管情報がそれぞれ付与されてもよい。また、血管情報は、血管毎の血管情報を含んでもよく、各血管の位置情報と血管情報がセットで取得されてもよい。
<Development of blood vessel information into MC data>
The
血管情報に関し、例えば、CPU71は、MCデータに含まれる血管領域に関する動静脈情報を、血管情報として取得してもよい。さらに、CPU71は、MCデータに含まれる血管領域に対して動静脈情報を付与してもよい(例えば、図15参照)。つまり、血管情報は、血管の機能に関する情報であってもよい。
Regarding the blood vessel information, for example, the
また、例えば、CPU71は、MCデータに含まれる血管領域に関する出血情報を、血管情報として取得してもよい。さらに、CPU71は、MCデータに含まれる血管領域に対して出血情報を付与してもよい。
Further, for example, the
血管情報を得る場合、CPU71は、MCデータとは異なるデータから血管情報を取得してもよい。これによって、例えば、MCデータのみでは検出が難しい血管情報がMCデータに付与され、検者による血管評価がより良好に行われる。異なるデータの場合、MCデータの少なくとも一部に関して、取得領域が共通するデータであってもよい。また、異なるデータにおいて、血管情報に関する分布データであってもよく、MCデータに対してレジストレーションされてもよい。
When obtaining the blood vessel information, the
例えば、CPU71は、血管情報を、OCTによって取得されたOCTデータ又はドップラーOCTデータから取得してもよい。OCTデータ又はドップラーOCTデータは、MCデータを取得するOCTデバイスによって取得されたデータであってもよいし、MCデータを取得するOCTデバイスとは異なるOCTデバイスによって取得されたデータであってもよい。CPU71は、MCデータ自体から血管情報を取得してもよく、例えば、MCデータを取得するOCTデバイスとして、例えば、ドップラ―OCTが利用あれてもよい。
For example, the
また、CPU71は、OCTとは異なるモダリティ(撮影部)によって撮影された画像データから取得してもよい。異なるモダリティとしては、血管情報を取得可能であればよく、例えば、眼底カメラ、SLO、LSFG(レーザスペックルフローグラフィー)であってもよい。
Further, the
血管情報としては、動静脈情報、出血情報に限定されず、血流速度情報、層位置情報、色情報、偏光特性情報、走行方向情報、硬さ情報、血管の内壁と外壁の比率情報等が取得されてもよい。つまり、血管情報としては、例えば、MCデータに含まれる血管領域の特性に関する情報であってもよい。血流速度情報は、例えば、ドップラーOCTによって取得されてもよい。層位置情報は、例えば、OCTデータ又はMCデータによって取得されてもよい。色情報は、例えば、眼底カメラ又は分光OCTによって取得されてもよい。偏光特性情報は、例えば、PS−OCTによって取得されてもよい。 Blood vessel information is not limited to arteriovenous information and bleeding information, but includes blood flow velocity information, layer position information, color information, polarization characteristic information, traveling direction information, hardness information, ratio information of inner and outer walls of blood vessels, and the like. May be obtained. That is, the blood vessel information may be, for example, information on the characteristics of the blood vessel region included in the MC data. Blood flow velocity information may be acquired, for example, by Doppler OCT. The layer position information may be acquired by, for example, OCT data or MC data. Color information may be acquired, for example, by a fundus camera or spectroscopic OCT. Polarization characteristic information may be acquired by, for example, PS-OCT.
MCデータを出力する際、例えば、CPU71は、取得された血管情報に基づいてMCデータに対して画像処理を施し、血管情報を含むMCデータを表示部75に表示してもよい。なお、表示部75への表示に限定されず、血管情報を含むMCデータが印刷されてもよいし、外部サーバーに出力されてもよい。なお、MCデータは、例えば、正面MCデータであってもよいし、3次元MCデータであってもよいし、2次元MCデータであってもよい。この場合、MCデータに対して予め付与された血管情報に基づいて、血管情報を含むMCデータを表示部75に表示してもよい。また、取得された血管情報に関する表示を、MCデータに付与してもよい。
When outputting the MC data, for example, the
MCデータを解析して血管領域に関する計測結果を取得する際、例えば、CPU71は、取得された血管情報を用いて、血管領域に関する計測結果を取得してもよい。この場合、CPU71は、計測結果を2次元的又は3次元的に求めてもよい。計測結果は、例えば、解析マップとして表示されてもよいし、解析チャートとして表示されてもよい。
When analyzing the MC data and acquiring the measurement result regarding the blood vessel region, for example, the
CPU71は、MCに対して予め付与された血管情報を用いて計測結果を取得してもよい。血管領域に関する計測結果を予め取得した後、取得された計測結果に血管情報を付与してもよい。
The
血管情報として動静脈情報が取得された場合、CPU71は、動静脈情報を用いて、動脈領域に関する計測結果及び静脈に関する計測結果の少なくともいずれかを取得してもよい。例えば、血管情報として出血情報が取得された場合、CPU71は、出血情報を用いて、出血した血管領域に関する計測結果を取得してもよい。つまり、CPU71は、各血管の動静脈情報を利用して、動脈・静脈別に計測処理を行ってもよい。
When the arteriovenous information is acquired as the blood vessel information, the
なお、MCデータに含まれる血管領域に関する血管情報は、記憶部74にMCデータと共に記憶されてもよい。この場合、例えば、MCデータでの各血管における位置情報と、血管情報とが対応付けて記憶されてもよい。この場合、のちの解析・計測処理、表示処理の少なくともいずれかにおいて、MCデータに含まれる少なくとも一つの血管の血管情報が参照できれば、具体的手法は限定されない。
The blood vessel information regarding the blood vessel region included in the MC data may be stored in the
血管情報の付与としては、例えば、各血管の位置情報を含む血管情報が、MCデータにレジストレーションされることによって、MCデータの各血管と血管情報とが対応付けされてもよい。また、MCデータにおける各血管と血管情報との対応関係を示すテーブルが設定されてもよい。また、各血管のMCデータに対して血管情報が付与され、CPU71が、各血管のMCデータに対応する血管情報を参照してもよい。
As for the addition of blood vessel information, for example, each blood vessel in the MC data and the blood vessel information may be associated with each other by registering the blood vessel information including the position information of each blood vessel in the MC data. In addition, a table showing the correspondence between each blood vessel and blood vessel information in the MC data may be set. Further, blood vessel information may be added to the MC data of each blood vessel, and the
<動静脈情報の取得、付与>
以下に、動静脈情報の取得、付与を行う場合の一例を示す。例えば、CPU71は、動静脈情報として、MCデータに含まれる少なくとも一つの血管が動脈であるか静脈であるかを判別するための判別情報を取得してもよい。動静脈情報としては、各血管について動脈か静脈か否かが特定された動静脈情報であってもよい。なお、動静脈情報としては、動脈・静脈のいずれかに関する情報であればよく、例えば、動脈のみの情報であってもよいし、静脈のみの情報であってもよい。動静脈情報は、動脈及び静脈の少なくともいずれかに関する血管分布情報であってもよい。
<Acquisition and grant of arteriovenous information>
The following is an example of acquisition and addition of arteriovenous information. For example, the
例えば、CPU71は、動静脈情報に基づいてMCデータに対して画像処理を施し、動静脈情報が反映されたMCデータを表示部75に表示するようにしてもよい。この場合、CPU71は、MCデータにおける各血管領域を、動脈・静脈か否かに応じて異なる色(例えば、動脈が赤、静脈が青)にて表示してもよい。この場合、白黒表現にて画像化されたMCデータの血管領域に対して色が重畳されてもよいし、MCデータ自体を着色処理してもよい。また、例えば、CPU71は、動静脈情報を利用して、動脈のみ又は静脈のみが画像化されたMCデータを表示してもよい。この場合、CPU71は、動静脈情報を利用して、動脈領域と静脈領域の一方を抽出することによって、動脈領域と静脈領域の一方を画像化してもよい。また、CPU71は、動脈領域に関するMCデータと、静脈領域に関するMCデータとを切換表示又は並列表示してもよい。この場合、動脈と静脈とが異なる色で表示されてもよい。また、特定の血管が指定されたときに動静脈情報が表示されてもよい。
For example, the
上記のようにすれば、MCデータに含まれる血管が動脈であるか静脈であるかが特定されることで、被検眼の血管の状態を、機能面を含めて評価できるようになり、臨床的に有用であると考える。 By doing the above, by identifying whether the blood vessels included in the MC data are arteries or veins, it becomes possible to evaluate the state of the blood vessels of the eye to be inspected, including the functional aspect, and clinically. I think it is useful for.
また、MCデータに動静脈情報が付与されることで、これを反映したMCデータの表示、計測等が可能となる。例えば、CPU71は、MCデータを解析して血管領域に関する計測結果を取得する際、動静脈情報を用いて、動脈領域に関する計測結果及び静脈に関する計測結果の少なくともいずれかを取得するようにしてもよい。計測結果としては、動脈又は静脈に関して、例えば、血管密度、血管面積、血管の総量、血管の蛇行度、毛細血管の規則性、血管径の少なくともいずれかが算出されてもよい。
Further, by adding arteriovenous information to the MC data, it is possible to display and measure the MC data reflecting the information. For example, when the
CPU71は、MCデータの動脈領域に関する計測結果及び静脈に関する計測結果を統合した統合計測結果を取得してもよい。例えば、CPU71は、動脈領域に関する計測結果と静脈に関する計測結果の比率又は差分を取得してもよい。より詳細には、CPU71は、動脈領域での血管径と静脈領域での血管径の比である動静脈比(A/V比)を求めても良い。
The
CPU71は、動脈領域に関する計測結果及び静脈に関する計測結果の少なくともいずれかに関して、計測結果を2次元的又は3次元的に求めるようにしてもよい。さらに、CPU71は、得られた計測結果を血管解析マップとして表示部75に表示してもよい。また、CPU71は、動脈領域に関する血管解析マップ、静脈領域に関する血管解析マップとを切換表示又は並列表示してもよい。もちろん、血管解析マップに限定されず、得られた計測結果は、血管解析チャートとして表示されてもよい。
The
なお、CPU71は、MCデータに含まれる血管領域の一部又は全体に動静脈情報を付与してもよく、さらに、少なくとも一つの血管の一部に動静脈情報を付与してもよいし、少なくとも一つの血管全体に動静脈情報を付与してもよい。もちろん、複数の血管領域に対してそれぞれ動静脈情報を付与してもよい。さらに、CPU71は、各血管領域を血管径に関して分類し、一部の血管径に関して動静脈情報を付与してもよい。例えば、毛細血管領域、大血管領域のいずれかに動静脈情報を付与してもよい。
The
動静脈の判別方法は、OCTを用いて動静脈を判別する方法、パルスオキシメーターの原理を応用して動静脈を判別する方法、もしくは、眼底カラー画像、SLO画像の色情報から動脈静脈を判別する方法などが考えられる。以下、具体例を示す。 The arteriovenous discrimination method is a method of discriminating the arteriovenous using OCT, a method of discriminating the arteriovenous by applying the principle of the pulse oximeter, or a method of discriminating the arterial vein from the color information of the fundus color image and the SLO image. There are ways to do this. A specific example will be shown below.
<OCTデータに基づく動静脈判別>
動静脈情報を取得する場合、例えば、CPU71は、OCTによって取得された眼底のOCTデータ又はドップラOCTデータに基づいて、動静脈情報を取得してもよい。OCTデータとしては、例えば、 MCデータと共通する領域に関して取得されたOCTデータ(例えば、二次元OCTデータ)であってもよく、MCデータの基礎となったOCTデータであってもよい。この場合、OCTデータは、眼底の反射率データであるという点でMCデータと区別される。OCTデータは、例えば、眼底の形態情報を含む断層画像データであってもよい。
<Arteriovenous discrimination based on OCT data>
When acquiring the arteriovenous information, for example, the
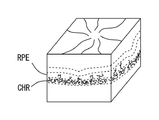
OCTデータから動静脈情報を取得する場合、例えば、OCTデータの輝度値に基づいて、被検眼の血管が動脈か静脈かを判別してもよい。より詳細には、図16に示すように、OCTデータにおいて動脈は明るく、静脈は動脈よりも暗く表示される。 When the arteriovenous information is acquired from the OCT data, for example, it may be determined whether the blood vessel of the eye to be inspected is an artery or a vein based on the brightness value of the OCT data. More specifically, as shown in FIG. 16, in the OCT data, the arteries appear bright and the veins appear darker than the arteries.
OCTデータにおける血管領域を検出する際、例えば、各Aスキャンデータに関してRPEよりもNFL側の領域における輝度値を求め、輝度値が相対的に低い領域を血管領域候補として設定してもよい。CPU71は、血管候補領域のうち、走査方向に関して所定幅以上の領域を血管領域として検出してもよい。なお、OCTデータにおいて血管領域を検出する場合、CPU71は、MCデータに含まれる血管情報を利用して、OCTデータにおける血管領域を検出してもよい。この場合、OCTデータとして、MCデータの基礎となるOCTデータを用いる場合、データ間のレジストレーションが容易であり、血管領域を容易に特定できる。
When detecting the blood vessel region in the OCT data, for example, the brightness value in the region on the NFL side of the RPE may be obtained for each A scan data, and the region having a relatively low brightness value may be set as the blood vessel region candidate. The
次に、CPU71は、OCTデータ上での血管領域の輝度値に基づいて動脈と静脈を判別してもよい。例えば、CPU71は、図17に示すような眼底の領域TSNITの各領域で血管領域の輝度平均を用いて動脈・静脈の判定を行ってもよい。CPU71は、TSNITの各領域で、血管領域のILMからIPL/INLまでの輝度平均を計算し、判別分析法によりクラス間分散が最大となる閾値を決定してもよい。CPU71は、この閾値よりも高輝度な血管を動脈、低輝度な血管を静脈としてもよい。
Next, the
なお、OCTデータでの動脈と静脈の判別手法としては、これに限定されず、動脈と静脈との間での血管壁の輝度の違いを利用してもよい。また、動脈と静脈との間での血管下側のRPEの輝度の違いを利用してもよい。つまり、OCTデータ上で画像化された動脈と静脈との間での違い(例えば、輝度、形状)を利用して、動脈と静脈を判別する手法であれば、特に限定されない。つまり、本発明者らは、OCTデータ上に含まれる血管において動脈と静脈との間で描画状態が異なることを利用した判別手法を見出した。 The method for discriminating between an artery and a vein using OCT data is not limited to this, and the difference in the brightness of the blood vessel wall between the artery and the vein may be used. Further, the difference in the brightness of the RPE under the blood vessel between the artery and the vein may be utilized. That is, the method is not particularly limited as long as it is a method for discriminating between an artery and a vein by utilizing the difference (for example, brightness, shape) between the artery and the vein imaged on the OCT data. That is, the present inventors have found a discrimination method utilizing the fact that the drawing state differs between the artery and the vein in the blood vessel included in the OCT data.
上記のようにしてOCTデータに基づく動静脈情報が取得されると、CPU71は、OCTデータと共通の領域に関するMCデータにおいて対応する血管領域に動静脈情報を付与してもよい。なお、3次元MCデータの場合、CPU71は3次元OCTデータを形成する各二次元OCTデータに基づいて動静脈情報を取得し、取得された動静脈情報を3次元MCデータの各二次元MCデータの対応する血管に付与してもよい。もちろん、CPU71は、次元OCTデータにおける動脈又は静脈に関する3次元分布情報を取得しておき、取得された3次元分布情報による動静脈情報を、3次元MCデータの血管領域に付与してもよい。この場合、CPU71は、正面OCTデータを用いて動静脈情報を取得し、取得された動静脈情報を、正面OCTデータの血管領域に付与してもよい。
When the arteriovenous information based on the OCT data is acquired as described above, the
なお、上記説明においては、OCTデータに基づいて動静脈情報を取得したが、これに限定されず、ドップラーOCTデータにおける位相変化量の正負を用いて動静脈情報を取得してもよい。例えば、CPU71は、位相変化量に基づいて血流の進行方向を求めてもよく、血流の進行方向に基づいて動静脈情報を取得してもよい。この場合、例えば、血流の進行方向を辿って行き着く先が乳頭であれば静脈とし、逆であれば動脈として判別してもよい。
In the above description, the arteriovenous information is acquired based on the OCT data, but the present invention is not limited to this, and the arteriovenous information may be acquired using the positive or negative of the phase change amount in the Doppler OCT data. For example, the
<パルスオキシメーターの原理を応用>
パルスオキシメーターは、酸素と結合したヘモグロビンと結合していないヘモグロビンで、赤色光と赤外光の吸収度が変化する性質を利用して血中の酸素飽和度を計測する。これを応用し、OCT光源でパルスオキシメーターと同様な計測を行う。酸素飽和度が高いほうを動脈、低いほうを静脈と判定する。
<Applying the principle of pulse oximeter>
A pulse oximeter is a hemoglobin that is not bound to hemoglobin that is bound to oxygen, and measures the oxygen saturation in blood by utilizing the property that the absorption of red light and infrared light changes. Applying this, the OCT light source performs the same measurement as the pulse oximeter. The one with high oxygen saturation is judged as an artery, and the one with low oxygen saturation is judged as a vein.
つまり、CPU71は、被検眼の酸素飽和度データに基づいて、動静脈情報を取得してもよい。この場合、得られた各血管の動静脈情報と、MCデータとがレジストレーションされることで、動静脈情報が付与されてもよい。
That is, the
<他の装置からの動静脈情報の取得>
CPU71は、OCTとは異なる撮影手段(モダリティ)によって取得された画像データに基づいて、動静脈情報を取得してもよい。他のモダリティとしては、例えば、眼底カメラ、SLO、LSFG(レーザスペックルフローグラフィー)によって取得される画像データが用いられても良い。例えば、眼底カメラ、SLOによって取得された眼底画像における動脈と静脈との間の色調の違いに基づいて、動静脈情報を取得してもよい。また、動脈のほうが静脈より血管の色が明るい性質を利用して、動静脈を判定してもよい。
<Acquisition of arteriovenous information from other devices>
The
また、SLO又は眼底カメラによって取得される蛍光造影画像の時系列変化による血流方向の違いに基づいて、動静脈情報を取得してもよい。さらに、LSFGによって取得される相対的な血流速度・血流方向の違いに基づいて、動静脈情報を取得してもよい。 Further, the arteriovenous information may be acquired based on the difference in the blood flow direction due to the time-series change of the fluorescence contrast image acquired by the SLO or the fundus camera. Further, arteriovenous information may be acquired based on the relative difference in blood flow velocity and blood flow direction acquired by LSFG.
なお、上記のように動静脈情報を取得する場合、OCT光学系とともに動静脈情報の元となる画像を得るモダリティーが配置され、モーションコントラストデータの取得と同時に、これらの画像が取得されてもよい。また、これに限定されず、OCT装置とは別に、当該モダリティーが配置されてよい。また、上記のようにCPU71が判別処理を実行する必要は必ずしもなく、CPU71は、予め取得された動静脈情報を、外部又は記憶部74から取得してもよい。
When acquiring arteriovenous information as described above, a modality for obtaining images that are the source of the arteriovenous information is arranged together with the OCT optical system, and these images may be acquired at the same time as the motion contrast data is acquired. .. Further, the modality is not limited to this, and the modality may be arranged separately from the OCT device. Further, it is not always necessary for the
<血管方向の計測>
CPU71は、3次元MCデータに関して、3次元方向の各方向に関してエッジ強度を算出し、各方向でのエッジ強度に基づいて、血管領域に関する走行方向情報を取得してもよい。さらに、CPU71は、取得された走行方向情報を、3次元MCデータに含まれる血管領域に対して付与してもよい。これによって、MCデータに含まれる各血管の方向を検出できるので、蛇行度等の計測を容易に行うことができる。
<Measurement of blood vessel direction>
The
より詳細には、図18に示すように、CPU71は、3次元MCデータのボリュームデータをXYZ方向に関してエッジ検出をそれぞれ行い、XYZ方向に関するエッジ検出結果をボリュームデータとしてそれぞれ取得してもよい。この場合、各方向に関するエッジ検出結果のボリュームデータがそれぞれ取得される。ここで、3次元MCデータの各点に対応する各ボリュームデータでのエッジ検出結果に基づいて、各血管の走行方向を容易に検出できる。例えば、X方向にストレートに伸びる血管のみが3次元MCデータに存在する場合、YZ方向に関してエッジが検出され、X方向に関してエッジが検出されないので、これに基づいて走行方向が検出される。このような関係を利用して、各血管の走行方向を検出することが可能である。なお、説明の便宜上、簡易的な例を示したが、もちろん、複数の血管が異なる方向に走行する場合であっても、上記手法の適用は可能である。
More specifically, as shown in FIG. 18, the
CPU71は、取得された走行方向情報に基づいて3次元モーションコントラストデータに対して画像処理を施し、走行方向情報が反映された3次元モーションコントラストデータを表示部に表示してもよい(例えば、図19参照)。この場合、各血管に矢印が表示されてもよいし、走行方向に応じた色が付与されてもよい。
The
CPU71は、3次元モーションコントラストデータを解析して血管領域に関する計測結果を取得する際、走行方向情報を用いて、血管の蛇行度を取得してもよい。
When the
なお、上記走行方向の検出は、3次元的な方向の検出に限定されず、2次元的な方向の検出に適用されてもよい。例えば、正面MCデータにおいて、XY方向にそれぞれエッジ検出が行われ、エッジ検出結果に基づいて二次元的な走行方向が検出されてもよい。 The detection of the traveling direction is not limited to the detection of the three-dimensional direction, and may be applied to the detection of the two-dimensional direction. For example, in the front MC data, edge detection may be performed in each of the XY directions, and a two-dimensional traveling direction may be detected based on the edge detection result.
なお、上記手法に限定されず、MCデータの各血管に対して細線化処理を施すと共に、細線化処理で生成されたスケルトンの各ピクセルの連結性を求めることによって、走行方向を検出してもよい。例えば、2次元であれば、周辺8pixelとの連結性を求めることで、2次元的な走行方向を検出してもよい。同様に、3次元の場合、周辺の画素の連結性を3次元的に求めることで3次元的な走行方向を検出してもよい。 Not limited to the above method, even if the traveling direction is detected by performing the thinning process on each blood vessel of the MC data and obtaining the connectivity of each pixel of the skeleton generated by the thinning process. good. For example, in the case of two dimensions, the two-dimensional traveling direction may be detected by obtaining the connectivity with the peripheral 8 pixels. Similarly, in the case of three dimensions, the three-dimensional traveling direction may be detected by determining the connectivity of the peripheral pixels in three dimensions.
<眼底層に対する血管の走行状態>
CPU71は、被検眼に形成された層領域に対する、MCデータに含まれる血管領域の走行状態を示す層走行情報を取得してもよい(例えば、図20参照)。さらに、CPU71は、MCデータに含まれる血管領域に対して層走行情報を付与してもよい。これにより、例えば、層領域に対する血管の走行状態を取得でき、被検眼の正常異常判定を行うことができる。
<Running state of blood vessels with respect to the fundus layer>
The
層走行情報としては、例えば、MCデータに含まれる少なくとも一つの血管が走行している層領域に関して判別可能な情報であってもよい。層走行情報としては、例えば、MCデータに含まれる少なくとも一つの血管が、特定の層領域を走行しているか否かに関する情報であってもよい。また、MCデータに含まれる少なくとも一つの血管が、どの層領域からどの層領域までを走行しているか否かに関する情報であってもよい。 The layer traveling information may be, for example, information that can be discriminated with respect to the layer region in which at least one blood vessel included in the MC data is traveling. The layer traveling information may be, for example, information on whether or not at least one blood vessel included in the MC data travels in a specific layer region. Further, it may be information on whether or not at least one blood vessel included in the MC data travels from which layer region to which layer region.
MCデータは、被検眼眼底に形成された複数の層に関するMCデータであってもよく、CPU71は、複数の層の中で、少なくとも一つの血管が走行する層を特定する処理を行うことによって、層走行情報を取得してもよい。
The MC data may be MC data relating to a plurality of layers formed on the fundus of the eye to be inspected, and the
より詳細には、CPU71は、MCデータにおける血管の走行位置と、MCデータ又はOCTデータに対するセグメンテーション処理によって取得される層位置とに基づいて層方向情報を取得してもよい。
More specifically, the
例えば、CPU71は、MCデータに含まれる特定の血管の3次元的な位置情報と、眼底各層の3次元的な位置情報とを比較し、血管Kが走行する眼底層を特定してもよい。この場合、CPU71は、特定の層において血管Kが存在するかどうかを判別していくことによって、血管Kが走行する層領域を特定してもよい。例えば、脈絡膜層の存在する血管Kが、RPE層に到達していることが検出される。
For example, the
この場合、CPU71は、第1の層(例えば、脈絡膜層)に分布する血管に関して、第1の層とは異なる第2の層(例えば、RPE層)まで到達しているか(伸びているか)否かを判別してもよい。また、CPU71は、MCデータにおいて、血管領域が、第1の層からどの層まで到達しているかどうかを求めてもよい。上記手法によれば、脈絡膜層に存在する血管が、RPE層に達しているか否かを容易に判別できるので、糖尿病性網膜症等に関する評価を容易に行うことができる。
In this case, whether or not the
上記のようにして、各血管に関する層領域情報を取得することによって、MCデータに含まれる各血管に対して層領域情報を付与できる。CPU71は、付与された層領域情報に基づいて3次元モーションコントラストデータに対して画像処理を施し、層領域情報が反映された3次元モーションコントラストデータを表示部に表示してもよい。この場合、層領域情報に応じた色が付与されてもよい。
By acquiring the layer region information regarding each blood vessel as described above, the layer region information can be given to each blood vessel included in the MC data. The
CPU71は、付与された層領域情報に基づいて、血管に関する計測結果を取得してもよい。例えば、CPU71は、第1の層に存在する血管に関して、第2の層まで到達した血管の二次元分布を、計測結果として取得しても良く、例えば、当該血管に特定した密度分布などを取得してもよい。また、CPU71は、MCデータにおける複数の層を横断した血管に関する計測結果を取得してもよい。
The
CPU71は、層領域情報に基づく血管計測結果を2次元的又は3次元的に求めるようにしてもよい。さらに、CPU71は、得られた計測結果を血管解析マップとして表示部75に表示してもよい。もちろん、血管解析マップに限定されず、得られた計測結果は、血管解析チャートとして表示されてもよい。
The
<モーションコントラストデータを用いた血管層の分離>
CPU71は、3次元MCデータの各深さ領域における血管の二次元的な存在量に関する血管分布情報を取得してもよい。さらに、CPU71は、取得された血管分布情報に基づいて、3次元MCデータに含まれる血管を層毎に分離するようにしてもよい。つまり、MCデータを用いて血管層を分離してもよい。
<Separation of blood vessel layers using motion contrast data>
The
これによって、血管層を確実に分離することができる。なお、従来の技術では、MCデータの血管層の分離は、OCTデータの層境界検出結果を用いて行っている。例えばNFLの血管層は、NFL/GCLの層境界の所定範囲というように固定値で決められている。そのため、患者によってはうまく血管層を分離できない。また、OCTの層境界検出が失敗した場合、血管層の分離も失敗する可能性がある。網膜の血管は特定の領域に固まって存在する。そこで、OCT Angiographyの結果から、血管のまとまりごとに分離することで、正確に血管層を分離できると考えられる。 This allows the vascular layer to be reliably separated. In the conventional technique, the blood vessel layer of MC data is separated by using the layer boundary detection result of OCT data. For example, the NFL vascular layer is defined by a fixed value, such as a predetermined range of NFL / GCL layer boundaries. Therefore, some patients cannot separate the vascular layer well. Also, if OCT layer boundary detection fails, vascular layer separation may also fail. Blood vessels in the retina are clustered in specific areas. Therefore, from the results of OCT Angiography, it is considered that the blood vessel layer can be accurately separated by separating each group of blood vessels.
より詳細には、例えば、血管の二次元的な存在量として、各深さ領域の正面MCデータにおいて血管が検出された画素数をそれぞれ計測してもよく、各深さ領域での血管画素数の分布を示すヒストグラムを取得してもよい(図21参照)。また、CPU71は、血管の二次元的な存在量として、各深さ領域の正面MCデータにおいてそれぞれ血管の密度分布又は血管面積を求めるようにしてもよい。つまり、血管分布情報としては、例えば、深さ方向に関して、3次元MCデータの各深さ領域における血管の二次元的な存在量の分布を示す情報であってもよい。
More specifically, for example, as the two-dimensional abundance of blood vessels, the number of pixels in which blood vessels are detected in the front MC data of each depth region may be measured, and the number of blood vessel pixels in each depth region may be measured. You may obtain a histogram showing the distribution of (see FIG. 21). Further, the
なお、CPU71は、血管の二次元的な存在量として、血管が検出された画素数を計測してもよく、各深さ領域での血管画素数の分布を示すヒストグラムを取得してもよい。なお、3次元MCデータを深さ方向に関して分割する場合、一画素単位で分割してもよいし、2画素以上の単位で分割してもよい。
The
眼底の血管は、一般的には、眼底の各層に分かれて血管層を形成している。よって、取得された血管分布情報は、各血管層に応じた山を含んでいる。そこで、CPU71は、血管分布情報における山毎に分離することで、血管を層毎に分離するようにしてもよい。なお、血管分布に含まれる山毎に分離する場合、例えば、CPU71は、一定の存在量を超える領域が、深さ方向に所定の幅を持っているかによって山を検出するようにしてもよい。
The blood vessels of the fundus are generally divided into each layer of the fundus to form a blood vessel layer. Therefore, the acquired blood vessel distribution information includes mountains corresponding to each blood vessel layer. Therefore, the
なお、3次元MCデータを正面方向(深さ方向に直交する方向)に関して複数に分割し、分割された各領域において血管分布情報を取得してもよい。この場合、分割された各領域において血管を層毎に分離するようにしてもよい。例えば、図21におけるブロックB1、B2、B3単位でそれぞれ血管層が分離されてもよい。 The three-dimensional MC data may be divided into a plurality of parts in the front direction (direction orthogonal to the depth direction), and blood vessel distribution information may be acquired in each of the divided regions. In this case, the blood vessels may be separated into layers in each of the divided regions. For example, the blood vessel layer may be separated in units of blocks B1, B2, and B3 in FIG. 21.
なお、CPU71は、層毎に分離された各血管に対し、他の層に存在する血管に対して判別可能な層情報を付与してもよい。
The
<出血情報の取得、付与>
CPU71は、MCデータに含まれる血管領域に関する出血情報を取得してもよい。さらに、CPU71は、取得された出血情報を、MCデータに含まれる血管領域に対して付与してもよい。
<Acquisition and grant of bleeding information>
The
出血情報としては、血管領域における出血領域の位置情報であってもおい。また、出血情報としては、少なくとも一つの血管に関する出血の有無を判別するための出血情報であってもよい。また、出血情報としては、各血管について出血の有無が特定された出血情報であってもよい。また、出血情報は、出血領域の分布を示す情報であってもよい。 The bleeding information may be the position information of the bleeding area in the blood vessel area. Further, the bleeding information may be bleeding information for determining the presence or absence of bleeding related to at least one blood vessel. Further, the bleeding information may be bleeding information in which the presence or absence of bleeding is specified for each blood vessel. Further, the bleeding information may be information indicating the distribution of the bleeding region.
出血情報は、例えば、正面OCTデータに基づいて取得されてもよい。正面OCTデータは、3次元OCTデータでの深さ方向の一部に関する正面OCTデータであってもよいし、3次元OCTデータでの深さ方向全体に関する正面OCTデータであってもよい。もちろん、二次元OCTデータに基づいて出血情報が取得されてもよい。この場合、出血情報の位置情報が取得されてもよい。 Bleeding information may be acquired, for example, based on frontal OCT data. The front OCT data may be front OCT data relating to a part of the depth direction in the three-dimensional OCT data, or may be front OCT data relating to the entire depth direction in the three-dimensional OCT data. Of course, bleeding information may be acquired based on the two-dimensional OCT data. In this case, the position information of the bleeding information may be acquired.
OCTデータにおいて血管から出血があった出血領域に関して、出血領域から奥側は、輝度値が減衰し、層構造が描画されない。なお、図22の例では、画像の左側領域にて出血が生じている。そこで、これらの特性を利用して、出血領域を検出することによって、出血領域の位置情報を判別できる。 Regarding the bleeding area where there was bleeding from the blood vessel in the OCT data, the brightness value is attenuated from the bleeding area to the back side, and the layer structure is not drawn. In the example of FIG. 22, bleeding occurs in the left region of the image. Therefore, the position information of the bleeding region can be determined by detecting the bleeding region by utilizing these characteristics.
ここで、OCTデータによって取得された出血領域に関する情報を、MCデータに付与してもよい。この場合、CPU71は、MCデータに付与された出血領域情報に基づいて、出血領域が付与されたMCデータを表示するようにしてもよい(例えば、図23参照)。これによって、MCデータにおいて出血が生じた血管領域を確認できる。この場合、出血領域の位置情報とMCデータの位置情報を対応づけることによって、MCデータ上において出血領域の位置がレジストレーションされる。
Here, information regarding the bleeding region acquired by the OCT data may be added to the MC data. In this case, the
この場合、出血領域が付与されたMCデータとしては、例えば、MCデータ上において出血領域に対応するグラフィックが付与されたMCデータが表示されてもよいし、出血領域に対する血管領域が判別可能に表示されたMCデータが表示されてもよい。なお、出血情報は、眼底カメラ、SLO等の他の撮影手段によって取得された画像から取得されてもよい。 In this case, as the MC data to which the bleeding region is added, for example, the MC data to which the graphic corresponding to the bleeding region is added may be displayed on the MC data, or the blood vessel region with respect to the bleeding region can be discriminated and displayed. The bleeding MC data may be displayed. The bleeding information may be acquired from an image acquired by another imaging means such as a fundus camera or SLO.
<ラベル付与>
CPU71は、3次元データの解析・表示において、3次元データの各ボクセルに、解析結果を示すラベルを付与してもよい。ラベルの種類としては、血管領域、無血管領域、血流、血管壁、血管の方向、血管が存在する層や深さ、血流量、血流の速さ、血流の酸素飽和度、血管の繋がり、正常血管、異常血管、出血等の少なくとも1つであってもよい。
<Labeling>
The
ラベルは、数値で示してもよいし、色、グラフで示してもよい。また、ラベルは、単独で表示されてもよいし、OCTデータ(断層画像)、眼底正面画像、OCTMCデータ(OCT Angiography画像)に重畳して表示されてもよい。または、複数のラベルを組み合わせて表示されてもよい。さらに、CPU71は、前述のように、他の装置、OCTデータ、OCTMCデータから動静脈を判別し、判別結果をラベルとしてボクセルに記録してもよい。
The label may be indicated numerically, or may be indicated by a color or a graph. Further, the label may be displayed alone, or may be displayed superimposed on the OCT data (tomographic image), the fundus anterior image, and the OCTMC data (OCT Angiography image). Alternatively, a plurality of labels may be displayed in combination. Further, as described above, the
さらに、CPU71は、血管の方向を判別し、判別結果をラベルとしてボクセルに記録してもよい。より詳細には、MCデータをXYZ方向でエッジ検出を行い、それぞれの方向のエッジ成分の大きさから血管の向きを検出し、ラベルとして記録してもよい。血管の向きラベルから血管の蛇行度を算出し、この蛇行度もラベルとして記録してもよい。蛇行度の算出方法としては、血管をたどりながら、直前のボクセルと現在のボクセルの血管の向きラベルの差を累積していき蛇行度とする方法が考えられる。
Further, the
さらに、CPU71は、血管の繋がりを見ることで、正常な血管か異常な血管かを判別してもよい。例えば、脈絡膜から出た血管がNFL方向にのびていたら異常と判定する。正常血管と異常血管のラベルを付与することで、どちらかだけを表示したり、色を分けて表示したりすることができる。
Further, the
さらに、CPU71は、血管層の層情報をラベルとしてボクセルに記録してもよい。つまり、MCデータを用いて血管層を分離した結果をラベルとしてボクセルに付与することで、層ごとの血流を表示したり、下記に示す血管の正常異常判定に用いたりすることができる。
Further, the
血管径の計測において、CPU71は、血管領域のラベルが付与された領域を細線化し、細線化された領域を血管のスケルトンのラベルとしてボクセルに記録してもよい(図24参照)。さらに、CPU71は、細線化前後の血管の変化量を血管径として計測し、血管径をラベルとしてボクセルに記録してもよい。
In measuring the blood vessel diameter, the
より詳細には、MCデータで検出した血管領域に対し細線化を行い、細線化した線から元の血管径を計測してもよい。細線化した結果と血管径をラベルとしてボクセルに記録してもよい。細線化のラベルのボクセルだけを表示することで、血管のスケルトンを表示してもよい。また、血管径ラベルを用いることで、血管径によって血管の色を変える、一定の血管径以上もしくは以下の血管だけを表示してもよい。また、血管径の正常眼データベースが構築されてもよい。 More specifically, the blood vessel region detected by the MC data may be thinned, and the original blood vessel diameter may be measured from the thinned line. The result of thinning and the diameter of the blood vessel may be recorded on the voxel as a label. The skeleton of a blood vessel may be displayed by displaying only the voxels labeled as thin lines. Further, by using the blood vessel diameter label, only blood vessels having a certain blood vessel diameter or more or less, which changes the color of the blood vessel depending on the blood vessel diameter, may be displayed. In addition, a normal eye database of blood vessel diameter may be constructed.
さらに、CPU71は、OCTデータとOCTMCデータから出血部を判別し、ラベルとしてボクセルに記録してもよい。OCTデータでは出血部は、比較的高反射となる。また、出血部の下側は信号が減衰する。この情報とOCTMCデータを組み合わせて、血管がある場所で上記のような出血部の特徴を有する箇所を出血部として検出し、ラベルとして記録してもよい。
Further, the
なお、ラベル表示は、経過観察用(フォローアップ用)として時系列に表示されてもよい。また、ラベル表示は、他の装置の検査結果と組み合わせて表示されてもよい。 The label display may be displayed in chronological order for follow-up (follow-up). In addition, the label display may be displayed in combination with the inspection results of other devices.
図25は、表示ラベルとして、OCTラベルが選択された場合の一例であり、3Dマップのようなデータが表示される。ここで、各ボクセルには、種々の解析結果が付与されてもよく、検者が所望する単体または複数のラベルが、3次元データに対して重畳して表示されてもよい。 FIG. 25 is an example when the OCT label is selected as the display label, and data such as a 3D map is displayed. Here, various analysis results may be given to each voxel, and a single label or a plurality of labels desired by the examiner may be superimposed and displayed on the three-dimensional data.
ここで、血管ラベルが選択されると、網膜の血管のみが表示され、血管の構造が簡単に確認される。さらに、血管ラベルと層ラベルを組み合わせて層ごとに色を変えて表示してもよい。 Here, when the blood vessel label is selected, only the blood vessels of the retina are displayed, and the structure of the blood vessels can be easily confirmed. Further, the blood vessel label and the layer label may be combined and displayed in different colors for each layer.
CPU71は、血管ラベルと動静脈ラベルを組み合わせて、動脈と静脈を色分けして表示してもよい。また、動脈・静脈の片方だけ表示してもよい。さらに、血管ラベルと動静脈ラベルと層境界ラベルを組み合わせて、所望の網膜層だけの血管を表示してもよい。
The
このように、複数のラベルを組み合わせることで、さまざまなデータを簡単に確認することができる。また、検者がラベルの組み合わせを自由に設定できる。加えて、他の装置の結果を合わせて表示してもよい。例えば、視野計の結果とOCTAngiography結果を組み合わせて、視野の欠損と血管の欠損の相関を確認できる。 By combining a plurality of labels in this way, various data can be easily confirmed. In addition, the examiner can freely set the combination of labels. In addition, the results of other devices may be displayed together. For example, the correlation between the visual field defect and the blood vessel defect can be confirmed by combining the result of the perimeter and the result of OCT Angiography.
上記のようなラベル表示によれば、OCTデータ、MCデータ等を含む様々なデータを3次元データとして解析し、ユーザーに提示することで、診断を支援することができる。 According to the label display as described above, diagnosis can be supported by analyzing various data including OCT data, MC data, etc. as three-dimensional data and presenting the data to the user.
なお、上記説明においては、被検眼の眼底を例として説明したが、これに限定されず、被検眼の前眼部においても適用可能である。さらに、被検眼に限らず、OCTによって取得された他のモーションコントラストデータ(例えば、眼以外の他の組織におけるモーションコントラストデータ)に対しても適用可能である。 In the above description, the fundus of the eye to be inspected has been described as an example, but the present invention is not limited to this, and the application is also applicable to the anterior segment of the eye to be inspected. Furthermore, it is applicable not only to the eye to be inspected but also to other motion contrast data acquired by OCT (for example, motion contrast data in tissues other than the eye).
1 OCTモーションコントラストデータ解析装置
10 OCTデバイス
70 制御部
75 表示部
1 OCT motion contrast
Claims (4)
前記OCTモーションコントラストデータを解析するための解析処理手段であって、前記OCTモーションコントラストデータに含まれる前記血管領域に関する動静脈情報として、前記OCTモーションコントラストデータに含まれる少なくとも一つの血管が動脈であるか静脈であるかを判別するための判別情報であって、前記OCTモーションコントラストデータとは異なるデータである、光干渉断層計によって取得されたOCTデータ又は光干渉断層計とは異なる撮影手段によって取得された画像データに基づく判別情報を取得し、取得された前記判別情報に基づいて、前記OCTモーションコントラストデータの血管領域に対して動脈であるか静脈であるかを付与する解析処理手段と、
取得された前記判別情報に基づいて前記OCTモーションコントラストデータに対して画像処理を施し、前記血管領域に対して動脈であるか静脈であるかを含む前記OCTモーションコントラストデータを表示部に表示する表示制御手段と、
を備えることを特徴とする眼科解析装置。 An ophthalmic analyzer for analyzing OCT motion contrast data including the blood vessel region of the eye to be inspected.
A analysis means for analyzing the OCT motion contrast data, as arteriovenous information on the blood vessel region included in the OCT motion contrast data, at least one blood vessel included in the OCT motion contrast data is arterial Discrimination information for discriminating whether it is a blood vessel or a blood vessel, which is data different from the OCT motion contrast data, acquired by OCT data acquired by an optical interference tomography or by an imaging means different from the optical interference tomometer. An analysis processing means for acquiring discrimination information based on the obtained image data and assigning whether the blood vessel region of the OCT motion contrast data is an artery or a vein based on the acquired discrimination information.
Based on the acquired discrimination information, the OCT motion contrast data is subjected to image processing, and the OCT motion contrast data including whether it is an artery or a vein with respect to the blood vessel region is displayed on the display unit. Control means and
Ophthalmic analysis apparatus, characterized in that it comprises a.
又は、3次元OCTモーションコントラストデータに対し3次元方向の各方向に関して細線化処理を行い、細線化処理のスケルトンから前記走行方向情報を取得し、
前記血管領域に対して前記走行方向情報を付与することを特徴とする請求項1〜2のいずれかの眼科解析装置。 The analysis processing means calculates the edge strength in each direction of the three-dimensional direction with respect to the three-dimensional OCT motion contrast data, and based on the edge strength in each direction, the blood vessel region included in the three-dimensional OCT motion contrast data. Get the driving direction information about
Alternatively, the three-dimensional OCT motion contrast data is thinned in each direction in the three-dimensional direction, and the traveling direction information is acquired from the skeleton of the thinning process.
The ophthalmic analysis apparatus according to any one of claims 1 and 2 , wherein the traveling direction information is given to the blood vessel region.
Priority Applications (3)
| Application Number | Priority Date | Filing Date | Title |
|---|---|---|---|
| JP2015207571A JP6922151B2 (en) | 2015-10-21 | 2015-10-21 | Ophthalmology analyzer, ophthalmology analysis program |
| US15/297,523 US10492682B2 (en) | 2015-10-21 | 2016-10-19 | Ophthalmic analysis device and ophthalmic analysis program |
| EP16194794.0A EP3158920B1 (en) | 2015-10-21 | 2016-10-20 | Ophthalmic analysis device |
Applications Claiming Priority (1)
| Application Number | Priority Date | Filing Date | Title |
|---|---|---|---|
| JP2015207571A JP6922151B2 (en) | 2015-10-21 | 2015-10-21 | Ophthalmology analyzer, ophthalmology analysis program |
Publications (3)
| Publication Number | Publication Date |
|---|---|
| JP2017077413A JP2017077413A (en) | 2017-04-27 |
| JP2017077413A5 JP2017077413A5 (en) | 2018-11-08 |
| JP6922151B2 true JP6922151B2 (en) | 2021-08-18 |
Family
ID=58664968
Family Applications (1)
| Application Number | Title | Priority Date | Filing Date |
|---|---|---|---|
| JP2015207571A Active JP6922151B2 (en) | 2015-10-21 | 2015-10-21 | Ophthalmology analyzer, ophthalmology analysis program |
Country Status (1)
| Country | Link |
|---|---|
| JP (1) | JP6922151B2 (en) |
Families Citing this family (9)
| Publication number | Priority date | Publication date | Assignee | Title |
|---|---|---|---|---|
| JP7220509B2 (en) * | 2017-09-27 | 2023-02-10 | 株式会社トプコン | OPHTHALMIC DEVICE AND OPHTHALMIC IMAGE PROCESSING METHOD |
| EP3505059A1 (en) | 2017-12-28 | 2019-07-03 | Leica Instruments (Singapore) Pte. Ltd. | Apparatus and method for measuring blood flow direction using a fluorophore |
| JP7005382B2 (en) * | 2018-02-26 | 2022-01-21 | キヤノン株式会社 | Information processing equipment, information processing methods and programs |
| JP7140512B2 (en) * | 2018-03-05 | 2022-09-21 | キヤノン株式会社 | Image processing device, image processing method and program |
| EP3764871A4 (en) * | 2018-03-13 | 2021-12-15 | The UAB Research Foundation | Colocalized detection of retinal perfusion and optic nerve head deformations |
| JP7102208B2 (en) * | 2018-04-25 | 2022-07-19 | キヤノン株式会社 | Image processing device and its control method |
| JP7305401B2 (en) * | 2018-09-06 | 2023-07-10 | キヤノン株式会社 | Image processing device, method of operating image processing device, and program |
| JP7419946B2 (en) * | 2020-04-14 | 2024-01-23 | 株式会社ニコン | Image processing method, image processing device, and image processing program |
| WO2024057942A1 (en) * | 2022-09-16 | 2024-03-21 | 国立大学法人北海道大学 | Ocular fundus image processing device and ocular fundus image processing program |
Family Cites Families (10)
| Publication number | Priority date | Publication date | Assignee | Title |
|---|---|---|---|---|
| JP2008073280A (en) * | 2006-09-22 | 2008-04-03 | Institute Of National Colleges Of Technology Japan | Eye-fundus image processor |
| EP2262410B1 (en) * | 2008-04-08 | 2015-05-27 | National University of Singapore | Retinal image analysis systems and method |
| US8731262B2 (en) * | 2010-06-03 | 2014-05-20 | Siemens Medical Solutions Usa, Inc. | Medical image and vessel characteristic data processing system |
| CA2825169A1 (en) * | 2011-01-20 | 2012-07-26 | University Of Iowa Research Foundation | Automated determination of arteriovenous ratio in images of blood vessels |
| JP5792967B2 (en) * | 2011-02-25 | 2015-10-14 | キヤノン株式会社 | Image processing apparatus and image processing system |
| US20140221827A1 (en) * | 2011-06-07 | 2014-08-07 | California Institute Of Technology | Enhanced optical angiography using intensity contrast and phase contrast imaging methods |
| JP5867720B2 (en) * | 2012-03-29 | 2016-02-24 | 株式会社トプコン | Image display device, image display method, and program |
| EP3127474B1 (en) * | 2012-03-12 | 2021-11-10 | Kabushiki Kaisha Topcon | Image displaying apparatus and image displaying method |
| US9357916B2 (en) * | 2012-05-10 | 2016-06-07 | Carl Zeiss Meditec, Inc. | Analysis and visualization of OCT angiography data |
| JP6507615B2 (en) * | 2013-12-13 | 2019-05-08 | 株式会社ニデック | Optical coherence tomography apparatus and program |
-
2015
- 2015-10-21 JP JP2015207571A patent/JP6922151B2/en active Active
Also Published As
| Publication number | Publication date |
|---|---|
| JP2017077413A (en) | 2017-04-27 |
Similar Documents
| Publication | Publication Date | Title |
|---|---|---|
| JP6922152B2 (en) | Ophthalmology analyzer, ophthalmology analysis program | |
| JP6922151B2 (en) | Ophthalmology analyzer, ophthalmology analysis program | |
| US10660515B2 (en) | Image display method of providing diagnosis information using three-dimensional tomographic data | |
| US10492682B2 (en) | Ophthalmic analysis device and ophthalmic analysis program | |
| JP6627342B2 (en) | OCT motion contrast data analysis device, OCT motion contrast data analysis program. | |
| EP3272276B1 (en) | Image displaying apparatus and image displaying method | |
| US10674909B2 (en) | Ophthalmic analysis apparatus and ophthalmic analysis method | |
| US20160278627A1 (en) | Optical coherence tomography angiography methods | |
| US20170065170A1 (en) | Ophthalmic apparatus | |
| JP5924955B2 (en) | Image processing apparatus, image processing apparatus control method, ophthalmic apparatus, and program | |
| JP6870723B2 (en) | OCT motion contrast data analysis device, OCT motion contrast data analysis program. | |
| JP2019103762A (en) | Oct data analysis device, and oct data analysis program | |
| JP6753052B2 (en) | OCT data processing device and OCT data processing program | |
| JP2018191761A (en) | Information processing device, information processing method, and program | |
| JP6526154B2 (en) | Image processing apparatus, ophthalmologic system, control method of image processing apparatus, and image processing program | |
| JP2018000699A (en) | Image processing device, imaging device, and image processing method | |
| JP2019150554A (en) | Image processing system and method for controlling the same | |
| JP7191166B2 (en) | Ophthalmic photographing device and ophthalmic information processing device | |
| JP7216514B2 (en) | Blood vessel analyzer | |
| JP2019103763A (en) | Oct data analysis device, and oct data analysis program | |
| JP2022127783A (en) | Blood flow analysis apparatus, ophthalmologic apparatus, blood flow analysis method, and program |
Legal Events
| Date | Code | Title | Description |
|---|---|---|---|
| A521 | Written amendment |
Free format text: JAPANESE INTERMEDIATE CODE: A523 Effective date: 20180927 |
|
| A621 | Written request for application examination |
Free format text: JAPANESE INTERMEDIATE CODE: A621 Effective date: 20180927 |
|
| A977 | Report on retrieval |
Free format text: JAPANESE INTERMEDIATE CODE: A971007 Effective date: 20190529 |
|
| A131 | Notification of reasons for refusal |
Free format text: JAPANESE INTERMEDIATE CODE: A131 Effective date: 20190702 |
|
| A601 | Written request for extension of time |
Free format text: JAPANESE INTERMEDIATE CODE: A601 Effective date: 20190902 |
|
| A521 | Written amendment |
Free format text: JAPANESE INTERMEDIATE CODE: A523 Effective date: 20191031 |
|
| A131 | Notification of reasons for refusal |
Free format text: JAPANESE INTERMEDIATE CODE: A131 Effective date: 20200331 |
|
| A601 | Written request for extension of time |
Free format text: JAPANESE INTERMEDIATE CODE: A601 Effective date: 20200601 |
|
| A521 | Written amendment |
Free format text: JAPANESE INTERMEDIATE CODE: A523 Effective date: 20200730 |
|
| A02 | Decision of refusal |
Free format text: JAPANESE INTERMEDIATE CODE: A02 Effective date: 20210106 |
|
| A521 | Written amendment |
Free format text: JAPANESE INTERMEDIATE CODE: A523 Effective date: 20210406 |
|
| C60 | Trial request (containing other claim documents, opposition documents) |
Free format text: JAPANESE INTERMEDIATE CODE: C60 Effective date: 20210406 |
|
| A911 | Transfer to examiner for re-examination before appeal (zenchi) |
Free format text: JAPANESE INTERMEDIATE CODE: A911 Effective date: 20210415 |
|
| C21 | Notice of transfer of a case for reconsideration by examiners before appeal proceedings |
Free format text: JAPANESE INTERMEDIATE CODE: C21 Effective date: 20210420 |
|
| TRDD | Decision of grant or rejection written | ||
| A01 | Written decision to grant a patent or to grant a registration (utility model) |
Free format text: JAPANESE INTERMEDIATE CODE: A01 Effective date: 20210629 |
|
| A61 | First payment of annual fees (during grant procedure) |
Free format text: JAPANESE INTERMEDIATE CODE: A61 Effective date: 20210712 |
|
| R150 | Certificate of patent or registration of utility model |
Ref document number: 6922151 Country of ref document: JP Free format text: JAPANESE INTERMEDIATE CODE: R150 |