JP6893877B2 - Reflection Mode Multispectral Time-Resolved Optical Imaging Methods and Devices for Tissue Classification - Google Patents
Reflection Mode Multispectral Time-Resolved Optical Imaging Methods and Devices for Tissue Classification Download PDFInfo
- Publication number
- JP6893877B2 JP6893877B2 JP2017542793A JP2017542793A JP6893877B2 JP 6893877 B2 JP6893877 B2 JP 6893877B2 JP 2017542793 A JP2017542793 A JP 2017542793A JP 2017542793 A JP2017542793 A JP 2017542793A JP 6893877 B2 JP6893877 B2 JP 6893877B2
- Authority
- JP
- Japan
- Prior art keywords
- tissue
- burn
- burns
- images
- skin
- Prior art date
- Legal status (The legal status is an assumption and is not a legal conclusion. Google has not performed a legal analysis and makes no representation as to the accuracy of the status listed.)
- Active
Links
Images


Classifications
-
- A—HUMAN NECESSITIES
- A61—MEDICAL OR VETERINARY SCIENCE; HYGIENE
- A61B—DIAGNOSIS; SURGERY; IDENTIFICATION
- A61B5/00—Measuring for diagnostic purposes; Identification of persons
- A61B5/0059—Measuring for diagnostic purposes; Identification of persons using light, e.g. diagnosis by transillumination, diascopy, fluorescence
- A61B5/0062—Arrangements for scanning
- A61B5/0064—Body surface scanning
-
- A—HUMAN NECESSITIES
- A61—MEDICAL OR VETERINARY SCIENCE; HYGIENE
- A61B—DIAGNOSIS; SURGERY; IDENTIFICATION
- A61B5/00—Measuring for diagnostic purposes; Identification of persons
- A61B5/0059—Measuring for diagnostic purposes; Identification of persons using light, e.g. diagnosis by transillumination, diascopy, fluorescence
- A61B5/0077—Devices for viewing the surface of the body, e.g. camera, magnifying lens
-
- A—HUMAN NECESSITIES
- A61—MEDICAL OR VETERINARY SCIENCE; HYGIENE
- A61B—DIAGNOSIS; SURGERY; IDENTIFICATION
- A61B5/00—Measuring for diagnostic purposes; Identification of persons
- A61B5/44—Detecting, measuring or recording for evaluating the integumentary system, e.g. skin, hair or nails
- A61B5/441—Skin evaluation, e.g. for skin disorder diagnosis
- A61B5/445—Evaluating skin irritation or skin trauma, e.g. rash, eczema, wound, bed sore
-
- A—HUMAN NECESSITIES
- A61—MEDICAL OR VETERINARY SCIENCE; HYGIENE
- A61B—DIAGNOSIS; SURGERY; IDENTIFICATION
- A61B5/00—Measuring for diagnostic purposes; Identification of persons
- A61B5/72—Signal processing specially adapted for physiological signals or for diagnostic purposes
- A61B5/7271—Specific aspects of physiological measurement analysis
-
- Y—GENERAL TAGGING OF NEW TECHNOLOGICAL DEVELOPMENTS; GENERAL TAGGING OF CROSS-SECTIONAL TECHNOLOGIES SPANNING OVER SEVERAL SECTIONS OF THE IPC; TECHNICAL SUBJECTS COVERED BY FORMER USPC CROSS-REFERENCE ART COLLECTIONS [XRACs] AND DIGESTS
- Y02—TECHNOLOGIES OR APPLICATIONS FOR MITIGATION OR ADAPTATION AGAINST CLIMATE CHANGE
- Y02A—TECHNOLOGIES FOR ADAPTATION TO CLIMATE CHANGE
- Y02A90/00—Technologies having an indirect contribution to adaptation to climate change
- Y02A90/10—Information and communication technologies [ICT] supporting adaptation to climate change, e.g. for weather forecasting or climate simulation
Description
本出願は、米国特許法第119条(e)に基づき、2014年10月29日に出願された「組織を分類するための反射モードマルチスペクトル時間分解型光学イメージングの方法および装置」という名称の米国仮出願62/072,177号と、2015年2月5日に出願された「組織を分類するための反射モードマルチスペクトル時間分解型光学イメージングの方法および装置」という名称の米国仮出願62/112,348号と、2015年2月9日に出願された「組織を分類するための反射モードマルチスペクトル時間分解型光学イメージングの方法および装置」という名称の米国仮出願62/114,027号と、2015年2月12日に出願された「組織を分類するための反射モードマルチスペクトル時間分解型光学イメージングの方法および装置」という名称の米国仮出願62/115,536号と、2015年3月20日に出願された「組織を分類するための反射モードマルチスペクトル時間分解型光学イメージングの方法および装置」という名称の米国仮出願62/136,398号と、2015年9月4日に出願された「組織を分類するための反射モードマルチスペクトル時間分解型光学イメージングの方法および装置」という名称の米国仮出願62/214,885号とについての優先権を主張するものであり、これらの仮出願はそれぞれ、参照によりその内容全体が本明細書に援用される。 This application is based on Article 119 (e) of the US Patent Law and is entitled "Methods and Devices for Reflection Mode Multispectral Time-Resolved Optical Imaging for Classification of Tissues" filed on October 29, 2014. US provisional application 62 / 072,177 and US provisional application 62 / entitled "Methods and Instruments for Reflection Mode Multispectral Time-Resolved Optical Imaging for Classification of Tissues" filed on February 5, 2015. 112,348 and US provisional application 62 / 114,027 entitled "Reflective Mode Multispectral Time-Resolved Optical Imaging Methods and Devices for Classification of Tissues" filed February 9, 2015. , US Provisional Application No. 62 / 115,536, entitled "Methods and Instruments for Reflection Mode Multispectral Time-Resolved Optical Imaging for Tissue Classification," filed February 12, 2015, and March 2015. US provisional application No. 62 / 136,398 entitled "Methods and Instruments for Reflection Mode Multispectral Time-Resolved Optical Imaging for Classification of Tissues" filed on 20th and 4th September 2015. It asserts priority over US provisional applications 62 / 214,885 entitled "Methods and Instruments for Reflection Mode Multispectral Time-Resolved Optical Imaging for Classification of Tissues". Each is incorporated herein by reference in its entirety.
連邦政府の支援による研究開発に関する報告
本開示に記載された研究のいくつかは、米国保健福祉省の事前準備対応次官補局内にある生物医学先端研究開発局の認可の下、米国政府による助成(契約番号HHSO100201300022C)を受けて行われた。米国政府は、本発明について一定の権利を有しうる。Federal-backed R & D Report Some of the research described in this disclosure is funded by the U.S. Government under the approval of the Biomedical Advanced Research and Development Agency within the U.S. Department of Health and Human Services' Assistant Secretary for Preparatory Response. It was carried out in response to the contract number HHSO1002013000022C). The US Government may have certain rights to the invention.
本明細書に開示されたシステムおよび方法は、非侵襲的臨床イメージングに関し、より具体的には、皮下の血流の非侵襲的イメージング、拡散反射分光法、およびコンピュータ利用診断に関する。 The systems and methods disclosed herein relate to non-invasive clinical imaging, and more specifically to non-invasive imaging of subcutaneous blood flow, diffuse reflectance spectroscopy, and computer-aided diagnostics.
以下の参考文献のリストは、本開示の態様を理解する上で有用であると思われる背景技術を含むものである。
1. 米国特許第6,353,753号
2. 米国特許第6,352,517号
3. 米国特許第6,889,075号
4. “Burns: The Neglected but Solvable Health Crisis.” ReSurge International. <http://www.resurge.org/transforming_lives/story_burns.cfm> Accessed Feb 9th, 2015.
5. 2011 National Burn Repository: Report of Data from 2001-2010. American Burn Association 2011.
A. Alian and K. H. Shelley, “Photoplethysmography,” Best Pract. Res. Clin. Anaesthesiol., 28(4), 395-406, (2014).
A. F. H. Goetz, “Multispectral and Hyperspectral imaging technologies in conservation: current research and potential applications,” Stud. Conserv. 7. 3-16
(2006).
A. Reisner, P. A. Shaltis, D. McCombie, and H. H. Asada, “Utility of the photoplethysmogram in circulatory monitoring.,” Anesthesiology, 108, 950-958, (2008).
6. Afromowitz MA, Callis JB, Heimbach DM, et al. “Multispectral imaging of burn wounds: a new clinical instrument for evaluating burn depth”. IEEE transactions on bio-medical engineering. 1988. 35: 842-850.
7. Afromowitz MA, Van Liew GS, Heimback DM. Clinical evaluation of burn injuries using an optical reflectance technique. IEEE Transactions on Biomedical Engineering. 1987;34(2):114-27.
8. Anselmo V J, Zawacki BE. “Multispectral photographic analysis. A new quantitative tool to assist in the early diagnosis of thermal burn depth.” Annals of biomedical engineering. 1977. 5: 179-193.
9. Arsenault KA, Al-Otaibi A, Devereaux DJ, Thorlund K, Tittley JG, Whitlock RP. The use of transcutaneous oximetry to predict healing complications of lower
limb amputations: a systematic review and meta-analysis. Eur J Vasc Endovasc Surg 2012;43:329-36.
10. Bajwa A, Wesolowski R, Patel A, Saha P, Ludwinski F, Smith A, Nagel E, Modarai B. Assessment of tissue perfusion in the lower limb: current methods and techniques under development. Circ Cardiovasc Imaging 2014;7:836-43.
11. Bak Z, Sjoberg F, Eriksson O, et al. “Hemodynamic changes during resuscitation after burns using the Parkland Formula”. Journal of Trauma-Injury Infection & Critical Care 2009. 66(2): 329-336.
12. Benitez E, Sumpio BJ, Chin J, Sumpio BE. Contemporary assessment of foot
perfusion in patients with critical limb ischemia. Semin Vasc Surg 2014;27:3-15.
13. Branski, LK, Mittermayr R, Herndon DN, et al. “A porcine model of full-thickness burn, excision and skin autografting.” Burns. 2008. 34: 1119-1127.
14. Burgess EM, Matsen FA, Wyss CR, Simmons CW. Segmental transcutaneous measurements of PO2 in patients requiring below-the-knee amputation for peripheral vascular insufficiency. J Bone Jt Surg Am 1982;64:378-82.
15. Centers for Disease Control and Prevention. Number (in thousands) of hospital discharges for non-traumatic lower extremity amputation with diabetes as a
listed diagnosis, United States, 1988-2006. Available at: http://www.cdc.gov/diabetes/statistics/lea/fig1.htm
16. Cheong, W.-F, Prahl, S.A, Welch, A.J, “A review of the optical properties of biological tissues”, Quantum Electronics, IEEE Journal of Volume: 26, Issue: 12, 2002.
17. Cortes, C.; Vapnik, V. “Support-vectors networks”. Machine Learning 20, 273-297 (1995).
18. Cover TM, Hart PE, ”Nearest neighbor pattern classification”, IEEE Transactions on information Theory, 13 (1): 21-27 (1967).
19. Denis Coursineau, “Ouliers detection and treatment : A review”, International Journal of Psychological Research, Vol. 3. No. 1 (2010).
20. Desai MH, Herndon DN, Broemeling LD, et al. “Early burn wound excision significantly reduces blood loss.” Ann Surg. 1990. 211(6): 753-762.
21. Dillingham TR, Pezzin LE, Shore AD. Reamputation, mortality, and health care costs among persons with dysvascular lower-limb amputations. Arch Phys Med Rehabil 2005;86:480-6.
22. DM M, Jenkins M, GD W. Outpatient burn management. Nursing Clinics of North America 1997; 32:343.
23. E. Middelkoop, A. J. van den Bogaerdt, E. N. Lamme, M. J. Hoekstra, K. Brandsma, and M. M. W. Ulrich, “Porcine wound models for skin substitution and burn treatment,” Biomaterials,. 25(9), 1559-1567, (2004).
24. Eisenbeiss W, Marotz J, Schrade JP. “Reflection-optical multispectral imaging method for objective determination of burn depth.” Burns. 1999. 25: 697-704.
25. Eneroth M. Factors affecting wound healing after major amputation of vascular disease: a review. Prosthetics and orthotics international 1999;23:195-208.
26. Engrav L, Heimbach D, Reus J, Harnar T, Marvin J. “Early excision and grafting vs. nonoperative treatment of burns of indeterminant depth: a randomized
prospective study.” The Journal of Trauma. 1983. 23(11): 1001-4.
27. Franklin H, Rajan M, Tseng CL, Pogach L, Sinha A. Cost of lower-limb amputation in the US veterans with diabetes using health services data in fiscal years 2004 and 2010. J Rehabil Res Dev 2014;51:1325-30.
28. G. Antonutto, M. Girardis, D. Tuniz, and P. E. di Prampero, “Noninvasive assessment of cardiac output from arterial pressure profiles during exercise.,” Eur. J. Appl. Physiol. Occup. Physiol., 72(1-2), 18-24, (1995).
29. Graham JS, Chilcott RP, Rice P, Milner SM, Hurst CG, Maliner BI. Wound healing of cutaneous sulfur mustard injuries: strategies for the development of improved therapies. Journal of Burns and Wounds 2005;4:e1.
30. Grubbs, F. E, “Procedures for detection outlying observations in samples”, Technometrics 11 (1). (1969).
31. Guo S, DiPietro LA. Factors affecting wound healing. J Dent Res 2010;89:219-29.
32. Guolan Lu, Baowei Fei, “Medical hyperspectral imaging: a review”, Journal of Biomedical Optics 19(1), 0101901, (2014).
33. Gurfinkel R, Rosenberg L, Cohen S, et al. “Histological assessment of tangentially excised burn eschars.” The Canadian journal of plastic surgery = Journal canadien de chirurgie plastique. 2010. 18: e33-36.
34. Gurfinkel R, Singer AJ, Cagnano E, et al. “Development of a novel animal burn model using radiant heat in rats and swine.” Academic emergency medicine: official journal of the Society for Academic Emergency Medicine. 2010. 17: 514-520.
35. Hanchuan Peng, Fuhui Long, and Chris Ding, “Feature selection based on mutual information: criteria of max-dependency, max-relevance, and min-redundancy,” IEEE Transactions on Pattern Analysis and Machine Intelligence,Vol. 27, No.
8, pp.1226-1238, 2005.
36. HCUP Nationwide Inpatient Sample (NIS). Helathcare Cost and Utilization Project (HCUP). Rockville, MD: Agency for Healthcare Researcha nd Quality; 2009.37. Heimbach D, Engrav L. Surgical management of the burn wound. New York: Raven Press, 1984.
38. Heimbach D. Early burn excision and grafting. Surgical Clinics of North America 1987;67:93-107.
39. Hu S, Peris VA, Echiadis A, et al. “Development of Effective Photoplethysmographic Measurement Techniques: From Contact to Non-Contact and from Point to Imaging.” IEEE EMBS. 2009. 6550-6553.
40. Isabelle Guyon, Andre ElisseeffM, “An Introduction to Variable and Feature Selection”, Journal of Machine Learning Research 3 (2003) 1157 - 1182.
41. J. Allen, “Photoplethysmography and its application in clinical physiological measurement.,” Physiol. Meas., 28, R1-R39, (2007).
42. J. E. Thatcher, K. D. Plant, D. R. King, K. L. Block, W. Fan, and J. M. DiMaio, “Dynamic tissue phantoms and their use in assessment of a noninvasive optical plethysmography imaging device,” in SPIE Sensing Technology + Applications, 910718, (2014).
43. Jackson D. “The diagnosis of the depth of burning.” Br J Surg. 1953. 40: 588.
44. Jacques S, 1998. PS. Absorption Spectra for Biological Tissues Oregon Graduate Institute. 1998 [cited 2014 11/4/2014]. Available from: http://omlc.org/education/ece532/class3/muaspectra.html.
45. John Aldrich, “R. A Fisher and the Making of Maximum likelihood 1912 - 1922”, Statistical Science, 1997, Vol, 12, No. 3, 162 - 176.
46. Kaiser M, Yafi A, Cinat M, et al. “Noninvasive assessment of burn wound
severity using optical technology: a review of current and future modalities.”
Burns. 2011. 37(3): 377-86.
47. Kearns RD, Homes JHT, Alson RL, Cairns BA. Disaster planning: the past, present, and future concepts and principles of managing a surge of burn injured patients for those involved in hospital facility planning and preparedness. J Burn Care Res 2014;35(1):e33-42.
48. King, D., Li, W., Squiers, J.J., Mohan, R., Sellke, E., Mo, W., Zhang, X., Fan, W., DiMaio, J.M., Thatcher, J.E. Surgical Wound Debridement Sequentially
Characterized in a Porcine Burn Model with Multispectral Imaging. Burns. 2015; S0305-4179(15)00138-2.
49. Kono Y, Muder RR. Identifying the incidence of and risk factors for reamputation among patients who underwent foot amputation. Ann Vasc Surg 2012;26:1120-6.
50. L. M. Nilsson, “Respiration signals from photoplethysmography.,” Anesth. Analg., 117(4), 859-65, (2013).
51. Lee JO, Dibildox M, Jimenez CJ, et al. “Operative wound management.” 2012. 157-72e2.
52. Li Q, He X, Wang Y, et al. “Review of spectral imaging technology in biomedical engineering: achievements and challenges.” Journal of Biomedical Optics. 2013.18(10): 100901.
53. Li, W., Mo, W., Zhang, X., Lu, Y., Squiers, J.J., Sellke, E.W., Fan, W.,
DiMaio, J.M., and Thatcher, J.E. (2015). Burn injury diagnostic imaging device’s accuracy improved by outlier detection and removal. Proc. SPIE Defense + Security, Algorithms and Technologies for Multispectral, Hyperspectral, and Ultraspectral Imagery XXI. (March 2015).
54. Lieberman, J.I., Collins, S.M. National Preparedness: Countermeasures for Thermal Burns. United States Government Accountability Office. GAO-12-304R.
February 22, 2012.
55. Liu H, Yu L. “Toward integrating feature selection algorithms for classification and clustering.” IEEE Transactions on Knowledge and Data Engineering.
2005. 17(4): 491 - 502.
56. Lu G, Fei B. “Medical hyperspectral imaging: a Review.” Journal of Biomedical Optics. 2014. 19(1): 1 - 23.
57. Macri LK, Singer AJ, Taira BR, McClain AS, Rosenberg L, Clark RAF. Immediate burn excision fails to reduce injury progression. J Burn Care Res 2013; 34(3):153-60.
58. Marimont, R.B.; Shapiro, M.B (1979(. “Nearest Neighbor searcher and the
curse of Dimensioanlity”. IMA J Apple Math 24 (1): 59 - 70, (1979).
59. Mo, W., Mohan, R., Li, W., Zhang, X., Sellke, E., Fan, W., DiMaio, J.M., and Thatcher, J.E. The importance of illumination in a non-contact photoplethysmography imaging system for burn wound assessment. Proc. SPIE 9303, Photonic Therapeutics and Diagnostics XI, 93030M.
60. Mook GA, Buursma A, Gerding A, Kwant G, Zijlstra WG, “Spectrophotometric determination of oxygen saturation of blood independent of the presence of indocyanine green”, Cardiovas Res, (1979).
61. National Limb Loss Information Center. Amputation Statistics by Cause: Limb Loss in the United States. Fact Sheet. Revised 2008.
62. Nehler MR, Coll JR, Hiatt WR, Regensteiner JG, Schnickel GT, Klenke WA, Strecker PK, Anderson MW, Jones DN, Whitehill TA, Moskowitz S, Krupski WC. Functional outcome in a contemporary series of major lower extremity amputations. J Vasc Surg 2003;38:7-14.
63. Nguyen JQ, Crouzet C, Mai T, et al. “Spatial frequency domain imaging of burn wounds in a preclinical model of graded burn severity.” Journal of Biomedical Optics. 2013. 18(6): 66010.
64. Norgren L, Hiatt WR, Dormandy JA, Nehler MR< Harris KA, Fowkes FG, TASC II Working Group. Inter-society consensus for the management of peripheral arterial disease (PAD). J Vasc Surb 2007;45:S-67.
65. Optical properties of biological tissues: a review. Physics in medicine and biology, 2013, 58 (12), R37-61.
66. Orgill D. Excision and skin grafting of thermal burns. New Eng J Med 2011;360:893-901.
67. Ortiz-Pujols SM, Thompson K, Sheldon GF, et al. “Burn care: Are there sufficient providers and facilities?” Chapel Hill, North Carolina. American College of Surgeons Health Policy Research Institute, November 2011.
68. P. J. Rousseeuw. “Least median of squares regression”. J. Am Stat Ass,
79:871 (1984).
69. P. King, “Design Of Pulse Oximeters,” IEEE Eng. Med. Biol. Mag., 17, (1998).
70. Pape S, Skouras C, Byrne P. An audit of the use of laser Doppler imaging
(LDI) in the assessment of burns of intermediate depth. Burns 2000;27:233-9.
71. PixelTeq I. Multispectral sensing and imaging; SpectroCam VIS-NIR 2013 [cited 2014 7/18/14].
72. R. Moza, J. M. Dimaio, and J. Melendez, “Deep-tissue dynamic monitoring
of decubitus ulcers: Wound care and assessment,” IEEE Eng. Med. Biol. Mag., 29, 71-77,(2010).
73. Resch TR, Drake RM, Helmer SD, et al. “Estimation of burn depth at burn
centers in the United States: a survey.” J Burn Care Res. 2014. 35: 491-7.
74. Rogers LC, Lavery LA, Armstrong DG. The right to bear legs-an amendment to healthcare: how preventing amputations can save billions for the US health-care system. J Am Podiatr Med Assoc 2008;98:166-8.
75. S. B. Usman, M. A. B. M. Ali, M. M. B. I. Reaz, and K. Chellapan, “Second derivative of photoplethysmogram in estimating vascular aging among diabetic patients,” in International Conference for Technical Postgraduates 2009, TECHPOS 2009, (2009).
76. Severinghaus, JW, Honda, Y. “History of Blood Gas Analysis. VII. Pulse Oximetry.” Journal of Clinical Monitoring. 1987. 3(2):135-138.
77. Singer AJ, McClain SA. A porcine burn model. Methods in Molecular Medicine 2003;78:107-19.
78. Sokolova, M., & Lapalme, G. “A systematic analysis of performance measures for classification tasks.” Information Processing and Management. 2009. 45:
427-437.
79.
80. V. T Valery, “Light-tissue interations”, Chapter 3 in Biomedical Photonics Handbook, pp. 1-27, CRC Press, Boca Raton, Florida (2003).
81. Vemulapalli S, Greiner MA, Jones WS, Patel MR, Hernandez AF, Curtis LH. Peripheral arterial testing before lower extremity amputation among Medicare beneficiaries, 2000 to 2010. Circ Cardiovasc Qual Outcomes 2014;7:142-50.
82. W. Mo, R. Mohan, W. Li, X. Zhang, E. Sellke, W. Fan, M. DiMaio, J. Thatcher, “The importance of illumination in a non-contact photoplethysmography imaging system for burn wound assessment”, in SPIE 9303, Photonic Therapeutics and Diagnostics XI, 93030M, (2015).
83. Waters RL, Perry J, Antonelli D, Hislop H. Energy cost of walking of amputees: the influence of level of amputation. J Bone Joint Surg Am 1976;58:42-6.84. Watts AMI, Tyler MPH, Perry ME, Roberts AHN, McGrouther DA. Burn depth and its histological measurement. Burns 2001;27:154-60.
85. Webb S. The physics of medical imaging. CRC Press, 1988.
86. Webster, JG. [Design of Pulse Oximeters, Medical Science Series], Institute of Physics Publishing, New York & Bristol, (1997).
87. Worsley P, Voegeli D. Back to basics: biophysical methods in itsue viability research. J Wound Care 2013;22:434-9.
88. Wutshcert R, Bounameaux H. Determination of amputation level in ischemic
limbs. Diabetes Care 1997;20:1315-8.
89. Ziegler-Graham K, MacKenzie EJ, Ephraim PL, Travison TG, Brookmeyer R. Estimating the prevalence of limb loss in the United States: 2005 to 2050. Arch Phys Med Rehabil 2008;89:422-9.The following list of references includes background techniques that may be useful in understanding aspects of the present disclosure.
1. 1. U.S. Pat. No. 6,353,753 2. U.S. Pat. No. 6,352,517 3. U.S. Pat. No. 6,889,075 4. “Burns: The Neglected but Solvable Health Crisis.” ReSurge International. <Http://www.resurge.org/transforming_lives/story_burns.cfm> Accessed Feb 9th, 2015.
5. 2011 National Burn Repository: Report of Data from 2001-2010. American Burn Association 2011.
A. Alian and KH Shelley, “Photoplethysmography,” Best Pract. Res. Clin. Anaesthesiol., 28 (4), 395-406, (2014).
A. FH Goetz, “Multispectral and Hyperspectral imaging technologies in conservation: current research and potential applications,” Stud. Conserv. 7. 3-16
(2006).
A. Reisner, PA Shaltis, D. McCombie, and HH Asada, “Utility of the photoplethysmogram in circulatory monitoring.,” Anesthesiology, 108, 950-958, (2008).
6. Afromowitz MA, Callis JB, Heimbach DM, et al. “Multispectral imaging of burn wounds: a new clinical instrument for evaluating burn depth”. IEEE transactions on bio-medical engineering. 1988. 35: 842-850.
7. Afromowitz MA, Van Liew GS, Heimback DM. Clinical evaluation of burn injuries using an optical reflectance technique. IEEE Transactions on Biomedical Engineering. 1987; 34 (2): 114-27.
8. Anselmo VJ, Zawacki BE. “Multispectral photographic analysis. A new quantitative tool to assist in the early diagnosis of thermal burn depth.” Annals of biomedical engineering. 1977. 5: 179-193.
9. Arsenault KA, Al-Otaibi A, Devereaux DJ, Thorlund K, Tittley JG, Whitlock RP. The use of transcutaneous oximetry to predict healing complications of lower
limb amputations: a systematic review and meta-analysis. Eur J Vasc Endovasc Surg 2012; 43: 329-36.
10. Bajwa A, Wesolowski R, Patel A, Saha P, Ludwinski F, Smith A, Nagel E, Modarai B. Assessment of tissue perfusion in the lower limb: current methods and techniques under development. Circ Cardiovasc Imaging 2014; 7: 836-43 ..
11. Bak Z, Sjoberg F, Eriksson O, et al. “Hemodynamic changes during resuscitation after burns using the Parkland Formula”. Journal of Trauma-Injury Infection & Critical Care 2009. 66 (2): 329-336.
12. Benitez E, Sumpio BJ, Chin J, Sumpio BE. Contemporary assessment of foot
perfusion in patients with critical limb ischemia. Semin Vasc Surg 2014; 27: 3-15.
13. Branski, LK, Mittermayr R, Herndon DN, et al. “A porcine model of full-thickness burn, excision and skin autografting.” Burns. 2008. 34: 1119-1127.
14. Burgess EM, Matsen FA, Wyss CR, Simmons CW. Segmental transcutaneous measurements of PO2 in patients requiring below-the-knee amputation for peripheral vascular insufficiency. J Bone Jt Surg Am 1982; 64: 378-82.
15. Centers for Disease Control and Prevention. Number (in thousands) of hospital discharges for non-traumatic lower extremity amputation with diabetes as a
listed diagnosis, United States, 1988-2006. Available at: http://www.cdc.gov/diabetes/statistics/lea/fig1.htm
16. Cheong, W.-F, Prahl, SA, Welch, AJ, “A review of the optical properties of biological tissues”, Quantum Electronics, IEEE Journal of Volume: 26, Issue: 12, 2002.
17. Cortes, C .; Vapnik, V. “Support-vectors networks”.
18. Cover TM, Hart PE, "Nearest neighbor pattern classification", IEEE Transactions on information Theory, 13 (1): 21-27 (1967).
19. Denis Coursineau, “Ouliers detection and treatment: A review”, International Journal of Psychological Research, Vol. 3. No. 1 (2010).
20. Desai MH, Herndon DN, Broemeling LD, et al. “Early burn wound excision significantly reduces blood loss.” Ann Surg. 1990. 211 (6): 753-762.
21. Dillingham TR, Pezzin LE, Shore AD. Reamputation, mortality, and health care costs among persons with dysvascular lower-limb amputations. Arch Phys Med Rehabil 2005; 86: 480-6.
22. DM M, Jenkins M, GD W. Outpatient burn management. Nursing Clinics of North America 1997; 32: 343.
23. E. Middelkoop, AJ van den Bogaerdt, EN Lamme, MJ Hoekstra, K. Brandsma, and MMW Ulrich, “Porcine wound models for skin substitution and burn treatment,” Biomaterials ,. 25 (9), 1559-1567, (2004) ..
24. Eisenbeiss W, Marotz J, Schrade JP. “Reflection-optical multispectral imaging method for objective determination of burn depth.” Burns. 1999. 25: 697-704.
25. Eneroth M. Factors affecting wound healing after major amputation of vascular disease: a review. Prosthetics and orthotics international 1999; 23: 195-208.
26. Engrav L, Heimbach D, Reus J, Harnar T, Marvin J. “Early excision and grafting vs. nonoperative treatment of burns of indeterminant depth: a randomized
prospective study. ”The Journal of Trauma. 1983. 23 (11): 1001-4.
27. Franklin H, Rajan M, Tseng CL, Pogach L, Sinha A. Cost of lower-limb amputation in the US veterans with diabetes using health services data in fiscal years 2004 and 2010. J Rehabil Res Dev 2014; 51: 1325-30.
28. G. Antonutto, M. Girardis, D. Tuniz, and PE di Prampero, “Noninvasive assessment of cardiac output from arterial pressure profiles during exercise.,” Eur. J. Appl. Physiol. Occup. Physiol., 72 (1-2 (1-2) ), 18-24, (1995).
29. Graham JS, Chilcott RP, Rice P, Milner SM, Hurst CG, Maliner BI. Wound healing of cutaneous sulfur mustard injuries: strategies for the development of improved therapies. Journal of Burns and Wounds 2005; 4: e1.
30. Grubbs, F. E, “Procedures for detection outlying observations in samples”, Technometrics 11 (1). (1969).
31. Guo S, DiPietro LA. Factors affecting wound healing. J Dent Res 2010; 89: 219-29.
32. Guolan Lu, Baowei Fei, “Medical hyperspectral imaging: a review”, Journal of Biomedical Optics 19 (1), 0101901, (2014).
33. Gurfinkel R, Rosenberg L, Cohen S, et al. “Histological assessment of tangentially excised burn eschars.” The Canadian journal of plastic surgery = Journal canadien de chirurgie plastique. 2010. 18: e33-36.
34. Gurfinkel R, Singer AJ, Cagnano E, et al. “Development of a novel animal burn model using radiant heat in rats and swine.” Academic emergency medicine: official journal of the Society for Academic Emergency Medicine. 2010. 17: 514-520 ..
35. Hanchuan Peng, Fuhui Long, and Chris Ding, “Feature selection based on mutual information: criteria of max-dependency, max-relevance, and min-redundancy,” IEEE Transactions on Pattern Analysis and Machine Intelligence, Vol. 27, No.
8, pp.1226-1238, 2005.
36. HCUP Nationwide Inpatient Sample (NIS). Helathcare Cost and Utilization Project (HCUP). Rockville, MD: Agency for Healthcare Researchand Quality; 2009.37. Heimbach D, Engrav L. Surgical management of the burn wound. New York: Raven Press, 1984.
38. Heimbach D. Early burn excision and grafting. Surgical Clinics of North America 1987; 67: 93-107.
39. Hu S, Peris VA, Echiadis A, et al. “Development of Effective Photoplethysmographic Measurement Techniques: From Contact to Non-Contact and from Point to Imaging.” IEEE EMBS. 2009. 6550-6553.
40. Isabelle Guyon, Andre ElisseeffM, “An Introduction to Variable and Feature Selection”, Journal of Machine Learning Research 3 (2003) 1157 --1182.
41. J. Allen, “Photoplethysmography and its application in clinical physiological measurement.” Physiol. Meas., 28, R1-R39, (2007).
42. JE Thatcher, KD Plant, DR King, KL Block, W. Fan, and JM DiMaio, “Dynamic tissue phantoms and their use in assessment of a noninvasive optical plethysmography imaging device,” in SPIE Sensing Technology + Applications, 910718, (2014) ..
43. Jackson D. “The diagnosis of the depth of burning.” Br J Surg. 1953. 40: 588.
44. Jacques S, 1998. PS. Absorption Spectra for Biological Tissues Oregon Graduate Institute. 1998 [cited 2014 11/4/2014]. Available from: http://omlc.org/education/ece532/class3/muaspectra.html.
45. John Aldrich, “R. A Fisher and the Making of Maximum likelihood 1912 --1922”, Statistical Science, 1997, Vol, 12, No. 3, 162 --176.
46. Kaiser M, Yafi A, Cinat M, et al. “Noninvasive assessment of burn wound”
severity using optical technology: a review of current and future modalities. ”
Burns. 2011. 37 (3): 377-86.
47. Kearns RD, Homes JHT, Alson RL, Cairns BA. Disaster planning: the past, present, and future concepts and principles of managing a surge of burn injured patients for those involved in hospital facility planning and preparedness. J Burn Care Res 2014; 35 (1): e33-42.
48. King, D., Li, W., Squiers, JJ, Mohan, R., Sellke, E., Mo, W., Zhang, X., Fan, W., DiMaio, JM, Thatcher, JE Surgical Wound Debridement Sequentially
Characterized in a Porcine Burn Model with Multispectral Imaging. Burns. 2015; S0305-4179 (15) 00138-2.
49. Kono Y, Muder RR. Identifying the incidence of and risk factors for reamputation among patients who underwent foot amputation. Ann Vasc Surg 2012; 26: 1120-6.
50. LM Nilsson, “Respiration signals from photoplethysmography.,” Anesth. Analg., 117 (4), 859-65, (2013).
51. Lee JO, Dibildox M, Jimenez CJ, et al. “Operative wound management.” 2012. 157-72e2.
52. Li Q, He X, Wang Y, et al. “Review of spectral imaging technology in biomedical engineering: achievements and challenges.” Journal of Biomedical Optics. 2013.18 (10): 100901.
53. Li, W., Mo, W., Zhang, X., Lu, Y., Squiers, JJ, Sellke, EW, Fan, W.,
DiMaio, JM, and Thatcher, JE (2015). Burn injury diagnostic imaging device's accuracy improved by outlier detection and removal. Proc. SPIE Defense + Security, Algorithms and Technologies for Multispectral, Hyperspectral, and Ultraspectral Imagery XXI. (March 2015).
54. Lieberman, JI, Collins, SM National Preparedness: Countermeasures for Thermal Burns. United States Government Accountability Office. GAO-12-304R.
February 22, 2012.
55. Liu H, Yu L. “Toward integrating feature selection algorithms for classification and clustering.” IEEE Transactions on Knowledge and Data Engineering.
2005. 17 (4): 491 --502.
56. Lu G, Fei B. “Medical hyperspectral imaging: a Review.” Journal of Biomedical Optics. 2014. 19 (1): 1 --23.
57. Macri LK, Singer AJ, Taira BR, McClain AS, Rosenberg L, Clark RAF. Immediate burn excision fails to reduce injury progression. J Burn Care Res 2013; 34 (3): 153-60.
58. Marimont, RB; Shapiro, MB (1979 (. “Nearest Neighbor searcher and the”
curse of Dimensioanlity ”. IMA J Apple Math 24 (1): 59 --70, (1979).
59. Mo, W., Mohan, R., Li, W., Zhang, X., Sellke, E., Fan, W., DiMaio, JM, and Thatcher, JE The importance of illumination in a non-contact photoplethysmography imaging system for burn wound assessment. Proc. SPIE 9303, Photonic Therapeutics and Diagnostics XI, 93030M.
60. Mook GA, Buursma A, Gerding A, Kwant G, Zijlstra WG, “Spectrophotometric determination of oxygen saturation of blood independent of the presence of indocyanine green”, Cardiovas Res, (1979).
61. National Limb Loss Information Center. Amputation Statistics by Cause: Limb Loss in the United States. Fact Sheet. Revised 2008.
62. Nehler MR, Coll JR, Hiatt WR, Regensteiner JG, Schnickel GT, Klenke WA, Strecker PK, Anderson MW, Jones DN, Whitehill TA, Moskowitz S, Krupski WC. Functional outcome in a contemporary series of major lower extremity amputations. J Vasc Surg 2003; 38: 7-14.
63. Nguyen JQ, Crouzet C, Mai T, et al. “Spatial frequency domain imaging of burn wounds in a preclinical model of graded burn severity.” Journal of Biomedical Optics. 2013. 18 (6): 66010.
64. Norgren L, Hiatt WR, Dormandy JA, Nehler MR <Harris KA, Fowkes FG, TASC II Working Group. Inter-society consensus for the management of peripheral arterial disease (PAD). J Vasc Surb 2007; 45: S-67.
65. Optical properties of biological tissues: a review. Physics in medicine and biology, 2013, 58 (12), R37-61.
66. Orgill D. Excision and skin grafting of thermal burns. New Eng J Med 2011; 360: 893-901.
67. Ortiz-Pujols SM, Thompson K, Sheldon GF, et al. “Burn care: Are there sufficient providers and facilities?” Chapel Hill, North Carolina. American College of Surgeons Health Policy Research Institute, November 2011.
68. PJ Rousseeuw. “Least median of squares regression”. J. Am Stat Ass,
79: 871 (1984).
69. P. King, “Design Of Pulse Oximeters,” IEEE Eng. Med. Biol. Mag., 17, (1998).
70. Pape S, Skouras C, Byrne P. An audit of the use of laser Doppler imaging
(LDI) in the assessment of burns of intermediate depth.
71. PixelTeq I. Multispectral sensing and imaging; SpectroCam VIS-NIR 2013 [cited 2014 7/18/14].
72. R. Moza, JM Dimaio, and J. Melendez, “Deep-tissue dynamic monitoring”
of decubitus ulcers: Wound care and assessment, ”IEEE Eng. Med. Biol. Mag., 29, 71-77, (2010).
73. Resch TR, Drake RM, Helmer SD, et al. “Estimation of burn depth at burn
centers in the United States: a survey. ”J Burn Care Res. 2014. 35: 491-7.
74. Rogers LC, Lavery LA, Armstrong DG. The right to bear legs-an amendment to healthcare: how preventing amputations can save billions for the US health-care system. J Am Podiatr Med Assoc 2008; 98: 166-8.
75. SB Usman, MABM Ali, MMBI Reaz, and K. Chellapan, “Second derivative of photoplethysmogram in estimating vascular aging among diabetic patients,” in International Conference for Technical Postgraduates 2009, TECHPOS 2009, (2009).
76. Severinghaus, JW, Honda, Y. “History of Blood Gas Analysis. VII. Pulse Oximetry.” Journal of Clinical Monitoring. 1987. 3 (2): 135-138.
77. Singer AJ, McClain SA. A porcine burn model. Methods in Molecular Medicine 2003; 78: 107-19.
78. Sokolova, M., & Lapalme, G. “A systematic analysis of performance measures for classification tasks.” Information Processing and Management. 2009. 45:
427-437.
79.
80. V. T Valery, “Light-tissue interations”,
81. Vemulapalli S, Greiner MA, Jones WS, Patel MR, Hernandez AF, Curtis LH. Peripheral arterial testing before lower extremity amputation among Medicare beneficiaries, 2000 to 2010. Circ Cardiovasc Qual Outcomes 2014; 7: 142-50.
82. W. Mo, R. Mohan, W. Li, X. Zhang, E. Sellke, W. Fan, M. DiMaio, J. Thatcher, “The importance of illumination in a non-contact photoplethysmography imaging system for burn wound assessment” , in SPIE 9303, Photonic Therapeutics and Diagnostics XI, 93030M, (2015).
83. Waters RL, Perry J, Antonelli D, Hislop H. Energy cost of walking of amputees: the influence of level of amputation. J Bone Joint Surg Am 1976; 58: 42-6.84. Watts AMI, Tyler MPH, Perry ME, Roberts AHN, McGrouther DA. Burn depth and its histological measurement.
85. Webb S. The physics of medical imaging. CRC Press, 1988.
86. Webster, JG. [Design of Pulse Oximeters, Medical Science Series], Institute of Physics Publishing, New York & Bristol, (1997).
87. Worsley P, Voegeli D. Back to basics: biophysical methods in itsue viability research. J Wound Care 2013; 22: 434-9.
88. Wutshcert R, Bounameaux H. Determination of amputation level in ischemic
limbs. Diabetes Care 1997; 20: 1315-8.
89. Ziegler-Graham K, MacKenzie EJ, Ephraim PL, Travison TG, Brookmeyer R. Estimating the prevalence of limb loss in the United States: 2005 to 2050. Arch Phys Med Rehabil 2008; 89: 422-9.
熱傷評価のための組織分類
本明細書に記載される本発明の態様のいくつかは、光学イメージングを用いて組織を分類するために使用することのできる装置および方法に関する。傷ついた組織を分類することのできる非侵襲的イメージング技術、特に、創傷の重症度評価による迅速なトリアージを容易にし、治療開始前、治療中、および/または治療後に、治癒の進行を監視できる技術が、長年にわたり必要とされてきた。そのような必要性の一例として、日常的な熱傷のケアおよび/または集団的な熱傷のケアにおいて、トリアージを行って重症度を評価するために使用することのできる、より良いイメージング技術に対する要望が挙げられる。 Tissue Classification for Burn Assessment Some of the aspects of the invention described herein relate to devices and methods that can be used to classify tissues using optical imaging. Non-invasive imaging techniques that can classify injured tissue, especially those that facilitate rapid triage by wound severity assessment and monitor the progress of healing before, during, and / or after treatment. However, it has been needed for many years. As an example of such a need, there is a need for better imaging techniques that can be used to triage and assess severity in routine burn care and / or collective burn care. Can be mentioned.
集団的な熱傷のケアの例に関して、より良いイメージング技術の必要性を説明するために、以下を考慮されたい。現在、米国における熱傷の専門家はわずか250人、熱傷用のベッドは全米で1800床に過ぎない。そしてこのような熱傷用の設備は、現在95%の稼働率で使用されている。熱傷患者の数が急激に増えれば、熱傷専門家による手当ての必要な患者を直ちに特定し、優先することが必要となる。さらに、大惨事の発生ともなれば、熱傷の専門家ではない内科医が患者のニーズに対処することも必要となる。例えば、原子力による緊急事態、森林火災、または大規模な花火事故等の際には、熱傷の治療を必要とする患者の数は突如として急激に増加しうる。現在の技術レベルでは、熱傷の専門家であっても熱傷を評価することは困難であり、またその評価は主観的な性質を有するため、熱傷の専門家および専門家でない内科医のいずれもが、緊急の処置および/または熱傷専門家によるケアを必要とする患者を速やかに特定または分類できるような装置の必要性は明白である。大規模災害のシナリオによれば、10000人もの患者が熱傷のケアを必要とする可能性がある。米国内の専門外科医の数および熱傷センターの数は限定的であるため、そのような事故の際に、専門家ではない医療従事者が迅速かつ広範に使用することのできる熱傷治療が、公衆衛生上必要とされている。また、当該分野では、熱傷以外についても、損傷組織と非損傷組織とを迅速に分類して鑑別することのできる方法および装置が必要とされている。 For the example of collective burn care, consider the following to illustrate the need for better imaging techniques. Currently, there are only 250 burn specialists in the United States and only 1800 burn beds nationwide. And such equipment for burns is currently used at an operating rate of 95%. As the number of burn patients grows exponentially, it is necessary to immediately identify and prioritize those who need medical attention from a burn specialist. In addition, in the event of a catastrophe, a physician who is not a burn specialist will need to address the needs of the patient. For example, in the event of a nuclear emergency, forest fire, or large-scale fireworks accident, the number of patients in need of treatment for burns can suddenly increase exponentially. At the current state of the art, it is difficult for even a burn specialist to assess a burn, and the assessment is subjective in nature, so both burn specialists and non-professional physicians The need for equipment that can quickly identify or classify patients in need of urgent treatment and / or care by a burn specialist is clear. According to a large-scale disaster scenario, as many as 10,000 patients may require burn care. Due to the limited number of specialist surgeons and burn centers in the United States, burn treatment that can be quickly and widely used by non-specialist healthcare professionals in the event of such an accident is public health. Needed above. Further, in the art, there is a need for a method and an apparatus capable of quickly classifying and distinguishing damaged tissue and non-damaged tissue other than burns.
標準的な熱傷ケアは、熱傷の深さを推定するための目視と触診から始まる。熱傷を深さによって分類した後、効果的な治療計画が立てられる。通常、表皮熱傷および全層熱傷は、所見に基づき直ちに分類できる。しかし、中間層熱傷の「浅達性」または「深達性」への分類は、遅れることが多い。この遅れは、中間層熱傷が時間をかけて進行するまで、皮膚の損傷の範囲を完全には可視化できないことによる。 Standard burn care begins with visual and palpation to estimate the depth of the burn. After classifying burns by depth, an effective treatment plan is made. Usually, epidermal burns and full-thickness burns can be immediately classified based on the findings. However, the classification of intermediate burns into "superficial" or "deep" is often delayed. This delay is due to the inability to fully visualize the extent of skin damage until intermediate burns have progressed over time.
中間層熱傷の深さを迅速かつ正確に分類することは重要であるが、これにはいくつかの理由がある。第一に、浅達性中間層熱傷と深達性中間層熱傷では治療プロトコルが大きく異なる。浅達性中間層熱傷は局所的に軟膏を使用するだけでよく、7〜21日間で自然に治癒するが、深達性中間層熱傷は外科的に切除し、恵皮部からの自家植皮を行う必要がある。第二に、傷跡および細菌の定着を最小限に抑えるためには、外科的介入の必要性の有無をできるだけ早く見極めることが重要である。中間層熱傷の分類に関連して介入が遅れると、感染症、代謝異常、および臓器不全のリスクが増すことが示されている。さらに、切除の遅れによって熱傷の進行が増すわけではないことが、最近になって示されている。最後に、熱傷が複数部位に存在することは一般的であり、異なる深さの熱傷が混在する場合が多い。熱傷の領域全体に最適な治療を施すためには、複雑な熱傷の切除と移植において、専門家による計画と注意深くかつ特異的な切除が必要とされる。 It is important to quickly and accurately classify the depth of intermediate burns for several reasons. First, treatment protocols differ significantly between superficial and deep intermediate burns. Superficial intermediate burns require only topical ointment and heal spontaneously in 7 to 21 days, while deep intermediate burns are surgically resected and autologous skin grafts from the pelvic skin. There is a need to do. Second, it is important to determine the need for surgical intervention as soon as possible to minimize scar and bacterial colonization. Delayed intervention in relation to the classification of middle-layer burns has been shown to increase the risk of infections, metabolic disorders, and organ failure. Moreover, it has recently been shown that delayed resection does not increase the progression of burns. Finally, it is common for burns to be present at multiple sites, often with a mixture of burns of different depths. Optimal treatment of the entire area of the burn requires professional planning and careful and specific resection in the resection and transplantation of complex burns.
米国の病院における熱傷の専門家はわずか250人、熱傷用ベッドは1800床(稼働率95%)に過ぎず、熱傷ケアの資源は乏しい。したがって、熱傷患者のケアの最前線は非専門家であることが多く、熱傷治療の経験を欠いているために、治療の遅れや最適でない治療につながり合併症の率を高めている。現状において、熱傷深さの臨床診断の正確さは、専門家による場合が70〜80%とみなされており、非専門家の場合は60%に過ぎない。 With only 250 burn specialists and 1800 burn beds (95% occupancy rate) in US hospitals, burn care resources are scarce. Therefore, the forefront of care for burn patients is often non-specialist, and lack of experience in treating burns leads to delays in treatment and suboptimal treatment, increasing the rate of complications. At present, the accuracy of clinical diagnosis of burn depth is considered to be 70-80% for professionals and only 60% for non-specialists.
熱傷深さの評価を改善する可能性の最も高い手段としては、蛍光染料、高周波数超音波、核磁気共鳴イメージング(MRI)、写真撮影、サーモグラフィー、レーザードップラーイメージング(LDI)等が挙げられる。レーザードップラーイメージングは、熱傷ベッドにおける診断を含むものとして米国食品医薬品局の許可を受けた唯一の技術である。この技術は非侵襲的であり、傷の評価に有効であることが示されており、現時点で熱傷の専門家に利用可能な技術となっている。しかしながら、利用可能であるにもかかわらず、主として大規模な熱傷センターにおける消極的な使用にとどまっている。該診断には大きな不都合(傷が完全にむき出しであることおよび患者が動かず静止状態を保つことが必要とされ、かつ受傷から48時間の遅れが生じる)のあることが知られており、結果として臨床の場での有用性は低くなっている。結果が得られるまでにかかる時間も長い。サーモグラフィーも、LDIと同様に非侵襲かつ非接触であるが、患者は恒温室内で15分間、温度が平衡に達するまで待つ必要があり、現在のところ熱傷の深さを分類する方法として適切とはされていない。熱傷の評価におけるカラー写真の使用も困難である場合が多いが、これは、写真が提供するのはヒトの目で認識できるものに過ぎず、熱傷専門の外科医による画像の解釈が必要となることによる。インドシアニングリーン(IDC)のような血管内染料は、組織内の血流に関する情報を提供するものである。この技術は、熱傷における研究が行われており、熱傷において血液灌流の多い部位または少ない部位を特定するために使用できる。この技術は侵襲的であり、画像を得ようとする度に染料の注入が必要とされ、外科的処置によっては所望する画像の数に応じて複数回の注入が必要となることもあり、費用も時間もかかる。 The most likely means of improving the assessment of burn depth include fluorescent dyes, high frequency ultrasound, nuclear magnetic resonance imaging (MRI), photography, thermography, laser Doppler imaging (LDI) and the like. Laser Doppler imaging is the only technology licensed by the US Food and Drug Administration to include diagnosis in burn beds. This technique has been shown to be non-invasive and effective in wound assessment, making it currently available to burn professionals. However, despite being available, it remains primarily for passive use in large burn centers. The diagnosis is known to have major inconveniences (the wound is completely exposed, the patient is required to remain stationary, and there is a 48 hour delay from the injury). As a result, its usefulness in clinical settings is low. It takes a long time to get the result. Thermography, like LDI, is non-invasive and non-contact, but patients have to wait 15 minutes in a homeothermic chamber for temperature to reach equilibrium, which is currently not a good way to classify burn depth. It has not been. The use of color photographs in the evaluation of burns is also often difficult, but this is because the photographs provide only what is recognizable to the human eye and require the interpretation of the image by a burn specialist surgeon. by. Intravascular dyes such as indocyanine green (IDC) provide information about blood flow in tissues. This technique has been studied in burns and can be used to identify areas of high or low hemoperfusion in burns. This technique is invasive and requires injection of dye each time an image is obtained, and some surgical procedures may require multiple injections depending on the number of images desired, which is costly. It also takes time.
見込みのある別の手段として注目に値するマルチスペクトルイメージング(MSI)は、熱傷の表面からの可視光および近赤外光の選択波長の反射率を測定するものである。組織には様々な種類があり、光との相互作用の仕方がそれぞれ異なる組織成分の特有の組み合わせから構成されている。このような光と組織との相互作用によって特有の反射シグネチャーが生じ、それをMSIが捕捉することで、熱傷の重症度分類における使用が可能となる。MSIでは、患者の多少の動きは許容され、局所軟膏や包帯を通して組織を評価することができる。これらの特性から、MSIは魅力のある手段となっている。 Notable alternative multi-spectral imaging (MSI) is the measurement of the reflectance of selected wavelengths of visible and near-infrared light from the surface of a burn. There are various types of tissues, each of which is composed of a unique combination of tissue components that interact with light in different ways. This interaction of light with tissue creates a unique reflex signature that MSI captures for use in the severity classification of burns. MSI allows some movement of the patient and allows tissue to be evaluated through topical ointments and bandages. These properties make MSI an attractive tool.
MSIは、臨床環境において過去に試験されており、まず1977年にAnselmoらによって、後の1988年にはAfromitzらによって結果が出されている。これらの実験では、種々の熱傷深さの分類には成功したが、それぞれの結果が得られるまでに数日から数週間の時間を要した。ここ数十年間におけるイメージング技術およびコンピュータ処理能力の向上によって、MSI技術は、患者の診察や手術の一部として日常的に利用できるものとなった。 MSI has been tested in the clinical environment in the past, first by Anselmo et al. In 1977 and later by Afromitz et al. In 1988. In these experiments, various burn depth classifications were successful, but it took days to weeks to obtain each result. Improvements in imaging and computing power over the last few decades have made MSI technology routinely available as part of patient consultation and surgery.
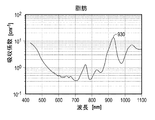
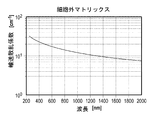
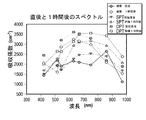
MSI技術の精度は、臨床装置において使用すべき有用な波長の特定に依存する。本発明では、MSIの能力を試験するためにブタの熱傷モデルを使用し、様々な波長を用いて、当初の創傷部位および外科的壊死組織除去術(熱傷切除術としても知られている)の過程における中間層熱傷について調べた。選択された波長は、皮膚組織の主要な構成要素(血液、メラニン、水、脂肪、および細胞外マトリックス(ECM))の吸収ピークに相当するものであり、本明細書の「理論」のセクションで説明されるように、先の臨床的研究によって熱傷を分類できることが示唆されるものであった。各波長の臨床的有用性は、同じサンプルの病理組織学的な評価によって検証された。 The accuracy of MSI technology depends on the identification of useful wavelengths to be used in clinical devices. The present invention uses a porcine burn model to test the ability of MSI and uses a variety of wavelengths to perform initial wound site and surgical necrotic tissue removal (also known as burn resection). The intermediate layer burns in the process were investigated. The wavelengths selected correspond to the absorption peaks of the major components of skin tissue (blood, melanin, water, fat, and extracellular matrix (ECM)) and are described in the "Theory" section herein. As explained, previous clinical studies suggested that burns could be classified. The clinical utility of each wavelength was verified by histopathological evaluation of the same sample.
光学イメージング技術は、組織の表面または表面近傍を非接触かつ迅速に評価する方法を提供する。組織における血液灌流の研究は、光学的方法の使用により達成できる。これは、血液中のヘモグロビンが、組織における顕著な光学的吸収源であることによる。皮下組織および表面組織に存在する、血液によって運搬されるこれらの発色団は、周囲の組織とコントラストをなす光学的パラメータ(主として吸収性)を有している。組織内の血液灌流に関する時間変化信号、すなわちフォトプレチスモグラフィ(PPG)信号は、組織内の血流の特殊な性質によって生じる。血管を通って組織内を流れる、ヘモグロビンを運搬する細胞を含む血液は、心周期ごとに容積の周期的な変化を示す。この血液容積の動的変化を、相対的血液灌流、心臓機能、および末梢血管の健康状態を含む、組織の健康状態の評価に使用することができる。このスペクトル光学イメージング技術、すなわちPPGイメージングにより、組織の表面を通って流れる血液灌流を監視する能力が提供される。 Optical imaging techniques provide a non-contact and rapid method for assessing the surface or vicinity of a tissue. Studies of hemoperfusion in tissues can be achieved by the use of optical methods. This is because hemoglobin in the blood is a prominent optical sink in tissues. These blood-carried chromophores, present in the subcutaneous and superficial tissues, have optical parameters (mainly absorbency) that contrast with the surrounding tissue. The time-varying signal for blood perfusion in tissue, the Photopretismography (PPG) signal, is caused by the special nature of blood flow in tissue. Blood containing hemoglobin-carrying cells, which flows through tissues through blood vessels, exhibits cyclical changes in volume with each cardiac cycle. This dynamic change in blood volume can be used to assess tissue health, including relative hemoperfusion, cardiac function, and peripheral vascular health. This spectral optical imaging technique, or PPG imaging, provides the ability to monitor blood perfusion flowing through the surface of tissue.
非接触の反射率モードPPGイメージングは、潅流された組織からの後方散乱光を解析することによって達成される。光が組織に入射すると、その光の一部は組織内で散乱し、血中の発色団と相互作用し、その後、組織表面を通って散乱する。経時的観察を行うと、このような光と組織との相互作用は、組織から反射される光全体の約1〜2%にあたる弱いAC変調をきたす。この後方散乱光の小さいAC信号を解析することにより、動脈循環の位置、相対的血液容積、および相対的血液濃度に関する情報を得ることができる。この情報から生成される画像により、組織の血流および脈拍数の変化を含む病理を評価する方法が提供されるが、これには組織の潅流、心臓血管の健康状態、潰瘍等の傷、末梢動脈疾患、および呼吸器官の健康状態が含まれる。 Non-contact reflectivity mode PPG imaging is achieved by analyzing backward scattered light from perfused tissue. When light enters a tissue, some of it scatters within the tissue, interacts with the chromophores in the blood, and then scatters through the tissue surface. When observed over time, such interactions between light and tissue result in weak AC modulation, which accounts for about 1-2% of the total light reflected from the tissue. By analyzing this small AC signal of backscattered light, information on the position of arterial circulation, relative blood volume, and relative blood concentration can be obtained. The images generated from this information provide a method for assessing pathology, including changes in tissue blood flow and pulse rate, including tissue perfusion, cardiovascular health, wounds such as ulcers, and peripherals. Includes arterial disease and respiratory health.
組織の血液灌流を測定するための、高信頼性、低コスト、かつポータブルな光学イメージング技術は、医学界にとっての価値が高い。PPGイメージングは、熱傷および慢性的創傷のケアに用途を有する、そのような技術の一つである。発明者らは、特に熱傷に関心を寄せているが、それは、この技術が、使い捨てあるいは滅菌した人体接触装置を必要とすることなく、熱傷患者を評価できると期待されることによる。 Reliable, low-cost, and portable optical imaging techniques for measuring tissue hemoperfusion are of great value to the medical community. PPG imaging is one such technique that has applications in the care of burns and chronic wounds. The inventors are particularly interested in burns because the technique is expected to be able to evaluate burn patients without the need for disposable or sterile human contact devices.
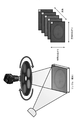
非接触PPGイメージングは、通常、光源として近赤外光(NIR)を使用するが、これは、この波長において、組織に侵入する光子が増加する点で有利であることによる。通常の構成では、イメージングターゲットである組織の近くに光源を配置することが含まれる。組織を通る光の経路がバナナ形状であるため、PPG信号を画像の暗領域に集めることができる。画像の無照射領域から発せられたPPG信号をこれによって検出するためには、通常、高いダイナミックレンジで弱光を感知するセンサー(通常、科学CMOSカメラまたは科学CCDカメラ)が必要とされる。本開示では、受信したPPG信号について照射パターンおよび照射強度の変数を検討し、イメージング装置の視野(FOV)全体にわたってより明るくより一様な照射を行うことによって、PPG信号の強度を増すことができるという仮説を立てた。 Non-contact PPG imaging typically uses near infrared light (NIR) as the light source, which is advantageous in that at this wavelength there are more photons invading the tissue. A typical configuration involves placing a light source near the tissue that is the imaging target. Since the path of light through the tissue is banana-shaped, the PPG signal can be collected in the dark region of the image. In order to detect the PPG signal emitted from the non-irradiated region of the image by this, a sensor (usually a scientific CMOS camera or a scientific CCD camera) that senses low light with a high dynamic range is usually required. In the present disclosure, the intensity of the PPG signal can be increased by examining the irradiation pattern and irradiation intensity variables for the received PPG signal and performing brighter and more uniform irradiation over the entire field of view (FOV) of the imaging apparatus. I made the hypothesis.
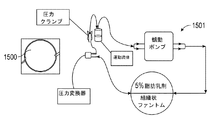
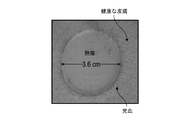
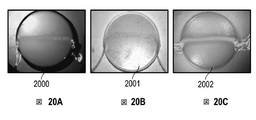
例えば、本明細書に開示される実験において、空間的に均一な、DC変調された照射光源を使用する光学PPGプロトタイプシステムを開発した。一様な照射の原理を説明し、PPGイメージングの性能を評価し、別種の光源の性能との比較を行う。組織様光学特性を有するベンチトップ型の組織ファントムを通じて、評価イメージングシステムの較正を行い、動物モデル実験を実施した。PPGイメージングに一様な照射を使用することによって、動物熱傷モデルにおける表面血管イメージングの性能が改善されることを示した。 For example, in the experiments disclosed herein, we have developed an optical PPG prototype system that uses a spatially uniform, DC-modulated irradiation light source. The principle of uniform irradiation will be explained, the performance of PPG imaging will be evaluated, and the performance of different types of light sources will be compared. The evaluation imaging system was calibrated and animal model experiments were performed through a benchtop tissue phantom with tissue-like optical properties. It has been shown that the use of uniform irradiation for PPG imaging improves the performance of surface vascular imaging in animal burn models.
本明細書で開示される代替案において、熱傷壊死組織除去術中に皮膚における熱傷の存在を特定する目的で使用することのできる、非接触反射型フォトプレチスモグラム(PPG)イメージングの方法およびシステムが提示される。これらの方法およびシステムは、熱傷の切除および創傷トリアージにおける決定等の皮膚創傷管理プロセスにおいて、臨床医および外科医の助けとなるかもしれない。いくつかの実験において、照射の一様性および強度のシステム変数について検討し、得られた知見を提示している。PPGイメージング装置のための照射方法としては、LED配列、タングステン光源、および最終的には高出力LEDエミッタについて研究を行った。これらの3つの異なる照射源について、制御された組織のファントムモデルおよび動物熱傷モデルにおいて試験した。高出力LEDエミッタを使用した低発熱の一様な照射パターンにより、動物の熱傷モデルにおいて収集されたPPG信号が大幅に改善されることが見出された。これらの改善によって、異なる画素のPPG信号が時間ドメインにおいても周波数ドメインにおいても比較可能なものとなり、複雑な照射サブシステムが単純化され、高ダイナミックレンジカメラを使用する必要性が低下した。動物の熱傷データおよび制御された組織のファントムモデルにおける血流量のような熱傷モデルの結果を比較することを通じて光学的改善がなされたため、熱傷評価の助けとなるような、臨床的により応用しやすい画像が得られるようになった。 In the alternatives disclosed herein, non-contact reflex photoplethysmogram (PPG) imaging methods and systems that can be used to identify the presence of burns on the skin during burn necrosis tissue removal. Is presented. These methods and systems may help clinicians and surgeons in skin wound management processes such as burn resection and decisions in wound triage. In some experiments, the system variables of irradiation uniformity and intensity were examined and the findings obtained are presented. As irradiation methods for PPG imaging devices, we studied LED arrangements, tungsten light sources, and finally high-power LED emitters. These three different sources were tested in a controlled tissue phantom model and an animal burn model. It has been found that a low heat generation uniform irradiation pattern using a high power LED emitter significantly improves the PPG signal collected in the animal burn model. These improvements make PPG signals of different pixels comparable in both the time domain and the frequency domain, simplifying complex irradiation subsystems and reducing the need to use high dynamic range cameras. Clinically more applicable images to aid in burn assessment as optical improvements were made through comparing burn model results such as blood flow in animal burn data and controlled tissue phantom models. Came to be obtained.
本明細書に記載した代替案は、褥瘡性潰瘍、充血、四肢退行、レイノー現象、慢性創傷、擦過傷、裂傷、出血、破裂損傷、穿刺傷、穿通創、がん、または組織の性質および特性が正常な状態とは異なる任意のタイプの皮膚変化についてその重症度を特定および/または分類するために使用できる。本明細書に開示した装置は、健康な組織の監視、(例えば壊死組織切除の境界を決定するためのより迅速かつ洗練されたアプローチの提供による)創傷の治療手順の促進および改善、ならびに(特に治療が施された後の)創傷または疾患からの回復の進み具合の評価に使用することができる。本明細書に開示したいくつかの代替案では、傷ついた組織に隣接している健康な組織の特定、切除の境界の決定、左心補助循環装置等の補綴を移植した後の回復の監視、組織移植片または移植再生細胞の生存率の評価、(特に再建処置後の)術後回復の監視が可能な装置が提供される。さらに、本明細書に開示した別の代替案は、傷の変化または受傷後の健康な組織の再生を、特にステロイド、肝細胞成長因子、線維芽細胞成長因子、抗生物質、または再生細胞(幹細胞、内皮細胞および/または内皮前駆細胞を含む単離または濃縮された細胞集団等)等の治療薬の導入後に評価するために使用することができる。 The alternatives described herein include decubitus ulcers, hyperemia, limb regression, Raynaud's phenomenon, chronic wounds, abrasions, lacerations, bleeding, rupture injuries, puncture wounds, penetrating wounds, cancer, or tissue properties and characteristics. It can be used to identify and / or classify the severity of any type of skin change that is different from normal. The devices disclosed herein facilitate and improve the monitoring of healthy tissue, the procedure for treating wounds (eg, by providing a faster and more sophisticated approach to demarcate necrotic tissue resection), and (particularly). It can be used to assess the progress of recovery from a wound or disease (after treatment). Some of the alternatives disclosed herein include identifying healthy tissue adjacent to injured tissue, determining the boundaries of excision, and monitoring recovery after implantation of a prosthesis such as a left cardiac assist circulator. A device capable of assessing the viability of tissue grafts or transplanted regenerated cells and monitoring postoperative recovery (particularly after reconstructive procedures) is provided. In addition, another alternative disclosed herein is for wound alteration or regeneration of healthy tissue after injury, especially steroids, hepatocellular growth factors, fibroblast growth factors, antibiotics, or regenerated cells (stem cells). , Endothelial cells and / or isolated or enriched cell populations containing endothelial progenitor cells, etc.) can be used for evaluation after introduction of therapeutic agents.
本明細書に開示される別の代替案では、同一のシステムハードウェア、すなわちPPGイメージングおよびMSIを用いて達成することのできる2つの光学イメージング技術が提示される。この2つの様式は、評価する組織特性のタイプに関して互いを補完するものである。例えば、PPGイメージングでは、生存組織と非生存組織を区別するために皮膚表面の直下に存在する動脈血流の強度を測定する。MSIでは、測定された反射スペクトルを公知の反射スペクトルの確立されたライブラリと比較することによって、組織に吸収された光および反射された光の種々の波長を解析し、組織を分類する。 Another alternative disclosed herein presents two optical imaging techniques that can be achieved using the same system hardware: PPG imaging and MSI. The two modalities complement each other with respect to the type of tissue characteristics to be evaluated. For example, PPG imaging measures the intensity of arterial blood flow just below the skin surface to distinguish between viable and non-viable tissue. MSI analyzes the various wavelengths of light absorbed and reflected by a tissue and classifies the tissue by comparing the measured reflection spectrum with an established library of known reflection spectra.
PPGイメージングでは、パルスオキシメトリで使用されている技術と同じ技術を使用して、心拍数、呼吸数、およびSpO2(経皮的動脈血酸素飽和度)を含む生命信号を捕捉することができる。PPG信号は、光と血管組織における動的変化との相互作用の測定によって生成されてもよい。血管組織は、心拍周期の収縮期血圧波に合わせてその容積が約1〜2%の膨張および収縮を繰り返す。この血液の流入は、組織の容積を増すだけでなく、光を強く吸収するヘモグロビンタンパクをさらに運び入れる。そのため、この組織における光の吸収は、心拍に合わせて規則的に変動する。したがって、組織の血流の変化は、組織を通過する光がどのように吸収されるかを記録することによって生じるプレチスモグラムを解析することによって確認することができる。この情報は、パルスオキシメータによって報告される生命信号に翻訳される。PPG imaging can capture vital signals, including heart rate, respiratory rate, and SpO 2 (percutaneous arterial oxygen saturation), using the same techniques used in pulse oximetry. The PPG signal may be generated by measuring the interaction of light with dynamic changes in vascular tissue. The vascular tissue repeats expansion and contraction with a volume of about 1 to 2% in accordance with the systolic blood pressure wave of the heartbeat cycle. This influx of blood not only increases the volume of tissue, but also carries in more hemoglobin protein, which absorbs light strongly. Therefore, the absorption of light in this tissue fluctuates regularly with the heartbeat. Therefore, changes in tissue blood flow can be confirmed by analyzing the plethysmogram produced by recording how light passing through the tissue is absorbed. This information is translated into a life signal reported by a pulse oximeter.
プレチスモグラムから画像を生成するために、組織を通る光路を利用することもある。組織の表面に入射する光の一部は、組織内で散乱する。この散乱光の一部は、最初に入射したときと同じ表面を通って組織から出る。高感度のデジタルカメラを用いて、組織のある領域におけるこの後方散乱光の収集を行うが、その際、イメージング装置の各画素が、散乱光の強度の変化によって決まる固有のPPG波形を含むようにする。相対的な組織血流2次元マップを生成するために、固有の波形それぞれの振幅を測定する。多くの拍動サンプルの平均振幅を測定することにより、精度を向上させることができる。 Optical paths through tissues may also be used to generate images from plethysmograms. Some of the light incident on the surface of the tissue is scattered within the tissue. Part of this scattered light exits the tissue through the same surface as when it was first incident. A sensitive digital camera is used to collect this backward scattered light in a region of the tissue so that each pixel of the imaging device contains a unique PPG waveform that is determined by the change in the intensity of the scattered light. To do. The amplitude of each unique waveform is measured to generate a two-dimensional map of relative tissue blood flow. Accuracy can be improved by measuring the average amplitude of many beating samples.
MSIは、可視光と近赤外光の選択波長に関して、ある表面からの反射率を測定するものであってよい。MSIを熱傷に適用できる理由は、様々な組織が、生きた組織であっても壊死組織であっても、光との相互作用の仕方がそれぞれ異なる組織成分の特有の組み合わせから構成されているからである。光と組織との相互作用が多様であることにより、MSIに捕捉される特有の反射シグネチャーが生じる。患者の熱傷からスペクトルシグネチャーを収集し、患者の熱傷を特徴付けるために、既知のスペクトルシグネチャーのデータベースと比較することもできる。MSIは、新しいハイパースペクトルイメージング装置と比べると組織を特徴付けるための固有の波長が少ない場合もあるが、MSIの使用は、空間分解能、スペクトル領域、画像の獲得速度、および費用において有利な場合もあり、これらが考慮される。熱傷の重症度をスペクトルで特定することは、1970年代に、患者の初期評価における臨床観察を補う手段として提案された。深さの異なる熱傷の固有の光学的反射特性を調べることによって熱傷の重症度を特定できることは、交換可能なフィルターを備えたNASAに開発されたカメラの使用により、1977年に実証された。別の複数のグループも、この技術を利用して熱傷組織の特徴付けを行うことにおいて、いくばくかの成功を収めた。これらの研究により、MSIは臨床的判断と比べて熱傷の深さの測定において優れていることが示されたが、皮膚表面の水分により輝度を増すスペクトル反射をフィルターすることが必要であるといった技術上の難点があることによって、MSIの臨床的応用には制限があることも報告された。最も重要なことは、MSIは、この技術が開発された当初は、データ処理に厳しい制限があったためにデータの獲得に何日間も要したが、現代的なコンピュータ技術の恩恵を享受する今日では、エンジニアはもはやそのような問題には直面しないということである。
切断のための組織分類 The MSI may measure the reflectance from a surface with respect to the selective wavelengths of visible and near infrared light. The reason MSI can be applied to burns is that different tissues, whether living or necrotic, are composed of unique combinations of tissue components that interact with light differently. Is. The diverse interaction of light with tissue results in a unique reflective signature captured by MSI. Spectral signatures can also be collected from patient burns and compared to a database of known spectral signatures to characterize patient burns. While MSIs may have fewer specific wavelengths to characterize tissue compared to new hyperspectral imaging devices, the use of MSIs may be advantageous in terms of spatial resolution, spectral region, image acquisition speed, and cost. , These are taken into account. Spectral identification of the severity of burns was proposed in the 1970s as a means of supplementing clinical observations in the initial evaluation of patients. The ability to determine the severity of burns by examining the inherent optical reflection properties of burns of different depths was demonstrated in 1977 by the use of a camera developed by NASA with interchangeable filters. Other groups have also had some success in using this technique to characterize burned tissue. These studies have shown that MSIs are superior in measuring burn depth compared to clinical judgment, but techniques such as the need to filter spectral reflections that increase brightness due to moisture on the skin surface. It has also been reported that the above drawbacks limit the clinical application of MSI. Most importantly, MSI took days to acquire data due to severe data processing restrictions when the technology was first developed, but nowadays it benefits from modern computer technology. The engineer no longer faces such a problem.
Tissue classification for cutting
米国では、毎年約18万5千件もの下肢切断が起こり、米国の成人約2百万人以上が切断の経験者である。切断の最も大きな危険因子は、末梢動脈疾患(PAD)であり、糖尿病(DM)を併発していることも併発していないこともあるが、全切断者の半数以上を占め、血行障害切断と呼ばれている。DMを有する患者は、下肢切断のリスクが一般の人々に比べて10倍も高く、糖尿病による下肢の潰瘍のために、毎年6万件を超える切断が行われている。毎年、10万人につき約30人が、血行障害疾患に続発する切断を余儀なくされている。米国の高齢化により、この件数は今後10年間で50%以上増加すると考えられている。 In the United States, about 185,000 amputations occur each year, and more than 2 million adults in the United States have amputations. The greatest risk factor for amputation is peripheral arterial disease (PAD), which may or may not be accompanied by diabetes (DM), but accounts for more than half of all amputations and is associated with blood circulation disorder amputation. being called. Patients with DM are at 10 times more risk of amputation than the general population, and more than 60,000 amputations are made each year due to diabetic lower limb ulcers. Every year, about 30 out of 100,000 people are forced to disconnect after a blood circulation disorder. Due to the aging of the United States, this number is expected to increase by more than 50% over the next decade.
米国の医療制度における四肢切断の年間の損失は、財政面でもそれ以外の面でも、莫大である。退役軍人(VA)システムが独自に行ったある調査によれば、糖尿病に伴う四肢欠損に関連する費用負担は、2010年の単年度で2億ドル(患者1人当たり、60647ドル)を超えていた。米国における下肢切断のための病院関連費用は、2009会計年度において総額80.3億ドルに上り、リハビリテーションや補綴の費用も含めた大切断術1件の生涯コストは、患者1人当たり約50万ドルであった。四肢切断では、重い財政負担に加えて、切断の結果として患者は著しく不健康な状態に置かれ、生活の質の低下を経験する。重要なことに、このような患者の機能状態は悪く、血行障害による下肢大切断を受けた後に補綴の助けを借りて家の外を歩くことができる患者は25%に過ぎない。より近位での切断を要する状態に進行すると、組織の喪失が増すにつれてエネルギーコストも増加し、リハビリテーションによって歩けるようになる可能性は低くなる。 The annual loss of amputation in the US healthcare system is enormous, both financially and otherwise. According to a study conducted independently by the Veterans Affairs (VA) system, the cost burden associated with limb defects associated with diabetes exceeded $ 200 million ($ 60,647 per patient) in a single year of 2010. .. Hospital-related costs for amputation in the United States totaled $ 8.03 billion in fiscal year 2009, and the lifetime cost of a major amputation, including rehabilitation and prosthesis costs, was approximately $ 500,000 per patient. Met. With amputation, in addition to the heavy financial burden, the amputation leaves the patient in a significantly unhealthy state and experiences a decline in quality of life. Importantly, these patients are poorly functioning, with only 25% of patients being able to walk out of the home with the help of a prosthesis after undergoing a major amputation of the lower extremity due to impaired circulation. As the condition progresses to require more proximal amputation, energy costs increase as tissue loss increases, and rehabilitation is less likely to allow walking.
切断の際、四肢組織をできる限り多く残すことが好ましいのは明らかであるが、外科医は、所定の切断レベル(LOA)における一次創傷治癒の可能性とバランスを取る必要があり、遠位での切断は選択し難い。適切なLOAを選択することは、主として外科医の臨床的判断(患者の履歴および身体診察(皮膚の色、体温、末梢脈拍、および処置中の傷からの出血)ならびに糖尿病、喫煙、栄養状態等の臨床要因に関する情報を利用)に基づいて、場合によっては、組織の血流および/または酸素化を定量化するように設計された様々な非侵襲試験(足関節上腕血圧比[ABI]、経皮酸素測定[TCOM]、または皮膚潅流圧[SPP])と組み合わせて行われる。しかしながら、最も一般的に使用されている試験(ABI)が現在のガイドラインで推奨されているにもかかわらず、ABIにより評価されるのは、下肢切断を受ける患者の半数に過ぎない。さらに、ある研究によれば、足背動脈において触知可能な拍動を有する患者の50%と、正常なABIを有する患者の30%が、前足部の切断後に再切断を要したことが示された。同じ研究において、切断と同時に血行再建術を受けた患者の50%近くが、遠位端の血行再建に向けて特別な努力が払われたにもかかわらず、やはり再切断を要した。TCOMは当初、切断後の一次創傷治癒の可能性を明らかにできると見込まれたが、臨床診療におけるTCOMの役割を明確にするに足る大規模かつ有力な調査が完了しておらず、その有用性に関してはいまだに議論されている。さらに、TCOMの測定は、体温のような生理学的条件の影響を受け、またTCOM電極は、皮膚の狭い領域しか測定できない。したがって、TCOMは、数十年にわたって利用可能であったものの、日常的な臨床診療には採用されていない。 While it is clear that it is preferable to leave as much limb tissue as possible during amputation, the surgeon needs to balance the potential for primary wound healing at a given cutting level (LOA) and is distal. Cutting is difficult to choose. Choosing the right LOA is primarily a surgeon's clinical judgment (patient history and physical examination (skin color, temperature, peripheral pulse, and bleeding from wounds during treatment) and diabetes, smoking, nutritional status, etc. Various non-invasive studies designed to quantify tissue blood flow and / or oxygenation based on (using information about clinical factors), ankle-brachial blood pressure ratio [ABI], transdermal It is performed in combination with oxygen measurement [TCOM] or skin perfusion pressure [SPP]). However, despite the fact that the most commonly used trial (ABI) is recommended by current guidelines, only half of patients undergoing lower limb amputation are evaluated by ABI. In addition, one study showed that 50% of patients with palpable pulsations in the dorsalis pedis and 30% of patients with normal ABI required re-amputation after amputation of the forefoot. Was done. In the same study, nearly 50% of patients who underwent revascularization at the same time as amputation still required revascularization, despite special efforts towards distal revascularization. Initially, TCOM was expected to reveal the potential for primary wound healing after amputation, but it has not been extensively and influentially investigated to clarify the role of TCOM in clinical practice and is useful. Gender is still being debated. In addition, TCOM measurements are affected by physiological conditions such as body temperature, and TCOM electrodes can only measure narrow areas of the skin. Therefore, although TCOM has been available for decades, it has not been adopted in routine clinical practice.
組織をできる限り多く残しておくことと、一次創傷治癒に失敗するリスクを最小限にすることとの難しい兼ね合いと、適切なLOAを定めるための臨床的判断に関する信頼性を考慮すれば、報告されている再切断率は最適なものとは言えない。再切断率は、当初の切断レベルによって、膝上(AKA)切断の場合の約10%から足部切断の場合の約35%まで様々であるが、より近位レベルでの再切断が必要となる。再切断の直接的なコストに関して現時点で利用できるデータは限られているが、血行障害による切断に伴うケアに関して毎年費やされている数十億ドルのうち相当な部分が、再切断、再入院およびABIに基づく当初の手術と再切断の間の創傷ケアに費やされた努力に関するコストに占められていることは明らかである。一次治癒の遅れや失敗により、患者が感染症等に罹患したり死に至ったりするリスクが高まる。さらに、ABIに基づく切断後に一次創傷治癒が遅れたり失敗したりすると、患者の生活の質に深刻な影響を与えることとなる。また、再切断を必要とする患者は、歩行可能な状態に戻るための身体リハビリテーションおよび補綴を得ることが遅れることとなる。このような患者は、医療制度を利用する回数が増加し、再手術の前にさらなる創傷ケアを受けることになる。これは、最初に適切なLOAが選択されていれば避けることのできた無駄な努力であると言える。再切断率に関する報告は多いが、医師が再切断のリスクを意識して必要以上に近位側でのLOAを強引に選択することがどれくらいの頻度で起こっているかという調査の報告はない。実際に、外科医が、より遠位レベルでも治癒の可能性が高いことを自信を持って予測することができないという理由から、患者が必要以上に近位側での切断を受け入れることはありうる。したがって、LOAに関する決定の指針となる試験は、再切断率を低減しつつ、大切断に直面している患者の組織をできる限り多く残しておける可能性を有している。 Reported given the difficult trade-off between leaving as much tissue as possible and minimizing the risk of failure to heal the primary wound, and the reliability of clinical decisions to determine the appropriate LOA. The re-cutting rate is not optimal. Re-amputation rates vary from about 10% for above-knee (AKA) amputations to about 35% for foot amputations, depending on the initial amputation level, but require more proximal amputations. Become. Although limited data are currently available on the direct cost of re-disconnection, a significant portion of the billions of dollars spent each year on care associated with dissection due to blood circulation disorders is re-disconnection and readmission. And it is clear that it is dominated by the costs associated with the effort spent on wound care between the initial surgery and re-cutting under ABI. Delays or failures in primary healing increase the risk of the patient becoming infected or dying. In addition, delayed or unsuccessful primary wound healing after ABI-based cutting can seriously affect a patient's quality of life. Also, patients in need of re-amputation will be delayed in obtaining physical rehabilitation and prostheses to return to a walkable state. Such patients will have more access to the health care system and will receive additional wound care prior to reoperation. This is a waste of effort that could have been avoided if the appropriate LOA was initially selected. Although there are many reports on the re-cutting rate, there are no reports on how often doctors are conscious of the risk of re-cutting and forcibly select LOA on the proximal side more than necessary. In fact, it is possible for a patient to accept an unnecessarily proximal amputation because the surgeon cannot confidently predict that healing is likely even at a more distal level. Therefore, studies that guide decisions regarding LOA have the potential to retain as much tissue as possible in patients facing major amputation while reducing re-cutting rates.
しかしながら、血行障害疾患を有する患者が切断を受けた後の、一次創傷治癒の可能性を決定するゴールドスタンダード試験は、現時点では存在しない。組織の微小循環のみを局所的に評価することによってそのようなゴールドスタンダードを見出そうとする試みは、多くなされてきた。このような状況の下、TCOM、SPP、およびレーザードップラーを含む、皮膚組織の血液灌流および酸素化を正確に測定できることが知られている装置の試験が行われている。今のところ、微小循環の評価のみでは、LOAの選択時に臨床的判断に代わって組織の治癒の可能性を十分な精度で評価できるような結果は得られていない。したがって、皮膚の局所的灌流および酸素化を特徴付けるだけでは、組織の治癒の可能性を定量化するための十分な情報となりえないことは明らかである。これらの技術のいずれにおいても予後に含めることができていないのは、創傷の治癒の可能性にも影響を与える併存疾患の全身的影響である。実際、20年近く前に、血行障害による大切断の後の創傷の治癒に影響を与える要因について検討した著者の1人は、切断における適切なレベルの選択に関して、「創傷の治癒に関連するのは組織の血流だけではないため、大切断後の治癒の可能性を予測するための『ゴールドスタンダード試験』は存在しないであろう。この検討において言及した他の要因(喫煙、栄養状態、糖尿病、および感染症)もまた重要であるかもしれない。したがって、臨床的判断と種々の試験との組み合わせが、最も一般的なアプローチである。」と結論付けた。この著者の予測に反して、Spectral
MDにより、組織の血流の生理を特徴付ける客観的な試験から収集される情報と、患者の重要な健康指標とを統合する能力を有するイメージング装置が開発された。前述の問題は、特に、本開示の機械学習アルゴリズムの項に記載される、微小循環の光学的評価と患者の全般的健康指標とを組み合わせて予後情報を生成するようないくつかの実施形態において、取り扱っている。この方法を用いることにより、本発明の装置では、創傷の治癒の可能性について定量的な評価をすることができる。これは、定性的な評価しかできない現在の臨床判断基準とは対照的である。However, there are currently no gold standard trials to determine the likelihood of primary wound healing after a patient with a blood circulation disorder undergoes amputation. Many attempts have been made to find such a gold standard by locally assessing only the microcirculation of tissue. Under these circumstances, devices known to be able to accurately measure blood perfusion and oxygenation of skin tissue, including TCOM, SPP, and laser Doppler, are being tested. So far, the evaluation of microcirculation alone has not provided results that can evaluate the possibility of tissue healing in place of clinical judgment when selecting LOA with sufficient accuracy. Therefore, it is clear that characterizing local perfusion and oxygenation of the skin alone cannot provide sufficient information to quantify the potential for tissue healing. What cannot be included in the prognosis of any of these techniques is the systemic effect of comorbidity that also affects the likelihood of wound healing. In fact, nearly 20 years ago, one of the authors who examined the factors that influence wound healing after a major amputation due to impaired circulation said, "It is related to wound healing" regarding the selection of the appropriate level of amputation. There may not be a "gold standard trial" to predict the likelihood of healing after major amputation, as it is not just tissue blood flow. Other factors mentioned in this study (smoking, nutritional status, diabetes) , And infectious diseases) may also be important. Therefore, the combination of clinical judgment and various trials is the most common approach. " Contrary to the author's prediction, Spectral
MD has developed an imaging device capable of integrating information gathered from objective studies that characterize the physiology of tissue blood flow with important patient health indicators. The aforementioned problems are particularly addressed in some embodiments described in the Machine Learning Algorithms section of the present disclosure, such as combining an optical assessment of microcirculation with a patient's general health index to generate prognostic information. ,We are dealing. By using this method, the device of the present invention can quantitatively evaluate the possibility of wound healing. This is in contrast to current clinical criteria, which can only be evaluated qualitatively.
したがって、本発明の一態様は、第1の組織部位を照射するよう構成された1以上の光源と、第2の組織部位から反射された光を受けるよう構成された1以上の画像取得装置と、前記1以上の光源および前記1以上の画像取得装置を制御して複数の異なる時間および複数の異なる周波数帯に対応する複数の画像を取得するよう構成されたコントローラと、前記複数の画像に少なくとも一部基づく1以上の臨床状態によって第2の組織部位の各領域を解析するよう構成されたプロセッサとを有するイメージングシステムに関する。 Therefore, one aspect of the present invention includes one or more light sources configured to irradiate the first tissue site and one or more image acquisition devices configured to receive light reflected from the second tissue site. A controller configured to control the one or more light sources and the one or more image acquisition devices to acquire a plurality of images corresponding to a plurality of different times and a plurality of different frequency bands, and at least the plurality of images. It relates to an imaging system having a processor configured to analyze each region of a second tissue site by one or more clinical conditions based in part.
別の一態様は、1以上の光源によって第1の組織部位を照射すること、1以上の画像取得装置によって第2の組織部位から反射された光を受けること、第2の組織部位の、複数の異なる時間および複数の異なる周波数帯に対応する複数の画像を取得すること、ならびに前記複数の画像に少なくとも一部基づいて第2の組織部位の各領域を分類することを含む方法に関する。 Another aspect is to irradiate the first tissue site with one or more light sources, receive the light reflected from the second tissue site by one or more image acquisition devices, and multiple of the second tissue sites. The present invention relates to a method including acquiring a plurality of images corresponding to different times and a plurality of different frequency bands, and classifying each region of a second tissue site based on at least a part of the plurality of images.
別の一態様は、第1の組織部位を照射するよう構成された1以上の光源と、第2の組織部位から反射された光を受けるよう構成された1以上の画像取得装置と、第2の組織部位の、複数の異なる時間および複数の異なる周波数帯に対応する複数の画像を取得する手段と、前記複数の画像に基づいて第2の組織部位の各領域を分類するための手段とを有するイメージングシステムに関する。 Another aspect is one or more light sources configured to illuminate the first tissue site, one or more image acquisition devices configured to receive light reflected from the second tissue site, and a second. A means for acquiring a plurality of images corresponding to a plurality of different times and a plurality of different frequency bands of the tissue part of the tissue, and a means for classifying each region of the second tissue part based on the plurality of images. Regarding the imaging system to have.
別の一態様は、創傷の治癒の誘導または創傷の回復の改善のための方法に関し、該方法は、(a)健康な組織を含む第1の組織部位および創傷の少なくとも一部を含む第2の組織部位の、複数の異なる時間および複数の異なる周波数帯に対応する複数の画像を、本明細書で開示される任意のシステムを利用すること等によって取得すること、(b)(a)で取得した複数の画像に基づいて第2の組織部位の各領域を分類すること、ならびに(c)創傷の治癒が誘導されるように、創傷の少なくとも一部に治療剤および治療技術の一方または両方を施すことを含む。 Another aspect relates to a method for inducing wound healing or improving wound healing, wherein the method comprises (a) a first tissue site comprising healthy tissue and a second comprising at least a portion of the wound. Obtaining a plurality of images of the tissue site corresponding to a plurality of different times and a plurality of different frequency bands, such as by using an arbitrary system disclosed in the present specification, (b) (a). Classification of each region of the second tissue site based on the multiple images obtained, and (c) one or both therapeutic agents and techniques on at least a portion of the wound so that healing of the wound is induced. Including applying.
別の一態様は、創傷の治癒または創傷の回復を監視する方法に関し、該方法は、(a)健康な組織を含む第1の組織部位および創傷の少なくとも一部を含む第2の組織部位の、複数の異なる時間および複数の異なる周波数帯に対応する複数の画像を、本明細書で開示される任意のシステムを利用すること等によって取得すること、(b)(a)で取得した複数の画像に基づいて第2の組織部位の各領域を分類すること、(c)創傷の治癒が誘導されるように、創傷の少なくとも一部に治療剤を施すこと、ならびに(d)(c)を実施した後に、少なくとも(a)および(b)を繰り返すことを含む。 Another aspect relates to a method of monitoring wound healing or wound healing, wherein the method is (a) a first tissue site containing healthy tissue and a second tissue site comprising at least a portion of the wound. , Acquiring a plurality of images corresponding to a plurality of different times and a plurality of different frequency bands by using an arbitrary system disclosed in the present specification, and a plurality of images acquired in (b) and (a). Classification of each region of the second tissue site based on the image, (c) applying a therapeutic agent to at least a part of the wound so as to induce healing of the wound, and (d) (c). This involves repeating at least (a) and (b) after the procedure.
別の一態様は、創傷を分類する方法に関し、該方法は、(a)健康な組織を含む第1の組織部位および創傷の少なくとも一部を含む第2の組織部位の、複数の異なる時間および複数の異なる周波数帯に対応する複数の画像を、本明細書で開示される任意のシステムを利用すること等によって取得すること、ならびに(b)(a)で取得した複数の画像に基づいて第2の組織部位の各領域を分類することを含む。 Another aspect relates to a method of classifying a wound, wherein the method is: (a) a first tissue site containing healthy tissue and a second tissue site containing at least a portion of the wound at a plurality of different times and Obtaining a plurality of images corresponding to a plurality of different frequency bands by using an arbitrary system disclosed in the present specification, and based on the plurality of images obtained in (b) and (a). Includes classifying each region of the two tissue sites.
別の一態様は、創傷の壊死組織を切除する方法に関し、該方法は、(a)健康な組織を含む第1の組織部位および創傷の少なくとも一部を含む第2の組織部位の、複数の異なる時間および複数の異なる周波数帯に対応する複数の画像を、本明細書で開示される任意のシステムを利用すること等によって取得すること、(b)(a)で取得した複数の画像に基づいて、健康な組織と壊死組織との界面に最も近い部位等の、壊死組織切除の境界を決定すること、ならびに(c)前記壊死組織切除境界内の創傷の壊死組織を切除することを含む。 Another aspect relates to a method of excising the necrotic tissue of a wound, wherein the method is: (a) a plurality of first tissue sites containing healthy tissue and a second tissue site containing at least a portion of the wound. Obtaining a plurality of images corresponding to different times and a plurality of different frequency bands by using an arbitrary system disclosed in the present specification, or based on the plurality of images acquired in (b) and (a). It includes determining the boundary of necrotic tissue resection, such as the site closest to the interface between healthy tissue and necrotic tissue, and (c) removing the necrotic tissue of the wound within the necrotic tissue resection boundary.
別の一態様は、慢性の創傷を特定する方法に関し、該方法は、(a)健康な組織を含む第1の組織部位および創傷の少なくとも一部を含む第2の組織部位の、複数の異なる時間および複数の異なる周波数帯に対応する複数の画像を、本明細書で開示される任意のシステムを利用すること等によって取得すること、ならびに(b)(a)で取得した複数の画像に基づいて、第2の組織部位の各領域を慢性の創傷が存在する領域として分類することを含む。 Another aspect relates to a method of identifying a chronic wound, wherein the method is (a) a plurality of different tissue sites, including a first tissue site containing healthy tissue and a second tissue site containing at least a portion of the wound. Obtaining a plurality of images corresponding to time and a plurality of different frequency bands by using any system disclosed in the present specification, and based on the plurality of images obtained in (b) and (a). This includes classifying each region of the second tissue site as the region where the chronic wound is present.
別の一態様は、熱傷の重症度を評価する方法に関し、該方法は、対象を、光源および画像取得装置に近接するよう配置すること、前記光源を使用して、対象の第1の組織部位を照射すること、前記画像取得装置を使用して、第2の組織部位の複数の画像を取得すること、前記画像取得装置によって取得した複数の画像に少なくとも一部基づいて、第2の組織部位の各領域の熱傷の状態を分類すること、ならびに前記分類に少なくとも一部基づいて、対象における熱傷を負った体表の総面積の概算パーセンテージを計算することを含む。 Another aspect relates to a method of assessing the severity of a burn, in which the subject is placed close to a light source and an image acquisition device, the light source is used to provide a first tissue site of the subject. To obtain a plurality of images of the second tissue site using the image acquisition device, based on at least a part of the plurality of images acquired by the image acquisition device, the second tissue site. Includes classifying the condition of burns in each area of the subject, as well as calculating an approximate percentage of the total area of the burned body surface in the subject based on at least a portion of the classification.
別の一態様は、対象の熱傷の重症度を評価するための装置に関し、該装置は、第1の組織部位を照射するよう構成された1以上の光源と、第2の組織部位から反射された光を受けるよう構成された1以上の画像取得装置と、前記1以上の光源および前記1以上の画像取得装置を制御して第2の組織部位の複数の画像を取得するよう構成されたコントローラと、前記複数の画像に基づいて第2の組織部位の各領域の熱傷の状態を分類し、該熱傷状態の分類に基づいて、対象における熱傷を負った体表の総面積の概算パーセンテージを計算するよう構成されたプロセッサとを含む。 Another aspect relates to a device for assessing the severity of a burn of interest, which is reflected from one or more light sources configured to illuminate a first tissue site and a second tissue site. One or more image acquisition devices configured to receive the light, and a controller configured to control the one or more light sources and the one or more image acquisition devices to acquire a plurality of images of a second tissue site. And, the state of the burn in each region of the second tissue site is classified based on the plurality of images, and the approximate percentage of the total area of the body surface injured in the subject is calculated based on the classification of the burn state. Includes processors configured to.
別の一態様は、データを保存および更新するための方法に関し、該方法は、
複数のデータセンターを含み、データセンターのそれぞれが1以上の物理的コンピュータシステムを含み、物理的コンピュータシステムが1以上の仮想デスクトップインスタンスを実行するよう設定可能であり、仮想デスクトップインスタンスがそれぞれ1以上のアプリケーションを実行するよう設定可能なオペレーティングシステムを含むコンピュータ環境に関連付けられ、PESのユーザのコンピュータデバイスがネットワーク経由で仮想デスクトップインスタンスにアクセス可能であることを特徴とするプログラム実行サービス(PES)の制御下で、
PESとユーザの第1のコンピュータデバイスとの間の双方向接続を形成すること、
PES上で、前記第1のコンピュータデバイスからの、組織の状態に関するデータを含む動的ライブラリとの同期リクエストを受信すること、
前記動的ライブラリが1以上のコンピュータデバイスと同期されるか否かを示すファイルメタデータにアクセスすること、
前記ファイルメタデータに少なくとも一部基づいて、前記動的ライブラリが前記第1のコンピュータデバイスと同期されるか否かを決定すること、および
前記動的ライブラリが前記第1のコンピュータデバイスと同期されるという決定に応じて、前記双方向接続を利用して前期動的ライブラリを前記第1のコンピュータデバイスと同期させること
を含み、
同期された動的ライブラリが第1のコンピュータデバイス上にローカルに保存され、PESと第1のコンピュータデバイスとの双方向接続を用いずにアクセス可能であることを特徴とする。Another aspect relates to a method for storing and updating data.
Contains multiple data centers, each of which contains one or more physical computer systems, the physical computer system can be configured to run one or more virtual desktop instances, and one or more virtual desktop instances each. Under the control of the Program Execution Service (PES), which is associated with a computer environment that includes an operating system that can be configured to run applications, and is characterized by the ability of PES users' computer devices to access virtual desktop instances over the network. so,
Forming a bidirectional connection between the PES and the user's first computer device,
Receiving, on PES, a synchronization request from the first computer device with a dynamic library containing data about the state of the organization.
Accessing file metadata that indicates whether the dynamic library is synchronized with one or more computer devices.
Determining whether the dynamic library is synchronized with the first computer device, and the dynamic library being synchronized with the first computer device, based on at least a portion of the file metadata. In response to the decision, including synchronizing the early dynamic library with the first computer device using the bidirectional connection.
Synchronized dynamic libraries are stored locally on the first computer device and are accessible without the use of a bidirectional connection between the PES and the first computer device.
添付の図面を参照しつつ本発明の態様を説明するが、図面は説明のためのものであり、本発明の態様を限定するものではない。図中、同種の符号は同種の要素を示す。本願明細書は、少なくとも1枚のカラー図面を含む。所定の費用を支払うことによって、カラー図面を含む本願明細書のコピーを入手することができる。 Aspects of the present invention will be described with reference to the accompanying drawings, but the drawings are for illustration purposes only and are not intended to limit the embodiments of the present invention. In the figure, the same kind of reference numerals indicate the same kind of elements. The present specification includes at least one color drawing. A copy of the present specification, including color drawings, is available for a predetermined fee.
図63B−63Fは、異なる分類技術における、参照画像、グラウンドトゥルース画像、分類結果、およびエラー画像を示す。 FIGS. 63B-63F show reference images, ground truth images, classification results, and error images in different classification techniques.
序論
本明細書で開示される代替案は、対象の組織を特定、評価、および/または分類するためのシステムおよび技術に関する。代替案のいくつかは、組織を分類するための装置および方法に関し、該装置は光学イメージング要素を含む。本明細書に記載される代替案のいくつかは、実装されることによって本明細書で提供される組織分類法のいくつかを実行できる、反射モードマルチスペクトル時間分解型光学イメージングのソフトウェアおよびハードウェアに関する。 Introduction The alternatives disclosed herein relate to systems and techniques for identifying, assessing, and / or classifying organizations of interest. Some of the alternatives relate to devices and methods for classifying tissues, which include optical imaging elements. Some of the alternatives described herein can be implemented to implement some of the tissue classification methods provided herein, reflection mode multispectral time-resolved optical imaging software and hardware. Regarding.
組織を分類することのできる、非侵襲性医用イメージング技術の必要性が、長年にわたり認識されてきた。分類には、褥瘡性潰瘍、慢性の傷、熱傷、健康な組織、組織移植片、組織弁、血管病態生理、充血のような、創傷および組織の状態が含まれていてもよい。特に、創傷または組織の重症度を評価することができ、さらに受傷部の合計体表面積のパーセンテージ(%TBSA)を見積もることのできる技術が必要とされている。%TBSAは、受傷した組織部位の表面積を体表の総面積で割ったものと定義され、パーセンテージ(例えば40%)または1未満の小数(例えば0.4)で表されるが、分数(例えば2/5)で表されることもある。これらの表現形式はいずれも、本明細書における「%TBSA」を表し、数値的に等価であるか、または等価に近いもの(換算値、分子と分母の別出力等)である。 The need for non-invasive medical imaging techniques that can classify tissues has been recognized for many years. Classification may include wound and tissue conditions such as decubitus ulcers, chronic wounds, burns, healthy tissue, tissue grafts, tissue flaps, vascular pathology, hyperemia. In particular, there is a need for techniques that can assess the severity of wounds or tissues and also estimate the percentage of total body surface area of the injured area (% TBSA). % TBSA is defined as the surface area of the injured tissue site divided by the total area of the body surface, expressed as a percentage (eg 40%) or a decimal number less than 1 (eg 0.4), but a fraction (eg 0.4). It may be represented by 2/5). All of these expressions represent "% TBSA" in the present specification and are numerically equivalent or close to equivalent (converted value, separate output of numerator and denominator, etc.).
本明細書に記載される代替案によれば、自動化または半自動化された方法で対象を評価し、緊急の処置を要する受傷者を、さほど緊急性の高くない受傷者と区別して分類することが可能となり、治療勧告を提供することもできるかもしれない。表皮熱傷および浅達性中間層熱傷(例えばI度およびII度の熱傷)は、非外科的治療によって治癒する場合も多いが、深達性中間層熱傷および全層熱傷(例えばIII度およびIV度の熱傷)は、機能の喪失や美容の過度の悪化を防止するための外科的切除が必要となる。実際、初期の切除は、致死率の低下や入院期間の短縮に関わる。また、本明細書に記載される代替案のいくつかは、熱傷の管理に特に適しているが、これは、熱傷の専門家ではない医師であっても熱傷の重症度を迅速に評価し、緊急の外科的治療が必要であるという結論のようなトリアージにおける判定を、迅速かつ正確に下すことが可能となるからである。代替案のいくつかはまた、外科医が一連の切除を、注意深くより洗練された方法で行う(例えば、切開および/または壊死組織切除のための適切な境界を特定する)助けとなるかもしれない。本明細書に記載されるまた別の代替案は、治療上の決定、例えば蘇生のために投与すべき流体の量の決定等を医師が行えるようになる点で、特に適している。 According to the alternatives described herein, subjects may be evaluated in an automated or semi-automated manner to distinguish injured persons in need of urgent treatment from less urgent injured persons. It may be possible to provide treatment recommendations. Epidermal burns and superficial intermediate burns (eg I and II degrees burns) are often healed by non-surgical treatment, but deep intermediate and full-thickness burns (eg III and IV degrees) Burns) require surgical resection to prevent loss of function and excessive deterioration of beauty. In fact, early resection is associated with lower case fatality and shorter hospital stays. Also, some of the alternatives described herein are particularly well suited for the management of burns, which allows even non-specialists in burns to quickly assess the severity of burns. This is because it is possible to make quick and accurate judgments in triage such as the conclusion that urgent surgical treatment is required. Some of the alternatives may also help the surgeon perform a series of resections in a careful and more sophisticated manner (eg, identify appropriate boundaries for incision and / or necrotic tissue resection). Yet another alternative described herein is particularly suitable in that it allows the physician to make therapeutic decisions, such as determining the amount of fluid to be administered for resuscitation.
さらに、熱傷の分野においては、受傷後数日が経過するまで、組織の損傷の程度を評価することは困難であることが多い。この種の創傷において評価が遅れがちであることにより、熱傷治療において経験を積んだ外科医であっても、壊死組織または壊死しかかっている組織と、外科的介入または壊死組織除去を必要とせずに治癒する健康な組織との界面である境界に関して信頼性の高い決定を下すことは困難であり、治療のプロセスはさらに複雑になる。従来の熱傷の評価は、医師が主観的に行う皮膚の視診に委ねられており、その際、皮膚の感覚、硬さ、および色調がさらに変化することが考慮される。しかし、手術が必要であるか否かを決定するには、熱傷を、特に熱傷の深さを正確に評価することが必要となる。手術の必要性を決定することに加えて、熱傷を早期に検出して適切な治療を施すことは、感染症や敗血症を防ぐことになる。したがって、熱傷の分類および評価が不正確であれば、対象の回復が困難になることもありうる。さらに、治癒プロセスを促進し、対象の外傷を限定するために、外科的介入は最小限にとどめることが望ましい。 Moreover, in the field of burns, it is often difficult to assess the extent of tissue damage until a few days after the injury. Due to the tendency of delayed evaluation in this type of wound, even an experienced surgeon in the treatment of burns can heal with necrotic or near-necrotic tissue without the need for surgical intervention or removal of the necrotic tissue. Reliable decisions about the boundaries of the interface with healthy tissue are difficult to make, further complicating the treatment process. The assessment of conventional burns is left to the physician's subjective inspection of the skin, taking into account further changes in skin sensation, hardness, and color. However, to determine whether surgery is necessary, it is necessary to accurately assess the burn, especially the depth of the burn. In addition to determining the need for surgery, early detection of burns and appropriate treatment will prevent infections and sepsis. Therefore, inaccurate classification and assessment of burns can make recovery difficult for the subject. In addition, minimal surgical intervention is desirable to facilitate the healing process and limit the subject's trauma.
しかしながら、手術が望ましい場合においても、外科医が直面する最も困難なことの1つは、生きた健康な組織と、失活した壊死組織または壊死しかかっている組織を明確にすることである。経験を積んだ外科医であっても、切開深さの典型的な指標は、点状出血の存在である。しかし、この指標の使用にはいくつかの重大な欠点があり、手術中に生きた組織を不必要に除去してしまうことも、その1つである。さらに、熱傷の切除中の出血の制御は困難であり、多くの臨床的判断、正確さ、および経験が必要とされる。 However, even when surgery is desirable, one of the most difficult challenges surgeons face is to identify living, healthy tissue and inactivated or near-necrotic tissue. Even for experienced surgeons, a typical indicator of incision depth is the presence of petechiae. However, the use of this indicator has some serious drawbacks, including the unnecessary removal of living tissue during surgery. In addition, controlling bleeding during excision of a burn is difficult and requires a lot of clinical judgment, accuracy, and experience.
熱傷の手術において、組織の切除の過不足によって生命が脅かされる結果となることがある。熱傷の切除が不十分であると、失活した組織に移植片を載せることになり、移植片の生着が悪くなる。熱傷の切除が不十分であると、さらに、感染症のリスクの増加および/または治療が長引くことにつながる。一方、過度に切除してしまうと、過剰な失血や切除面からの出血につながることがあり、これもまた移植片の生着不良を招きうる。 In burn surgery, excess or deficiency of tissue excision can result in life-threatening consequences. Insufficient resection of the burn will result in the graft being placed on the inactivated tissue, resulting in poor survival of the graft. Inadequate resection of burns also leads to an increased risk of infection and / or prolonged treatment. On the other hand, excessive excision may lead to excessive blood loss and bleeding from the excised surface, which can also lead to poor engraftment of the implant.
より広範な組織表面にわたって熱傷の重症度を迅速かつ定量的に評価する方法および装置が必要とされているが、この必要性はいまだ満たされていない。本明細書に記載の方法および装置は、迅速かつ正確な熱傷の評価の提供に有用であり、熱傷の専門家が重症の熱傷に集中し、熱傷の専門家以外が重症度の低い熱傷患者のニーズに対応することが可能となる。同様に、その他の創傷および組織の状態についても迅速かつ定量的に評価する方法および装置が必要とされているが、この必要性もいまだ満たされていない。本明細書に記載の装置および方法は、褥瘡性潰瘍、慢性傷、亜急性離開創傷、外傷性創傷、裂傷、擦過傷、打撲傷、糖尿病性潰瘍、褥瘡、手術創、外傷、静脈性潰瘍等の迅速かつ正確な評価の提供、ならびに健康な組織と壊死組織または壊死しかかっている組織との境界、さらには組織の移植片または組織弁を適用すべき正確な部位、血管病態生理、および充血の位置の迅速かつ正確な評価の提供に有用である。 There is a need for methods and devices for the rapid and quantitative assessment of the severity of burns over a wider tissue surface, but this need has not yet been met. The methods and devices described herein are useful in providing a quick and accurate assessment of burns, with burn specialists focusing on severe burns and non-burn specialists on less severe burn patients. It will be possible to meet the needs. Similarly, methods and devices for the rapid and quantitative assessment of other wound and tissue conditions are needed, but this need has not yet been met. The devices and methods described herein include rapid decubitus ulcers, chronic wounds, subacute dehiscence wounds, traumatic wounds, lacerations, abrasions, bruising wounds, diabetic ulcers, pressure ulcers, surgical wounds, trauma, venous ulcers, etc. And to provide an accurate assessment, as well as the boundary between healthy tissue and necrotic or dying tissue, as well as the exact site to which a tissue implant or tissue valve should be applied, vascular pathology, and location of congestion. Useful for providing quick and accurate assessments.
本明細書を通じて、「創傷」についての言及がなされる。用語「創傷」は、皮膚が裂けたり、切れたり、皮膚に穴があいたり、疾患にかかったりしている開放創および閉鎖創、または外傷によって対象、例えば、ヒトまたは動物、特に哺乳類の皮膚に生じた打撲傷、表面的損傷、疾患、もしくは欠陥である開放創または閉鎖創を包含するものとして広義に解釈されるべきである。「創傷」はまた、組織が損傷している任意の部位を包含することが意図され、該部位においては、損傷または疾患の結果として液体が生じていてもいなくてもよい。このような創傷の例としては、急性の傷、慢性の傷、手術による切開およびその他の切断、亜急性離開創傷、外傷性創傷、弁および皮膚移植片、裂傷、擦過傷、打撲傷、熱傷、糖尿病性潰瘍、褥瘡、小孔、手術創、外傷、静脈性潰瘍等が挙げられるが、これらに限定はされない。 Throughout this specification, references are made to "wounds". The term "wound" refers to the skin of an open or closed wound, or trauma, where the skin is torn, cut, punctured, or diseased, such as the skin of a human or animal, especially a mammal. It should be broadly interpreted as including open or closed wounds that result from bruising, superficial damage, disease, or defects. A "wound" is also intended to include any site of tissue damage, where the fluid may or may not be produced as a result of the injury or disease. Examples of such wounds are acute wounds, chronic wounds, surgical incisions and other cuts, subacute dehiscence wounds, traumatic wounds, valve and skin implants, lacerations, abrasions, bruise, burns, diabetic. Examples include, but are not limited to, ulcers, decubitus, pits, surgical wounds, trauma, venous ulcers, etc.
例示のための図面を参照しつつ、様々な代替案について以下で説明する。開示された概念以外の多くの実施形態も可能であり、開示された実施形態によって様々な利点が得られることが理解されるであろう。あらゆる組み合わせおよび部分的な組み合わせが、本明細書の開示の範囲に含まれる。本明細書に記載される多くの代替案には類似した構成要素が含まれるが、これらの類似した構成要素は、本発明の別の態様において相互に入れ替えて使用できる。 Various alternatives will be described below with reference to the illustrations for illustration. It will be appreciated that many embodiments other than the disclosed concepts are possible and that the disclosed embodiments provide various benefits. All combinations and partial combinations are included within the scope of the disclosure herein. Although many of the alternatives described herein include similar components, these similar components can be used interchangeably in another aspect of the invention.
見出しは参照のため、また各項目を見出す助けとするために記載されている。これらの見出しは、そこに記載される概念の範囲を限定するものではない。本明細書の概念は、明細書全体を通じて適用可能である。 Headings are provided for reference and to help find each item. These headings do not limit the scope of the concepts described therein. The concepts herein are applicable throughout the specification.
熱傷の評価に関する代替案の概要
図1Aおよび1Bは、本発明の代替案の一例である。これらの図に示された装置は、熱傷を有する対象の全身を評価するのに特に適している。この装置は、差し迫った治療の必要条件に関する臨床的決定がなされる熱傷のトリアージにおいて特に有用である。この実施例において、プローブ100は、1以上の光源、ここでは4つの光源101、104、118、120と、画像取得装置102とを有する。光源101、104、118、120は、組織部位、ここでは組織103を照射するが、プローブ100に向かい合った対象の体表全体が照射されると有利である。別の代替案において、前記1以上の光源は、発光ダイオード(LED)、ハロゲンランプ、タングステンランプ、または他の照射技術であってもよい。1以上の光源は、白色光またはユーザの所望に応じて選択される1以上のスペクトルバンドにわたる光を放射してもよい。 Overview of Alternatives for Burn Assessment Figures 1A and 1B are examples of alternatives of the present invention. The devices shown in these figures are particularly suitable for assessing the whole body of a subject with burns. This device is particularly useful in burn triage where clinical decisions regarding imminent treatment requirements are made. In this embodiment, the
多くのLEDはバンド幅の狭い光(例えば、半値全幅が50nm以下)を生成するため、特定のLEDを選択することで特定のバンド幅の照射を行うことができる。一般に、そのような1以上のスペクトルバンドは、得ようとするデータの種類および/または臨床応用に最も適切な光の測定を考慮して選択される。前記1以上の光源は、光源に電力を供給し、かつ制御するための1以上のドライバに連結されてもよい。これらのドライバは、光源自体の一部であってもよく、独立していてもよい。選択可能なフィルター(例えばフィルターホイール)を備えた複数の狭帯域光源または広帯域光源を用いて、多数のスペクトルバンドの光を順次または同時に組織103に照射してもよい。選択されるスペクトルバンドの中心波長は、一般的に可視波長および近赤外波長の範囲にあり、例えば約400〜1100nm(400nm、500nm、600nm、700nm、800nm、900nm、1000nm、もしくは1100nm、あるいはこれらの値のいずれか未満、これらの値のいずれか以上、またはこれらの値のいずれか2つの間にある波長)である。 Since many LEDs generate light with a narrow bandwidth (for example, the full width at half maximum is 50 nm or less), it is possible to irradiate a specific bandwidth by selecting a specific LED. In general, such one or more spectral bands are selected in consideration of the type of data to be obtained and / or the light measurement most suitable for clinical application. The one or more light sources may be coupled to one or more drivers for powering and controlling the light sources. These drivers may be part of the light source itself or may be independent. Multiple narrowband or wideband light sources with selectable filters (eg, filter wheels) may be used to irradiate
いくつかの代替案において、光源は、実質的に一様な強度で組織部位を照射する。実質的に一様な強度は、例えば、光源101、104、118、120の一部として提供され、組織103に照射される光の強度をほぼ一様に分布させるような散光器を使用することによって達成できる。散光器には、望ましくない鏡面反射光を減じるというさらなる利点がある。高出力LEDの使用により、広いスペクトルの空間的に一様な照射パターンを用いることで、画像取得装置102によって得られる信号の信号対ノイズ比の顕著な改善が達成できる場合もある。市松模様照射のようなパターン化光システムを使用できる場合もある。そのような特定の代替案では、画像取得装置の視野は、光源に直接照射されないが照射領域に隣接している組織部位に向けられている。例えば、実質的に一様な強度の光が使用されるとき、画像取得装置102のような画像取得装置は、照射部位外からの光を読み取ってもよい。同様に、例えば市松模様照射が使用されるとき、取得装置102は市松模様の中で照射されていない部分からの光を読み取ってもよい。 In some alternatives, the light source illuminates the tissue site with a substantially uniform intensity. Substantially uniform intensities are provided, for example, as part of the
さらに、本明細書に記載されるいくつかの代替案において実質的に一様な強度の光が有効であるとしても、別の代替案においては一様でない光を使用してもよく、その場合、表面全体として光の強度差が最小化されるように1以上の光が配置される。このような差は、データの取得中に、またはバックエンドソフトウェアまたはハードウェアロジックにより補償される場合もある。例えば、トップハット変換またはその他の画像処理技術を用いて、一様でない背景照明を補償してもよい。 Moreover, while substantially uniform intensity of light is effective in some of the alternatives described herein, non-uniform light may be used in other alternatives, in which case. , One or more lights are arranged so that the difference in light intensity is minimized on the entire surface. Such differences may be compensated for during data acquisition or by back-end software or hardware logic. For example, top hat transformations or other image processing techniques may be used to compensate for non-uniform background illumination.
特定の代替案において、光は所望により偏光されてもよい。反射、選択吸収、屈折、散乱、および/または当技術分野で知られている任意の偏光方法を使用して偏光される場合もある。偏光には、例えばプリズム(ニコルプリズム等)、鏡、および/または反射面、フィルター(偏光フィルター等)、レンズ、および/または結晶を利用してもよい。光は、交差偏光されてもよく、共偏光されてもよい。いくつかの代替案において、前記1以上の光源からの光は、対象を照射する前に偏光される。例えば、偏光フィルターは、光源101、104、118、120の一部として提供されてもよい。いくつかの代替案では、組織から反射された光は、組織からの反射後に偏光される。例えば、偏光フィルターは取得装置102の一部として提供されてもよい。別の代替案において、光は、対象を照射する前と反射された後の両方で偏光される。例えば、偏光フィルターは、光源101、104、118、120の一部として、またさらにデータ収集装置102の一部として提供されてもよい。 In certain alternatives, the light may be polarized if desired. It may also be polarized using reflection, selective absorption, refraction, scattering, and / or any polarization method known in the art. For polarization, for example, prisms (such as Nicol prisms), mirrors and / or reflective surfaces, filters (such as polarizing filters), lenses, and / or crystals may be used. The light may be cross-polarized or co-polarized. In some alternatives, the light from the one or more light sources is polarized before illuminating the subject. For example, the polarizing filter may be provided as part of the
使用する偏光技術の種類は、照射角度、受光角度、使用する照射光源の種類、所望のデータの種類(例えば、散乱光、吸収光、反射光、透過光および/または蛍光の測定)、およびイメージングされる組織の深さ等の要因に依存しうる。例えば、組織への照射が行われると、光のいくらかは皮膚の最上層から直接反射されて表面グレアや表面反射となる。この反射光はしばしば、皮膚組織内に拡散する光(皮膚組織内で散乱(例えば反射)され、方向や極性が変化しうる)とは異なる極性を有している。取得装置に読み取られるグレアや反射の量を最少にしつつ、読み取られる後方散乱光の量を最大にするために、交差偏光技術を使用してもよい。例えば、偏光フィルターは、光源101、104、118、120の一部として、またさらにデータ収集装置102の一部として提供されてもよい。そのような構成において、光は、ターゲット103に照射される前に、まず偏光される。この光がターゲット103から反射された後、反射された光は、ターゲット103の表面から反射されて読み取られる入射光の量を最少にしつつ後方散乱光を測定できるように、第1の偏光方向とは直角の方向に偏光されてもよい。 The types of polarization techniques used include irradiation angle, light receiving angle, type of irradiation light source used, type of desired data (eg, measurement of scattered light, absorbed light, reflected light, transmitted light and / or fluorescence), and imaging. It may depend on factors such as the depth of the tissue to be formed. For example, when tissue is irradiated, some of the light is reflected directly from the top layer of the skin, resulting in surface glare and surface reflection. This reflected light often has a different polarity than the light that diffuses into the skin tissue (which can be scattered (eg, reflected) in the skin tissue and change direction or polarity). Cross-polarization techniques may be used to maximize the amount of backward scattered light read while minimizing the amount of glare or reflection read by the acquisition device. For example, the polarizing filter may be provided as part of the
いくつかの状況においては、特定の深さで組織のイメージングを行うことが望ましい場合もある。例えば、特定の深さで組織のイメージングを行うことは、特定の深さにある特定の創傷を評価し、がん性腫瘍の有無の確認および/もしくはその位置の特定、または腫瘍のステージもしくはがんの進行の判定、または本明細書に開示において言及した他の任意の治療用途に使用することができる。当技術分野で知られている特定の偏光技術を用いることにより、光学特性および/または平均自由行程に基づいて、特定の深さにある組織の選択的イメージングを行ってもよい。 In some situations, it may be desirable to image the tissue at a particular depth. For example, imaging tissue at a particular depth can assess a particular wound at a particular depth, confirm the presence or absence of a cancerous tumor and / or locate it, or stage or remove the tumor. It can be used to determine the progression of a tumor or for any other therapeutic use mentioned herein. By using certain polarization techniques known in the art, selective imaging of tissue at a particular depth may be performed based on optical properties and / or mean free path.
特定の代替案では、イメージングの深さを制御するための別の技術を使用してもよい。例えば、組織の光学的散乱特性は温度とともに変化し、組織に光が侵入する深さは、冷却により深くなる。そのため、イメージングされる組織部位の温度を制御することによって、イメージングの深さを制御してもよい。また、例えば、光源を様々な周波数でのパルス(または点滅)させることによって、イメージングの深さを制御してもよい。パルス光は非パルス光よりも深くまで皮膚に侵入し、パルス幅が長いほど、光は深く侵入する。別の代替案としては、光の強度を調整することによってイメージングの深さを変えることができ、高強度の光は、低強度の光よりも深くまで侵入する。 In certain alternatives, another technique may be used to control the depth of imaging. For example, the optical scattering properties of tissue change with temperature, and the depth of light penetration into tissue becomes deeper with cooling. Therefore, the depth of imaging may be controlled by controlling the temperature of the tissue portion to be imaged. The depth of imaging may also be controlled, for example, by pulsing (or blinking) the light source at various frequencies. Pulsed light penetrates the skin deeper than non-pulsed light, and the longer the pulse width, the deeper the light penetrates. Alternatively, the depth of imaging can be varied by adjusting the intensity of the light, with high intensity light penetrating deeper than low intensity light.
図1Aに示されているように、画像取得装置102は、組織103から反射された光を受光するように構成されている。画像取得装置120は、照射部位、照射部位のサブ部位、または非照射部位からの光を検出することができる。以下に記載するように、画像取得装置102の視野は、プローブ100に面している対象の体表全体を含んでもよい。プローブに面した対象の全体が照射され、プローブに面した対象の全体が画像取得装置の視野に入るとき、分類の早さと容易さが向上する。画像取得装置102は、照射される組織103の全体または一部のイメージングに適した光学素子を備えた2次元電荷結合素子(CCD)または相補型金属酸化物半導体(CMOS)であってもよい。 As shown in FIG. 1A, the
いくつかの代替案において、モジュール112は、プローブ100と連結されてもよいコントローラ、クラシファイヤ、およびプロセッサである。モジュール112はプローブ100を制御するが、これにはその物理的位置、光の強度、分解能、フィルターの色、もしくは本明細書に記載のカメラおよび/または光源の任意のパラメータ等のパラメータの設定が含まれてもよい。モジュール112は、プローブによって得られたデータの受信および処理を行うが、これについては後に説明する。 In some alternatives,
いくつかの代替案において、モジュール112は、さらにモジュール114と連結されてもよい。モジュール114は、ディスプレイおよびユーザインターフェース(UI)である。ディスプレイおよびUIは、ユーザに情報および/またはデータを示す。いくつかの代替案において、その情報および/またはデータには、ある組織状態の有無、該組織状態の重症度、および/または対象に関する付加的情報が含まれ、本明細書で言及される任意の情報が含まれる。モジュール114は、ユーザ入力を受信する。いくつかの代替案において、ユーザ入力には、年齢、体重、身長、性別、人種、皮膚の色もしくは外観、および/または血圧等の患者についての情報が含まれる。モジュール114はさらに、較正情報を含むユーザ入力、ユーザの選択する走査位置、ユーザの選択する組織状態、および/または診断のための付加的情報を受信することもあり、これには本明細書で言及される任意の情報が含まれる。特定の代替案では、上述のユーザ入力の一部または全部が、ユーザがモジュール114を用いて情報を入力することなく自動的にモジュール112に送信されてもよい。 In some alternatives,
図1Bに示されているように、いくつかの代替案において、プローブ100は、上方、下方、左方向、右方向、右斜め上方、左斜め上方、右斜め下方、左斜め下方、もしくはこれらの方向の任意の組み合わせのような、任意の方向またはそれらを組み合わせた方向に移動することができる。いくつかの代替案では、プローブは対象に対して垂直な方向に移動してもよく、この場合、プローブは対象に近づいたり対象から遠ざかったりする。プローブは、例えば、レールに連結されていてもよく、コントローラ112によって手動または自動で位置制御される関節アームに連結されていてもよく、あるいはこれらを組み合わせたものに連結されていてもよい。いくつかの代替案では、光源または画像取得装置のいずれかが固定されていてもよく、別の代替案では、それぞれが独立して移動できるよう構成されていてもよい。特定の代替案では、画像取得装置とモータとを連結して画像取得装置の動作を自動化してもよく、これによって対象の各セクションをカメラによりイメージングすることが可能となる。カメラもまた、レール、軌道、ガイド、および/または駆動可能なアームと連結できる。画像取得装置の移動中、光源は組織部位103の全体を照射してもよいが、走査プロセスの間、カメラによるイメージングが行われる所望の部位の組織のみを照射するよう、制御されてもよい。 As shown in FIG. 1B, in some alternatives, the
図1Aに示される代替案では、対象またはその一部(例えば対象の身体の全体または所望の位置の組織)の画像が得られるよう、対象は背景110を背にして直立の位置にある。いくつかの代替案では、背景110は支持構造物であり、画像を取得する間、対象はその上に水平または角度をつけた状態で横になったりもたれたりする。画像を取得する間に対象の体重を測定できるよう、体重計106および108が備えられていてもよい。さらに、体重計に加えて、あるいは体重計の代わりに、心拍数、体温、身体組成、肥満度指数、体型、血圧、およびこれ以外の生理的なデータを測定するための生体リーダが備えられていてもよい。 In the alternative shown in FIG. 1A, the subject is in an upright position against a
図2は、装置によって画像を取得するために、ディスプレイ/UI114上に提示されたUI200の例である。この代替案では、組織103が光源によって照射されている間、ユーザインターフェースは、画像取得装置の視野を表示する。特定の代替案では、ユーザは、対象202の全体が含まれるように、画像取得装置102の視野の位置を定めてもよい。ユーザは、ズーム要素208を使用して、対象が視野のほぼ全体を占めるよう、画像取得装置102を調整してもよい。いくつかの代替案では、ユーザは、対象202に関する他の情報を得るためにユーザインターフェースを使用してもよい。例えば、ユーザは、対象の身長を測定するために、位置204および位置206を選択してもよい。ユーザが、ユーザインターフェースを使用して、例えば画像取得ボタン210を押すこと等によって、対象の画像を取得するよう画像取得装置に指示を行う場合もある。 FIG. 2 is an example of a
画像を用いて組織の分類を行うために対象の画像を取得する際、光源(フィルターが付随する場合はそれらとともに)および画像取得装置は、対象の画像を複数取得できるよう制御される。取得される複数の画像は、反射光の異なるスペクトルバンドおよび/または異なる時間に関連付けられている。異なるスペクトルバンドで取得された画像は、組織部位を分類するためのMSI技術によって処理されてもよく、また時間的に異なる画像は、組織を分類するためのPPG技術によって処理されてもよい。いくつかの代替案では、両タイプの画像セットが得られ、得られた結果は、より正確な分類を行うためにマージされる。これについては後に説明する。 When acquiring a target image for tissue classification using the image, the light source (along with the filter, if any) and the image acquisition device are controlled so that a plurality of target images can be acquired. The captured images are associated with different spectral bands and / or different times of reflected light. Images acquired in different spectral bands may be processed by MSI techniques for classifying tissue sites, and images that differ in time may be processed by PPG techniques for classifying tissues. In some alternatives, both types of image sets are obtained and the results obtained are merged for more accurate classification. This will be described later.
熱傷患者の場合、画像の取得は、対象を前向き、後ろ向き、左向き、右向きといった様々な向きにして行われる。患者は、背景110を背にしてこれらの様々な向きで立ってもよく、背景110が水平な支持構造物であれば、患者は背景110の上に、様々な向きで横たわってもよい。取得された画像から得られるデータは、対象の皮膚の様々な領域が熱傷であるか否かを分類するために使用されるが、熱傷である領域の熱傷の程度の分類に使用されてもよい。 In the case of a burn patient, the image acquisition is performed with the subject in various orientations such as forward, backward, leftward, and rightward. The patient may stand in these various orientations against the
異なる向きで画像を取得した後、対象のそれぞれの向きについての画像データを、コントローラ/クラシファイヤ/プロセッサ112によって処理してもよい。背景110が皮膚組織と異なる特徴的な色であれば、コントローラ/クラシファイヤ/プロセッサは、対象を背景と区別し、取得した各画像における各画素を背景または対象のいずれかとして割り当ててもよい。別の代替案では、UIの使用によって、最初の画像(例えば、図2に示すような)上で対象の輪郭をトレース(例えば、タッチスクリーン上でスタイラスを用いて、あるいはマウスとカーソルとを用いて)することで、背景と対象とを区別してもよい。対象に関連する画像の画素が特定された後、MSIおよび/またはPPG技術を用いてこれらを解析し、対象の皮膚の領域を熱傷の状態によって分類してもよい。 After acquiring the images in different orientations, the image data for each orientation of the object may be processed by the controller / classifier /
このプロセスによるディスプレイ/UI114への出力例を図3に示す。この代替案において、出力された画像212は対象250の正面像を示しており、対象の正面から取得した複数の画像を使用して対象の正面の皮膚の異なる部分が分類されている。出力された画像212において、異なる分類結果は、例えば出力される画像の色を変えることで示されていてもよい。例えば、コントローラ/クラシファイヤ/プロセッサは、部位222をIII度の熱傷、部位224をI度の熱傷、部位226をII度の熱傷と特定している。また、プロセッサは、さらに例えば部位228を健康な組織と特定している。画像214は、対象250の背面像の例であり、部位230はIII度の熱傷、部位232はI度の熱傷、部位234はII度の熱傷として分類されている。さらに、これら以外の組織部位は、健康な組織と特定されている。画像216および画像218は、それぞれ対象250の左から見た像および右から見た像であり、部位236はIII度の熱傷、部位238はII度の熱傷、部位242はI度の熱傷として分類されている。さらに、これら以外の組織部位は、健康な組織と特定されている。 An example of output to the display /
画像212、214、216、218に示す分類データから、特定の代替案では熱傷の%TBSAが計算され、図3のボックス220内に見られるように、ユーザに対する結果の出力がUI上で行われる。熱傷の程度による分類が行われると、図3のボックス220内に見られるように、熱傷の1以上の分類についての%TBSAが出力される。熱傷組織を評価するために光学イメージング法が使用されてきたが、熱傷の%TBSAを見積もる装置はいまだ開発されていない。 From the classification data shown in
患者の全体または一部の画像データを使用して熱傷の%TBSAを得ることには、これまで解決できなかった複雑な要因に関わっている。ある代替案において、図3の4つの画像212、214、216、218を用いた簡単な計算をすることによって、トリアージの目的に十分な精度の見積もりが可能であることが見出された。この代替案では、すべての画像において熱傷と分類された全画素の合計である第1のカウントを求め、すべての画像における対象の全画素の合計である第2のカウントを求め、第1のカウントを第2のカウントで割ることによって、熱傷の%TBSAを求めることができる。例えば、III度の熱傷の%TBSAを計算するために、システムは、部位222、230、236の画素を計算し、その合計画素数を、対象250の全表面の総画素数で、すなわち画像212、214、216、218に見られる対象250の全画素を計数して合計することで得られる総画素数で割る。 Obtaining% TBSA of burns using whole or partial image data of a patient involves a complex factor that has previously been unsolvable. In one alternative, it was found that a simple calculation using the four
特定の代替案では、加算する面積を調整することによって、熱傷の%TBSAの見積もり精度を高めることができる。例えば、単に部位を合算するのではなく、モジュール112等のプロセッサは、画像を解析することによって2以上の画像に現れている領域を特定してもよい。このようにすれば、複数の画像に捕捉された領域が2回以上数えられることは避けられる。例えば、画像212の部位222と画像216の部位236はいずれも、対象250の胸部の1つの部分を捉えている。部位236と222の面積が合算されるなら、胸の一部が2回以上数えられることになる。特定の代替案では、プロセッサは部位222および236(または画像212および216の全体)を解析し、該胸部は1回だけ数える。いくつかの代替案では、部位の重複および/または類似性は、画像処理技術(境界検出や分割等)、参照マーカー、ならびに/または標準化された体型によって重複を見積もるための予測解析およびコンピュータ学習を使用して計算することができる。 In certain alternatives, the area to be added can be adjusted to improve the accuracy of the% TBSA of burns. For example, rather than simply summing the parts, a processor such as
特定の代替案では、対象のための3次元体型モデルが構築されてもよい。この人体モデルは、標準化された体型モデルならびに/または身長、体重、身体組成(例えば、体脂肪率)、肥満度指数、体の全体もしくは一部に対する特定の測定、または体の大きさまたは体型の任意の指標のようなパラメータから構築された体型モデルに基づくものであってもよい。これらのパラメータは、モジュール114のようなUIを用いてユーザが入力するパラメータであってもよく、プローブ100、生体リーダ106、および/もしくは生体リーダ108によって測定または計算されるパラメータ、またはモジュール112のようなプロセッサ/クラシファイヤによって受信または計算される任意の指標であってよい。3次元体型モデルが作成されると、分類された組織部位をこの3次元体型モデルの領域に投射することが可能となる。重複の場合、重複部位が複数回数えられることのないように、プロセッサは差異の解析を行う。熱傷の%TBSAは、1以上の分類(例えば、I度の熱傷、II度の熱傷、III度の熱傷、または健康な組織)に該当する面積を合算し、それを体表全体の面積で割ることによって概算することができる。 In certain alternatives, a 3D body model for the object may be constructed. This human body model is a standardized body shape model and / or height, weight, body composition (eg, body fat percentage), classification of obesity index, specific measurements of whole or part of the body, or body size or body shape. It may be based on a body shape model constructed from parameters such as arbitrary indicators. These parameters may be parameters entered by the user using a UI such as
いくつかの代替案において、モジュール112のようなプロセッサは、複数の2次元画像(例えば画像212、214、216、218)から1つの3次元モデルを再構成してもよい。いくつかの代替案において、このような再構成は、ユークリッドの再構成、線形層化、または複数の2次元画像を変換して3次元再構成を行う任意かつ既知の変換法等の投射を用いて行われてもよい。特定の代替案において、2次元画像から3次元再構成を行うための変換は、カメラの角度、カメラと対象との距離、対象から得られる測定値、および/または任意の参照測定値もしくは参照オブジェクト等の任意かつ既知のパラメータを考慮して行われてもよい。2次元画像を使用して3次元モデルが作成されると、熱傷の%TBSAは、1以上の分類(例えば、I度の熱傷、II度の熱傷、III度の熱傷、または健康な組織)に該当する面積の合算によって概算することができる。 In some alternatives, a processor such as
熱傷の%TBSAがプロセッサによって計算されると、その結果はユーザに向けて出力される。例えば、出力220は、熱傷の%TBSAが40%と計算され、III度の熱傷の%TBSAは12%と計算された例を示している。この情報は、モジュール114のようなディスプレイを使用して、ユーザに表示されてもよい。モジュール114のようなディスプレイは、さらに、死亡率の推定値や、対象の治療に関連するその他の情報等の別の情報を表示してもよい。死亡率の推定値の例では、図6のチャートに示すようなデータがプロセッサ112に保存され、%TBSAおよび/または対象の年齢(ユーザに既知、あるいはユーザが推定してシステムに入力)に基づいて死亡率を推定するために使用されてもよい。 When the% TBSA of the burn is calculated by the processor, the result is output to the user. For example,
図4は、本明細書に記載のいくつかの装置が熱傷の%TBSAをどのように計算するかを示す別の例である。この図は、複数の画像が合算されて熱傷の%TBSAが計算されるモザイク技術を示す。場合によって、モザイクは、プローブ100のようなプローブが各画像を得るために自動的に位置決めされるような自動プログラムを用いて作成されてもよい。この自動化は、駆動可能なアーム、モータ、レール、またはプローブを移動させるための任意の方法もしくは装置を利用するものであってよい。その結果、プローブは、図4に示す格子パターンのような特定のパターンとなるようなイメージングを行う場合もある。別法として、プローブ100のようなプローブの位置決めをユーザが行って、モザイクを作成してもよい。次いで、ユーザは、対象の任意の数の部位について、任意の数の画像を得るべくイメージングを行うことができる。 FIG. 4 is another example of how some of the devices described herein calculate the% TBSA for burns. This figure shows a mosaic technique in which multiple images are combined to calculate the% TBSA of burns. In some cases, the mosaic may be created using an automated program such as
モザイク技術の代替法を使用する任意の場合において、モザイク部分201は頭部の表面の1つの画像であってもよい。モザイク部分207は、手の画像としての独立した画像であってもよく、体幹の一部をさらに捉えたものであってもよい。他のモザイク部分を形成するためにイメージングされる、対象またはその一部(別の表面の画像を含む)のさらなる画像の数は、何枚であってもよい。これらの画像は、重複していてもよく、はっきり分かれていてもよい。画像を重複させ、かつ/または同じ特徴、位置、場所、もしくは組織部位について複数の(例えば、異なる視点からの)画像を得て、オーバーレイ技術またはマスキング技術を適用することによって、分解能の向上および/または所望の組織の3次元レンダリングを達成することができる。 In any case using an alternative method of mosaic technique, the
このような様々な画像を組み合わせたりつなぎ合わせたりして、全身の表面積を計算することもできる。画像を組み合わせる前に、画像処理技術を使用して背景を除去し、対象の体のみを残す場合もある。画像の組み合わせを容易にするために、境界検出技術を使用して体の各部の輪郭を得てもよい。体の一部分を捉えた重複画像が存在する場合、組織の相互相関を実行することで、各部分を正しくまとめ、つなぎ合わせ、組み合わせる方法を決定できる。 It is also possible to calculate the surface area of the whole body by combining and stitching such various images. Before combining the images, image processing techniques may be used to remove the background, leaving only the target body. Boundary detection techniques may be used to outline each part of the body to facilitate the combination of images. If there are duplicate images that capture parts of the body, then tissue cross-correlation can be performed to determine how to properly group, stitch, and combine the parts.
場合によって、様々な画像を組み合わせて、1つの組織分類に該当する全表面積を得てもよい。例えば、モザイク部分211および212は、熱傷のような組織状態にある表面積を概算するために使用される画像であるかもしれない。ここでも、組み立てられる個々の画像は、はっきり分かれていても、重複していてもよく、また組織の同じ部位または場所を異なる視点からイメージングしたものであってもよい。画像を組み合わせるプロセスは、当該組織状態として分類された組織の画像を複数取得し、当該分類部位に属する表面積を概算するためにそれらを組み合わせることを含む。 In some cases, various images may be combined to obtain the total surface area corresponding to one tissue classification. For example,
いくつかの代替案では、イメージングされていない部位を補うための補間技術を用いて面積の見積もりを行う必要があるかもしれない。例えば、対象のいくつかの部分が、イメージング時に偶然に除外されたり、熱傷でないこと、もしくは見積もりを行おうとしている状態とは別の状態にあることが明白であるという理由から除外されたりする場合がある。場合によって、対象の特定の領域が、場所的な理由(例えば、対象の脇の下にある)または対象の物理的制限(例えば、対象の傷が重く移動ができない)によって、イメージング困難なこともある。そのような補間では、イメージングされない部位の見積もりを行うために、体の対称性を利用したり、1つの部位と別の部位との間に直線を射影したりしてもよい。例えば、ふくらはぎの画像205が欠失していた場合、大腿の画像213に示されている脚の境界から、脚の下の画像203および/または215に示されている足首および足部の境界へと、直線射影できるであろう。この射影により、脚部のおよその形状を得ることができ、イメージングされていない脚表面の見積もりが可能となる。 In some alternatives, it may be necessary to estimate the area using interpolation techniques to supplement the non-imaged areas. For example, some parts of the subject may be excluded by accident during imaging, or because they are not burned or are clearly in a different state than the one you are trying to estimate. There is. In some cases, a particular area of the subject may be difficult to image due to locational reasons (eg, under the subject's armpits) or physical limitations of the subject (eg, the subject's scars are too heavy to move). In such interpolation, the symmetry of the body may be utilized or a straight line may be projected between one part and another in order to estimate the part that is not imaged. For example, if
対象の様々な部分の表面積を見積もるために使用できる方法は、他にも存在する。例えば、図5に、9の法則およびLund−Browderチャートを示す。例えば、500で示す図は、9の法則の説明であり、頭頸部および腕は、それぞれ体表全体の面積の9%と見積もられている。例えば、腕501の合計表面積は、9の法則の下では、図の人物の体表全体の面積の9%であると見積もることができる。9の法則の下では、片脚ならびに体幹の前面および後面の面積はそれぞれ、体表全体の面積の18%であると見積もられる。例えば、脚502の合計表面積は、9の法則の下では、図の人物の体表全体の面積の18%であると見積もることができる。 There are other methods that can be used to estimate the surface area of different parts of the subject. For example, FIG. 5 shows the Law of 9 and the Lund-Browder chart. For example, the figure shown by 500 is an explanation of the law of 9, and the head and neck and arms are each estimated to be 9% of the total area of the body surface. For example, the total surface area of the
503で示す図は、体の様々な部分の表面積を概算する別の方法の存在を示す例である。Lund−Browderチャート504は、患者の年齢によって表面積を見積もる1つ方法を示す。このチャートは、0歳、1歳、5歳、10歳、および15歳の子どもの頭部の1/2、大腿部の1/2、および下肢の1/2の体表面積の相対パーセンテージの概算値を示す。 The figure shown at 503 is an example showing the existence of another method of estimating the surface area of various parts of the body. The Lund-
9の法則およびLund−Browderチャートはいずれも、体表全体の面積(TBSA)を計算するために使用できる見積もりの例に過ぎない。これらの見積もりもまた、体の一部がイメージングされない場合に使用される前述の技術を補うものとして使用できる。例えば、イメージングされない脚の表面積は、TBSAの18%を占めると仮定することで把握できる。 Both
患者によっては、9の法則、Lund−Browder、および他の見積もり方法が当てはまらないこともある。例えば、太り過ぎの患者や、体の特定の部位に過剰な組織を有する患者は、相対表面積が異なることもある。したがって、本明細書に記載されるイメージング技術は、従来行われてきたこれらのチャートのみに頼った方法と比べて、熱傷の%TBSAをより正確に計算できるものである。さらに、本明細書に記載される%TBSA計算のいずれにおいても、モジュール114に入力された任意のデータ、またはモジュール112に自動的に送信された任意のデータを利用することができる。例えば、対象の年齢は、Lund−Browderチャートを用いた体表面積の相対パーセンテージの概算において、有効に使用することができる。代替例では、性別、体重、身長、体格、体型、皮膚の色、人種、イメージングされた体の向き、および/または本開示において言及される任意の関連データを含む他のデータが、%TBSAを計算するために入力または取得されてもよい。 For some patients, the Law of 9, Lund-Browder, and other estimation methods may not apply. For example, patients who are overweight or who have excess tissue in certain parts of the body may have different relative surface areas. Therefore, the imaging techniques described herein can more accurately calculate the% TBSA of burns as compared to traditional methods that rely solely on these charts. Further, in any of the% TBSA calculations described herein, any data input to
組織分類の%TBSAを知ることは、適切な治療の決定にとって重要でありうる。例えば、熱傷では、熱傷の%TBSAが増加するほど死亡率は高まる。図6は、米国熱傷協会がまとめたものであり、年齢群と熱傷の大きさによる死亡率を示している。患者の熱傷の%TBSAが増加するにつれ、概して死亡率は上昇することがわかる。したがって、緊急治療を施すためには、%TBSAの高い患者をできる限り迅速に特定することが重要でありうる。さらに、熱傷の%TBSAが高まるにつれて、死亡率の勾配が急になる。したがって、熱傷の%TBSAが高い場合、死に至る危険性が特に大きい対象を他から識別する際に、従来の方法よりも精度が高いことは重要である。大規模災害のような緊急事態で資源に限りがある場合、このような識別を行う能力は、特に重要であろう。したがって、本発明による代替案の、熱傷の%TBSAを計算する能力は、長きにわたる要望を満たすものである。 Knowing the% TBSA of histological classification can be important for making appropriate treatment decisions. For example, in burns, the higher the% TBSA of the burn, the higher the mortality rate. Figure 6 is compiled by the American Burn Association and shows mortality by age group and burn size. It can be seen that as the% TBSA of a patient's burn increases, the mortality rate generally increases. Therefore, it may be important to identify patients with high% TBSA as quickly as possible in order to provide emergency treatment. Moreover, as the% TBSA of burns increases, the mortality gradient becomes steeper. Therefore, when the% TBSA of burns is high, it is important that the accuracy is higher than that of the conventional method in identifying an object having a particularly high risk of death from others. The ability to make such an identification will be especially important in emergencies such as large-scale disasters where resources are limited. Therefore, the ability of the alternative according to the invention to calculate the% TBSA of burns meets long-standing demands.
例えば、所望される治療決定の1つとして、蘇生のための流体量の決定が挙げられる。流体の喪失は、大きな熱傷を負った人々が直面する最も重大な問題の1つである。したがって、熱傷患者に投与される流体の量の適切な管理は、回復のための重要な側面と言える。多くの場合、流体が少な過ぎると、熱傷浮腫、熱傷ショック、脱水、死、および/または他の合併症につながりうる。流体が多過ぎても、感染症、浮腫、急性呼吸窮迫症候群、腹部コンパートメント症候群、水分過剰、および/または死といった合併症のリスクが増す。蘇生に必要な流体の量は、熱傷の%TBSAに関連する。例えば、軽い熱傷であれば、一般に、経口の水分補給によって蘇生することができる。しかしながら、熱傷の%TBSAが15〜20%(例えば、15%、16%、17%、18%、19%、もしくは20%、またはこれらのパーセンテージの間にある任意のパーセンテージ)に近づくと、対象における体液変動が大きくなり、熱傷浮腫や熱傷ショックを避けるためには、流体の管理がより重要になる。熱傷の%TBSAが約20%を超えると(例えば、20%、30%、40%、50%、60%、70%、80%、90%、またはこれらのパーセンテージの間にある任意のパーセンテージ)、血管内蘇生輸液を開始することが推奨されている。 For example, one of the desired treatment decisions is to determine the amount of fluid for resuscitation. Fluid loss is one of the most serious problems faced by people with severe burns. Therefore, proper management of the amount of fluid administered to burn patients is an important aspect for recovery. In many cases, too little fluid can lead to burn edema, burn shock, dehydration, death, and / or other complications. Too much fluid also increases the risk of complications such as infection, edema, acute respiratory distress syndrome, abdominal compartment syndrome, overhydration, and / or death. The amount of fluid required for resuscitation is associated with% TBSA of burns. For example, minor burns can generally be resuscitated by oral hydration. However, as the% TBSA of burns approaches 15-20% (eg, 15%, 16%, 17%, 18%, 19%, or 20%, or any percentage between these percentages), the subject Fluid management becomes more important in order to avoid burn edema and burn shock. When% TBSA of burns exceeds about 20% (eg, 20%, 30%, 40%, 50%, 60%, 70%, 80%, 90%, or any percentage between these percentages) , It is recommended to start intravascular resuscitation infusion.
特定の代替案では、計算された熱傷の%TBSAをプロセッサ112のようなプロセッサが用いることによって、患者に与えるべき流体の量が決定されてもよい。例えば、パークランドの公式を用いることで、熱傷の%TBSAに基づいて、治療の最初の24時間に投与する蘇生輸液量を概算してもよい。パークランドの公式は、V=4×m×(A×100)で表され、Vはミリリットルで表した輸液量であり、mはキログラムで表した対象の質量であり、Aは小数で表した%TBSA(例えば、体表の50%に熱傷を負った対象であれば、0.5)である。計算された量の半量が最初の8時間で投与され、残りの半量は、その後16時間かけて投与される。流体の投与計画は、システムのユーザに向けて、例えば図3の出力220の一部のように、UI上に出力されてもよい。例えば、体重100kgの対象が体表の50%に熱傷を負っている場合、システムは、パークランドの公式に従って、次の8時間は1250mL/時、その後16時間は625mL/時というような24時間の流体蘇生計画を出力してもよい。 In certain alternatives, the calculated% TBSA of burns may be used by a processor such as
パークランドの公式は、特定の患者のニーズを満たすよう調整することもできる。例えば、高齢の患者に投与される流体の量は、水分過剰による浮腫や合併症が生じやすいため、減じる必要がある。一方、幼児のような若年の患者は、流体量が過剰であっても合併症のリスクは低い。投与する流体の量の調整には、対象の状態(例えば、熱傷の重症度)、脈拍、血圧、呼吸数および他の生理学的パラメータのような他の要因を使用することもできる。特定の代替案では、プロセッサ112のようなプロセッサは、投与する流体の量を調整するためにこれらの要因を使用する。これらの要因は、ユーザインターフェース(ディスプレイ/UI114等)を通じて入力されても、プローブ100または生体リーダ106および/もしくは108によって測定されても、かつ/または別の方法でプロセッサ112によって入力、計算、概算、もしくは取得されてもよい。これらの要因は、さらに当該患者の病歴から得られる別のデータ、または他の患者から得られるデータを含んでいてもよい。プロセッサはさらに、計算において考慮する要因として別のデータ(当該患者の別のデータ、較正情報、および他の患者から得られるデータ)を得るために、動的ライブラリから情報を取得してもよい。 Parkland's formula can also be tailored to meet the needs of a particular patient. For example, the amount of fluid administered to elderly patients needs to be reduced as it is prone to edema and complications due to overhydration. On the other hand, younger patients, such as infants, have a lower risk of complications, even with excessive fluid levels. Other factors such as the condition of the subject (eg, severity of burns), pulse, blood pressure, respiratory rate and other physiological parameters can also be used to adjust the amount of fluid administered. In certain alternatives, processors such as
いくつかの代替案において、考慮してもよい別の要因は、患者の総血液量および/または患者の総血液量における変化である。血液量が少ないことは、患者が蘇生のためにより多くの流体を必要としていることを示す。血液量を測定および/または概算する様々な方法が存在する。例えば、患者の血液量が多ければ、患者の組織に吸収される光は多い。このような効果は、赤色光または近赤外光領域(例えば、840nm、850nm、860nm、870nm、もしくは880nm、またはこれらの値のいずれか2つの間にある波長を含む、840nm〜880nmの範囲またはこの近傍)において容易に測定することができるが、これは、このような波長の光が組織を容易に通過することによる。本明細書に開示する代替案は、反射する赤色光または近赤外光の量の変化を経時的に測定することによって総血液量および/または総血液量における変化を概算するために、使用することができる。例えば、いくつかの代替案において、反射する赤色光または近赤外光の量の経時的変化は、心臓の鼓動波形の収縮期および拡張期における位相シフトを測定するために使用することができる。これらのシフトは、収縮期圧および拡張期圧を知るために使用することができ、状況によっては、右心室および左心室の脈圧を見積もるために使用することができる。外部カフもまた、収縮期圧および拡張期圧を測定するために、追加的または代替的に使用することができる。次いで、この脈圧を使用して、左心室および右心室からの1回拍出量(1回の鼓動で心室から送り出される血液の量)を見積もることができる。この1回拍出量を用いれば、これと心拍数(心拍数もまた、本明細書で開示される代替案によって測定できる)とを掛け合わせることによって、心室からの心拍出量を計算することができる。この心拍出量は、血液量および/または血液量の変化を見積もるために使用されてもよい。 In some alternatives, another factor that may be considered is a change in the patient's total blood volume and / or the patient's total blood volume. Low blood volume indicates that the patient needs more fluid for resuscitation. There are various methods for measuring and / or estimating blood volume. For example, if the patient's blood volume is high, more light is absorbed by the patient's tissues. Such effects may range from 840 nm to 880 nm or include wavelengths in the red or near infrared light region (eg, 840 nm, 850 nm, 860 nm, 870 nm, or 880 nm, or between any two of these values. It can be easily measured in this vicinity) because light of such wavelengths easily passes through the tissue. The alternatives disclosed herein are used to estimate changes in total blood volume and / or total blood volume by measuring changes in the amount of reflected red or near-infrared light over time. be able to. For example, in some alternatives, changes over time in the amount of reflected red or near-infrared light can be used to measure phase shifts in systolic and diastolic phases of the heartbeat waveform. These shifts can be used to determine systolic and diastolic pressures and, in some circumstances, to estimate pulse pressure in the right and left ventricles. External cuffs can also be used additionally or alternative to measure systolic and diastolic pressures. This pulse pressure can then be used to estimate the stroke volume from the left and right ventricles (the amount of blood pumped from the ventricle in a single heartbeat). This stroke volume is used to calculate cardiac output from the ventricles by multiplying it by heart rate (heart rate can also be measured by alternatives disclosed herein). be able to. This cardiac output may be used to estimate blood volume and / or changes in blood volume.
当技術分野において既知の他の技術、例えば、PPG、カテーテル、プレチスモグラフィ、他のイメージング技術、および/または静脈の伸展製を測定する別の技術等を使用して、血液量および/または血液量の変化を測定または概算することができる。例えば、酸素飽和度および脈拍を測定するために、患者がパルスオキシメータを装着してもよい。しかしながら、パルスオキシメータは、血管床(指、耳、または前額部)の血液量および/または血液量の変化を測定するPPG装置としての役割をも果たすものであってよい。 Blood volume and / or blood volume using other techniques known in the art, such as PPG, catheters, plethysmography, other imaging techniques, and / or other techniques for measuring venous extension. Changes can be measured or estimated. For example, the patient may wear a pulse oximeter to measure oxygen saturation and pulse. However, the pulse oximeter may also serve as a PPG device for measuring blood volume and / or changes in blood volume in the vascular bed (finger, ear, or forehead).
いくつかの代替案において、総血液量および/または総血液量の変化のデータは、UI114等を使用するユーザによって、または別の手段によってデータパス(例えば、ワイヤを用いた接続またはワイヤレス送信等)に沿ってプロセッサに入力される。総血液量および/または総血液量の変化は、患者に投与される流体の量を計算するために、単独で、または%TBSAもしくは本開示で言及される別の任意の要因と組み合わせて使用されてもよい。これらの追加的な要因および変更は、表示される流体蘇生計画に自動的に組み入れることができる。 In some alternatives, data on total blood volume and / or changes in total blood volume is data path (eg, wire connection or wireless transmission, etc.) by the user using UI114 or the like, or by other means. Is input to the processor along with. Total blood volume and / or changes in total blood volume are used alone or in combination with% TBSA or any other factor referred to in this disclosure to calculate the amount of fluid administered to a patient. You may. These additional factors and changes can be automatically incorporated into the displayed fluid resuscitation plan.
さらに、他の代替案では、%TBSAに基づいて熱傷患者に投与される流体の量を計算する別の方法が使用される。別の方法としては、ブルックの公式、ブルックの改変公式、パークランドの公式、および当技術分野で既知である別の任意の相関が挙げられる。代替案では、標準公式が一切使用されなくてもよい。例えば、投与される流体の量は、機械学習を通じて計算することもでき、患者の病歴または他の患者の病歴を含む病歴データから別の方法で算定することもできる。 In addition, another alternative uses another method of calculating the amount of fluid administered to a burn patient based on% TBSA. Alternative methods include Brook's formula, Brook's modified formula, Parkland's formula, and any other correlation known in the art. The alternative does not require any standard formulas to be used. For example, the amount of fluid administered can be calculated through machine learning or by another method from medical history data, including the patient's medical history or the medical history of other patients.
次いで、組織を照射し、画像を取得し、画像データを解析するために使用される特定の装置および方法に目を向ければ、熱傷および他の傷を評価するための装置および方法を開発するための多くの試みがなされてきたことが理解されるであろう。いくつかの方法には、サーモグラフィー、核磁気共鳴、分光法、レーザードップラーフローメトリー、および超音波が含まれる。さらに、組織の微小血管床における血液量の変化を検出するために、プレチスモグラフィー(PPG)が使用されている。単に容積測定のみを行うPPGを単独で使用するだけでは、組織の完全な分類はなし得ない場合もある。また、マルチスペクトルイメージング(MSI)は皮膚組織における差異を識別するために使用されてきたが、この技術では組織の完全な分類はなし得ない。現在のMSI技術では、肌タイプ、体の異なる領域の皮膚の違い、および考えられる傷の前処理による差異を埋め合わせることは、困難である場合が多い。MSI単独では、皮膚の状態に関する全般的な評価をなし得ない可能性があるが、これは、MSI技術が、皮膚の外観および皮膚の構成のみを測定し、組織に対する栄養や酸素の供給可能性といった、皮膚の分類にとって重要な動的変数を測定しないことによる。 Then, looking at the specific devices and methods used to irradiate the tissue, acquire images, and analyze the image data, to develop devices and methods for assessing burns and other wounds. It will be understood that many attempts have been made. Some methods include thermography, nuclear magnetic resonance, spectroscopy, laser Doppler flow cytometry, and ultrasound. In addition, plethysmography (PPG) has been used to detect changes in blood volume in the microvascular bed of tissue. In some cases, the complete classification of tissue cannot be achieved by using PPG alone, which only measures volume. Also, although multispectral imaging (MSI) has been used to identify differences in skin tissue, this technique does not allow complete classification of tissue. With current MSI techniques, it is often difficult to make up for differences in skin type, skin differences in different areas of the body, and possible wound pretreatment. MSI alone may not be able to provide a general assessment of skin condition, which is because MSI technology only measures skin appearance and skin composition and may provide nutrients and oxygen to tissues. By not measuring dynamic variables that are important for skin classification.
本明細書に記載されるいくつかの代替案では、皮膚の分類の迅速性、信頼性、および正確性を改善するために、MSIとPPGとが組み合わされる。本明細書に記載される該代替案では、例えば、皮膚の構造および機能(外傷を受けた皮膚とは対照的な正常な状態であるように正しく機能するか)をより正確に評価するために、画像データを使用して、血液、水、コラーゲン、メラニン、および他のマーカーの寄与を測定することができる。さらに、本明細書に記載される代替案では、皮膚から反射される光の変化を経時的に検出することで、重要な生理学的情報を取得する。これによって、臨床医が組織の生存率および機能、例えば組織のある部位における血液灌流および酸素化等を迅速に評価することが可能となる。 In some of the alternatives described herein, MSI and PPG are combined to improve the speed, reliability, and accuracy of skin classification. The alternatives described herein, for example, to more accurately assess the structure and function of the skin (whether it functions correctly to be in a normal state as opposed to traumatized skin). , Image data can be used to measure the contribution of blood, water, collagen, melanin, and other markers. In addition, the alternatives described herein obtain important physiological information by detecting changes in light reflected from the skin over time. This allows clinicians to rapidly assess tissue viability and function, such as blood perfusion and oxygenation at certain sites of tissue.
図7に、いくつかの代替案においてプローブ100、コントローラ/クラシファイヤ/プロセッサ112およびディスプレイ/UI114として使用することができる(必須ではない)システムを示す。図7のシステムについては後に説明するが、MSI技術とPPG技術とが組み合わされていることにより、これまでのシステムと比べて、より小さい面積の組織部位をより高い精度で解析して分類するために使用することができ、必ずしも上記した全身解析のシステムおよび方法と関連付けて使用する必要はない。 FIG. 7 shows a system that can (but is not required) be used as
図7のシステムにおいて、プローブ408は、1以上の光源と1以上の高分解能マルチスペクトルカメラを含む。このカメラは、高精度な組織分類を実行するために、時間的、空間的なスペクトル分解能を維持しつつ、ターゲットである組織部位409を複数の画像で記録する。プローブ408は、複数のカメラ、イメージング装置、プリズム、ビームスプリッタ、光検知器、フィルター、およびマルチスペクトルバンド光源を含んでもよい。このカメラは、当該組織部位について、異なる波長の光の散乱、吸収、反射、透過、および/または蛍光を経時的に測定することができる。このシステムは、また、ディスプレイ/UI414と、プローブ408の動作を制御し、ユーザからの入力を受信し、ディスプレイの出力を制御し、画像の画素の解析および分類を実行するコントローラ/クラシファイヤ/プロセッサ412とを含む。 In the system of FIG. 7,
データセット410は、プローブ408の出力例であり、イメージングされた空間的位置における複数の異なる時間、複数の異なる波長の反射光に関するデータを含む。イメージングされた空間的位置における複数の異なる波長の光に関するデータの例を、データサブセット404に示す。データサブセット404は、当該組織部位の複数の画像を含んでいてもよく、それぞれの画像は、選択された複数の異なる周波数帯において、該組織部位から反射された光を測定したものである。データサブセット404の複数の画像は、同時に取得されたものであってもよく、本質的に同時に取得されたものであってもよい。「本質的に同時に」とは、時間差が1秒以内であることを意味する。イメージングされた空間的位置における、複数の異なる時間の組織部位からの反射光に関するデータの例を、データサブセット404に示す。データサブセット402は、1秒より長い時間、一般的には2秒より長い時間をかけて、複数の異なる時間にイメージングされた複数の画像を含む。データサブセット402の複数の画像は、選択された1つの周波数帯で取得されたものであってよい。場合によって、データサブセット404の複数の画像は、1秒より長い時間、一般的には2秒より長い時間をかけてイメージングされてもよく、データサブセット402の複数の画像は、複数の周波数帯でイメージングされてもよい。しかしながら、サブセット404およびサブセット402を含む、組み合わされたデータセットは、複数の異なる時間および複数の異なる周波数帯のいずれにも対応する画像を含む。
データサブセット404の画像を収集するために、いくつかの代替案では、前記1以上のカメラは、パスバンドの異なる複数のフィルターを備えたフィルターホイールに連結される。該1以上のカメラが対象の組織部位の画像を取得する際、フィルターホイールが回転する。フィルターホイールの回転に応じて、フィルターの位置に同期した画像を取得することによって、該1以上のカメラは、異なるスペクトルバンドで対象を記録することができる。このようにして、カメラは、組織部位の各画素で反射された、複数の異なる周波数帯の光を受光する。実際に、多くの場合、本明細書に記載される装置は、これらのフィルターの使用によって、ヒトの目では識別できないスペクトルの光を解析できるようになる。多くの場合、これらの様々なスペクトルにおいて反射および/または吸収される光の量により、対象の組織または特定の組織部位の化学的組成および物理的組成についての手がかりが得られる。フィルターを使用して得られたデータが3次元データアレイを形成する場合もあり、このデータアレイの1つの次元はスペクトルであり、2つは空間的次元である。2つの空間的次元における各画素は、取得された各スペクトルバンドにおける反射光の強度によって特定されるスペクトルシグネチャーによって特徴付けることができる。様々な波長の光の強度は、ターゲットの組成についての情報を与える。これは、組成が異なれば、様々な周波数の光の散乱、吸収、反射、透過、および/または蛍光発光が異なることによる。これらの様々な波長の光を測定することによって、プローブ408は、画像の各画素に対応する個々の空間的位置における組成情報を捕捉する。 To collect images of the data subset 404, in some alternatives, the one or more cameras are coupled to a filter wheel with multiple filters with different passbands. When the one or more cameras acquire an image of a tissue portion of interest, the filter wheel rotates. By acquiring an image synchronized with the position of the filter in response to the rotation of the filter wheel, the one or more cameras can record objects in different spectral bands. In this way, the camera receives a plurality of different frequency bands of light reflected by each pixel of the tissue site. In fact, in many cases, the devices described herein will be able to analyze light in a spectrum that is indistinguishable to the human eye by using these filters. Often, the amount of light reflected and / or absorbed in these various spectra provides clues about the chemical and physical composition of the tissue of interest or a particular tissue site. The data obtained using the filter may form a three-dimensional data array, one dimension of which is the spectrum and two of which are the spatial dimensions. Each pixel in the two spatial dimensions can be characterized by a spectral signature identified by the intensity of reflected light in each acquired spectral band. The intensity of light of various wavelengths gives information about the composition of the target. This is because different compositions result in different scattering, absorption, reflection, transmission, and / or fluorescence emission of light at different frequencies. By measuring these various wavelengths of light, the
データサブセット404とするために複数のスペクトルバンドで画像を取得する特定の代替案において、前記1以上のカメラは、ハイパースペクトルライン走査イメージング装置を含む。ハイパースペクトルラインスキャナは、フィルターホイールの各フィルターの分離したバンドの代わりに連続したスペクトルバンドを有する。このハイパースペクトルラインスキャナのフィルターは、CMOS画像センサーと一体化されていてもよい。場合により、該フィルターは、モノリシックに一体化された光学干渉フィルターであり、複数のフィルターが階段状に配置されている。場合により、該フィルターは、くさび状および/または階段状の形状である。場合により、400〜1100nmの波長(400nm、500nm、600nm、700nm、800nm、900nm、1000nm、もしくは1100nm、あるいはこれらの値のいずれか2つの間にある波長等)に対応する数十から数百のスペクトルバンドが存在することもある。イメージング装置は、それぞれのフィルターラインを使用して組織を走査し、組織からの反射光を、それぞれのフィルターを通して検出する。 In a particular alternative of acquiring images in multiple spectral bands to make a data subset 404, the one or more cameras include a hyperspectral line scanning imaging device. The hyperspectral line scanner has a continuous spectral band instead of a separate band for each filter on the filter wheel. The filter of this hyperspectral line scanner may be integrated with a CMOS image sensor. In some cases, the filter is a monolithically integrated optical interference filter in which a plurality of filters are arranged in a stepped manner. Optionally, the filter is wedge-shaped and / or stepped in shape. In some cases, tens to hundreds of wavelengths corresponding to wavelengths of 400 to 1100 nm (400 nm, 500 nm, 600 nm, 700 nm, 800 nm, 900 nm, 1000 nm, or 1100 nm, or wavelengths between any two of these values, etc.) Spectral bands may also be present. The imaging apparatus scans the tissue using each filter line and detects the reflected light from the tissue through each filter.
また別の代替案では、異なるスペクトルバンドの光のフィルタリングを行うための別のフィルターシステムを使用することができる。例えば、いくつかの代替案ではファブリペローフィルターが使用される。他のフィルター構成も、例えば、フィルターをタイル構造に配置したり、ベイヤーアレイまたはマルチセンサアレイのようなパターンでフィルターを画像センサー(CMOS、CCD等)上に直接配置したりして、使用することができる。 In yet another alternative, another filter system can be used to filter light in different spectral bands. For example, some alternatives use Fabry-Perot filters. Other filter configurations may also be used, for example, by arranging the filters in a tile structure or by arranging the filters directly on an image sensor (CMOS, CCD, etc.) in a pattern such as a Bayer array or multi-sensor array. Can be done.
いずれの場合も、フィルターのパスバンドは、得ようとしている情報のタイプに基づいて選択される。例えば、熱傷の部位および周囲の組織における血液、水、コラーゲン、およびメラニンの寄与を捉えるために、熱傷の部位は、壊死組織除去の各段階において、400〜1100nmの波長(400nm、500nm、600nm、700nm、800nm、900nm、1000nm、もしくは1100nm、あるいはこれらの値のいずれか2つの間にある波長等)でイメージングされてもよい。重症度の異なる中間層熱傷を観察するための、ブタ熱傷モデルを使用した特定の実験において、壊死組織除去プロセスをガイドするためには、約515nm、750nm、および972nmの波長の吸収スペクトルが所望され、一方、深達〜中間性中間層熱傷と、深達性中間層熱傷とを識別するためには、約542nm、669nm、および960nmの波長の吸収スペクトルが所望された。 In each case, the passband of the filter is selected based on the type of information it is trying to obtain. For example, to capture the contribution of blood, water, collagen, and melanin in the burn site and surrounding tissue, the burn site has wavelengths of 400 to 1100 nm (400 nm, 500 nm, 600 nm,) at each stage of necrotic tissue removal. Imaging may be performed at 700 nm, 800 nm, 900 nm, 1000 nm, or 1100 nm, or a wavelength between any two of these values). In certain experiments using a porcine burn model to observe intermediate layer burns of varying severity, absorption spectra with wavelengths of approximately 515 nm, 750 nm, and 972 nm are desired to guide the necrotic tissue removal process. On the other hand, in order to distinguish between deep to intermediate layer burns and deep intermediate layer burns, absorption spectra having wavelengths of about 542 nm, 669 nm, and 960 nm were desired.
別の実験では、中間層熱傷を有するミニブタの成体のイメージングを行った。健康な皮膚、充血、移植可能、血液、重度でない熱傷、および重度の熱傷として組織を分類するために、健康な皮膚のサンプル、熱傷サンプル、および熱傷からの切除片のサンプルを使用した。実験において、「健康な皮膚」には、熱傷に関連する傷を有さない皮膚領域を含めた。「充血」は、灌流の多い領域に相当し、これは一般に、治療をせずとも治癒することが期待されるI度の熱傷に相当するものであった。「移植可能」のカテゴリーは、一般に、点状出血を有する淡いピンク色の皮膚に相当するものであった。この組織は、一般に、皮膚移植に望ましいものであった。「血液」のカテゴリーは、分類すべき組織を血液が覆っているために、溜まった血液を除去して再度イメージングする必要のある、やや広い部位に相当するものであった。「重度でない熱傷」のカテゴリーは、灌流が減少しているうっ血領域ではあるが、救済の可能性のある組織に相当するものであった。「重度の熱傷」のカテゴリーは、タンパク質が凝固して不可逆的な組織の喪失が生じ、切除が望ましい部位に相当するものであった。 In another experiment, adult mini pigs with intermediate layer burns were imaged. Healthy skin samples, burn samples, and excision samples from burns were used to classify tissues as healthy skin, hyperemia, transplantable, blood, non-severe burns, and severe burns. In the experiment, "healthy skin" included areas of skin without burns associated with burns. "Hyperemia" corresponded to a perfused area, which generally corresponded to a degree I burn that was expected to heal without treatment. The "transplantable" category generally corresponded to pale pink skin with petechiae. This tissue was generally desirable for skin grafts. The category of "blood" corresponded to a rather large area where the tissue to be classified was covered with blood and the accumulated blood had to be removed and reimaged. The category of "non-severe burns" corresponded to tissue with reduced perfusion, but with potential for relief. The category of "severe burns" corresponded to the site where excision was desirable, with protein coagulation resulting in irreversible tissue loss.
本開示の代替案を用いて、組織サンプルから反射された光を、400〜1100nmの範囲にある様々な波長(400nm、500nm、600nm、700nm、800nm、900nm、1000nm、もしくは1100nm、あるいはこれらの値のいずれか2つの間にある波長等)で測定し、種類の異なる組織間で反射光の量の差が大きくなる波長のセットを求めた。このような差は、組織のクラスを、少なくとも健康な皮膚、充血、移植可能、血液、重度でない熱傷、および重度の熱傷のカテゴリーへと効果的に分類するために使用できる可能性がある。最適なセットは、時には、重複の最も少ない、最も示差的な波長を含む波長セットとして特定された。これに関連して、最も示差的な波長は、特定の組織クラスを他のクラスから効果的に識別できる波長として見出された場合もあった。最小の重複は、同じ情報を測定した複数の波長のうち1つのみを含めることによって見出された場合もあった。波長のセットを用いて組織サンプルを分類した後、この分類を医師による組織サンプルの正確な評価と比較した。 Using the alternatives of the present disclosure, the light reflected from the tissue sample is subjected to various wavelengths (400 nm, 500 nm, 600 nm, 700 nm, 800 nm, 900 nm, 1000 nm, or 1100 nm, or values thereof, in the range of 400 to 1100 nm. The wavelength between the two was measured, and a set of wavelengths was obtained in which the difference in the amount of reflected light between different types of tissues was large. Such differences could be used to effectively classify tissue classes into categories of at least healthy skin, hyperemia, transplantability, blood, non-severe burns, and severe burns. The optimal set was sometimes identified as the wavelength set containing the least overlapping and most differential wavelengths. In this regard, the most differential wavelengths have sometimes been found as wavelengths that can effectively distinguish a particular tissue class from other classes. Minimal overlap was sometimes found by including only one of the multiple wavelengths that measured the same information. After classifying the tissue samples using a set of wavelengths, this classification was compared to an accurate assessment of the tissue samples by the physician.
分類の精度を試験するために、異なる実験にわたるデータ分割を行った。実験の第1のセットでは、475nm、515nm、532nm、560nm、578nm、860nm、601nm、および940nmの波長の測定を行った。実験の第2のセットでは、420nm、542nm、581nm、726nm、800nm、860nm、972nm、および1064nmの波長の測定を行った。実験の第3のセットでは、420nm、542nm、581nm、601nm、726nm、800nm、972nm、および860nmの波長の測定を行った。実験の第4のセットでは、620nm、669nm、680nm、780nm、820nm、839nm、900nm、および860nmの波長の測定を行った。 Data splits were performed across different experiments to test the accuracy of the classification. In the first set of experiments, wavelength measurements were made at 475 nm, 515 nm, 532 nm, 560 nm, 578 nm, 860 nm, 601 nm, and 940 nm. In the second set of experiments, wavelength measurements were made at 420 nm, 542 nm, 581 nm, 726 nm, 800 nm, 860 nm, 972 nm, and 1064 nm. In the third set of experiments, wavelength measurements were made at 420 nm, 542 nm, 581 nm, 601 nm, 726 nm, 800 nm, 972 nm, and 860 nm. In the fourth set of experiments, wavelength measurements were made at 620 nm, 669 nm, 680 nm, 780 nm, 820 nm, 839 nm, 900 nm, and 860 nm.
第1の実験セットと第2の実験セットにおいて、組織の分類に最良の変動を示した波長は、83%の精度で組織を分類するために使用された。これらの波長は、(相対的な重みの順に)726nm、420nm、515nm、560nm、800nm、1064nm、972nm、および581nmであった。同様に第3の実験セットと第4の実験セットにおいて、組織の分類に最良の変動を示した波長は、74%の精度で組織を分類するために使用された。これらの波長は、(相対的な重みの順に)581nm、420nm、620nm、860nm、601nm、680nm、669nm、および972nmであった。これらのセットのいずれにおいても、その精度は、臨床判断のための現在の標準的な信頼性(熱傷の深さを67〜71%の精度で測定する)よりも高かった。さらに、860nmの波長は、MSIのアルゴリズムにもPPGのアルゴリズムにも特に効果的であり、したがって、これらを組み合わせた装置にも効果的であることがわかる。これらの実験のセットから、400〜1100nmの範囲にある波長(400nm、500nm、600nm、700nm、800nm、900nm、1000nm、もしくは1100nm、あるいはこれらの値のいずれか2つの間にある波長等)は、効果的な組織分類に使用可能であることがわかる。前述の通り、他の波長セットも同様に有効でありうる。例えば、実験において有効であった波長セットを用いると、重複は最小限に抑えられた。したがって、他の波長も、組織のいくつかの特徴を効果的に分類するために使用できる。また、上記した実験を用いて、熱傷および/または本明細書に記載した他の組織状態を効果的に分類する他の波長を見出してもよい。 In the first and second experimental sets, the wavelengths that showed the best variation in tissue classification were used to classify tissues with an accuracy of 83%. These wavelengths were (in order of relative weight) 726 nm, 420 nm, 515 nm, 560 nm, 800 nm, 1064 nm, 972 nm, and 581 nm. Similarly, in the third and fourth experimental sets, the wavelengths that showed the best variation in tissue classification were used to classify tissues with 74% accuracy. These wavelengths were 581 nm, 420 nm, 620 nm, 860 nm, 601 nm, 680 nm, 669 nm, and 972 nm (in order of relative weight). The accuracy of any of these sets was higher than the current standard reliability for clinical judgment (measurement of burn depth with an accuracy of 67-71%). Furthermore, it can be seen that the wavelength of 860 nm is particularly effective for both the MSI algorithm and the PPG algorithm, and therefore for devices that combine them. From the set of these experiments, wavelengths in the range of 400 to 1100 nm (such as wavelengths in the range of 400 nm, 500 nm, 600 nm, 700 nm, 800 nm, 900 nm, 1000 nm, or 1100 nm, or between any two of these values, etc.) It turns out that it can be used for effective tissue classification. As mentioned above, other wavelength sets may be valid as well. For example, using a wavelength set that was valid in the experiment, duplication was minimized. Therefore, other wavelengths can also be used to effectively classify some features of the tissue. The experiments described above may also be used to find other wavelengths that effectively classify burns and / or other tissue conditions described herein.
概して言えば、上記の実験により、400〜900nmの範囲にある波長(400nm、500nm、600nm、700nm、800nm、もしくは900nm、あるいはこれらの値のいずれか2つの間にある波長を含む)は、熱傷のイメージングに特に有効であることが見出された。さらに詳しくは、この範囲において、熱傷をイメージングするための波長セットを構成することができ、このセットにおいて、少なくとも1つの波長は500nm未満であり、少なくとも2つの波長は500〜650nmの間にあり、かつ少なくとも3つの波長は700〜900nmの間にあった。このセットは、熱傷をイメージングし、イメージングされた熱傷組織を複数のカテゴリーに分類することにおいて効果的であった。 Generally speaking, according to the above experiments, wavelengths in the range of 400 to 900 nm (including wavelengths in the range of 400 nm, 500 nm, 600 nm, 700 nm, 800 nm, or 900 nm, or between any two of these values) are burned. It was found to be particularly effective for imaging. More specifically, in this range, a wavelength set for imaging burns can be constructed, in which at least one wavelength is less than 500 nm and at least two wavelengths are between 500 and 650 nm. And at least three wavelengths were between 700 and 900 nm. This set was effective in imaging burns and classifying the imaged burn tissue into multiple categories.
また、この実験に基づいて、試験した各波長を、分類における見かけの有意性の順に並べ、以下のランキングとして示す。

データサブセット420の画像を収集するために、前記1以上のカメラは、患者の生理学的事象または状態に相当する組織部位の動きに起因する反射光強度の経時的変化を測定できるような十分に短い時間間隔で、選択された数の画像を取得できるよう構成されている。場合によって、時間を置いて取得された複数の画像から得られるデータは3次元データアレイを形成するが、このデータアレイは、時間的次元を1つ、空間的次元を2つ有している。3次元アレイ内の各画素は、反射光強度の時間ドメインにおける変化によって特徴付けることができる。この時間ドメイン信号は、血圧、心拍数、血管抵抗、神経刺激、心臓血管の健康、呼吸数、体温および/または血液量に関連する異なる周波数成分において異なるエネルギーを有している。特定の代替案においては、ノイズを除去するために、フィルターを使用してもよい。例えば、室内における周囲光の主たる波長スペクトルに相当する光の波長を除去するために、860nmのバンドパスフィルターを使用してもよく、これにより、取得される画像は、プローブ408の光源に由来する反射光に応じたものとなる。このようにすることで、交流電源ラインの周波数に起因して周囲光に存在する60ヘルツの揺らぎのような、周囲光の揺らぎによる偽信号を低減および/または防止できる。 To collect images of the
画像取得および信号処理の有利な手順についてのさらなる詳細を、図8を参照しつつ説明する。この図は、図7の装置で実行されうるプロセスを示す。図8は、組織を分類するためのいくつかの代替案において使用されるプロセスを例示するフロー図600である。ブロック602および603は、いくつかの代替案において、例えば、プローブ408を使用して、複数のマルチスペクトル画像や時間分離画像(例えば、動画)が取得されることを示している。時間分離画像、例えば、データサブセット402において、全体としてノイズが少なく、信号対ノイズ比の高い信号を得るためには、比較的長い露出時間が望ましいことがわかった。特定の場合において、捕捉時間は27秒とされたが、これは従来のPPGイメージングプロセスにおける捕捉時間である7秒よりも長い。したがって、いくつかの代替案において望ましい捕捉時間は、少なくとも8秒、9秒、10秒、11秒、12秒、13秒、14秒、15秒、16秒、17秒、18秒、19秒、20秒、21秒、22秒、23秒、24秒、25秒、26秒、27秒、28秒、29秒、30秒、31秒、32秒、33秒、34秒、35秒、36秒、37秒、38秒、39秒、40秒、41秒、42秒、43秒、44秒、45秒、46秒、47秒、48秒、49秒、50秒、51秒、52秒、53秒、54秒、55秒、56秒、57秒、58秒、59秒、もしくは60秒であるか、これらよりも長いか、またはこれらの値のいずれか2つの間の時間である。この捕捉時間中にイメージング装置が捕捉する1秒当たりのフレーム数を、設定してもよい。状況によっては、1秒当たり30フレーム(30fps)または1秒当たり60フレーム(60fps)が、組織のイメージングにおいて効果的である。30fpsで27秒間であれば、イメージング装置は約810枚の画像を取得する。60fpsで27秒間であれば、イメージング装置は約1620枚の画像を取得する。いくつかの代替案では、取得する画像の枚数は、(例えば、ヒトの心拍を捕捉するために)必要とされるデータの分解能に依存することもある。例えば、CMOSカメラの場合、20〜120fpsが使用されてもよい。これは、20fps、30fps、40fps、50fps、60fps、70fps、80fps、90fps、100fps、110fps、もしくは120fpsまたはこれらの値のいずれか2つの間にあるサンプリングレートを含む。 Further details on the advantageous procedures of image acquisition and signal processing will be described with reference to FIG. This figure shows the processes that can be performed on the device of FIG. FIG. 8 is a flow diagram 600 illustrating the process used in some alternatives for classifying tissues.
また、特定の代替案では、光の強度が高く、信号が飽和してパルス波形がマスクされる場所である照射スポットのために、光源の位置決めが重要であった。いくつかの代替案では、この問題は、散光器および他のフロントエンドハードウェア技術を用いることで解決できた。しかしながら、フロントエンド技術によって照射スポットを除去できない場合、いくつかの代替案では、照射スポットを除去するために、信号処理を行った。実際に、信頼性のある組織病理画像を作成するために、ノイズが除去される一方で、信号は望ましく保存され、表示される。このプロセスは、照射スポットに関するノイズおよび他の無関係な信号を除去することを含む。 Also, in certain alternatives, the positioning of the light source was important because of the irradiation spots where the light intensity was high, the signal was saturated and the pulse waveform was masked. In some alternatives, this problem could be solved by using diffusers and other front-end hardware technologies. However, if front-end technology cannot remove the irradiation spots, some alternatives have performed signal processing to remove the irradiation spots. In fact, in order to produce a reliable histopathological image, the signal is preferably preserved and displayed while the noise is removed. This process involves removing noise and other irrelevant signals related to the illuminated spot.
ブロック604において、時間分解型画像シーケンス(例えば、データサブセット402)は、処理のために、コントローラ/クラシファイヤ/プロセッサ412に送信され、ここでは、組織部位における血液灌流を計算するためのPPGアルゴリズムが使用される。このプロセスは、ノイズを除去し、目的の信号の部分を取り出して、信号対ノイズ比を押し上げるために、増幅、線形化、信号の平均化、相関、および/または1以上のフィルター(例えば、バンドパス、ハイパス、もしくはローパス)を含むことができる。過度のフィルタリングは不可欠なデータを除去することになり、フィルタリングが不十分であると信号の解析が困難になるため、フィルターの選択は重要である。相互相関および自己相関も、ノイズを除去するために使用することができる。いくつかの代替案では、後述するように、サンプル信号を使用してノイズを除去することもできる。次いで、この信号は周波数ドメインに変換される。例えば、いくつかの代替案では、高速フーリエ変換(FFT)が使用される。FFTの実行後、信号は周波数によって解析される。複数の時間分離画像にわたる、各画素での反射光強度の時間ドメインにおける変動は、様々な周波数において信号エネルギーを有している。これらの周波数、およびそれらが対応している生理学的事象は、画素によってイメージングされた組織位置におけるそのような生理学的事象の発生と強度の影響の指標となる。例えば、ヒトの安静時の心拍の周波数にほぼ等しい1.0ヘルツ付近のバンドに存在する画素の信号強度は、画像中の画素の位置にある組織への、あるいはその近傍での血流を評価するために使用することができる。 At
いくつかの代替案では、関連する信号は極大値を見ることにより特定することができる。例えば、心拍数は、最も高いピークの周波数近傍のバンドにおける信号のエネルギーに注目し、該ピークが心拍に誘導される血圧の変化の一部であると仮定することによって見出された。しかしながら、この方法では、実際の心拍数の信号よりも高いピークを有すノイズを特定できないかもしれない。そのような場合、他の代替案では、ノイズ信号、ホワイトノイズ信号および他の信号の実例または参照データベースに基づいてコンピュータ学習やコンピュータトレーニングを行う信号処理が用いられる。このコンピュータは、当該信号をノイズから識別することを習得するために、関連する信号およびノイズの例について解析を行う。例えば、血流に関する信号を特定する場合、心拍と同じ周波数成分を有する信号であれば、関連している可能性がある。コンピュータ学習では、心拍をノイズから識別するために、心拍信号の例を利用したり、心拍信号の参照用データベースを参照したりする。コンピュータ学習プロセスは、そのような基準点およびデータベースを利用して、ホワイトノイズ、擬似心拍信号、および心拍信号よりも高いピークを有するノイズ信号を解析することもできる。コンピュータ学習は、周波数、振幅、信号対ノイズ比、ゼロ交差、代表的形状、または他の信号特性等の特徴に基づいて、信号を特定することができる。 In some alternatives, the associated signal can be identified by looking at the local maximum. For example, heart rate was found by focusing on the energy of the signal in the band near the highest peak frequency and assuming that the peak is part of the heart rate-induced change in blood pressure. However, this method may not be able to identify noise with peaks higher than the actual heart rate signal. In such cases, other alternatives use signal processing to perform computer learning or computer training based on noise signals, white noise signals and other signal examples or reference databases. The computer analyzes relevant signal and noise examples in order to learn to distinguish the signal from noise. For example, when identifying a signal relating to blood flow, any signal having the same frequency component as the heartbeat may be relevant. In computer learning, in order to distinguish a heartbeat from noise, an example of a heartbeat signal is used or a reference database of the heartbeat signal is referred to. Computer learning processes can also utilize such reference points and databases to analyze white noise, pseudo-heartbeat signals, and noise signals with peaks higher than the heartbeat signal. Computer learning can identify signals based on characteristics such as frequency, amplitude, signal-to-noise ratio, zero intersection, typical shape, or other signal characteristics.
いくつかの状況では、信号を特定するために、さらなる比較が行われる。例えば、いくつかの代替案では、精選された臨床病期信号の編集が行われる。次いで、測定された信号を目的の信号またはノイズとして分類するために、精選された臨床病期信号と測定された信号との比較が行われる。実施されたさらなる技術的進歩は、エッジ効果の除去であった。いくつかの代替案において、画像の端部に粒状ノイズが見られ、目的の部位を所望の通りに際立たせることができない場合もあった。エッジ効果を除去すると、目的の部位は、より高い信号強度を示した。いくつかの代替案では、エッジの除去は、平均化、膨張と収縮、エッジの検出と強調を含む画像処理によって達成された。 In some situations, further comparisons are made to identify the signal. For example, some alternatives involve editing of selected clinical stage signals. A carefully selected clinical stage signal is then compared to the measured signal in order to classify the measured signal as a signal of interest or noise. A further technological advance made was the elimination of the edge effect. In some alternatives, granular noise was seen at the edges of the image, making it impossible to highlight the desired area as desired. After removing the edge effect, the site of interest showed higher signal strength. In some alternatives, edge removal was achieved by image processing including averaging, expansion and contraction, edge detection and enhancement.
別の技術的な進歩は、動きアーチファクトの自動的な除去であった。動きアーチファクトは、患者の呼吸、患者の動き、または画像に歪みをきたす可能性のある、カメラもしくは患者の周囲の一般的な振動に関連する動きを含む。これらの動きアーチファクトを除去するために、信号の「ウィンドウ」処理を行った。これは、周囲の部分よりもはるかに大きく、かつノイズの多い時間ドメインの部位を特定し、それらの部位を「動き」として特定するものである。次いで、これらのセグメントを時間ドメインから切り取ることにより、動きアーチファクトのない修正信号が得られる。ノイズおよびそれ以外の不要な信号の部分を除去するために、別のフィルターや選択方法が使用されてもよい。この処理の後、所望の周波数(たとえば、一般に約1ヘルツ)において計算された信号エネルギーによって、組織部位(例えば、2次元の画素位置それぞれ)を、その画素位置における血液灌流を特徴付けるカテゴリーに分類することができる。 Another technological advance was the automatic removal of motion artifacts. Motion artifacts include movements associated with the patient's breathing, patient movements, or general vibrations around the camera or patient that can distort the image. Signal "windowing" processing was performed to remove these motion artifacts. It identifies parts of the time domain that are much larger and noisy than the surrounding parts, and identifies those parts as "movement". By cutting these segments out of the time domain, a correction signal without motion artifacts is obtained. Different filters and selection methods may be used to remove noise and other unwanted parts of the signal. After this process, the signal energy calculated at the desired frequency (eg, generally about 1 Hz) classifies tissue sites (eg, each of the two-dimensional pixel positions) into categories that characterize hemoperfusion at that pixel position. be able to.
いくつかの代替案では、ブロック602および604と実質的に同時に、さらにブロック603および605が実行される。ブロック603では、マルチスペクトルデータキューブ(例えば、図7のデータサブセット404)を形成する画像の取得が行われる。このデータキューブは、MSIスペクトルバンドのそれぞれについての2次元画像を含む。このような代替案において、ブロック605では、次いでデータを分析するためにMSIアルゴリズムが適用され、ブロック614では、システムによって、組織部位のそれぞれ(例えば、2次元の画素位置それぞれ)に組織組成のカテゴリーが割り当てられる。 In some alternatives,
ブロック616は、MSIとPPGの両方のデータに基づいて組織分類をするために、血液の潅流とブロック603および604からのMSIデータを組み合わせる。
例えば、説明のために言えば、8枚のバンドパスフィルターの使用により、イメージングされた各画素に対して、選択されたスペクトルバンドにそれぞれ対応する8つの反射率値が生成されるようにしてもよい。また、赤外光または近赤外光波長(例えば、840nm、850nm、860nm、870nmもしくは880nm、またはこれらの値のいずれか2つの間にある波長を含む、840nm〜880nmの近傍)に中心波長を有するフィルターを使用して、1秒当たり30フレームのイメージングを27秒間行うことで、810枚の画像を取得してもよい。これら810枚の画像に対して、上述したように周波数ドメインにおける解析を行い、イメージングされた各空間位置における血液潅流を特徴付け、イメージングされた各画素の潅流値を生成するPPGデータを得てもよい。このように、イメージングされた組織部位の各画素は、8枚のバンドパスフィルターのそれぞれを用いて取得された測定値に対応する測定値と、局所的な血流に対応する値とを有する。したがって、各画素の測定値は合計9つとなる。これらの9つの測定値を使用して、画素を異なるカテゴリーに分割(例えば、分類)することができる。当業者であれば理解できるであろうが、各画素について任意の数(例えば、2つ、10、20、もしくはこれらのいずれか2つの間にある任意の数、またはそのいずれかよりも大きな数)の測定値を取得することができ、そのような測定値によって画素を分割してもよい。 For example, for illustration purposes, the use of eight bandpass filters may generate eight reflectance values for each imaged pixel, each corresponding to a selected spectral band. Good. Also, the center wavelength is set to infrared or near-infrared wavelengths (eg, in the vicinity of 840 nm to 880 nm, including wavelengths between 840 nm, 850 nm, 860 nm, 870 nm or 880 nm, or any two of these values). 810 images may be acquired by imaging 30 frames per second for 27 seconds using the filter provided. These 810 images can be analyzed in the frequency domain as described above to characterize blood perfusion at each imaged spatial position and obtain PPG data to generate perfusion values for each imaged pixel. Good. As described above, each pixel of the imaged tissue site has a measured value corresponding to the measured value acquired by using each of the eight bandpass filters and a value corresponding to the local blood flow. Therefore, the measured values of each pixel are nine in total. These nine measurements can be used to divide (eg, classify) pixels into different categories. As one of ordinary skill in the art will understand, for each pixel any number (eg, 2, 10, 20, or any number between any two of these, or greater than any number). ) Can be obtained, and the pixels may be divided by such measured values.
様々な分割法/分類法を使用できるであろう。一般に、クラシファイヤは、測定パラメータおよび適切な分類が既知である「トレーニング」データセットを使用してトレーニングされる。トレーニングされたクラシファイヤは、次いで、やはり測定パラメータおよび適切な分類が既知であるが、クラシファイヤのトレーニングには使用されなかった「テスト」データセットによってテストされる。クラシファイヤの質は、そのクラシファイヤがテストデータセットをどの程度正しく分類するかによって評価することができる。いくつかの代替案では、所定の数のカテゴリーを使用して、画素をそれら所定のカテゴリーへと分類することができる。例えば、トリアージ環境において熱傷を分類するために、健康な皮膚、充血、重度でない熱傷、および重度の熱傷のカテゴリーを使用してしてもよい。 Various division / classification methods could be used. Generally, classifiers are trained using "training" datasets for which measurement parameters and appropriate classifications are known. The trained classifier is then tested with a "test" dataset, which also has known measurement parameters and appropriate classification, but was not used to train the classifier. The quality of a classifier can be evaluated by how well the classifier classifies the test dataset. In some alternatives, a given number of categories can be used to classify pixels into those given categories. For example, the categories of healthy skin, redness, non-severe burns, and severe burns may be used to classify burns in a triage environment.
他の代替案では、カテゴリーの数は未知であり、プロセッサ112のようなプロセッサが、画素のグループ化、およびそれらの相対的な特徴に基づいてカテゴリーを作成する。例えば、プロセッサは、特定の波長において血流量がかなり少なく、正規化された画素強度がかなり低い組織部位を、周囲の測定値と比較したそれらの測定値を根拠として、重度の熱傷と関連があるものとして特定することができる。 In another alternative, the number of categories is unknown and a processor such as
いくつかの代替案では、画素は、各カテゴリーにあらかじめ設定された値の範囲に基づいて分配される。例えば、光反射率の値の特定の範囲は、健康な皮膚と関連付けられてもよい。データがその範囲内にあれば、その組織は健康な皮膚として特定される。あらかじめ設定された範囲は、システム412上のメモリーに保存されていてもよく、ユーザによって入力されてもよく、またはシステム学習もしくは適合アルゴリズムによって自動的に決定されてもよい。いくつかの代替案では、カテゴリーは、データアップリンク、クラウド(本明細書で後述される)、または他の任意のデータソースのような外部のソースによってシステムに伝達される情報によって定義される。他の代替案では、各カテゴリーの値の現在の範囲は未知であり、プロセッサは、各画素における測定値を相互に比較し、それに基づいてカテゴリーの適合化を行う。 In some alternatives, the pixels are distributed based on a range of preset values for each category. For example, a particular range of light reflectance values may be associated with healthy skin. If the data are within that range, the tissue is identified as healthy skin. The preset range may be stored in memory on the
いくつかの代替案では、適合アルゴリズムを使用して、共通の特徴を有するグループに画素を分類し、それらのグループを特定してもよい。例えば、グラフ理論を使用して、最小カットのようなグラフカットを見出すことによって、画素をカテゴリーに分類することができる。他の分割方法を使用してもよく、例えば、閾値化、クラスタリング(例えば、k平均法、階層的クラスタリング、ファジィクラスタリング)、流域アルゴリズム、境界検出、領域拡張、統計的グルーピング、形状認識、形態学的画像処理、コンピュータトレーニング/コンピュータビジョン、ヒストグラムベース法、およびデータをグループに分類するための当業界で既知である任意の分割法を使用することができる。 In some alternatives, a matching algorithm may be used to classify the pixels into groups with common features and identify those groups. For example, using graph theory, pixels can be categorized by finding graph cuts such as the smallest cut. Other partitioning methods may be used, such as thresholding, clustering (eg, k-means, hierarchical clustering, fuzzy clustering), basin algorithms, boundary detection, region expansion, statistical grouping, shape recognition, morphology. Objective image processing, computer training / computer vision, histogram-based methods, and any division method known in the art for grouping data can be used.
いくつかの代替案では、分割にさらに情報を加えるために病歴データを使用してもよい。病歴データは、当該患者が以前に得たデータおよび/または他の患者から得られたデータを含んでいてもよい。特定の代替案では、皮膚の色、人種、年齢、体重、性別、および他の生理的な要因のような他のデータが、分割プロセスにおいて考慮される。いずれの場合にも、データはアップロードされてもよく、クラウドから得てもよく、別の方法でシステムに入力されてもよく、UI114が使用されてもよい。特定の代替案では、患者データの動的ライブラリが解析される。t−検定、f−検定、z−検定、またはその他任意の比較のための統計的手法を含む統計的手法を用いて、以前に特定された画像と取得した画像とを比較してもよい。このような比較は、例えば、測定された画素強度、画素の、画像内の他の画素に対する相対的測定値、および画素の分布を考慮して行うことができる。 In some alternatives, medical history data may be used to add more information to the split. Medical history data may include data previously obtained by the patient and / or data obtained from other patients. In certain alternatives, other data such as skin color, race, age, weight, gender, and other physiological factors are considered in the splitting process. In either case, the data may be uploaded, obtained from the cloud, entered into the system in another way, or
特定の代替案では、組織の分類を支援するために、熱傷のような組織の状態の典型的な画像で動的ライブラリが更新されてもよい。別の代替案において、それらの画像は、どのような組織状態を示しているか、またそれをどの程度明確に示しているかによって、指定され特定されてもよい。イメージングされた皮膚の状態における角度、質、および状態の差異を考慮するために、動的ライブラリには、異なる角度から撮られた様々な画像が含まれていることが望ましい。 In certain alternatives, the dynamic library may be updated with typical images of tissue conditions such as burns to assist in tissue classification. In another alternative, the images may be specified and specified by what kind of tissue state they show and how clearly they show it. In order to take into account differences in angle, quality, and condition in the imaged skin condition, it is desirable that the dynamic library contains various images taken from different angles.
図8に戻るが、様々な出力データが、ユーザに提示されうる。そのようなデータとしては、PPGデータに基づくPPG潅流画像620、MSIデータに基づくMSI分類画像、通常のRGBデータに基づく白色光照射画像、およびMSIデータとPPGデータの組み合わせに基づく分類を示すMSI/PPG融合画像622が挙げられる。例えば、図1〜図6を参照しつつこれまでに説明したトリアージ装置において、図3のディスプレイの出力212、214、216、および218は、組み合わせによるMSI/PPG融合分類画像622であってもよい。このような画像において、対象の組織部位(例えば、画素)はそれぞれ、上記した通り、健康、充血、重度の熱傷、および重度でない熱傷のような熱傷のカテゴリーに分類される。これに加えてあるいはこれに代えて、図3に示すような、各カテゴリーにおける%TBSA等の出力データがユーザに提示されることもある。 Returning to FIG. 8, various output data can be presented to the user. Such data include
組織を分類する際に組成および生存率データの両方を用いることは、先行技術に対して大きな進歩である。図9A、図9B、図9C、および図9Dは、熱傷分類におけるそのような利点のいくつかを示すものである。ある実験では、中間層熱傷を有するミニブタの成体のイメージングを行った。図9Aは、実験に使用した5つの組織サンプルの例である。図9Aは、通常の写真用カメラを用いて撮影したものである。これらの画像は、受傷前(例えば、熱傷前)の組織表面、熱傷後の表面、ならびに熱傷に対して接線方向に3回の切除(1回目の切除、2回目の切除および3回目の切除)を行い、その表面を撮影したものである。同じ5つの組織サンプルを使用して、PPGの結果、MSIの結果、および本明細書に開示される特定の代替案による、組織をPPGアルゴリズムとMSIアルゴリズムの両方に基づいて分類する新しいシステムの結果を比較した。この実験の画像は、医師が独立して解析することのできる組織を撮影したものであるため、これらのイメージング装置の結果を比較することによって、組織の分類における異なるイメージング技術の効果を評価することができる。 The use of both composition and viability data in classifying tissues is a major advance over the prior art. 9A, 9B, 9C, and 9D show some of such advantages in burn classification. In one experiment, adult mini pigs with intermediate layer burns were imaged. FIG. 9A is an example of five tissue samples used in the experiment. FIG. 9A was taken with a normal photographic camera. These images show the tissue surface before the injury (eg, before the burn), the surface after the burn, and three tangential excisions to the burn (first excision, second excision, and third excision). Was performed, and the surface was photographed. Using the same five tissue samples, PPG results, MSI results, and the results of a new system that classifies tissues based on both the PPG and MSI algorithms, according to the specific alternatives disclosed herein. Was compared. Since the images in this experiment were taken of tissue that doctors could independently analyze, the effect of different imaging techniques on tissue classification should be evaluated by comparing the results of these imaging devices. Can be done.
図9Bは、画像の各画素におけるPPGイメージングのデータのみを示す5つの画像の例である。画像は、PPGデータのみに基づいて組織を正しく分類することには限界があることを示している。このデータから容易に特定できるのは、血流が最少である、最も重度の熱傷組織のみである。組織部位808、810、812、および814は、血流が最少であるそのような組織部位の例であり、評価の結果、他の部位よりもかなり暗い色で示されている。これら以外の部位は、そのスペクトルにおいて、血流の読み取り値が最大と最小の間のいずれかの場所にあり、分類は困難である。 FIG. 9B is an example of five images showing only PPG imaging data at each pixel of the image. The images show that there is a limit to the correct classification of tissues based solely on PPG data. Only the most severe burned tissue with the least blood flow can be easily identified from this data.
図9Cは、画像の各画素におけるMSIイメージングのデータのみを示す5つの画像の例である。画像は、このMSIデータのみに基づいて組織を正しく分類することにも限界があることを示している。受傷前の画像において、実際には「健康な皮膚」であるべき組織の多くが「充血」として分類されている。熱傷の画像において、部位816は、重度の熱傷として正確に特定されている。しかしながら、部位818のようないくつかの部位は、「健康な皮膚」であるところを「重度の熱傷」として誤って分類されている。1回目の切除において、部位820のような部位は、「移植可能な創傷床」として分類されるべきであるところを「重度でない熱傷」として誤って特定されている。同様に、3回目の切除の部位820もまた、「移植可能な創傷床」として分類されるべきであるところを「重度でない熱傷」として誤って特定されている。 FIG. 9C is an example of five images showing only MSI imaging data at each pixel of the image. The images also show that there is a limit to the correct classification of tissues based solely on this MSI data. In pre-injury images, much of the tissue that should actually be "healthy skin" is classified as "hyperemic." In the burn image, site 816 is accurately identified as a severe burn. However, some sites, such as
図9Dは、本明細書に開示される特定の代替案による、少なくともPPGアルゴリズムとMSIアルゴリズムをいずれも利用する新しいシステムから得られたデータを示す、同じ5枚の画像の例である。この新システムは、受傷前の組織を「健康な皮膚」として正しく特定する。熱傷の画像において、新システムは、部位826の「重度の熱傷」である組織を囲む「充血」組織のリングとして部位824を正しく特定する。このリングは、PPGやMSIでは正しく特定されなかった。熱傷の画像において、新システムはさらに、実際には健康な皮膚であるところを「重度の熱傷」とする誤りを減少させた。同様に、1回目の切除の画像および3回目の切除の画像において、新システムは、移植可能な創傷床を正しく特定したが、これはMSI画像やPPG画像ではなされなかった。すなわち、MSIイメージング装置は、「移植可能な創傷床」とされるべき部位820および822を、「重度でない熱傷」として誤って分類した。新システムは、部位828および830として示されるこれら同一の部位を、「移植可能な創傷床」として正確に特定する。 FIG. 9D is an example of the same five images showing data obtained from a new system utilizing at least both the PPG and MSI algorithms according to the particular alternatives disclosed herein. The new system correctly identifies pre-injured tissue as "healthy skin." In the burn image, the new system correctly identifies site 824 as a ring of "hyperemic" tissue surrounding the tissue that is "severe burn" at site 826. This ring was not correctly identified by PPG or MSI. In burn images, the new system also reduces the error of "severe burns" where what is actually healthy skin. Similarly, in the images of the first and third resections, the new system correctly identified the implantable wound bed, but this was not done in MSI or PPG images. That is, the MSI imaging device misclassified
この実験の結果からわかるように、組成および生存率の両方に基づいて組織を分類する新しいシステムは、PPG単独およびMSI単独を含む先行技術よりも適切に、壊死組織除去の異なる段階における熱傷を分類した。このように、新システムは、先行技術における他のシステムおよび方法に対する、予想外の大きな進歩をもたらすものである。 As can be seen from the results of this experiment, a new system for classifying tissues based on both composition and viability better classifies burns at different stages of necrotic tissue removal than prior art, including PPG alone and MSI alone. did. Thus, the new system brings an unexpectedly significant advance over other systems and methods in the prior art.
本明細書に記載されるいくつかの代替案の臨床用途の1つは、熱傷の分類である。図10に、熱傷治療の流れを簡略化して示す。組織700は、組織に熱傷があることを示している。皮膚層702は、皮膚の表面に熱傷があることを示している。熱傷は、しばしば、皮膚の変色や表皮の喪失につながる。皮膚層702の下には、血液が供給されない変性した皮膚である組織層704が存在する。これは、時として凝固部、凝固壊死部、または焼痂と呼ばれる。これは、死んだ組織である。組織層704の近傍またはその周囲は、熱傷の程度に応じて、血流に変化をきたした別の組織でありうる。このような組織は、時としてうっ血部と呼ばれるが、うっ血部とは、凝固部の周囲に存在うる、細胞障害の程度が軽度な領域である。凝固部からさらに離れた、うっ血部の外側に存在するのは、組織が回復の可能性を有する充血部である。熱傷は、I度からIV度に分類され、I度の熱傷は表面に最も近く最も軽い熱傷であり、IV度の熱傷は筋肉や骨に達する最も重度の熱傷である。 One of the clinical uses of some of the alternatives described herein is the classification of burns. FIG. 10 shows a simplified flow of burn treatment.
重症度の異なる熱傷の間の微妙な違いは、識別が可能であったとしても、肉眼での識別は困難なことがある。実際に、早期の段階では、熱傷の全体的な影響は皮膚の奥深くに隠されており、外科的介入なしには、熱傷の程度、さらには熱傷組織の有無さえ、ほとんど判断できない。しかしながら、重症度の違いにかかわらず、熱傷の治療では、時間が最も重要である。実際に、早期の治療により、熱傷の回復に大きな差が出ることがある。 Subtle differences between burns of varying severity can be difficult to distinguish with the naked eye, even if they can be identified. In fact, in the early stages, the overall effects of burns are hidden deep in the skin, and without surgical intervention, the extent of the burn, and even the presence or absence of burn tissue, is barely discernible. However, regardless of severity, time is paramount in the treatment of burns. In fact, early treatment can make a big difference in the recovery of burns.
いくつかの代替案は、熱傷の重症度の評価および特定に有効である。実際に、本明細書に記載された装置は、熱傷の物理的位置を把握し、熱傷の重症度(例えば、熱傷の程度、およびそれが表皮熱傷であるか、浅達性中間層熱傷であるか、深達性中間層熱傷であるか、または全層熱傷であるか)を含む特徴を判定し、かつ熱傷の総体的%TBSAまたは重症度ごとの%TBSAを見出すことができる。上述の通り、皮膚組織の性質や特性は熱傷後に変化する。その結果、組織の様々な層が光を吸収し、反射する様子は、組織の種類によって、また熱傷の程度によって異なることとなる。このような場合、本明細書に記載のいくつかの代替案の高分解能マルチスペクトルカメラであれば、これらの差異を捉え、それを用いて皮膚の組成を評価し、熱傷の種類および熱傷の重症度を特定することができる。しかしながら、この情報だけでは、熱傷の重症度の評価が不完全となることがある。先に述べたように、熱傷の重症度は、現時点での皮膚の損傷の程度のみならず、組織への血流の有無にも関連する。したがって、いくつかの代替案で用いられる高分解能マルチスペクトルカメラは、望ましいことに、組織部位への血流を測定することもでき、皮膚組成および血流の情報を組み合わせることによって、熱傷の有無および熱傷の重症度をより詳細かつ正確に判断することができる。 Several alternatives are useful in assessing and identifying the severity of burns. In fact, the devices described herein determine the physical location of the burn and the severity of the burn (eg, the degree of the burn and whether it is an epidermal burn or a superficial middle layer burn). It is possible to determine features including (whether it is a deep middle-layer burn or a full-thickness burn) and find an overall% TBSA or% TBSA by severity of the burn. As mentioned above, the properties and properties of skin tissue change after burns. As a result, the way the various layers of tissue absorb and reflect light will vary depending on the type of tissue and the degree of burns. In such cases, some of the alternative high-resolution multispectral cameras described herein can capture these differences and use them to assess the composition of the skin, the type of burn and the severity of the burn. The degree can be specified. However, this information alone can incompletely assess the severity of burns. As mentioned earlier, the severity of burns is related not only to the current degree of skin damage, but also to the presence or absence of blood flow to the tissues. Therefore, the high-resolution multispectral cameras used in some alternatives can also preferably measure blood flow to tissue sites, and by combining skin composition and blood flow information, the presence or absence of burns and The severity of burns can be determined in more detail and accurately.
メス706は、熱傷の処置を行う方法の一例である。壊死組織除去術によって、死んだ組織、損傷組織、感染組織、壊死組織、または壊死しかかっている組織を切除し、残った健康な組織の治癒を改善し、促進する。実際、先にも述べたように、組織の切除の過不足によって生命が脅かされる結果となることがある。熱傷の切除が不十分であると、失活した組織に移植片を載せることになり、移植片の生着が悪くなる。熱傷の切除が不十分であると、さらに、感染症のリスクの増加および/または治療が長引くことにつながる。一方、過度に切除してしまうと、過剰な失血や切除面からの出血につながることがあり、移植片の生着不良を招きうる。本明細書に記載の装置は、健康な組織と切除する必要がある組織との境界を定量的に特定する方法を提供する。これは、組織の評価に関して専門家の主観的な意見に依拠している当技術分野の現状に対する進歩である。
この例では、熱傷708を切除し、創傷床710を残す。死んだ組織を除去した後、きれいになった創傷床712は、移植の準備のできた状態となるが、この移植は、健康な組織を切除部位に移植し、組織の回復を助けるものである。実際に、本明細書に記載された装置および手法の利点は、外科的介入および移植の前に、熱傷の非専門家が非侵襲的なツールを用いて熱傷の重症度を迅速に評価できることである。 In this example, the
図11は、本明細書に記載の装置のいくつかが移植片の生存率評価に使用される応用例を示す。いくつかの代替案で使用される移植片は、組織または再生細胞の移植物であり、幹細胞、内皮細胞、内皮細胞前駆体、および/または単離、富化、もしくは濃縮された形態にあるこれらの細胞の混合物、または補綴物、支持物、もしくは医療装置を包含しうる。いくつかの代替案で使用される移植片は、足場、補綴物、または医療装置とともに、組織および/または上記細胞を含んでもよい。組織の移植時に血液供給が得られない場合、移植が成功すれば、移植片を支持する周囲の組織によって新たな血液供給がなされるであろう。いくつかの用途は、幹細胞、内皮細胞、内皮細胞前駆体、および/または単離、富化、もしくは濃縮された形態にあるこれらの細胞の混合物を包含しうる再生細胞の導入を含み、この移植片は、前記細胞が、例えば血管新生または動脈形成によって新たな血液供給を直接的または間接的に生じる能力によって血液を供給することができる。いくつかの用途は、移植片および/または再生細胞の利用を含み、該再生細胞は、幹細胞、内皮細胞、内皮細胞前駆体、および/または単離、富化、もしくは濃縮された形態にあるこれらの細胞の混合物を、単独で、またはFGF、HGF、もしくはVEGFのような1以上の成長因子が補充された足場、補綴物、もしくは医療装置と組み合わせて含んでもよい。本明細書に記載の装置は、移植片がうまく取り込まれたか否か、または移植片が拒絶されて壊死組織になるか否かによって、移植片を分類することができる。画像900は、本明細書に記載の代替案によって生成した画像であり、組織部位は、複数の異なる時間および複数の異なる周波数帯域のいずれにも対応するようイメージングされている。画像上の色は、血液が供給されている健康な組織の存在を示している。これとは対照的に、画像902は、血液が供給されていない不健康な組織を示しており、移植に失敗したことがわかる。 FIG. 11 shows an application example in which some of the devices described herein are used to assess the viability of a graft. The grafts used in some alternatives are tissue or regenerated cell grafts, which are in stem cells, endothelial cells, endothelial cell progenitor cells, and / or isolated, enriched, or enriched forms. Can include a mixture of cells, or a prosthesis, support, or medical device. The implants used in some alternatives may include tissues and / or the cells described above, along with scaffolds, prostheses, or medical devices. If no blood supply is available at the time of tissue transplantation, a successful transplantation will provide a new blood supply by the surrounding tissue that supports the graft. Some uses include the introduction of regenerated cells that can include stem cells, endothelial cells, endothelial cell progenitor cells, and / or mixtures of these cells in isolated, enriched, or enriched forms. One can supply blood by the ability of the cells to directly or indirectly generate a new blood supply, eg, by angiogenesis or angioplasty. Some uses include the utilization of implants and / or regenerated cells, which are in stem cells, endothelial cells, endothelial cell precursors, and / or isolated, enriched, or enriched forms. A mixture of cells of the cells may be included alone or in combination with a scaffold, prosthesis, or medical device supplemented with one or more growth factors such as FGF, HGF, or VEGF. The devices described herein can classify implants according to whether the implants have been successfully incorporated or whether the implants are rejected into necrotic tissue.
本明細書に記載される装置の別の臨床用途は、圧迫潰瘍または床ずれとしても知られる褥瘡潰瘍の分類である。この創傷は、組織に圧力が加わることによって生じ、その結果、組織への血流が妨げられる。この閉塞の結果、組織の壊死および喪失が起こる。これにより、多くの場合、後の段階になって組織の色が目に見えて変化する。褥瘡潰瘍は、喪失した組織の量に関連してI度からIV度に分類されることもある。 Another clinical use of the device described herein is the classification of pressure sores or pressure sores, also known as pressure sores. This wound is caused by pressure applied to the tissue, resulting in obstruction of blood flow to the tissue. The result of this obstruction is tissue necrosis and loss. This often results in a visible change in tissue color at a later stage. Pressure ulcer ulcers may also be classified as grades I to IV in relation to the amount of tissue lost.
褥瘡潰瘍の特定が困難であるのは、閉塞の初期には、組織の表面から容易には認められない組織の変化が生じうることによる。本明細書に記載の装置は、進行の早期の段階にある褥瘡潰瘍の特定に効果的であり、これにより、早期の予防的処置が容易になる。図12に、褥瘡潰瘍の存在または誘導を特定し、異なる段階にある褥瘡潰瘍を分類するための、本明細書に記載の装置の応用例を示す。画像800は、皮膚組織に組織分類データを重ね合わせた図である。色のついた部分は、表面下に褥瘡潰瘍があることを示す。本明細書の記載の通りに製造した装置を用いて、複数の異なる時間および複数の異なる周波数帯域で光反射率を読み取ることによって分類を行ったところ、組織の組成における差異および組織への血流の差異を検出することができた。画像806は、13日後の組織表面の写真であり、この患者はII度の褥瘡潰瘍を有している。 The difficulty in identifying pressure ulcer ulcers is due to the potential for tissue changes that are not readily apparent from the surface of the tissue in the early stages of occlusion. The devices described herein are effective in identifying pressure ulcer ulcers in the early stages of progression, which facilitates early prophylactic treatment. FIG. 12 shows an application of the device described herein for identifying the presence or induction of pressure ulcers and classifying pressure ulcers at different stages.
組織への血流が妨げられる褥瘡潰瘍とは対照的に、組織に存在する血液が多過ぎることもある。充血は、紅斑として現れることもあるが、組織への血流が増加するものである。これは、腫れ、変色、および壊死につながることがある。また、毛細血管および静脈のうっ血、組織における過剰なヘモジデリン、および線維症を伴うこともある。本発明の代替案は、充血している組織を初期段階に特定し、評価する上で有効である。ここでもまた、組織への血流とともに、組織の性質や特性の変化を検出できるという組み合わせにより、これらの代替案では、充血している組織の重症度を容易に特定し、評価することができる。 In contrast to pressure ulcers, which block blood flow to the tissue, too much blood may be present in the tissue. Hyperemia, which may appear as erythema, is an increase in blood flow to tissues. This can lead to swelling, discoloration, and necrosis. It may also be accompanied by capillary and venous congestion, excess hemosiderin in tissues, and fibrosis. The alternative of the present invention is effective in identifying and evaluating hyperemic tissue at an early stage. Again, the combination of being able to detect changes in tissue properties and properties as well as blood flow to the tissue allows these alternatives to easily identify and assess the severity of hyperemic tissue. ..
本明細書に記載される代替装置は、組織の分類および評価が必要とされる医療分野において、他にも多数の用途がある。熱傷、褥瘡潰瘍、および充血と同様に、他の種類の創傷もまた、本発明の代替装置によって分類し、評価することができる。そのような創傷には、擦過傷、断裂、出血、裂傷、穿刺傷、穿通創、慢性創傷、または組織への血流の変化に伴って組織の性質および特性が変化する任意の種類の創傷が含まれる。本明細書に提示する代替装置は、組織の生存率に関する生理学的情報を、単純な画像フォーマットで医療従事者に提供する。創傷部位における血液灌流および酸素化等の情報は、創傷治癒の重要な指標である。皮膚の下に隠されたこれらの血行動態特性を画像化することにより、医師は、創傷治癒の進行をよりよく知ることができ、得た知識に基づいてタイムリーな患者ケアの決定を下すことができる。同時に、本明細書に記載されたいくつかの装置によって、皮膚の状態を表す皮膚組成に関する情報を得ることができる。 The alternative devices described herein have many other uses in the medical field where tissue classification and evaluation are required. Similar to burns, pressure ulcers, and hyperemia, other types of wounds can also be classified and evaluated by alternative devices of the invention. Such wounds include abrasions, tears, bleeding, lacerations, puncture wounds, penetrating wounds, chronic wounds, or any type of wound whose tissue properties and properties change with changes in blood flow to the tissue. Is done. The alternative devices presented herein provide healthcare professionals with physiological information about tissue viability in a simple image format. Information such as blood perfusion and oxygenation at the wound site is an important indicator of wound healing. By imaging these hemodynamic properties hidden under the skin, physicians can better understand the progression of wound healing and make timely patient care decisions based on the knowledge gained. Can be done. At the same time, some of the devices described herein can provide information about the skin composition that represents the condition of the skin.
本明細書に記載のいくつかの装置の使用は、損傷組織が存在する用途に限定されるものではない。実際、いくつかの代替装置は、健康な組織を検出して、該健康な組織を壊死組織や壊死しかかっている組織と識別するものであってもよい。 The use of some of the devices described herein is not limited to applications in which damaged tissue is present. In fact, some alternative devices may detect healthy tissue and identify the healthy tissue from necrotic or near-necrotic tissue.
健康な組織が分類され、評価されうる場の1つは、創傷や皮膚の疾患との比較にある。例えば、熱傷に伴い、該熱傷に関連して、あるいは該熱傷と並んで、健康な組織の部位が存在するかもしれない。健康な組織と、壊死組織または壊死組織となる運命にある組織との境界がどこにあるかを特定できることは、熱傷の診断および治療のいずれにも有用である。複数の異なる時間および複数の異なる周波数帯域の両方で皮膚をイメージングし、皮膚の組成ならびに当該組織部位での血液灌流および酸素化を評価することにより、健康な皮膚を特定することができる。 One of the places where healthy tissue can be classified and evaluated is in comparison with wound and skin disorders. For example, with a burn, there may be sites of healthy tissue associated with or alongside the burn. Being able to identify where the boundary between healthy tissue and tissue that is necrotic or destined to become necrotic tissue is useful for both diagnosis and treatment of burns. Healthy skin can be identified by imaging the skin at both different times and at different frequency bands and assessing the composition of the skin and the hemoperfusion and oxygenation at the tissue site.
本明細書に記載される代替案では、移植組織または再生細胞移植物としての成功の見込みに基づいて組織を分類してもよい。この分類では、レシピエント組織の性質および特性に加えて、レシピエント組織が新たな血液供給を受け入れる能力も考慮される。代替案では、組織が移植片または再生細胞移植物のために新たな血液供給を形成する可能性、および皮膚が全般的にどの程度健康であるかに基づいて、受容組織を分類することもできる。移植組織と受容組織、いずれの分類においても、本明細書に記載のいくつかの装置は、複数の異なる時間および複数の異なる周波数帯域に対応する複数の画像を解析することができる。 In the alternatives described herein, tissues may be classified based on their likelihood of success as a transplanted tissue or regenerated cell transplant. In addition to the properties and characteristics of the recipient tissue, this classification also considers the recipient tissue's ability to accept new blood supplies. Alternatively, the receiving tissue can be categorized based on the likelihood that the tissue will form a new blood supply for the graft or regenerated cell implant, and how healthy the skin is overall. .. In both the transplanted tissue and the receiving tissue classification, some of the devices described herein are capable of analyzing multiple images corresponding to multiple different times and multiple different frequency bands.
単に組織の健康状態を分類することに加えて、本明細書に記載される代替案では、皮膚のある部位における厚さのような、組織の様々な態様を測定してもよく、皮膚の肉芽組織を評価してもよい。別の例では、本明細書に記載の装置を用いて、縫合箇所の周囲組織の健康状態および縫合箇所の治癒状態を、監視して評価することができる。 In addition to simply classifying the health of the tissue, the alternatives described herein may measure various aspects of the tissue, such as thickness at some site of the skin, and skin granulation. The organization may be evaluated. In another example, the devices described herein can be used to monitor and assess the health of the tissue surrounding the suture and the healing of the suture.
本明細書に記載のいくつかの装置の別の用途は、組織の治癒を監視することである。本明細書に記載される装置は、創傷がどのように変化するか、または健康な組織がどのように形成されるかを監視するために、多数の時点において複数の画像を取得することもできる。場合によっては、ステロイド、肝細胞増殖因子(HGF)、線維芽細胞増殖因子(FGF)、抗生物質、幹細胞および/もしくは内皮細胞を含む単離もしくは濃縮された細胞集団、または組織移植片のような治療剤を、創傷または他の疾患を治療するために使用してもよく、本明細書に記載の装置を使用してそのような治療を監視することもできる。いくつかの代替案では、特定の治療の実施前、実施中または実施後の組織の治癒を評価することによって、治療剤の有効性を監視することができる。いくつかの代替案では、複数の異なる時間および複数の異なる周波数帯で複数画像を取得することにより、これを行う。これらの画像により、皮膚から反射された光を用いて、組織の性質および特性ならびに組織への血流を評価することができる。その結果、本明細書に記載の装置は、組織がどのように治癒しているか、ならびに治療剤が治癒過程を促進する効果および速度についての貴重な情報を与えることができる。 Another use of some of the devices described herein is to monitor tissue healing. The devices described herein can also acquire multiple images at multiple time points to monitor how the wound changes or how healthy tissue is formed. .. In some cases, such as isolated or enriched cell populations containing steroids, hepatocyte growth factor (HGF), fibroblast growth factor (FGF), antibiotics, stem cells and / or endothelial cells, or tissue implants. Therapeutic agents may be used to treat wounds or other disorders, and the devices described herein can be used to monitor such treatments. In some alternatives, the effectiveness of therapeutic agents can be monitored by assessing tissue healing before, during, or after a particular treatment. Some alternatives do this by acquiring multiple images at multiple different times and at multiple different frequency bands. These images allow the light reflected from the skin to be used to assess the properties and properties of the tissue as well as the blood flow to the tissue. As a result, the devices described herein can provide valuable information about how the tissue is healing, as well as the effectiveness and rate at which the therapeutic agent accelerates the healing process.
いくつかの代替案を使用して、左心室補助装置(LVAD)の導入、およびそのような移植を行った後の治癒プロセスを監視してもよい。LVADの流量が増加すると、拡張期圧は上昇し、収縮期圧は一定のままであり、脈圧は減少する。収縮期圧と拡張期圧の差である脈圧は、左心室の収縮性、血管内容積、予負荷、および後負荷圧、および送出速度の影響を受ける。したがって、動脈血圧値および波形の評価は、LVADと心臓血管系との生理学的相互作用に関する貴重な情報を提供する。例えば、不十分な左心室機能は、脈動性を示さない動脈波形に関連する。本明細書に記載の代替案は、LVAD移植後の患者における脈動流の戻りの監視に使用することができ、患者の回復を監視して支援する上での強力なツールを提供することができる。 Several alternatives may be used to monitor the introduction of a left ventricular assist device (LVAD) and the healing process after such transplantation. As the flow rate of LVAD increases, the diastolic pressure rises, the systolic pressure remains constant, and the pulse pressure decreases. Pulse pressure, the difference between systolic and diastolic pressure, is affected by left ventricular systolic, intravascular volume, preload, and afterload pressure, and delivery rate. Therefore, assessment of arterial blood pressure and waveform provides valuable information on the physiological interaction of LVAD with the cardiovascular system. For example, inadequate left ventricular function is associated with arterial waveforms that are not pulsatile. The alternatives described herein can be used to monitor pulsatile flow return in patients after LVAD transplantation and can provide a powerful tool for monitoring and assisting patient recovery. ..
特定の代替案は、整形外科手術における組織の移動および再建処置の術中管理を提供するために使用されてもよい。例えば、乳癌患者の治療において、全乳房切除およびその後の乳房再建が必要となることがある。乳房再建に伴う合併症は50%もの高い比率で起こることが報告されている。本明細書に記載の装置により、移植片を受け入れようとしている組織と移植組織自体とをいずれも評価することが、容易になりうる。このような代替案における評価は、上記の手法を使用して、組織の健康状態および質、ならびに血液灌流および酸素化を注視するものである。 Certain alternatives may be used to provide intraoperative management of tissue movement and reconstructive procedures in orthopedic surgery. For example, treatment of breast cancer patients may require total mastectomy followed by breast reconstruction. Complications associated with breast reconstruction have been reported to occur as high as 50%. The devices described herein can facilitate the evaluation of both the tissue that is accepting the implant and the tissue itself. The assessment in such alternatives uses the techniques described above to monitor tissue health and quality, as well as hemoperfusion and oxygenation.
特定の代替案を、慢性創傷の治療の解析を容易にするために使用してもよい。慢性創傷の患者は、費用のかかる先進医療を頻繁に受けるが、その効果を測る尺度はない。本明細書に記載される代替案では、上述のイメージング技術を用いて慢性創傷の画像化を行い、創傷の大きさ、創傷の深さ、創傷組織の存在、および健康な組織の存在を含む、慢性創傷の定量的データを得ることができる。 Certain alternatives may be used to facilitate analysis of the treatment of chronic wounds. Patients with chronic wounds often receive costly advanced medical care, but there is no measure of their effectiveness. The alternatives described herein include imaging of chronic wounds using the imaging techniques described above, including wound size, wound depth, presence of wound tissue, and presence of healthy tissue. Quantitative data on chronic wounds can be obtained.
本明細書に記載される特定の代替案は、四肢の退行を特定する際に使用されてもよい。このような用途では、画像から四肢の末梢灌流が識別される。これを使用して、正常な四肢の健康状態の監視のみならず、成長因子(FGF、HGF、またはVEGF)および/または再生細胞の導入のような特殊な治療が必要となりうる、四肢における末梢血流不全(例えば、四肢虚血または末梢血管疾患の部位)を検出することもできる。再生細胞としては、幹細胞、内皮細胞前駆体、内皮初原細胞、またはこの種の細胞を含む濃縮または単離された集団が挙げられるが、これに限定されるものではない。これにより、早期の治療が可能となり、四肢の切断が避けられる場合もある。その他の、より重篤な症例において、医療専門家が十分な情報に基づいて四肢切断の必要性の有無を決定するためのデータを提供する場合もある。 The particular alternatives described herein may be used in identifying limb regression. In such applications, images identify peripheral perfusion of the extremities. It can be used to monitor normal limb health as well as peripheral blood in the limbs that may require special treatments such as the introduction of growth factors (FGF, HGF, or VEGF) and / or regenerated cells. Flow failure (eg, sites of limb ischemia or peripheral vascular disease) can also be detected. Regenerative cells include, but are not limited to, stem cells, endothelial cell progenitor cells, endothelial primordial cells, or enriched or isolated populations containing cells of this type. This allows for early treatment and may avoid amputation of the limbs. In other, more severe cases, medical professionals may provide informed data to determine the need for limb amputation.
本明細書に記載の装置の別の用途は、血管攣縮(すなわち、血管の狭窄)を起こした患者に生じるレイノー現象の治療に関する。血管攣縮は、典型的には、指に血液を供給する指動脈で起こるが、足、鼻、耳、および唇にも現れることが知られている。いくつかの代替装置は、レイノー現象を有する患者を正確に特定することができ、これは診断のどの段階においても有用である。 Another use of the devices described herein relates to the treatment of Raynaud's phenomenon that occurs in patients with vasospasm (ie, vascular stenosis). Vasospasm typically occurs in the finger arteries that supply blood to the fingers, but is also known to appear in the feet, nose, ears, and lips. Some alternative devices can accurately identify patients with Raynaud's phenomenon, which is useful at any stage of diagnosis.
いくつかの代替装置は、がん細胞の存在、がん細胞の増殖、転移、腫瘍負荷、またはがんのステージの特定、分類、または評価のために、また、治療後におけるがん細胞の存在、がん細胞の増殖、転移、腫瘍負荷、またはがんのステージにおける低減の特定、分類、または評価のために使用されてもよい。このような代替装置は、組織から反射された光を測定して皮膚の組成を決定するが、皮膚の組成は、がん細胞に関連する異常な組成を反映しうるものである。代替装置はまた、複数の異なる時間に取得された複数の画像を評価することによって、がん細胞への血流を測定することができる。血流は、がん細胞の存在、がん細胞の増殖、転移、腫瘍負荷、またはがんのステージに関連する、組織への異常な血流を示しうる。がん細胞を除去した後、本発明の代替装置を用いて回復の監視を行ってもよく、監視対象には、健康な組織の増殖およびがん細胞の再発が含まれる。 Some alternative devices are for the presence of cancer cells, the growth, metastasis, tumor loading, or stage of cancer, or the presence of cancer cells after treatment. , May be used to identify, classify, or assess reductions in cancer cell growth, metastasis, tumor burden, or stage of cancer. Such alternative devices measure the light reflected from the tissue to determine the composition of the skin, which can reflect the abnormal composition associated with cancer cells. The alternative device can also measure blood flow to cancer cells by evaluating multiple images acquired at multiple different times. Blood flow can indicate abnormal blood flow to tissues associated with the presence of cancer cells, cancer cell growth, metastasis, tumor loading, or stage of cancer. After removal of the cancer cells, recovery may be monitored using an alternative device of the invention, which includes the growth of healthy tissue and the recurrence of cancer cells.
前述の代替装置の特徴は、研究室や診療所においても試験され、良い結果が出ている。例えば、脈動性血流に起因する組織の動的変化を機械的に模倣する光学組織ファントムを用いた実験において、本明細書に記載の装置は、レーザードップラーイメージングよりも光透過が大きく、また、組織ファントム材料の下で鼓動する流体の流れを正確に検出した。この実験では、40〜200bpm(0.67〜3.33Hz)の範囲の脈動流を試験することで、安静時から運動時または労作時の早い速度に至る、ヒトの心拍数の全範囲を試験した。 The features of the above-mentioned alternative device have also been tested in laboratories and clinics with good results. For example, in an experiment using an optical tissue phantom that mechanically mimics the dynamic changes in tissue caused by pulsating blood flow, the apparatus described herein has greater light transmission and more light transmission than laser Doppler imaging. Accurately detected the beating fluid flow under the tissue phantom material. In this experiment, the entire range of human heart rate, from rest to high speed during exercise or exertion, is tested by testing pulsatile flow in the range of 40-200 bpm (0.67-3.33 Hz). did.
また、ブタの熱傷モデルで実施した、様々な重症度の熱傷をイメージングした実験では、本明細書に記載の代替装置が生成した画像を、参照ライブラリおよびコンピュータトレーニングとともに用いることにより、健康な皮膚、充血、1.0mmを超える熱傷、1.0mm未満の熱傷、血液、および健康な創傷床に相当する部位が正確に特定された。これらは、壊死組織除去術を実施する際に外科医が遭遇する種類の組織であった。 In addition, in experiments in which burns of various severity were imaged in a porcine burn model, images generated by the alternative devices described herein were used in conjunction with reference libraries and computer training to provide healthy skin. Hyperemia, burns greater than 1.0 mm, burns less than 1.0 mm, blood, and sites corresponding to healthy wound beds were accurately identified. These were the types of tissue that surgeons encounter when performing necrotic tissue removal.
さらに、上記の状態のいくつかについて、本明細書に記載の装置を用いて臨床試験を実施した。この試験の参加者は、心胸郭の手術後にイメージングされた。選定基準は、以下の通りであった。18歳以上;現在、心胸郭手術後の入院中であるか、またはその予定がある;除外対象でない大きさの創傷を有するか、または創傷の発生につながるリスクを有している。リスク因子には、循環不良、組織の機械的ストレス、温度、湿度、感染症、投薬、栄養、疾患、年齢、および体型が含まれていた。選定基準を満たす創傷としては、皮弁による創傷、熱傷による創傷、院内発生創傷、褥瘡潰瘍、足の糖尿病性潰瘍、および末梢血管機能不全の症例が含まれる。対象は、最長3か月間にわたって、定期的に実施される30分間のセッションにおいてイメージングされた。組織の変化の速度を監視するために、週に最高3回のイメージングを行った患者もあった。以下に、本試験で行われた観察の一部をまとめる。
本明細書に記載されるいくつかの代替案の特徴は、当該装置を、組織の状態の1以上の参照点を含む動的ライブラリと連結できることである。場合により、動的ライブラリは、健康な皮膚組織に関する情報を含む基点画像を含んでいてもよい。動的ライブラリは、さらに、創傷または皮膚疾患の進行および/または治癒を確認するための比較点として、創傷または皮膚疾患の様々な画像を含んでいてもよい。動的ライブラリは、さらに、正常心拍数、異常心拍数、ノイズ信号、健康組織に相当する信号、および不健康な組織に相当する信号のサンプル等、関連する信号のサンプル信号を含んでいてもよい。 A feature of some of the alternatives described herein is that the device can be linked to a dynamic library containing one or more reference points for the state of the tissue. Optionally, the dynamic library may include a baseline image containing information about healthy skin tissue. The dynamic library may further include various images of the wound or skin disease as a comparison point to confirm the progression and / or healing of the wound or skin disease. The dynamic library may further include sample signals of related signals, such as samples of normal heart rate, abnormal heart rate, noise signals, signals corresponding to healthy tissue, and signals corresponding to unhealthy tissue.
いくつかの代替案では、動的ライブラリ内の画像は、本明細書で記載される装置によって撮られた別の画像またはデータである。いくつかの代替案では、動的ライブラリは、本発明の態様ではない装置によって撮られた画像および/またはデータを含む。これらの画像は、対象を評価したり、または治療したりするために使用することができる。 In some alternatives, the image in the dynamic library is another image or data taken by the device described herein. In some alternatives, the dynamic library contains images and / or data taken by a device that is not an aspect of the invention. These images can be used to evaluate or treat the subject.
動的ライブラリの一例を図13に示す。図13において、イメージング装置1000は、クラウド1002に接続されている。イメージング装置1000は、本明細書で記載されるような装置であってもよく、動的ライブラリに接続された他の任意のコンピュータまたはユーザ装置であってもよい。場合により、クラウド1002は、複数のデータセンターを含むプログラム実行サービス(PES)を含んでいてもよく、各データセンターは1以上の仮想デスクトップを実行するよう構成可能な1以上の物理的コンピュータシステムを含み、各仮想デスクトップは1以上のアプリケーションを実行するよう構成可能なオペレーティングシステムを含むコンピュータ環境に関連付けられ、PESのユーザのコンピュータ装置は、ネットワークを介して各仮想デスクトップにアクセスすることができる。クラウドは、計算と記憶とを同期させるための他のアプローチを含んでもよい。 An example of the dynamic library is shown in FIG. In FIG. 13, the
データパス1004は、イメージング装置1000とクラウド1002との双方向接続を示す。クラウド1002自体が処理コンポーネント1006を有し、処理コンポーネント1006は、クラウド1002が信号を受信し、データを処理し、ソートアルゴリズムを実行し、動的ライブラリが1以上のコンピュータ装置と同期されるべきか否かを示すメタデータを生成するものである。
いくつかの代替案では、データ解析および分類はクラウド内で実行される。そのような解析は、得られた信号と比較するためのサンプル信号に関するデータの収集を含みうる。そのようなサンプリングは、得られた信号の組織部位を分類する際に使用することができる。他の代替案では、処理コンポーネントは、データ収集サイトでローカル処理を実行するために、イメージング装置1000に搭載されていてもよい。 In some alternatives, data analysis and classification is performed in the cloud. Such an analysis may include collecting data on the sample signal for comparison with the obtained signal. Such sampling can be used in classifying the tissue sites of the resulting signal. In another alternative, the processing component may be mounted on the
動的ライブラリのデータの収集と解析に加えて、処理コンポーネントは一般的な誤差データおよび計算結果を含んでいてもよい。誤差は、ローカルサイトで計算してクラウドに集約したり、クラウドで計算したりすることができる。状況によっては、特定の分類モデルの誤差閾値を確立することができる。閾値は、第一種過誤および第二種過誤(すなわち、偽陽性および偽陰性)の結果ならびに臨床的信頼性の基準を考慮したものである。 In addition to collecting and analyzing the data in the dynamic library, the processing components may include general error data and calculation results. The error can be calculated at the local site and aggregated in the cloud, or it can be calculated in the cloud. In some situations, an error threshold for a particular classification model can be established. The threshold takes into account the results of type I and type II errors (ie, false positives and false negatives) as well as criteria for clinical reliability.
処理コンポーネント1006は、また、データの解析を行ってもよい。クラウド1002はまた、データコンポーネント1008を有し、データコンポーネント1008は、動的ライブラリ自体の情報を含み、またアップデートを受け取る。データコンポーネント1008と処理コンポーネント1006は、互いに連結されている。 The
別のソースおよびレポジトリがクラウドに接続されていてもよい。この例では、エンティティ1012もまたクラウド1002に接続されている。エンティティ1012は、クラウド1002に接続されたシステム1000のような任意の装置またはシステムのシステム機能を向上させるためのアップデートおよびアルゴリズムを提供することのできるエンティティである。学習と経験を通じて各段階の方法をアップデートすることにより、全体の誤差を低減させてもよい。エンティティ1012は、複数の分類アルゴリズムの変更を同時に迅速に評価し、全体的な向上を図ってもよい。また、新たな臨床用途のための新たなデータセットおよびモデルをアップロードしてもよい。また、エンティティ1012は、システム1000、またはクラウド1002に接続された任意の装置またはシステムをアップデートして、例えば、凍傷を解析する等の新たな治療用途のためにデータを取得し、該データを解析することができる。このようにして機能を拡張し、科学的知識の向上にシステムを適応させることができる。 Different sources and repositories may be connected to the cloud. In this example,
さらに、本明細書に開示された様々な態様は、組織ファントムおよび動物モデルを用いた実験において、その有効性が実証されている。これらの実験により、本明細書の代替案は、少なくとも熱傷の治療に有効でありうることが実証された。以下の非限定的な実施例は、説明を目的として提示される。実施例は、実施した実験のさらなる詳細を提供するものである。
1.実験
1.1 実施例1:組織ファントムおよび動物モデルにおける、スポットライト照射およ び平面照射を使用した実験
1.1.1 材料および方法 In addition, the various aspects disclosed herein have been demonstrated to be effective in experiments with tissue phantoms and animal models. These experiments demonstrated that the alternatives herein could at least be effective in treating burns. The following non-limiting examples are presented for illustration purposes. The examples provide further details of the experiments performed.
1. 1. Experiment
1.1 Example 1: in tissues phantoms and animal models, using spotlight illumination and plane irradiation experiments
1.1.1 Materials and methods
この研究におけるPPGシステムは、3つの機能モジュール、すなわち、照射、センサー(CMOSカメラ)、およびイメージングターゲットからなる。照射モジュールおよびセンサーモジュールは、ターゲットに対して同じ側に配置される(すなわち反射モード;図14A−14C)。オブジェクトに入射する光ビームはターゲット内で散乱し、後方散乱された光信号がカメラによって捕捉される。不透明な媒質中に埋没したイメージングターゲットは経時的な変化を示し(すなわち、脈動性血流によって血管の容積が変化する)、後方散乱光の強度に変調が起きる。
1.1.1.a. 照射モジュール The PPG system in this study consists of three functional modules: irradiation, sensor (CMOS camera), and imaging target. The irradiation module and the sensor module are located on the same side with respect to the target (ie, reflection mode; FIGS. 14A-14C). The light beam incident on the object is scattered within the target, and the backscattered light signal is captured by the camera. Imaging targets buried in an opaque medium show changes over time (ie, pulsatile blood flow changes the volume of blood vessels), causing modulation in the intensity of backscattered light.
1.1.1. a. Irradiation module
3つの異なる照射モジュールを比較する:1)単一波長のLEDダイオードを用いたスポットライト照射;2)広いスペクトルのタングステン電球を用いた平面照射;3)高出力単一波長LEDエミッタを用いた平面照射。3つの照射モジュールには、時間当たりの強度振動が1%未満である高安定性DC電源によって電力が供給される。 Compare three different irradiation modules: 1) Spotlight irradiation with a single wavelength LED diode; 2) Plane irradiation with a wide spectrum tungsten bulb; 3) Plane with a high power single wavelength LED emitter Irradiation. The three irradiation modules are powered by a highly stable DC power supply with less than 1% intensity vibration per hour.
図14A−14Cは、反射モードで動作するベンチトップシステムを示す。図14Aのダイアグラム1400は単一波長LEDスポットライトを示し、図14Bのダイアグラム1401はタングステン電球を示し、図14Cのダイアグラム1402は高出力LEDエミッタを示す。照射下のオブジェクトは光学的に不透明な媒質であり、より不透明なオブジェクトが深さ=dに埋没している。
1.1.1.a.i. 単一LED 14A-14C show a benchtop system operating in reflection mode. Figure 1400 of FIG. 14A shows a single wavelength LED spotlight, Figure 1401 of FIG. 14B shows a tungsten bulb, and Figure 1402 of FIG. 14C shows a high power LED emitter. The object under irradiation is an optically opaque medium, and a more opaque object is buried at depth = d.
1.1.1. a. i. Single LED
850nmの単一LEDダイオード(例えば、KCL−5230H、Kodenshi
AUK)を、オブジェクトの表面(例えば、ダイアグラム1400)からの距離D1=18cmのCMOSカメラ(例えば、Nocturn XL、Photonis USA)と並べて固定した。LEDの全放射角12度は、センサーの視野内で、中心のずれた直径約3.8cmのスポットサークルを生成する。円形照射スポットの中心はFOV内にあるが、ターゲットの中心からわずかにずれている。
1.1.1.a.ii. タングステン電球 850 nm single LED diode (eg KCL-5230H, Kodenshi)
AUK) was fixed side by side with a CMOS camera (eg Nocturn XL, Photonis USA) at a distance D1 = 18 cm from the surface of the object (eg Diagram 1400). The total emission angle of the LED of 12 degrees creates a centered spot circle with a diameter of about 3.8 cm within the field of view of the sensor. The center of the circular irradiation spot is within the FOV, but is slightly offset from the center of the target.
1.1.1. a. ii. Tungsten bulb
タングステン−ハロゲン電球(例えば、ViP Pro−light、Lowel Inc.)を、オブジェクト(例えば、ダイアグラム1401)からの距離D2=60cmのカメラ(例えば、BM−141GE、JAI Inc)に隣接するよう取り付けた。電球の投影指向性を低減させ、より均一にターゲットを照らすために、擦りガラスディフューザ(例えば、モデル:iP−50、Lowel Inc.)を2枚、電球の正面に取り付けた。照射領域は、カメラのFOVよりも広く、照射の空間的均一性は、スポットLEDよりも良好であった。
1.1.1.a.iii. 高出力LEDエミッタ A tungsten-halogen bulb (eg, ViP Pro-light, Lowel Inc.) was mounted adjacent to a camera (eg, BM-141GE, JAI Inc) at a distance of D2 = 60 cm from the object (eg, Diagram 1401). Two frosted glass diffusers (eg, model: iP-50, Lowel Inc.) were attached to the front of the bulb to reduce the projection directivity of the bulb and illuminate the target more evenly. The irradiation area was wider than the FOV of the camera, and the spatial uniformity of irradiation was better than that of the spot LED.
1.1.1. a. iii. High power LED emitter
4つの高出力モノリシックLEDエミッタ(例えば、SFH4740、OSRAM)を、同軸モードでセンサー(例えば、Nocturn XL、Photonis USA)と同じ平面に取り付けられた2×2アレイに配置した。LEDエミッタアレイは、ターゲットの表面(例えば、ダイアグラム1420)からD3=30cmの位置に、カメラとともに配置された。空間強度の変化は15%未満に低減された。カメラのFOVは光学レンズによって制御され、照射領域よりもわずかに狭かった。
1.1.1.b. システムの構成 Four high power monolithic LED emitters (eg SFH4740, OSRAM) were placed in a 2x2 array mounted in the same plane as the sensors (eg Nocturn XL, Photonis USA) in coaxial mode. The LED emitter array was placed with the camera at D3 = 30 cm from the surface of the target (eg, diagram 1420). The change in spatial strength was reduced to less than 15%. The FOV of the camera was controlled by an optical lens and was slightly narrower than the irradiation area.
1.1.1. b. System configuration
LEDスポットライトまたはLEDエミッタを使用するシステムでは、モノクロCMOSカメラ(例えば、Nocturn XL、Photonis USA)を検出器として使用した。これは、暗騒音が低く、ダイナミックレンジ高いものである。10ビットのADC分解能によって得られる信号対ノイズ比は60dBである。タングステン光照射システムの場合、カメラ(例えば、BM−141GE、JAI Inc.)は、同等のダイナミックレンジ(58dB)およびNocturn XLカメラと同じ10ビットのADC分解能を提供する。これら2台のカメラで撮影された画像は、1280×1040(アスペクト比5:4)にトリミングされた。タングステン照射システムは、FOVを制御するために望遠レンズ(例えば、Distagon T*2.8/25 ZF−IR、Zeiss Inc.)を利用したが、これは、タングステン光のイメージング距離が、タングステン電球によって生じる熱のために、他の2つの構成よりも長いことによる。In systems using LED spotlights or LED emitters, monochrome CMOS cameras (eg, Nocturn XL, Photonis USA) were used as detectors. This has low background noise and a high dynamic range. The signal-to-noise ratio obtained with a 10-bit ADC resolution is 60 dB. For tungsten light irradiation systems, cameras (eg, BM-141GE, JAI Inc.) provide equivalent dynamic range (58 dB) and the same 10-bit ADC resolution as Nocturn XL cameras. Images taken by these two cameras were cropped to 1280 x 1040 (aspect ratio 5: 4). The tungsten irradiation system used a telephoto lens (eg, Distagon T * 2.8 / 25 ZF-IR, Zeiss Inc.) to control the FOV, because the imaging distance of the tungsten light was determined by the tungsten bulb. Due to the heat generated, it is longer than the other two configurations.
これら3つのシステム構成において、カメラは垂直下向きに、オブジェクトの表面に対面するよう取り付けた。システム間の比較のために、20×16cmの共通FOVの制御を行った。各システム構成におけるカメラの露出時間は、反射率参照標準(例えば、反射率95%の標準パネル;Spectralon SG3151、LabSphere Inc.)を用いて較正した。露出時間は、各カメラのダイナミックレンジの全範囲を利用するように調整された。
1.1.1.c. ファントム In these three system configurations, the cameras were mounted vertically downwards facing the surface of the object. A 20 × 16 cm common FOV was controlled for comparison between the systems. Camera exposure times in each system configuration were calibrated using a reflectance reference standard (eg, a standard panel with 95% reflectance; Spectralon SG3151, LabSphere Inc.). The exposure time was adjusted to take advantage of the full dynamic range of each camera.
1.1.1. c. phantom
図15は、ペトリ皿に入った組織ファントムと、ヒトの脈動血流をシミュレートするためのファントム装置とを示す。組織ファントム1500はペトリ皿の中にあり、この均質なファントムの下には弾性チューブがあり、皮膚の下の血流を模倣している。ファントム装置1501は、実験室内でヒトの脈動性血流をシミュレートするように設計されている。蠕動ポンプが運動流体を送り出し、ゼラチン−イントラリピッド組織状ファントムマトリックスの8.0mm下で脈動する弾性ファントム血管を通過させる。チューブの弾力性により、ヒトの動脈と同様、ファントム血管における約2%の容積膨張が、蠕動ポンプの各サイクルで生じる。 FIG. 15 shows a tissue phantom in a Petri dish and a phantom device for simulating human pulsatile blood flow. The
皮膚の表面下を流れる血液を模倣するように、組織状ファントムモデルを設計した。組織ファントムマトリックスは、Thatcherらに従って作製した(図15)。簡単に説明すると、トリス緩衝生理食塩水(例えば、pH7.4,Alfa Aesar)中の10(w/v)%のゼラチン(例えば、Bタイプ、JT Baker)を、滅菌したIntralipid脂肪乳剤(例えば、20(w/v)%、Baxter)と混合する。Intralipidの終濃度が20%となるように調節した。さらに、組織の吸収特性を模倣するよう、0.2%の運動標準(例えば、ポリスチレンビーズと墨汁との混合物)をゼラチンマトリックスに加えた。この混合物をペトリ皿(例えば、Novatech、直径150mm)に注ぎ、均質なバックグラウンド媒質を形成した。血管を模倣する内径1.58mmのSilasticチューブ(例えば、Dow−Corning)を、表面からd=8mm下に配置した。ポンプサイクルごとに、内径は約2%拡大するが、これは心臓周期における末梢動脈の直径の変化を模倣するものである。 A tissue phantom model was designed to mimic the blood flowing beneath the surface of the skin. Tissue phantom matrices were made according to Thatcher et al. (Fig. 15). Briefly, 10 (w / v)% gelatin (eg, B type, JT Baker) in Tris buffered saline (eg, pH 7.4, Alfa Aesar) is sterilized in an Intralipid fat emulsion (eg, eg). Mix with 20 (w / v)%, Baxter). The final concentration of Intralipid was adjusted to 20%. In addition, 0.2% exercise standard (eg, a mixture of polystyrene beads and ink) was added to the gelatin matrix to mimic the absorption properties of the tissue. The mixture was poured into a Petri dish (eg Novatech,
脈動性心臓周期を模倣するために、チューブ内の吸収性血液状流体を、40ヘルツの2ローラー蠕動ポンプ(例えば、Watson Marlow、Model#sciQ32)によって送り出した。これは、ヒトの正常な心拍数80bpmを模倣している(図15)。ファントム血管を通るこの脈動流がPPG信号を生成し、PPGイメージング装置による測定の対象となる。
1.1.1.d. 動物モデル To mimic the pulsating cardiac cycle, the resorbable blood fluid in the tube was pumped by a 40 Hz 2-roller peristaltic pump (eg, Watson Marlow, Model # sciQ32). This mimics the normal human heart rate of 80 bpm (Fig. 15). This pulsatile flow through the phantom blood vessels produces a PPG signal, which is the subject of measurement by a PPG imaging device.
1.1.1. d. Animal model
図16は、円形状の動物の皮膚におけるインビボ熱傷と壊死組織除去術モデルを示す。ハンフォードブタは、その皮膚がヒトの皮膚と解剖学的に類似していることから、動物モデルとして選択された。このブタの表皮の厚さは30〜40μmであり、これはヒトの表皮の50〜120μmに近い。さらに、血管構造および細胞外マトリックス組成物が、ヒトの皮膚と似ている。この動物の取り扱いは、「実験動物の人道的取り扱いと使用に関する公衆衛生局(PHS)方針」に従った。処置は、設備の整った大動物手術室で実施した。この熱傷モデルおよび研究プロトコルは、動物実験委員会(IACUC)によって承認された。 FIG. 16 shows an in vivo burn and necrotic tissue removal model in circular animal skin. The Hanford pig was selected as an animal model because its skin is anatomically similar to human skin. The thickness of the epidermis of this pig is 30-40 μm, which is close to 50-120 μm of the human epidermis. In addition, the vascular structure and extracellular matrix composition resembles human skin. The handling of this animal was in accordance with the "Public Health Service (PHS) Policy on the Humane Handling and Use of Laboratory Animals". The procedure was performed in a well-equipped large animal operating room. This burn model and research protocol was approved by the Animal Care and Use Committee (IACUC).
温度と圧力を制御した黄銅棒を用いて、熱傷モデルを準備した。黄銅棒をオーブンに入れて100℃に加熱し、ブタの背中の皮膚に0.2kg/cm2の圧力で60秒間押し付けた。この方法により、深達性中間層熱傷が生じた。創傷部位は、直径3.6cmの深達性中間層熱傷を含んでいた(図16)。照射の均一性およびPPG信号強度を比較するために、各イメージングシステムを用いて、熱傷の画像を収集した。
1.1.1.e. 画素による比較 A burn model was prepared using a brass rod with controlled temperature and pressure. The brass rod was placed in an oven, heated to 100 ° C., and pressed against the skin on the back of the pig at a pressure of 0.2 kg / cm 2 for 60 seconds. This method resulted in deep intermediate burns. The wound site contained a deep-seated intermediate burn with a diameter of 3.6 cm (Fig. 16). Images of burns were collected using each imaging system to compare irradiation uniformity and PPG signal intensity.
1.1.1. e. Pixel comparison
図17は、時間分解されたPPG信号の抽出を示す。ダイアグラム1700は、800個の偶発フレームから順次抽出された画素(x,y)における強度を示す。ダイアグラム1701は、PPG信号を定量化するための処理方法を示す。 FIG. 17 shows the extraction of time-resolved PPG signals. Diagram 1700 shows the intensities at pixels (x, y) sequentially extracted from 800 contingent frames. Diagram 1701 shows a processing method for quantifying the PPG signal.
1秒当たり30フレームのフレームレートで、800枚の一連の画像を取得し、非圧縮のTIFFファイルとして保存した。PPG信号強度は、画素ごとに計算した。PPG信号および画像を処理するための重要なステップは、次の通りである(図17)。(1)DCワンダリングを除去する、トレンド除去;(2)データ量を縮小するための、時間ドメインにおけるダウンサンプリング;(3)信号のフィルタリング;(4)時間分解信号を周波数ドメインに変換する高速フーリエ変換(FFT);(5)スペクトルパワー、特に心拍数に相当する周波数におけるスペクトルパワーの抽出;(6)高周波数帯域(ノイズとみなす)における強度の合計に対する心拍帯域における強度の合計の比を信号対ノイズ比(SNR)として計算;(7)PPG画像出力では、カラーマップを使用して、各画素のPPG SNRを表示。その色は、単一の画像内で最低の信号から最高の信号まで直線的にマッピングされている。 A series of 800 images was acquired at a frame rate of 30 frames per second and saved as an uncompressed TIFF file. The PPG signal strength was calculated for each pixel. The important steps for processing PPG signals and images are as follows (Fig. 17). (1) Eliminate DC wandering, detrend; (2) Downsampling in time domain to reduce data volume; (3) Signal filtering; (4) Fast conversion of time-resolved signal to frequency domain Fourier transform (FFT); (5) Extraction of spectral power, especially spectral power at frequencies corresponding to heart rate; (6) Ratio of total intensity in heartbeat band to total intensity in high frequency band (considered as noise) Calculated as signal-to-noise ratio (SNR); (7) In PPG image output, the PPG SNR of each pixel is displayed using a color map. The colors are linearly mapped from the lowest signal to the highest signal in a single image.
信号処理は、MATLAB(バージョン2014a,MathWorks,Inc.,USA)を用いて行った。
1.1.2. 結果
1.1.2.a. 照射パターンの評価 Signal processing was performed using MATLAB (version 2014a, MathWorks, Inc., USA).
1.1.2. result
1.1.2. a. Evaluation of irradiation pattern
3つの照射モジュールの光パターンを特徴付けるために、拡散反射パネル(SPECTRALON(登録商標),LabSphere Inc.)をカメラおよび光源の下に配置した。パネル面はカメラに対して垂直とした。 Diffuse panels (SPECTRALON®, LabSphere Inc.) were placed under the camera and light source to characterize the light patterns of the three irradiation modules. The panel surface was perpendicular to the camera.
図18A−18Cは、平坦な反射パネルをイメージングターゲットとして用いた場合の、LEDスポットライト(不均一照射)(図18Aの画像1800)と、タングステン光(均一照射)(図18Bの画像1801)と、LEDエミッタ(改善された均一照射)(図18Cの画像1802)との空間照射強度の比較を示す。 18A-18C show LED spotlight (non-uniform irradiation) (
照射パターンの画像は、3つの照射モジュール間で異なっていた(図18)。LEDスポットライトの反射パターン(画像1800)では、FOV内に非常に明るいスポットがあり、高輝度領域であることを示すが、その周囲の領域は、光源から遠ざかるほど暗くなっている。単一のLEDを使用すると、LEDエンクロージャ構造の存在に起因するさらなる影がターゲット上に現れる。影の存在は、照射の均一性をさらに低下させる。タングステン光(画像1801)を用いると、照射パターンはスポット照射よりも均一になり、FOV内の影の影響は除去された。LEDエミッタ(画像1802)では、照射強度の差は最小であることが観察された。空間的変動は15%未満に制御され、時間的安定性もよく制御されて、変動は1%未満であった。 The image of the irradiation pattern was different among the three irradiation modules (FIG. 18). The reflection pattern of the LED spotlight (image 1800) indicates that there is a very bright spot in the FOV, which is a high brightness region, but the surrounding region becomes darker as the distance from the light source increases. With a single LED, additional shadows due to the presence of the LED enclosure structure will appear on the target. The presence of shadows further reduces the uniformity of irradiation. When tungsten light (image 1801) was used, the irradiation pattern became more uniform than spot irradiation, and the influence of shadows in the FOV was eliminated. With the LED emitter (image 1802), it was observed that the difference in irradiation intensity was minimal. Spatial variability was controlled to less than 15%, temporal stability was well controlled, and variability was less than 1%.
図19は、3つの照射パターン間の強度プロファイル線の比較を示す。SPECTRALON(登録商標)パネルからの、スポットライト(画像1800参照)、タングステン光(画像1801参照)、およびLEDエミッタ光(画像1802参照)における対角強度プロファイル線である。 FIG. 19 shows a comparison of intensity profile lines between the three irradiation patterns. Diagonal intensity profile lines in spotlight (see image 1800), tungsten light (see image 1801), and LED emitter light (see image 1802) from a SPECTRALON® panel.
これら3つの照射パターンを横切る対角強度プロフィル線は、強度の変動を際立たせるものである(図19)。スポットライトのFOVが、スポット領域(平坦な最上部)、周囲の薄暗いリム(肩部)を実際の有効領域として、また有用性の低い離れた領域にも彩度を得るためには、フルダイナミックレンジのカメラ(例えば、10ビット、強度値0〜1024の)を必要とすることは明らかである。タングステン光とLEDエミッタ光は、空間的な均一性を向上させ、高ダイナミックレンジのカメラを用いる必要性を低減する。
1.1.2.b. ファントムにおける結果 Diagonal intensity profile lines that cross these three irradiation patterns accentuate the variation in intensity (FIG. 19). The FOV of the spotlight is fully dynamic in order to saturate the spot area (flat top), the surrounding dim rim (shoulder) as the actual effective area, and even in less useful distant areas. It is clear that a range camera (eg, 10 bits, intensity values 0-1024) is required. Tungsten light and LED emitter light improve spatial uniformity and reduce the need to use high dynamic range cameras.
1.1.2. b. Results in the phantom
図20A−20Cは、LEDスポットライト(図20Aの画像2000)、タングステン光(図20Bの画像2001)、およびLEDエミッタ(図20Cの画像2002)を使用して、組織ファントムおよびその下にある脈動性ファントム血管をイメージングした結果を示す。イメージング結果に、ファントムの画像を重ねている。 20A-20C uses an LED spotlight (
組織状のファントムイメージングターゲットを、これら3つの照射モジュールの下に置き、慎重に制御されたベンチテストを行って、照射強度の変動および照射パターンの、PPG信号に対する影響を調べた(図20)。LEDスポットライト(画像2000)の場合、ファントム血管は視野の薄暗い領域に配置された。全体的に、ファントム血管の位置を判別することができた。ファントム血管の位置は正確であり、実験した配置とよく一致する。しかしながら、ファントム血管(左端)がスポット中心(FOVの左上隅)に近づくにつれてイメージング結果は徐々に薄れ、一方、他端に向かっては、照射強度が視野の端に沿って低下するにつれてファントム血管の幅が広くなっている。ペトリ皿の縁が周縁部に暗い影を落として有効FOVを減じ、ユーザが画像を解釈することが困難になる。 Tissue phantom imaging targets were placed under these three irradiation modules and carefully controlled bench tests were performed to examine the effects of irradiation intensity variation and irradiation patterns on the PPG signal (FIG. 20). In the case of the LED spotlight (Image 2000), the phantom vessels were placed in a dim region of the field of view. Overall, the location of the phantom blood vessels could be determined. The location of the phantom vessels is accurate and is in good agreement with the experimental arrangement. However, as the phantom vessel (left end) approaches the center of the spot (upper left corner of the FOV), the imaging results gradually fade, while towards the other end, as the irradiation intensity decreases along the edge of the field of view, the phantom vessel The width is wide. The edges of the Petri dish cast a dark shadow on the periphery, reducing the effective FOV, making it difficult for the user to interpret the image.
タングステン光の照射(画像2001)の場合、入射ビームは、カメラの軸からわずかに離れる方向に向かい、小さな入射角が生じる。次いで、タングステン電球の指向性により、ファントムの表面にわずかに光沢のある(すなわち、鏡面反射)領域ができる。この効果が画素を飽和させ、PPG信号の検出を妨げる。ファントム血管の位置は、その真の位置からずれる。加えて、タングステン光源から放出される光は、その大部分が赤外光であるため、オブジェクトの内部で大量の熱が発生し、ゼラチン質の組織状ファントムを急速に変性させる。表面の温度は、室温から急速に上昇し、30分間で30〜40℃に達する(ここでは示さず)。 In the case of tungsten light irradiation (image 2001), the incident beam is directed slightly away from the camera axis, resulting in a small incident angle. The directivity of the tungsten bulb then creates a slightly glossy (ie specular) region on the surface of the phantom. This effect saturates the pixels and interferes with the detection of PPG signals. The position of the phantom vessel deviates from its true position. In addition, since most of the light emitted from the tungsten light source is infrared light, a large amount of heat is generated inside the object, which rapidly denatures the gelatinous tissue phantom. The surface temperature rises rapidly from room temperature, reaching 30-40 ° C in 30 minutes (not shown here).
高出力LEDエミッタ照射(画像2002)の場合、イメージング結果のカラー出力は連続的であり、ファントム血管の幅は一定に保たれた。PPG信号の位置は、ファントム血管の実際の位置と一致している。画像のコントラストは適切であった。これはタングステン光およびスポットライトよりも画質が優れていることを示している。また、ファントム内での熱の蓄積はなかった。30分間の温度変化は0.1℃未満であり、これは無視できる。 In the case of high power LED emitter irradiation (image 2002), the color output of the imaging result was continuous and the width of the phantom vessel was kept constant. The position of the PPG signal coincides with the actual position of the phantom vessel. The contrast of the image was appropriate. This shows that the image quality is superior to that of tungsten light and spotlights. In addition, there was no heat accumulation in the phantom. The temperature change for 30 minutes is less than 0.1 ° C, which is negligible.
3つの照射方法の評価に続いて、ファントムモデルを照射強度試験に供し、測定されたPPG信号の強度に対する照射強度の影響を調べた。この研究の目的は、視野全体の照射の均一性に加えて照射強度も最大にする必要があることの実証であった。組織状ファントム装置と、高出力LEDエミッタ照射を有するDeepViewシステムと組み合わせて用い、LEDエミッタへの入力電圧を変化させることによって入射光の強度条件が様々に変化するよう制御して、ベンチテストを実施した。入力電圧を変化させることによって、イメージング装置が正確に解像できる最大絶対放射照度を示す飽和点まで、照射強度を上げることができた。この飽和点に達したのは、エミッタへの入力電圧が12.95Vの時点であったが、これは絶対放射照度値としては約0.004W/m2に相当する。この飽和点は、最大値の20%の増分で強度閾値を確立するための基準として用いられた。Following the evaluation of the three irradiation methods, a phantom model was subjected to an irradiation intensity test to examine the effect of the irradiation intensity on the measured intensity of the PPG signal. The purpose of this study was to demonstrate that the irradiation intensity should be maximized in addition to the irradiation uniformity over the entire field of view. A bench test was conducted by using a tissue phantom device in combination with a DeepView system having high-power LED emitter irradiation and controlling the intensity conditions of incident light to change variously by changing the input voltage to the LED emitter. did. By changing the input voltage, the irradiation intensity could be increased to the saturation point showing the maximum absolute irradiance that the imaging device could accurately resolve. This saturation point was reached when the input voltage to the emitter was 12.95 V, which corresponds to an absolute irradiance value of about 0.004 W / m 2 . This saturation point was used as a reference for establishing an intensity threshold in increments of 20% of the maximum value.
図21は、組織状ファントムの脈動部位におけるPPG信号のパワースペクトル密度と、イメージング装置の飽和点(放射照度0.004W/m2)以下でのLEDエミッタモジュールからの光の最大強度のパーセンテージとの関係を示す。データポイントは、3つの組織状ファントムレプリカからサンプリングされた5画素の平均値を反映している。対数回帰(R2=0.9995)であり、エラーバーは平均値に対する標準偏差を表す。FIG. 21 shows the power spectral density of the PPG signal at the pulsating site of the tissue phantom and the percentage of the maximum intensity of light from the LED emitter module below the saturation point of the imaging device (irradiance 0.004 W / m 2). Show the relationship. The data points reflect the average of 5 pixels sampled from 3 tissue phantom replicas. It is a logarithmic regression (R 2 = 0.9995), and the error bar represents the standard deviation with respect to the mean value.
照射レベル0%から100%のそれぞれにおいて画像を記録し、DeepView独自のアルゴリズムで処理した(図17)。処理した画像からの情報を利用して、いくつかの画素を、ファントムチューブに沿った高脈動部位から手動で選択した。選択した画素を抽出し、個々に処理して、兆候を示しているそれらの点におけるPPG信号の強度を決定した。PPG信号の強度を評価するために使用した尺度は、周波数間の信号電力の分布の指標であるパワースペクトル密度(PSD)であった。この脈動周波数でのパワースペクトル密度について、サンプル間、レベル間での比較を行い、検討した。このプロセスを、3つのファントムの複数の画素について繰り返した。すなわち、各レベルでサンプリングを行い、PSD値は、各レベルの値が反映されるよう平均値を求めた(図21)。その結果、受信したPPG信号の強度は強度値の全域にわたって常に増加し、明確な対数傾向を示している。 Images were recorded at each irradiation level of 0% to 100% and processed by DeepView's proprietary algorithm (FIG. 17). Using information from the processed images, some pixels were manually selected from the high pulsation sites along the phantom tube. Selected pixels were extracted and processed individually to determine the strength of the PPG signal at those points showing signs. The scale used to assess the strength of the PPG signal was the power spectral density (PSD), which is an indicator of the distribution of signal power between frequencies. The power spectral density at this pulsation frequency was examined by comparing between samples and levels. This process was repeated for multiple pixels of the three phantoms. That is, sampling was performed at each level, and the average value of the PSD value was calculated so as to reflect the value of each level (FIG. 21). As a result, the intensity of the received PPG signal constantly increases over the entire intensity value, showing a clear logarithmic tendency.
これらの結果から、照射強度の最大化が重要なパラメータであることが示され、また、辺縁に沿った暗い部位は有用なPPG信号の信号強度の損失を引き起こすため、視野全体にわたる均一な照射が必要であることが確認された。
1.1.2.c. 動物における結果 These results indicate that maximizing irradiation intensity is an important parameter, and that dark areas along the edges cause loss of signal intensity for useful PPG signals, resulting in uniform irradiation over the entire field of view. Was confirmed to be necessary.
1.1.2. c. Results in animals
図22は、PPG信号強度に基づく、健康なブタの皮膚における部位内の画素の分類を示す。画像2201およびグラフ2202は、LEDスポット照射(画像2200に示す)の結果である。画像2204およびグラフ2205は、LEDエミッタ照射(画像2203)の結果を反映するものである。 FIG. 22 shows the classification of pixels within a site in healthy porcine skin based on PPG signal intensity.
LEDスポットおよびLEDチップを照射源として用いて、ブタの皮膚に入射する光の強度を測定した。LEDスポット照射の場合、光が組織に入射した部位の画素は完全に飽和していた(画像2200参照)。画像中の残りの画素における照射は、カメラの感度範囲の50%以下であった。一方、全視野照射では、イメージング領域のブタの皮膚の大部分が、カメラの感度範囲の70〜90%という多量の光を反射していることがわかる(画像2203参照)。飽和している画素はほとんどなく、真っ暗な画素は全くない。LEDエミッタの均一性により、照射強度の変動がよく抑制され、隣り合う画素間での比較が可能なPPG信号を得ることが期待される。 Using LED spots and LED chips as irradiation sources, the intensity of light incident on the skin of pigs was measured. In the case of LED spot irradiation, the pixels at the site where the light was incident on the tissue were completely saturated (see image 2200). Irradiation on the remaining pixels in the image was less than 50% of the sensitivity range of the camera. On the other hand, in full-field irradiation, it can be seen that most of the pig skin in the imaging region reflects a large amount of light, which is 70 to 90% of the sensitivity range of the camera (see image 2203). There are few saturated pixels and no black pixels at all. Due to the uniformity of the LED emitter, fluctuations in irradiation intensity are well suppressed, and it is expected to obtain a PPG signal that can be compared between adjacent pixels.
一様なLEDチップ照射方式によって得られる血流が比較により有利であることを確認するために、LEDスポットライトタイプから得たPPG信号およびLEDエミッタ照射タイプから得たPPG信号について検討した。この検討のために、血流が全体にわたって均一であると推定可能な、1種類の均一な組織からなるブタ皮膚の一領域について評価を行った。この組織の種類としては、健康な皮膚を選択した。健康な皮膚であれば、ブタの背中の広い範囲で容易に得ることができ、この組織に存在する血流は、ブタの背中のどの点においても同様である可能性が高いからである。予想通り、均一な照射を行うことで、出力画像における健康な皮膚からのPPG信号もより均一に現れることがわかった。目的の部位(画像2201および2204の枠内)からのPPG信号をヒストグラムとしてプロットしたところ、均一照射を使用した場合、PGG信号の分布はよりガウス分布に近くなり、この部位から収集されたPPG信号を欠く画素はないことがわかる。LEDスポット照射の構成(図22)では、PPG信号を収集しない画素が多く、PPG信号を有する組織部位は散在的かつ不均一であった。医師がこのデータを解釈するのは困難であろう。 In order to confirm that the blood flow obtained by the uniform LED chip irradiation method is more advantageous in comparison, the PPG signal obtained from the LED spotlight type and the PPG signal obtained from the LED emitter irradiation type were examined. For this study, an area of porcine skin consisting of one type of uniform tissue, where blood flow can be estimated to be uniform throughout, was evaluated. Healthy skin was selected as the type of tissue. Healthy skin can be easily obtained over a wide area of the pig's back, as the blood flow present in this tissue is likely to be similar at any point on the pig's back. As expected, it was found that with uniform irradiation, the PPG signal from healthy skin in the output image also appeared more uniformly. When the PPG signal from the target site (within the frame of
創傷内の血流は治癒および組織生存率の評価における重要な因子であることから、動物の熱傷モデルを用いて、これらの照射パターンを熱傷の評価に適用することの妥当性を評価した。中間層熱傷では、組織全体に血液を運ぶ動脈構造に損傷がある。この損傷部位には、血流がほとんどあるいは全くないことが予想される。したがって、熱傷を受けた皮膚からは、PPG信号がほとんどあるいは全く得られないであろう。 Since intra-wound blood flow is an important factor in assessing healing and tissue survival, animal burn models were used to assess the adequacy of applying these irradiation patterns to the assessment of burns. In middle layer burns, there is damage to the arterial structure that carries blood throughout the tissue. It is expected that there will be little or no blood flow at this site of injury. Therefore, little or no PPG signal will be obtained from burned skin.
図23A−23Fは、ブタの皮膚上の熱傷への様々な照射パターンおよび対応する画像を示す。具体的に言えば、図23A−23Cは、LEDスポットライト(図23A)、タングステン光(図23B)、およびLEDエミッタ光(図23C)を用いた照射パターンを示している。対応するイメージング結果(例えば、図23D−23F)はそれぞれ、熱傷および健康な組織を検出する性能を示す。 23A-23F show various irradiation patterns and corresponding images of burns on the skin of pigs. Specifically, FIGS. 23A-23C show an irradiation pattern using an LED spotlight (FIG. 23A), a tungsten light (FIG. 23B), and an LED emitter light (FIG. 23C). Corresponding imaging results (eg, FIGS. 23D-23F) show the ability to detect burns and healthy tissue, respectively.
LEDスポット照射(図23A)の場合、ファントム実験と同様、熱傷は照射スポットの中心から4.0cm離れていた。熱傷の円の半分は薄暗い周縁部にあり、残りの半分は画像の暗い領域にあった。イメージング結果(図23D)では、円形の熱傷領域の端部はなお判読可能であるが、中心部は周囲の健康な皮膚組織と区別がつかない。この画像において、照射が組織に直接入射する部位は完全に飽和し、PPG信号は検出されなかった。同様に、光スポットとは対照的な周辺部位は、暗過ぎるためイメージング装置による評価ができない。暗領域およびスポット領域内にあるこれらの非熱傷組織では、生理学的に健康な組織であるにもかかわらず、イメージング結果に血流信号は現れない。 In the case of LED spot irradiation (FIG. 23A), the burn was 4.0 cm away from the center of the irradiation spot, as in the phantom experiment. Half of the burn circle was on the dim margin and the other half was on the dark area of the image. Imaging results (FIG. 23D) show that the edges of the circular burn area are still readable, but the center is indistinguishable from the surrounding healthy skin tissue. In this image, the site where the irradiation was directly incident on the tissue was completely saturated and no PPG signal was detected. Similarly, the peripheral area, as opposed to the light spot, is too dark to be evaluated by an imaging device. These non-burned tissues in the dark and spot areas do not show blood flow signals in the imaging results, despite being physiologically healthy tissue.
タングステン光照射モジュール(図23B)では、FOVはほぼ均一に照射された。イメージング結果(図23E)では、熱傷の端部、形状、および領域が解像された。SNRコントラストも適切であり、照射によって周囲の健康な組織から十分なPPG信号が得られることがわかる。入射ビームの指向性のため、FOVの右半分の照射強度は左半分よりも弱い。それに応じて、イメージング結果(図23E)において、画像の右半分は左半分よりもSNRコントラストが高く、血液灌流に関して、FOVの右半分は左半分よりも生存率が高いという誤った解釈が誘導される。 In the tungsten light irradiation module (FIG. 23B), the FOV was irradiated almost uniformly. Imaging results (FIG. 23E) resolved the edges, shapes, and areas of the burn. It can be seen that the SNR contrast is also appropriate and that irradiation provides a sufficient PPG signal from the surrounding healthy tissue. Due to the directivity of the incident beam, the irradiation intensity of the right half of the FOV is weaker than that of the left half. Correspondingly, in the imaging results (FIG. 23E), the right half of the image has a higher SNR contrast than the left half, leading to a misinterpretation that the right half of the FOV has a higher survival rate than the left half for hemoperfusion. To.
LEDエミッタモジュール(図23C)の場合、FOV内の照射はタングステン光源よりも均一であり、PPG画像もさらに良好になっている。イメージング結果(図23F)は、実際の組織に対応する熱傷の端部、形状、および領域を示している。イメージング結果において、熱傷の周囲の健康な組織も均質な画像として示され、熱傷部位との対比は明らかである。画像の最下部では、剃り残された毛の端部が線として画像の結果に現れているが、毛の下の健康な組織(血液灌流を伴う)はなお、均質な背景と同じコントラストを示している。
1.1.3. 結論 In the case of the LED emitter module (FIG. 23C), the irradiation in the FOV is more uniform than that of the tungsten light source, and the PPG image is even better. Imaging results (FIG. 23F) show the edges, shapes, and areas of burns that correspond to the actual tissue. In the imaging results, the healthy tissue around the burn is also shown as a homogeneous image, and the contrast with the burn site is clear. At the bottom of the image, the edges of the unshaved hair appear as lines in the image results, but the healthy tissue under the hair (with hemoperfusion) still shows the same contrast as the homogeneous background. ing.
11.3. Conclusion
照射機能は、PPGシステムにおいて重要な役割を果たす。この研究は、LEDスポットライト、タングステン光、およびLEDエミッタアレイを使用して、PPGイメージングにおける強度と均一性を含む照射の違いを調べるものである。組織状ファントムに基づく予備評価ではPPG信号が照射強度の関数であることが示されており、イメージング設定において正確なPPG信号を得るには、均一な照射が理想的であるように思われる。動物モデルでは、照射強度の変化が、生理学的に類似性の高い領域である健康な皮膚組織から受信されるPPG信号に影響を与えることを示し、組織のファントムでの結果を確認した。熱傷の存在下では、組織の損傷により血流が弱まっているため、PPG信号の低減が予想される。均一照射はさらに、熱傷領域の検出精度向上という点においても、他の2つのパターンよりも有利である。タングステン光およびLED光は、いずれも均一な照射パターンをもたらすが、LED光源は、臨床環境において他にも多くの利点を有している。ターゲットの表面に大きな温度変化をもたらさず、信頼性が高く、電力要件は低い。患者の血液灌流の評価を行うことができるPPGイメージング装置のような、高感度、非侵襲、かつ安全な装置は、創傷ケア環境における臨床医にとって非常に価値があると考えられる。視野全体で高強度かつ均一な光を達成する能力がより高い、本明細書で提示するエミッタアレイのような照射モジュールを用いれば、これらの臨床用途は、PPGイメージング技術によって正確かつ精度高く実現されるであろう。
1.2. 実施例2:ブタ熱傷モデルを用いた壊死組織除去における、マルチスペクトル イメージングによる順次特徴付けに関する実験 The irradiation function plays an important role in the PPG system. This study uses LED spotlights, tungsten light, and LED emitter arrays to examine differences in irradiation, including intensity and uniformity, in PPG imaging. Preliminary evaluations based on histological phantoms have shown that the PPG signal is a function of irradiation intensity, and uniform irradiation seems ideal for obtaining accurate PPG signals in imaging settings. In animal models, changes in irradiation intensity were shown to affect the PPG signal received from healthy skin tissue, a region of physiological similarity, confirming the results in the tissue phantom. In the presence of burns, tissue damage weakens blood flow and is expected to reduce the PPG signal. Uniform irradiation is also more advantageous than the other two patterns in terms of improving the detection accuracy of the burned area. Although both tungsten light and LED light provide a uniform irradiation pattern, LED light sources have many other advantages in a clinical environment. It does not cause large temperature changes on the surface of the target, is reliable, and has low power requirements. A sensitive, non-invasive, and safe device, such as a PPG imaging device that can assess a patient's hemoperfusion, would be of great value to the clinician in a wound care environment. These clinical applications are accurately and accurately realized by PPG imaging technology using irradiation modules such as the emitter array presented herein, which are more capable of achieving high intensity and uniform light over the entire field of view. Will be.
1.2. Example 2: Experiment on sequential characterization by multispectral imaging in necrotic tissue removal using a porcine burn model
ブタの熱傷モデルを用いて、様々な重症度の中間層熱傷について調べた。ミニブタの背中に4×4cmの熱傷を8つ作製した。4つの熱傷はそのまま試験に供し、他の4つは接線方向に順次切除を行った。400〜1000nmの波長で、これらの熱傷部位のイメージングを行った。 A porcine burn model was used to investigate intermediate-layer burns of varying severity. Eight 4 x 4 cm burns were made on the back of the mini pig. The four burns were used as they were for the test, and the other four were resected tangentially. Imaging of these burn sites was performed at wavelengths of 400-1000 nm.
組織構造によって、様々な中間層熱傷が得られたことを確認した。スペクトル画像の解析から、MSIが、健康な組織、浅達性中間層熱傷、および深達性中間層熱傷のスペクトルプロファイルにおける顕著な差異を検出することがわかる。515nm、542nm、629nm、および669nmの吸収スペクトルは、浅達性中間層熱傷と深達性中間層熱傷との識別において最も正確であり、972nmの吸収スペクトルは、壊死組織除去プロセスのガイドにおいて最も正確であった。 It was confirmed that various intermediate layer burns were obtained depending on the tissue structure. Analysis of the spectral images reveals that MSI detects significant differences in the spectral profiles of healthy tissue, superficial middle layer burns, and deep middle layer burns. Absorption spectra at 515 nm, 542 nm, 629 nm, and 669 nm are the most accurate in distinguishing between superficial and deep intermediate burns, and 972 nm absorption spectra are most accurate in guiding the necrotic tissue removal process. Met.
非専門家が様々な重症度の中間層熱傷を識別し、患者に外科手術が必要か否かを評価する能力は、臨床環境におけるMSI装置の使用により改善できる可能性がある。
1.2.1. 材料および方法 The ability of non-professionals to identify intermediate-layer burns of varying severity and assess whether a patient requires surgery may be improved by the use of MSI devices in a clinical environment.
1.2.1. Materials and methods
この動物実験で用いた方法は、Branskiら、Gurfinkelら、およびSingerらの方法の変法であった。この熱傷モデルおよび研究プロトコルは、動物実験委員会(IACUC)によって承認された。
1.2.1.a. 熱傷モデルおよび研究のプロトコル The method used in this animal experiment was a modification of the method of Branski et al., Gurfinkel et al., And Singer et al. This burn model and research protocol was approved by the Animal Care and Use Committee (IACUC).
1.2.1. a. Burn model and research protocol
体重47.5kgの雄性ハンフォードミニブタの成体(月齢7.2)を使用した。この動物の取り扱いは、「実験動物の人道的取り扱いと使用に関する公衆衛生局方針」に従った。処置は、設備の整った大動物手術室で実施した。このミニブタを、麻酔前に一晩絶食させた。麻酔は、テラゾール(約2.2mg/kg,IM)とキシラジン(約0.44mg/kg,IM)の併用により誘導した。動物に挿管し、イソフルラン(0.1〜5%、100%酸素と混合)を用いて麻酔を維持した。実験中に監視および記録を行ったバイタルサインとしては、心拍数、血圧、呼吸数、およびPPG波形が挙げられる。実験の終わりに、ペントバルビタールナトリウム(390mg/mL)を1.0mL/4.5kg体重の最小用量で用い、動物を安楽死させた。 An adult male Hanford mini pig (age 7.2) weighing 47.5 kg was used. The handling of this animal was in accordance with the Public Health Service Policy on the Humane Handling and Use of Laboratory Animals. The procedure was performed in a well-equipped large animal operating room. The mini pig was fasted overnight before anesthesia. Anesthesia was induced by the combined use of tetherazole (about 2.2 mg / kg, IM) and xylazine (about 0.44 mg / kg, IM). Animals were intubated and anesthesia was maintained with isoflurane (0.1-5%, mixed with 100% oxygen). Vital signs monitored and recorded during the experiment include heart rate, blood pressure, respiratory rate, and PPG waveforms. At the end of the experiment, animals were euthanized using pentobarbital sodium (390 mg / mL) at a minimum dose of 1.0 mL / 4.5 kg body weight.
100℃に設定された金属アルミニウム棒を用いて、ミニブタの背中に4×4cmの熱傷を8つ作製した。加熱した棒を当てる時間を変えることにより、様々な深さの熱傷を得た:健康な皮膚(0秒);浅達性中間層熱傷(30秒);深達性中間層熱傷1(DPT1;45秒);深達性中間層熱傷2(DPT2;90秒)。各タイプにつき2つの熱傷を作製し、4つを1ブロックとし、2つのブロックが隣接するようにした。図24は、ブタの背中の熱傷の位置を示す。数字はブロックを表し、文字は処置を表す(「1」はブロックI、「2」はブロックII、「a」は対照、「b」はSPT、「c」はDPT1、「d」はDPT2)。図25は、ブロックI(左)およびブロックII(右)における組織の大きさを示す。 Eight 4 × 4 cm burns were made on the back of the mini pig using a metal aluminum rod set at 100 ° C. Burns of various depths were obtained by varying the time of application of the heated rod: healthy skin (0 seconds); superficial middle layer burns (30 seconds); deep middle layer burns 1 (DPT1; 45 seconds); deep intermediate burn 2 (DPT2; 90 seconds). Two burns were made for each type, four were one block and two blocks were adjacent. FIG. 24 shows the location of burns on the back of a pig. Numbers represent blocks, letters represent treatments ("1" is block I, "2" is block II, "a" is control, "b" is SPT, "c" is DPT1, "d" is DPT2) .. FIG. 25 shows the size of tissue in Block I (left) and Block II (right).
ブロックIの熱傷のイメージングは、熱傷前、熱傷直後、および熱傷の1時間後に行った。次いで、これらの熱傷を5cm×4cm×1cmの組織塊(図25)として切除したが、その際、熱傷全体をそのまま採取するために、周囲の健康な組織も帯状に含まれるようにした。ブロックIを、「熱傷分類実験」と呼ぶ。 Imaging of Block I burns was performed before the burn, immediately after the burn, and 1 hour after the burn. Next, these burns were excised as a tissue mass (FIG. 25) of 5 cm × 4 cm × 1 cm, and at that time, in order to collect the entire burn as it was, the surrounding healthy tissue was also included in a band shape. Block I is called a "burn classification experiment".
ブロックIIの熱傷については、熱傷を深さ1mmごとに層状に切り出すために、電動デルマトームセット(例えば、ジンマー社、インディアナ州ワルソー)を用いて、接線方向の切除を連続的に行った。例えば、図26に、壊死組織除去のプロセスの例を示す。組織を5cm×5cm×0.1cmの連続した薄片として切除し(図25)、創傷部位の下に点状の出血が観察されるまでこれを続けた(図26)。ブロックIIの熱傷のイメージングは、熱傷前、熱傷直後、および各切除の後に行った。このブロックを「熱傷壊死組織除去実験」と呼ぶ。 For block II burns, tangential excision was performed continuously using an electric dermatome set (eg, Zimmer, Warsaw, Indiana) to cut out the burns in layers at depths of 1 mm. For example, FIG. 26 shows an example of the process of removing necrotic tissue. Tissue was excised as a continuous slice of 5 cm x 5 cm x 0.1 cm (FIG. 25) and continued until punctate bleeding was observed beneath the wound site (FIG. 26). Imaging of Block II burns was performed before the burn, immediately after the burn, and after each excision. This block is called a "burn necrotic tissue removal experiment".
組織サンプル(組織塊および接線方向に切除された層)はそれぞれ、10%中性緩衝ホルマリン中に保存し、組織病理学検査に送った。各サンプルを薄片化し、ヘマトキシリンおよびエオシンで染色した。接線方向の切除を行ったブロックIIの熱傷については、生きた組織に到達した切除層がどれであるかを、それぞれが別施設に所属する病理学者2名が正確に判定した。熱傷の全体的な重症度は、皮膚の損傷のパーセンテージによって判定した。皮膚の損傷が20%未満であれば浅達性中間層熱傷、20%を超えて100%未満の皮膚損傷は深達性中間層熱傷とみなした。
1.2.1.b. 機器およびデータの解析 Tissue samples (tissue mass and tangentially resected layer) were stored in 10% neutral buffered formalin and sent for histopathological examination. Each sample was sliced and stained with hematoxylin and eosin. For block II burns that were tangentially resected, two pathologists, each belonging to a different facility, accurately determined which resected layer reached the living tissue. The overall severity of burns was determined by the percentage of skin damage. If the skin damage was less than 20%, it was considered as a superficial middle layer burn, and if the skin damage was more than 20% and less than 100%, it was considered as a deep middle layer burn.
1.2.1. b. Equipment and data analysis
MSIはすべて、Spectral MDの創傷評価プロトタイプによって行った。このカメラは、画素数1392(h)×1040(v)のシリコン電荷結合素子(CCD)を有している。交換可能な8枚のフィルターを有する回転ホイールが装置内で回転することで、高速MSIが可能になる。有効面積は10.2mm×8.3mmである。250Wのタングステン光源を使用して視野を照射した(LowePro)。8枚のフィルターの波長は、450nm、515nm、542nm、620nm、669nm、750nm、860nm、および972nmであった(半値全幅10nm)。取得後の処理はすべてMATLAB(v2013b)によって行った。
1.2.1.c. 統計的解析 All MSI was performed with a wound evaluation prototype of Spectral MD. This camera has a silicon charge-coupled device (CCD) having 1392 (h) × 1040 (v) pixels. A rotating wheel with eight replaceable filters rotates within the device, enabling high speed MSI. The effective area is 10.2 mm × 8.3 mm. The visual field was irradiated using a 250 W tungsten light source (LowePro). The wavelengths of the eight filters were 450 nm, 515 nm, 542 nm, 620 nm, 669 nm, 750 nm, 860 nm, and 972 nm (
1.2.1. c. Statistical analysis
組織学的所見をガイドとして用いて、熱傷の画像それぞれにおいて特定の部位を選択し、それらの部位を構成する信号の分類を行った。異なる熱傷深度からの信号を、双方向ANOVAおよび多重比較(Tukey−Kramer)によって比較した。壊死組織除去の解析は、3要因のANOVAおよび多重比較(Tukey−Kramer)を用いて行った。p値の計算にはBonferonni法を用いたが、これは、p値が0.05を検定数で除した値よりも小さい場合に有意とみなすものである。
1.2.2. 理論 Using histological findings as a guide, specific sites were selected for each burn image and the signals that make up those sites were classified. Signals from different burn depths were compared by bidirectional ANOVA and multiple comparisons (Tukey-Kramer). Analysis of necrotic tissue removal was performed using a three-factor ANOVA and multiple comparisons (Tukey-Kramer). The Bonferonni method was used to calculate the p-value, which is considered significant when the p-value is less than 0.05 divided by the number of tests.
1.2.2. theory
組織は、血液、メラニン、水、脂肪、およびECMの独特の組み合わせから構成されている考えることで単純化できる。上記成分のうち1種で全体が構成されているファントムから反射した白色光を測定すると、各ファントムの吸収スペクトルには固有のピークまたは優位な波長のあることがわかる。図27A−27Eは、様々な組織成分の吸収スペクトルを示す。これらの優位な波長で生じる変化に注目することにより、熱傷の種類による変化をよりよく認識することができる。浅達性中間層熱傷と深達性中間層熱傷とを識別する上で、血液のスペクトルが重要であろうという仮説を立てた。これは、深達性中間層熱傷では浅達性中間層熱傷よりも血管の損傷やうっ血が多いであろうという推測に基づくものである。したがって、プロトタイプには、血液の吸収ピークの範囲である450〜669nmの波長を含めた。また、深達性中間層熱傷では浅達性中間層熱傷よりも、理論的に多くのECMが損傷することから、ECMの波長も含めた。 Tissue can be simplified by thinking that it is composed of a unique combination of blood, melanin, water, fat, and ECM. When the white light reflected from the phantom, which is composed entirely of one of the above components, is measured, it can be seen that the absorption spectrum of each phantom has a unique peak or a dominant wavelength. 27A-27E show absorption spectra of various tissue components. By paying attention to the changes that occur at these dominant wavelengths, the changes due to the type of burn can be better recognized. We hypothesized that the blood spectrum would be important in distinguishing between superficial and deep intermediate burns. This is based on the speculation that deep intermediate burns may have more vascular damage and congestion than superficial intermediate burns. Therefore, the prototype included wavelengths from 450 to 669 nm, which is the range of blood absorption peaks. In addition, since more ECMs are theoretically damaged in deep intermediate burns than in shallow intermediate burns, the wavelength of ECMs is also included.
波長450nm、550nm、650nm、および800nmを見ると、従来の臨床的判断のみに頼る場合と比較して、熱傷の深さの分類が改善されることがわかる。皮膚組織成分の光学特性についての検討を終えた後、先に確立されたこれらの波長を中心として、上記したように熱傷評価の助けとなる可能性の高い8つのさらなる波長の試験を試みた。試験した波長は、420nm、515nm、542nm、629nm、669nm、750nm、860nm、および972nmである。
1.2.3. 結果
1.2.3.a. 組織学 Looking at the wavelengths of 450 nm, 550 nm, 650 nm, and 800 nm, it can be seen that the classification of burn depth is improved as compared to the case of relying solely on conventional clinical judgment. After completing the study of the optical properties of the skin tissue components, we attempted to test eight additional wavelengths, centered on these previously established wavelengths, which are likely to aid in burn assessment as described above. The wavelengths tested were 420 nm, 515 nm, 542 nm, 629 nm, 669 nm, 750 nm, 860 nm, and 972 nm.
1.2.3. result
1.2.3. a. Histology
ブロックIおよびブロックIIにおける病態生理学的変化を、盲検の組織病理学者が層ごとに解析し、その熱傷組織を深さによって分類した。合計で、3つが浅達性中間層熱傷、3つ深達性中間層熱傷、2つが健康な対照と判定された。図28に、接線方向の切除(層としての切除)を行った熱傷の組織構造を示す。黒い線は熱傷の全範囲を示し、黄色の線は熱傷の影響が最も深刻な領域を示す。 Pathophysiological changes in Block I and Block II were analyzed layer by layer by a blind histopathologist and the burned tissue was classified by depth. In total, 3 were determined to be superficial middle layer burns, 3 deep invasion middle layer burns, and 2 were determined to be healthy controls. FIG. 28 shows the tissue structure of burns that have undergone tangential excision (excision as a layer). The black line shows the entire area of the burn and the yellow line shows the area where the effects of the burn are most severe.
壊死組織として除去した組織を解析し、デルマトームのみを用いた連続的切除によって熱傷組織をどの程度効率的に除去できるかを確認した。組織構造から、それぞれの部位において、最大4回の切除によって熱傷組織がすべて除去されたことがわかった。それぞれの部位における最後の切除では、熱傷の境界にある深部の健康な組織も除去された。時折、最後の切除片が健康な創傷床のみを含む場合があり、これは、1段階前で除去を停止できたことを意味している。図29に、動物実験の壊死組織除去において接線方向に連続的に切除された組織片を示す。最も上の切片は真皮の表層であり、その下に続く層は真皮のより深い部分である。矢印は組織片の表層を示す。黒い線は熱傷の全範囲を示し、黄色の線は熱傷の影響が最も深刻な領域を示す。
1.2.3.b. 熱傷の分類実験 The tissue removed as necrotic tissue was analyzed to confirm how efficiently the burned tissue could be removed by continuous excision using only dermatome. From the tissue structure, it was found that all the burned tissue was removed by excision up to 4 times at each site. The final resection at each site also removed deep, healthy tissue at the border of the burn. Occasionally, the last excision contained only a healthy wound bed, which means that removal could be stopped one step before. FIG. 29 shows a piece of tissue that was continuously excised in the tangential direction in the removal of necrotic tissue in an animal experiment. The top section is the surface layer of the dermis, and the layers below it are the deeper part of the dermis. Arrows indicate the surface layer of tissue pieces. The black line shows the entire area of the burn and the yellow line shows the area where the effects of the burn are most severe.
1.2.3. b. Burn classification experiment
Spectral MDの創傷評価プロトタイプは、ブロックIにおける各種の組織を、健康、SPT、DPT1、またはDPT2として正しく分類することができた。図30は熱傷直後のMSIデータのプロットであり、熱傷の種類によって当初の反射スペクトルが異なることを示す。すべての熱傷部位と健康な対照から得られた4つの反射スペクトルを示す。多重比較に基づく統計的解析により、420nmを除くすべての波長が、SPTの熱傷とDPT1/2の熱傷を識別する上で有効であることが確認された。多重比較からさらに、420nm、542nm、669nm、および860nmの波長を用いたMSIによってDPT1とDPT2とを識別できることが示された。以下の表は、熱傷の分類における多重比較を示しており、p値1はSPT対DPT1に対応し、p値2はSPT対DPT2に対応している(この実験における有意なp値は、0.05/6=0.008未満である)。
したがって、MSIは、様々な深さの熱傷を、光のいくつかの主要な波長における固有のスペクトルシグネチャーによって、受傷直後に識別することができる。 Therefore, MSI can identify burns of varying depths shortly after injury by their unique spectral signatures at some major wavelengths of light.
次いで、受傷の1時間後に収集した画像データを同じ様式でプロットし、重症度の識別の再現性を調べた。図31は、各種の熱傷の、受傷直後および受傷1時間後のスペクトルを示す。MSTがSPTとDPTとを識別できるか否かを判断するために、データ解析にDPT2を使用した。臨床的関連に注目するため、1時間後のデータにおけるDPT1対DPT2の多重比較は実施しなかった。評価プロトタイプによる測定の結果、熱傷の種類ごとに異なる反射スペクトルが得られた。この実験では、SPTの熱傷とDPTの熱傷とを識別する上で、すべての波長が有効であった。 Image data collected 1 hour after injury was then plotted in the same format to examine the reproducibility of severity discrimination. FIG. 31 shows the spectra of various burns immediately after the injury and 1 hour after the injury. DPT2 was used for data analysis to determine if MST could distinguish between SPT and DPT. To focus on the clinical relevance, no multiple comparison of DPT1 vs. DPT2 was performed on the data after 1 hour. As a result of the measurement by the evaluation prototype, different reflection spectra were obtained for each type of burn. In this experiment, all wavelengths were effective in distinguishing between SPT burns and DPT burns.
1時間後についての多重比較の結果は、以下の通りである(この実験における有意なp値は、0.05/15=0.003未満である)。
第2の実験では、創傷評価プロトタイプが、健康な組織とDPT熱傷とを識別する能力を利用して、壊死組織除去の停止に適な層を特定できるか否かを試験した。ここでは、DPI1の創傷とDPT2の創傷をともに切除することを考えた。この実験の目的が、MSIが創傷の深さによらず壊死組織から生きた組織を特定できるか否かを試験することにあったからである。一般的に、接線方向の切除はSPTの熱傷には行われないため、この壊死組織除去の解析にSPTデータは含めなかった。この模擬壊死組織除去プロセスでは、972nmの波長が壊死組織除去の解析に最も有用であった。多重比較において、当初の熱傷部位と1回目の切除の後の創傷床との間に、差は認められなかった。2回目の切除の後の熱傷部位と健康な対照との間に、統計的な差はなかった。3回目の切除の後の熱傷部位も、健康な対照との比較において、差はなかった。以下の表は、これらの結果をまとめたものであり、壊死組織除去に関する多重比較による解析結果を示している。
表中、HWB*は「健康な創傷床」を意味し、健康*は「HWB」を意味し、健康**は「切除した深さに位置する健康な創傷床」を意味する。この実験における有意なp値は、0.05/45=0.001未満である。「†」は、予測されるp値が、組織病理学検査および組織サンプルの分類によって決められたことを示す。測定されたp値はいずれも、予測された値と一致した。In the table, HWB * means "healthy wound bed", health * means "HWB", and health ** means "healthy wound bed located at the excised depth". The significant p-value in this experiment is less than 0.05/45 = 0.001. “†” indicates that the predicted p-value was determined by histopathological examination and classification of tissue samples. All measured p-values were in agreement with the predicted values.
これらの結果は、壊死組織除去の2回目の切除によって熱傷組織の最後の縁が除去されたことを確認した組織学的評価と一致している。515nm、669nm、および750nmの波長では、健康な創傷床と過剰な除去を行った後の創傷床(熱傷組織が既に除去された後の創傷床)に統計的な差異は見られなかった。図32に、各切除層の全波長の反射スペクトルを示す。これは、健康な対照の反射スペクトル、一度切除した健康な対照の反射スペクトル、各切除時の熱傷組織のスペクトルの平均、および各切除時の創傷床スペクトルの平均をプロットしたものである。
1.2.4. 考察 These results are consistent with histological evaluation confirming that the second resection of necrotic tissue removal removed the last edge of the burned tissue. At wavelengths of 515 nm, 669 nm, and 750 nm, there was no statistical difference between the healthy wound bed and the wound bed after excessive removal (the wound bed after the burn tissue had already been removed). FIG. 32 shows the reflection spectra of all wavelengths of each cut layer. This is a plot of the reflection spectrum of a healthy control, the reflection spectrum of a healthy control once resected, the average spectrum of burn tissue at each excision, and the average wound bed spectrum at each excision.
1.2.4. Consideration
Spectral MDの創傷評価プロトタイプは、様々な重症度の中間層熱傷を識別することができ、熱傷壊死組織除去が適切な切除深さで行われたのがいつであるかを判定することができる。多重比較統計により、以下の差異の解像に最適である波長が見出された:SPT対DPTの損傷、DPT1の損傷対DPT2の損傷、および壊死熱傷組織対生存創傷床。 Wound assessment prototypes for Spectral MD can identify intermediate-layer burns of varying severity and determine when burn necrotic tissue removal was performed at the appropriate resection depth. Multiple comparison statistics have found optimal wavelengths for the resolution of the following differences: SPT vs. DPT injury, DPT1 injury vs. DPT2 injury, and necrotic burn tissue vs. surviving wound bed.
DPT1とDPT2とを識別することによって外科的介入の全体的治療計画が変更されることはないが、この分解能で熱傷の重症度を分類できることは、プロトタイプに機能が追加されることになる。今後研究が進めば、MSIを使用して深さを測定するアルゴリズムを作成することができる。この情報は、その後、大きな熱傷全体にわたってすべての深さを含む総合的熱傷等高線図を作成するために使用されてもよく、これは、臨床医が熱傷領域全体の壊死組織除去計画を作成する助けとなる。吸収スペクトルと熱傷の正確な深さとを関連付けるアルゴリズムをさらに開発するために、さらなる研究が行われてもよい。 Distinguishing between DPT1 and DPT2 does not change the overall treatment plan for surgical intervention, but the ability to classify the severity of burns with this resolution adds functionality to the prototype. As research progresses, MSI can be used to create algorithms to measure depth. This information may then be used to create a comprehensive burn contour map that includes all depths throughout the large burn, which helps the clinician to develop a necrotic tissue removal plan for the entire burn area. It becomes. Further research may be done to further develop algorithms that correlate the absorption spectrum with the exact depth of burns.
「理論」のセクションで仮定したように、515nm、542nm、629nm、および669nmの波長は、熱傷直後および熱傷の1時間後のSPT損傷とDPT損傷との識別に有用であった。420〜669nmの波長範囲は、血液の吸収スペクトルに関連している。熱傷の深さによってうっ血の程度は様々であることから、このような波長の光が組織にどのように扱われるかは、その組織が属する熱傷の分類によって異なるため、MSIによる識別が可能となる。同様のスペクトル(420nm、542nm、669nm、および860nm)によってDPT1の創傷とDPT2の創傷とを識別することができ、この考えはさらに支持される。 As assumed in the "Theory" section, wavelengths of 515 nm, 542 nm, 629 nm, and 669 nm were useful in distinguishing between SPT and DPT injuries immediately after and 1 hour after the burn. The wavelength range of 420-669 nm is related to the absorption spectrum of blood. Since the degree of congestion varies depending on the depth of the burn, how light of such wavelengths is treated by the tissue depends on the classification of the burn to which the tissue belongs, so that it can be identified by MSI. .. Similar spectra (420 nm, 542 nm, 669 nm, and 860 nm) can distinguish between DPT1 wounds and DPT2 wounds, further supporting this idea.
ECMの吸収ピーク(750nm、860nm、972nm)、水の吸収ピーク(971nm)、および脂肪分の吸収ピーク(930nm)と関連する波長もまた、熱傷の種類の識別に有用であった。SPTの熱傷はDPTの熱傷よりも皮膚の損傷が少ない。したがって、SPTではDPTと比べて損傷のないECMが多く存在し、水分はより均一に分布しているため、MSIによってSPTとDPTとを識別できると仮定できる。一方、DPT1の熱傷とDPT2の熱傷はいずれも全層熱傷ではないため、これらの熱傷の間に、深さによる皮膚脂肪含量の差はなさそうである。得られた結果は、これらの予測と一致している。 Wavelengths associated with ECM absorption peaks (750 nm, 860 nm, 972 nm), water absorption peaks (971 nm), and fat absorption peaks (930 nm) were also useful in identifying burn types. SPT burns cause less skin damage than DPT burns. Therefore, it can be hypothesized that MSI can distinguish between SPT and DPT because there are more undamaged ECMs in SPT than in DPT and the water content is more evenly distributed. On the other hand, since neither the DPT1 burn nor the DPT2 burn is a full-thickness burn, there seems to be no difference in skin fat content depending on the depth between these burns. The results obtained are in agreement with these predictions.
この研究では、MSI技術を使用して熱傷壊死組織除去の適切な深さを判定する可能性もまた示されている。515nm、669nm、750nm、および972nmの波長を使用して、部分的に壊死組織を切除した熱傷と生存創傷床の反射スペクトルにおける差異を特定することができた。515nmおよび669nmの波長は、血液の吸収ピークに相当する。750nmおよび972nmの波長は、ECMの吸収スペクトルに相当し、972nmは水の吸収ピークにも相当している。これらの結果は、健康な組織と熱傷組織とを比較するとき、組織成分としての血液、ECM、および水の変化が最も大きいことを示唆している。熱傷はECMと血管を破壊するため、これは合理的である。972nmの波長は、どの実験においても、組織分類に臨床的に有用であることが示された。これは、熱傷が組織内の水の分布を乱すことによって説明できるかもしれない。この乱れによって、健康組織と熱傷組織との間にMSIで検出することのできる顕著な差が生じることとなり、その差を利用して壊死組織除去をガイドすることができる。
1.2.5. 結論 The study also shows the possibility of using MSI techniques to determine the appropriate depth of burn necrotic tissue removal. Wavelengths of 515 nm, 669 nm, 750 nm, and 972 nm could be used to identify differences in the reflection spectra of partially necrotic tissue-removed burns and surviving wound beds. Wavelengths of 515 nm and 669 nm correspond to blood absorption peaks. Wavelengths of 750 nm and 972 nm correspond to the absorption spectrum of ECM, and 972 nm also corresponds to the absorption peak of water. These results suggest that when comparing healthy tissue to burned tissue, the changes in blood, ECM, and water as tissue components are greatest. This is reasonable because burns destroy ECM and blood vessels. The wavelength of 972 nm has been shown to be clinically useful for tissue classification in any experiment. This may be explained by the burns disrupting the distribution of water in the tissue. This disturbance results in a significant difference that can be detected by MSI between healthy tissue and burned tissue, which can be used to guide necrotic tissue removal.
1.2.5. Conclusion
Spectral MDによる創傷評価プロトタイプは、ブタの熱傷モデルにおける熱傷を分類し、壊死組織除去をガイドするデータを提供する。これは、熱傷のトリアージおよび壊死組織除去術の助けとなる臨床装置の開発の可能性を示している。この技術を、早期の熱傷ケアにおける日常的な使用のために実施できれば、緊急時にケアチームが容易に利用できる、なじみ深いものとなるであろう。 The Wound Evaluation Prototype with Spectral MD classifies burns in a porcine burn model and provides data to guide necrotic tissue removal. This represents the potential for the development of clinical devices to assist in triage of burns and necrotic tissue removal. If this technique could be implemented for routine use in early burn care, it would be easily accessible and familiar to care teams in an emergency.
この装置を熱傷の自動分類に適合させるために、将来的な実験には、この実験で得られた有効波長等が組み入れられるであろう。現在の、Spectral MDによる創傷評価プロトタイプは、研究者が解析し、組織の分類を目的として解釈するデータを取得しているに過ぎない。目標とするのは、MSIデータを解析し、自動分類を行い、見やすく理解しやすい出力を生成するアルゴリズムの設計である。そのために、この実験で得られたデータをスペクトル参照データベースに加え、分類アルゴリズムのトレーニングに使用する。今後もブタの熱傷実験は必要になるであろうが、ブタの熱傷データベースを強力な土台として、最終的には臨床環境においてプロトタイプを試験する予定である。
1.3. 実施例3:ブタ深達性中間層熱傷モデルにPPGおよびMSIを用いた実験 In order to adapt this device to the automatic classification of burns, future experiments will incorporate the effective wavelengths etc. obtained in this experiment. The current Wound Evaluation Prototype by Spectral MD has only been analyzed by researchers and obtained data to be interpreted for the purpose of tissue classification. The goal is to design an algorithm that analyzes MSI data, performs automatic classification, and produces output that is easy to see and understand. To that end, the data obtained in this experiment will be added to the spectral reference database and used for training of classification algorithms. Although porcine burn experiments will be required in the future, we plan to use the porcine burn database as a strong foundation to eventually test prototypes in a clinical environment.
1.3. Example 3: Experiments using PPG and MSI for a porcine deep intermediate burn model
熱傷壊死組織除去術は、切除の範囲と深さを特定するための訓練を要する難しい技術であるが、どこをどの程度切除すべきかについて外科医に合図できる装置があれば、恩恵を受けられるであろう。模擬熱傷壊死組織除去術において生存創傷床と熱傷組織を識別する能力について、迅速かつ非侵襲的な2つの光学イメージング技術の調査を行った。 Burn necrotic tissue removal is a difficult technique that requires training to determine the extent and depth of excision, but it would benefit if there was a device that could signal the surgeon where and how much to excise. Let's go. Two rapid and non-invasive optical imaging techniques were investigated for the ability to distinguish between living wound beds and burned tissue in simulated burn necrotic tissue removal.
PPGイメージングおよびMSIを使用して、深達性中間層熱傷における壊死組織除去の初期段階、中間段階、および最終段階のイメージングを行った。PPGイメージングでは、皮膚の微小循環における血流をマッピングすることができ、MSIでは、可視光波長および赤外線波長の組織反射スペクトルを収集して、参照ライブラリに基づいて組織を分類することができる。例えば、図33は、創傷壊死組織除去の手法、および壊死組織と移植のための生存創傷床との間の相対血流を検出するPPGイメージング装置を示している。このようなPPGイメージングシステムの構成要素の例を図34に示す。MSIシステムの構成要素を図35に示す。 PPG imaging and MSI were used to perform early, intermediate, and final imaging of necrotic tissue removal in deep-seated intermediate burns. PPG imaging can map blood flow in the microcirculation of the skin, and MSI can collect tissue reflection spectra of visible and infrared wavelengths to classify tissues based on reference libraries. For example, FIG. 33 shows a technique for removing wound necrotic tissue and a PPG imaging device that detects relative blood flow between the necrotic tissue and a living wound bed for transplantation. An example of the components of such a PPG imaging system is shown in FIG. The components of the MSI system are shown in FIG.
この実験では、ブタの深達性中間層熱傷モデルを作製し、深さ1.0mmに設定した電動デルマトームを用いて、接線方向の切除を連続的に行った。切除された焼痂をヘマトキシリンおよびエオシン(H&E)で染色し、壊死組織除去の各段階で残存している熱傷の程度を判定した。 In this experiment, a porcine deep intermediate burn model was created and tangential excision was performed continuously using an electric dermatome set to a depth of 1.0 mm. The resected eschar was stained with hematoxylin and eosin (H & E) to determine the extent of burns remaining at each stage of necrotic tissue removal.
PPGイメージング装置では、熱傷組織が存在する場所での血流が顕著に少ないことが示され、MSI法では、生存創傷床に残っている熱傷組織が創傷床と区別して描写されることが確認できた。これらの結果は、独立して実施された組織学的解析によって確認された。 The PPG imaging device showed significantly less blood flow where the burn tissue was present, and the MSI method confirmed that the burn tissue remaining in the surviving wound bed was depicted separately from the wound bed. It was. These results were confirmed by an independent histological analysis.
これらの装置は、切除の適切な深さを特定できるものであり、それらの画像は、創傷床において移植の準備が整ったかどうかについて、外科医に合図を送りうるものであることが見出された。これらの出力画像は、手術室における臨床判断を容易にすることが期待される。 It was found that these devices could identify the appropriate depth of resection and that the images could signal the surgeon if the wound bed was ready for transplantation. .. These output images are expected to facilitate clinical judgment in the operating room.
熱傷のケアにPPGイメージングおよびMSIの技術を適用するために、科学者および技術者は、現行のケア標準を改善する能力を発揮しなければならない。壊死組織除去術中の既知の時点に得た画像を含む動物画像データベースを基に教師あり機械学習アルゴリズムを開発し、トレーニングすることを含む実験を行った。開発した分類アルゴリズムの精度が現行の臨床ケア標準を上回っていることを実証する。このアルゴリズムは、最終的には、PPGイメージングおよびMSIによって収集されたイメージングデータを、切除および移植手術を行う医療提供者にとって不可欠な情報に翻訳するために適用されるであろう。
1.3.1. 方法
1.3.1.a. フォトプレチスモグラフィイメージング装置 In order to apply PPG imaging and MSI techniques to the care of burns, scientists and technicians must demonstrate their ability to improve current care standards. Experiments involving the development and training of supervised machine learning algorithms were performed based on an animal image database containing images obtained at known time points during necrotic tissue removal. Demonstrate that the accuracy of the developed classification algorithm exceeds current clinical care standards. Ultimately, this algorithm will be applied to translate the imaging data collected by PPG Imaging and MSI into information essential to healthcare providers performing resection and transplant surgery.
13.1. Method
13.1. a. Photopretismography imaging equipment
PPGイメージングシステムは、暗騒音が低くダイナミックレンジの高い10ビットのモノクロCMOSカメラ(Nocturn XL、Photonis USA)から構成されている。10ビットのADC分解能によって得られる信号対ノイズ比は60dBである。このイメージング装置の分解能は、1280×1040(アスペクト比5:4)に設定した。カメラは垂直下向きに、オブジェクトの表面に対面するよう取り付けた。システム間の比較のために、20×16cmの共通視野(FOV)の制御を行った。カメラの露出時間は、95%の反射率参照標準(Spectralon SG3151、LabSphere Inc.;ニューハンプシャー州ノースサットン)を用いて較正した。組織を照射するために、4つの高出力モノリシックLEDエミッタ(SFH4740、OSRAM)を、同軸モードでセンサーと同じ平面に取り付けられた2×2アレイに配置した。LEDエミッタアレイは、ターゲットの表面15cmの位置に、カメラとともに配置された。LEDエミッタが選択されたのは、カメラのFOV内の組織を均一に照射できる(すなわち、空間強度の変化は15%未満であった)ことによる。カメラのFOVは光学レンズによって制御され、照射領域よりもわずかに狭かった。 The PPG imaging system consists of a 10-bit monochrome CMOS camera (Nocturn XL, Photonis USA) with low background noise and high dynamic range. The signal-to-noise ratio obtained with a 10-bit ADC resolution is 60 dB. The resolution of this imaging device was set to 1280 × 1040 (aspect ratio 5: 4). The camera was mounted vertically downward, facing the surface of the object. A 20 x 16 cm common field of view (FOV) was controlled for comparison between the systems. Camera exposure times were calibrated using a 95% reflectance reference standard (Spectralon SG3151, LabSphere Inc .; North Sutton, Hampshire). To illuminate the tissue, four high power monolithic LED emitters (SFH4740, OSRAM) were placed in a 2x2 array mounted on the same plane as the sensor in coaxial mode. The LED emitter array was placed with the camera at a
呼吸中に動物が動くことでPPG信号にノイズが入るため、PPIイメージングの当初の解析は困難であった。エンベロープ抽出と呼ばれる信号処理法を用いて、呼吸運動の影響を低減させることができた。画像の各画素に対し、ローパスフィルタを用いた信号の平滑化を行い、ノイズの多い信号の包絡線を抽出した。次いで、ノイズの多い信号をその包絡線で区分し、信号中の大きな動作スパイクを除去した。残りの明瞭な信号は、情報を示すものであり、これが処理されてPPG画像が得られる。
1.3.1.b. マルチスペクトルイメージング装置 Initial analysis of PPI imaging was difficult due to noise in the PPG signal due to the movement of the animal during respiration. A signal processing method called envelope extraction was used to reduce the effects of respiratory movements. The signal was smoothed using a low-pass filter for each pixel of the image, and the envelope of the noisy signal was extracted. The noisy signal was then separated by its envelope to remove large motion spikes in the signal. The remaining clear signal indicates information, which is processed to obtain a PPG image.
13.1. b. Multispectral imaging device
マルチスペクトル画像の収集は、400〜1100nmの間にある固有の波長を有する8枚の光学バンドパスフィルターを備えたフィルターホイールカメラ(SpectroCam、Pixelteq;フロリダ州ラルゴ)を使用し、Staring法によって行った。我々のシステムに最も適したフィルターを選択するために、以前の研究で特定された22枚のそれぞれ異なるフィルターを試験し、特徴選択と呼ばれる技術を使用して波長選択のためのデータ解析を行った。この研究では、透過ピークが581nm、420nm、620nm、860nm、601nm、680nm、669nm、および972nmである波長フィルター(フィルター幅は、±10nm;Ocean Thin Films;フロリダ州ラルゴ)を使用した。イメージングセンサーのスペクトル応答の差を補償するために、正方形の95%反射率参照標準(Spectralon SG3151、LabSphere Inc.;ニューハンプシャー州ノースサットン)を用いて、システムの較正を行った。使用した光源は、イメージング装置の視野内の照射プロファイルをより均一にするための擦りガラスディフューザを備えた、250Wのタングステンハロゲンランプ(LowePro)であった。このシステムでは、望遠レンズ(Distagon T*2.8/25 ZF−IR、Zeiss Inc.;USA)を利用した。
1.3.1.c. ブタモデル Multispectral image collection was performed by the Staring method using a filter wheel camera (SpectroCam, Pixeltex; Largo, Florida) with eight optical bandpass filters with unique wavelengths between 400 and 1100 nm. .. To select the most suitable filter for our system, we tested 22 different filters identified in previous studies and performed data analysis for wavelength selection using a technique called feature selection. .. In this study, wavelength filters with transmission peaks of 581 nm, 420 nm, 620 nm, 860 nm, 601 nm, 680 nm, 669 nm, and 972 nm (filter width ± 10 nm; Ocean Thin Films; Largo, Florida) were used. To compensate for differences in the spectral responses of the imaging sensors, the system was calibrated using a square 95% reflectance reference standard (Spectralon SG3151, LabSphere Inc .; North Sutton, Hampshire). The light source used was a 250 W tungsten halogen lamp (LowePro) equipped with a frosted glass diffuser to make the irradiation profile in the field of view of the imaging device more uniform. In this system, a telephoto lens (Distagon T * 2.8 / 25 ZF-IR, Zeiss Inc .; USA) was used.
13.1. c. Pig model
この動物実験で用いた方法は、Branskiら,2008、およびGurfinkelら,2010の方法の変法であった。体重約40kgのハンフォードブタの成体を、手術前に馴化させた。適切な麻酔および鎮痛の下、ブタの背中の正中線近くに、深達性中間層熱傷を作製した。創傷を作製するために、100℃に熱した黄銅棒を、皮膚に60秒間押し付けた(圧力0.2kg/cm2)。黄銅棒の直径3.6cmであり、生じた創傷の寸法は同一であった。それぞれのブタに合計6つの創傷を作製したが、このとき、円形の熱傷それぞれに隣接する健康な組織を無傷の対照組織として使用するために、創傷と創傷との間隔が保たれるようにした。The method used in this animal experiment was a variant of the method of Branski et al., 2008, and Gulfinkel et al., 2010. Adult Hanford pigs weighing approximately 40 kg were acclimated prior to surgery. Under proper anesthesia and analgesia, deep intermediate burns were created near the midline of the pig's back. A brass rod heated to 100 ° C. was pressed against the skin for 60 seconds (pressure 0.2 kg / cm 2 ) to create a wound. The diameter of the brass rod was 3.6 cm, and the dimensions of the wounds produced were the same. A total of 6 wounds were created in each pig, with the wounds kept spaced so that the healthy tissue adjacent to each circular burn could be used as an intact control tissue. ..
適切な切除深さとなるようイメージング装置を較正するために、接線方向に鋭い切除を行うための標準モデルを開発した。接線方向の切除とは、一様かつ連続的に繰り返して行われる、熱傷の部分的切除である。これは、深さ1.0mm(幅6.0cm)に設定した電動デルマトームセットを、生存創傷床の深さに至る熱傷全体が切除されるまで、熱傷上を複数回通過させることによって達成された。 To calibrate the imaging device for the proper excision depth, we have developed a standard model for tangentially sharp excisions. Tangent resection is a uniform, continuous and repetitive partial resection of a burn. This was achieved by passing an electric dermatome set set to a depth of 1.0 mm (width 6.0 cm) multiple times over the burn until the entire burn to the depth of the surviving wound bed was resected. ..
下方にある生存創傷床を露出させるために、デルマトームを3回通過させることによって深達性中間層熱傷を切除した。実験では、点状出血が現れる点まで組織を除去できれば、壊死組織除去が成功したとみなした。円形の熱傷それぞれに隣接する健康な組織を、無傷の対照組織として使用した。データ収集を行った時点は、0)受傷前、1)受傷直後、2)3層の壊死組織それぞれの除去時点であった(図36)。それぞれの時点において、PPG画像、MSI画像、ならびに心拍数、呼吸数、および血圧を含む生理学的データを収集した。接線方向の切除を行う度に、組織構造を調べる目的で、切除した組織を保存した。
1.3.1.d. 生存創傷床の特定 Deep intermediate burns were resected by passing through the dermatome three times to expose the underlying surviving wound bed. In the experiment, if the tissue could be removed to the point where petechiae appeared, the necrotic tissue removal was considered to be successful. Healthy tissue adjacent to each circular burn was used as intact control tissue. The time when the data was collected was 0) before the injury, 1) immediately after the injury, and 2) the time when each of the three layers of necrotic tissue was removed (Fig. 36). At each time point, PPG images, MSI images, and physiological data including heart rate, respiratory rate, and blood pressure were collected. The excised tissue was preserved for the purpose of examining the tissue structure after each tangential excision.
13.1. d. Identification of surviving wound beds
研究の詳細を知らされていない組織病理学者が、組織学とカラー写真とを基にして、生存創傷床の組織が露出した深さを判定した。組織学的検討は、Gurfinkelら,2010に従って実施された。簡単に言えば、接線方向に切除された各組織サンプルを10%中性緩衝ホルマリン(NBF)で固定し、認定組織病理学者による処理および検査(Alizee Pathology、メリーランド州サーモント)に送付した。各試料から代表的な生検材料を採取し、ヘマトキシリンおよびエオシン(H&E)を用いて染色した。生存創傷床に到達したのが、接線方向のどの切除であったかを判定するために、組織病理学者は、組織の薄片の中で最も重度の熱傷を受けた領域の境界を特定し、形態計測解析を用いてこの熱傷の深さを見出した。研究の各時点において、熱傷のデジタル写真も撮影した。色の標準化のために、創傷の横に色基準片を置いた。
1.3.1.e. マルチスペクトルイメージングのための分類アルゴリズム Histological pathologists who were not informed of the details of the study determined the depth of exposed tissue in the surviving wound bed based on histology and color photographs. Histological studies were performed according to Gulfinkel et al., 2010. Simply put, each tangentially resected tissue sample was fixed with 10% neutral buffered formalin (NBF) and sent to a certified histopathologist for treatment and examination (Alizee Pathology, Thurmont, Maryland). Representative biopsy material was taken from each sample and stained with hematoxylin and eosin (H & E). To determine which tangential resection reached the surviving wound bed, histopathologists identified the boundaries of the most severely burned areas of the tissue flakes and morphometric analysis. The depth of this burn was found using. Digital photographs of burns were also taken at each point of study. A color reference piece was placed next to the wound for color standardization.
13.1. e. Classification algorithm for multispectral imaging
生のMSIデータキューブ内の画素の分類を自動化するために、分類アルゴリズムおよび熱傷組織スペクトル参照データベースを作成した。データベースの作成は、以下の3つの手順を踏んだ。第1に、動物実験データによって得られた画像から特定の画素を選択するために技術者が使用できるプログラムを書いた。第2に、動物実験によって得られた接線方向に切除した組織サンプルを認定組織病理学者が処理して解析し、各組織片における熱傷の位置および重症度を特定した。第3に、経験豊富な外科医がカラー写真を観察し、壊死組織除去として切除した組織における点状出血の位置および生存組織と非生存組織を特定した。これらのステップが完了した後、技術者2名が約120枚のMSI画像から手作業による画素の選択を行った。 A classification algorithm and burn tissue spectrum reference database were created to automate the classification of pixels in raw MSI data cubes. The database was created in the following three steps. First, I wrote a program that technicians can use to select specific pixels from images obtained from animal experiment data. Second, tangentially resected tissue samples obtained from animal studies were processed and analyzed by a certified histopathologist to determine the location and severity of burns in each piece of tissue. Third, an experienced surgeon observed color photographs to identify the location of petechiae and live and non-survival tissue in the resected tissue as necrotic tissue removal. After completing these steps, two engineers manually selected pixels from about 120 MSI images.
先のステップで作成した参照データに基づいて画素を6つの異なる生理学的クラスに分類する機械学習アルゴリズムを構築した。クラシファイヤアルゴリズムとしては、二次判別分析(QDA)を使用した。アルゴリズムの精度は以下のように判定した。各MSI画像の画素が組織学より適切なクラスに分類された後、6つのクラスそれぞれにつき、24の熱傷部位にわたる2000画素を用いて、分類アルゴリズムのトレーニングを行った。次いで、トレーニング画素は換えずに、各クラスにつき新たに2000の画素を無作為に選択し、分類アルゴリズムの効率を試験した。分類の精度は、SokolovaおよびLapalmeに従って計算した。 Based on the reference data created in the previous step, we constructed a machine learning algorithm that classifies pixels into six different physiological classes. Secondary discriminant analysis (QDA) was used as the classifier algorithm. The accuracy of the algorithm was judged as follows. After the pixels of each MSI image were classified into appropriate classes by histology, the classification algorithm was trained using 2000 pixels over 24 burn sites in each of the 6 classes. Then, without changing the training pixels, 2000 new pixels were randomly selected for each class to test the efficiency of the classification algorithm. The accuracy of the classification was calculated according to Sokolova and Lapalme.
実験で使用した6つの生理学的クラスとその説明を、以下に示す。 The six physiological classes used in the experiment and their explanations are shown below.
健康的な皮膚:ほとんどすべての画像に存在する一般的な組織である。 Healthy skin: A common tissue present in almost every image.
充血:1947年にJacksonにより記載された熱傷の3区分の1つである。血管系が拡張されているが、完全な回復が期待される。 Hyperemia: One of the three categories of burns described by Jackson in 1947. The vascular system is dilated, but full recovery is expected.
創傷床(移植可能):移植可能な創傷床組織は、皮膚移植片の適用に理想的な表面である。白色またはピンク色であり、点状出血が見られる。 Wound bed (implantable): The implantable wound bed tissue is an ideal surface for the application of skin grafts. It is white or pink and has petechiae.
血液:表面に多量の血液が溜まっており、血液を吸引して当該領域を再度イメージングするよう外科医に指示すべき状態である。 Blood: A large amount of blood has accumulated on the surface and the surgeon should be instructed to aspirate the blood and reimage the area.
重度でない熱傷:2週間以内に自然に治癒するであろう軽度の熱傷を伴う組織。 Non-Severe Burns: Tissue with mild burns that will heal spontaneously within 2 weeks.
重度の熱傷(移植不可能):壊死および回復不可能な熱傷が起きた凝固部であり、自然に治癒することはなく、皮膚移植片も受け付けない。
1.3.1.f. 統計および画像処理 Severe burns (non-transplantable): A coagulated area with necrotic and irreparable burns that does not heal spontaneously and does not accept skin grafts.
13.1. f. Statistics and image processing
画像の処理および統計は、すべてMATLAB(v2013b)上で行われた。
1.3.2. 結果
1.3.2.a. 熱傷の作製およびその深さ All image processing and statistics were performed on MATLAB (v2013b).
1.3.2. result
1.3.2. a. Burn creation and its depth
4匹のミニブタを用いて、24箇所の深達性中間層熱傷を作製した。24箇所の創傷のうち16箇所(67%)は、圧力制御された高温の棒による面積の等しい創傷であることがわかった。それぞれの熱傷から接線方向に3回の切除が行われ、各切片における熱傷の程度が、組織病理学者によって判定された。72の切片それぞれについて形態計測による解析を行い、熱傷深さの一貫性とデルマトームによる接線方向の切除の一貫性を定量化した。デルマトームによる切除の平均厚さは1.36±0.16mm(標準偏差12%、図37)であった。 Twenty-four deep intermediate burns were made using 4 mini pigs. Of the 24 wounds, 16 (67%) were found to be pressure-controlled hot rods of equal area. Three tangential excisions were made from each burn and the extent of the burn in each section was determined by a histopathologist. Morphological analysis was performed on each of the 72 sections to quantify the consistency of burn depth and tangential excision by dermatome. The average thickness of excision by dermatome was 1.36 ± 0.16 mm (
熱傷組織は、熱傷により何らかの影響を受けた部位と、熱傷により重度の影響を受けた部位に区別された。熱傷組織全体の平均深さは3.73±0.58mm(標準偏差16%)であり、重度熱傷である部分の深さは約1.49±0.59mm(標準偏差±39%)であった。これらの結果を図37にまとめて示す。後者の計測値は分散が非常に大きいが、これは、重度熱傷の部位と何らかの熱傷を有する部位とを区別する際に、組織病理学者がより主観的に組織の変化を判断したことに関連している可能性がある。 Burn tissue was divided into areas that were somewhat affected by the burn and areas that were severely affected by the burn. The average depth of the entire burned tissue is 3.73 ± 0.58 mm (
接線方向に切除された熱傷組織について、デルマトームが3回通過したことにより生存創傷床に到達したことを、組織学的に確認した。点状出血が現れる点まで組織を除去できれば、壊死組織除去が成功したとみなした。24の創傷のうち24箇所(100%)において、組織の除去により、全体的に均一かつ点状出血を有する創傷床が出現した。これは、デルマトームの3回またはそれ以下の回数の通過で、重度の熱傷を受けた組織がすべて除去されたことを示す組織構造によって確認された(図38)。点状出血という証拠があるにもかかわらず、組織学的には、24の創傷のうち8箇所(33%)において、熱傷により何らかの影響を受けた組織すべてが完全に除去されたわけではないことが示された。しかしながら、イメージングデータを見ていない認定外科医が、壊死組織除去後の創傷床のカラー写真を検討し、熱傷の影響が軽度であるこのような組織に移植を行うことは許容範囲内であること、また、そのような組織が重度の創傷に変化する見込みはないことを確認した。
1.3.2.b. フォトプレチスモグラフィイメージング It was histologically confirmed that the burned tissue resected in the tangential direction reached the surviving wound bed by passing the dermatome three times. If the tissue could be removed to the point where petechiae appeared, the necrotic tissue removal was considered successful. In 24 of the 24 wounds (100%), tissue removal resulted in the emergence of a wound bed with overall uniform and petechiae. This was confirmed by the tissue structure indicating that all severely burned tissue was removed after 3 or less passes of the dermatome (Fig. 38). Despite evidence of petechiae, histologically, not all tissue affected by burns was completely removed in 8 of the 24 wounds (33%). Shown. However, it is acceptable for a certified surgeon who has not seen the imaging data to review a color picture of the wound bed after removal of the necrotic tissue and to implant in such tissue where the effects of burns are mild. We also confirmed that such tissue is unlikely to turn into a severe wound.
1.3.2. b. Photopretismography imaging
画像に存在する3種類の組織、すなわち健康な皮膚組織、熱傷組織、および創傷床組織からのPPG信号の差異を調べた。熱傷組織からのPPG信号の信号対ノイズ比は、他の2種類の組織と比較して顕著な差があることがわかった(健康な皮膚:6.5±3.4dB、生存創傷床:6.2±4.1dB、熱傷組織:4.5*±2.5dB、*p<0.05)。これらの結果には再現性があった。24の熱傷部位のうち20箇所から収集したPPG画像を用いて、切除の適切な点を特定することができた。Differences in PPG signals from the three types of tissue present in the image: healthy skin tissue, burn tissue, and wound bed tissue were examined. The signal-to-noise ratio of the PPG signal from the burned tissue was found to be significantly different compared to the other two types of tissue (healthy skin: 6.5 ± 3.4 dB, surviving wound bed: 6). .2 ± 4.1 dB, burn tissue: 4.5 * ± 2.5 dB, * p <0.05). These results were reproducible. PPG images collected from 20 of the 24 burn sites could be used to identify appropriate points for resection.
熱傷の深さ全体にわたるPPG信号の変化を明らかにするために、1つの創傷についての一連の画像を提示する(図39)。当初のPPG信号は、無傷の皮膚全体にわたって比較的均一である。この信号は、熱傷が生じた場所に相当する画像の中心部で劇的に低下する。皮膚の最初の1.0mmの層を除去しても、創傷床における熱傷組織は依然として顕著であり、相対PPG信号が低いことは、この組織の存在と関連している。およそ2〜3mmの深さ(2回目の切除後)では、創傷床のPPG信号に戻っている。
1.3.2.c. マルチスペクトルイメージング A series of images for a single wound is presented to reveal changes in the PPG signal over the depth of the burn (Fig. 39). The initial PPG signal is relatively uniform throughout the intact skin. This signal drops dramatically in the center of the image, which corresponds to the location of the burn. Even with the removal of the first 1.0 mm layer of skin, the burned tissue in the wound bed is still prominent and the low relative PPG signal is associated with the presence of this tissue. At a depth of approximately 2-3 mm (after the second excision), the wound bed returns to the PPG signal.
1.3.2. c. Multispectral imaging
外科医および組織学者の監督下で選択された画素のラベル付データベースから、24の熱傷すべてから無作為に選択された2000画素を組み合わせてテストデータセットとした。このテストセットを、事前トレーニングを行ったQDAアルゴリズムによって分類し、実際のクラスラベルと比較して混同行列を生成した(図42)。この行列では、行列の中央に位置する対角線上に、正確な分類の数が示されている。不正確な分類は、対角線から外れた要素に示されている。全体的な分類精度は86%であることがわかった。当該アルゴリズムによって、創傷床からの「血液」は、92%の成功率という、6つのクラス中最高の精度で分類することができた。他の5つのクラスも同様の精度で分類され、分類精度が最も低い「重度の熱傷」の成功率は81%であった。混同行列から、重度の熱傷組織を健康な皮膚とみなし、健康な皮膚を重度の熱傷とみなす誤分類が起こりがちであることがわかる。また、充血組織を血液とみなす誤分類やその逆も多いことを見出した。 2000 pixels randomly selected from all 24 burns from a pixel-labeled database selected under the supervision of a surgeon and histologist were combined into a test dataset. This test set was categorized by a pre-trained QDA algorithm and compared to the actual class labels to generate a confusion matrix (Fig. 42). In this matrix, the exact number of classifications is shown diagonally in the center of the matrix. Inaccurate classifications are shown on off-diagonal elements. The overall classification accuracy was found to be 86%. The algorithm was able to classify "blood" from the wound bed with the highest accuracy of the six classes, with a success rate of 92%. The other five classes were also classified with similar accuracy, with the lowest classification accuracy of "severe burns" having a success rate of 81%. The confusion matrix shows that severe burn tissue is often misclassified as healthy skin and healthy skin as severe burns. We also found that there are many misclassifications that regard hyperemic tissue as blood and vice versa.
分類されたMSI出力画像は、熱傷の位置およびその境界を良好に示している(図40)。MSIは、デルマトームを使用して熱傷領域をより深く切除しようとする際に、生存創傷床を明確に特定することができた。これらの画像においても、先の混同行列の解析の際に述べた画素の誤分類が見られる。この空間表現から、誤差は典型的にはランダムではなく、画像の特定の領域に高い頻度で発生することがわかる。例えば、創傷床が健康な皮膚として分類される誤りの多くは、図40の1回目の壊死組織除去の図の上部のみで生じている。 The classified MSI output images are a good indication of the location of the burn and its boundaries (Fig. 40). MSI was able to clearly identify the surviving wound bed when attempting to remove the burn area deeper using the dermatome. Also in these images, the misclassification of pixels described in the previous analysis of the confusion matrix can be seen. From this spatial representation, it can be seen that the errors are typically not random and occur frequently in specific areas of the image. For example, many of the mistakes in classifying a wound bed as healthy skin occur only in the upper part of the first necrotic tissue removal diagram of FIG.
同一の創傷内に深さの異なる熱傷が含まれる場合、これは一般的な臨床シナリオであるが、MSI画像の結果から、より重度の熱傷領域を特定することができた(図41)。これは、受傷直後および切除プロセスにおいて該当する。これらの画像は、このツールが手術計画を立てる上で、特に経験の浅い外科医にとっていかに効果的であるかを示すために提供されている。
1.3.3 結論 If the same wound contains burns of different depths, this is a common clinical scenario, but the results of MSI images could identify more severe burn areas (FIG. 41). This is true immediately after injury and during the excision process. These images are provided to show how effective this tool is in planning surgery, especially for inexperienced surgeons.
1.3.3 Conclusion
PPGイメージングデータの結果から、熱傷組織は健康な組織と比較してPPG信号が顕著に少ないことがわかる。臨床的観点から言えば、これは、熱傷の疑いがあるものをPPGイメージング技術の助けを得て特定できることを意味する。外科医が組織を切除する際、壊死組織を除去して生存創傷床を露出させるにつれ、それに応じてPPGイメージング信号が増すことが期待できた。信号が生存組織に特有の強度に達したとき、PPGイメージング装置は、創傷床に適度な血流があること、また組織が移植片を支持可能であることを外科医に示すであろう。 From the results of the PPG imaging data, it can be seen that the burned tissue has significantly less PPG signal than the healthy tissue. From a clinical point of view, this means that suspected burns can be identified with the help of PPG imaging techniques. As the surgeon resected the tissue, it was expected that the PPG imaging signal would increase as the necrotic tissue was removed to expose the surviving wound bed. When the signal reaches the intensity specific to the living tissue, the PPG imaging device will show the surgeon that the wound bed has adequate blood flow and that the tissue can support the graft.
MSIイメージングの結果も有望である。この研究で用いた8つの波長で、様々な組織クラスの分類において平均して86%の精度が得られた。熱傷組織を分類するための現在のケア標準は、経験を積んだ熱傷外科医の臨床判断である。切除および移植における外科医の分類精度についての研究報告はないが、経験豊富な外科医による初期の熱傷深さ評価の臨床研究では、60〜80%の精度が示されている。初期評価における外科医の精度は、必ずしも熟練した外科医の手術の精度を示すものではないが、熱傷の手術中に最適切除深さを正しく判断するという課題の達成は、初期評価と同様に困難であると考えられる。したがって、この調査で示されたMSIイメージングの精度は、最も熟練した専門家と同等であることが確信でき、また、MSIが経験の浅い外科医の臨床的意思決定を改善する可能性を有することに疑いの余地はない。 The results of MSI imaging are also promising. The eight wavelengths used in this study resulted in an average of 86% accuracy in the classification of various tissue classes. The current standard of care for classifying burn tissue is the clinical judgment of an experienced burn surgeon. Although there are no research reports on the accuracy of surgeon classification in resection and transplantation, clinical studies of initial burn depth assessment by experienced surgeons have shown an accuracy of 60-80%. The surgeon's accuracy in the initial evaluation does not necessarily indicate the surgical accuracy of a skilled surgeon, but achieving the task of correctly determining the optimal resection depth during burn surgery is as difficult as in the initial evaluation. it is conceivable that. Therefore, we can be confident that the accuracy of MSI imaging shown in this study is comparable to that of the most skilled professionals, and that MSI has the potential to improve the clinical decision-making of inexperienced surgeons. There is no doubt about it.
PPGデータから計算された特徴は、MSIデータ解析のために既に確立されている、同じ機械学習技術を用いた反射スペクトルデータと組み合わせることができる。PPGとMSIの生データキューブはいずれも同一の光学的ハードウェアを用いて収集できるため、各システムから得られる、クラシファイヤの式に含めるべき顕著な特徴を決定することは、統計解析の問題である。MSI単独でも熱傷の境界を効果的に特定できるが、PPG信号から得られる動的血流情報をMSIの反射率データをと組み合わせることで、組織の生存率に関する重要な情報を含めることができると考えられる。 Features calculated from PPG data can be combined with reflection spectrum data using the same machine learning techniques already established for MSI data analysis. Since both PPG and MSI raw data cubes can be collected using the same optical hardware, determining the salient features to be included in the classifier equations from each system is a matter of statistical analysis. is there. Although MSI alone can effectively identify burn boundaries, combining dynamic blood flow information from PPG signals with MSI reflectance data can include important information about tissue viability. Conceivable.
切除および移植の際に熱傷を適切に分類することは、熱傷患者のケアを最適化する上で不可欠である。PPGイメージングとMSIは、壊死組織除去術をガイドすることにおいて熱傷外科医および専門外の外科医のいずれにとっても助けとなる2つの技術である。PPGイメージングは、血流を検出することによって、血液含量が特徴的に高い健康な組織を識別する。MSIは、主要な波長の反射光を集め、組織クラスそれぞれに固有の反射スペクトルを生成して分類する。ブタの熱傷モデルを用いて、臨床応用におけるこれらの技術の実行可能性および実用性を示した。PPGイメージングおよびMSIを個別にまたは組み合わせて使用することは、医療提供者の診断精度を向上させ、皮膚移植手術中の壊死組織除去プロセスを最適化する助けとなる。
1.3.3.a. 実務への適用可能性 Proper classification of burns during resection and transplantation is essential for optimizing care for burn patients. PPG imaging and MSI are two techniques that help both burn surgeons and non-specialist surgeons in guiding necrotic tissue removal. PPG imaging identifies healthy tissue with a characteristically high blood content by detecting blood flow. MSI collects reflected light of major wavelengths and generates and classifies reflection spectra unique to each tissue class. A porcine burn model was used to demonstrate the feasibility and practicality of these techniques in clinical applications. The use of PPG imaging and MSI individually or in combination helps improve the diagnostic accuracy of healthcare providers and optimize the necrotic tissue removal process during skin graft surgery.
1.3.3. a. Practical applicability
外科的壊死組織除去を適切に行うために、医師は何年もの訓練を受ける。多数の負傷者が発生する状況下で複数の手術を行う必要が生じた場合、経験の乏しい外科医は数え切れないほどの障害に直面する。組織の切除の過不足はいずれも、重度の合併症につながる。熱傷の切除が不十分であると、失活した組織に移植片を載せることになり、移植片の生着が悪くなり、感染症のリスクが増す。一方、過度に切除には過剰な失血のリスクがあり、これもまた移植片の生着不良を招きうる。手術を技術的に実施することに加えて、外科医は、周術期における体液および血液の適切な管理を指示できなければならない。さらに、タイミングが重要であり、わずか48時間が経過しただけでも、創傷の切除を受ける患者は、それより24時間早く手術を受けた同様の患者と比較すると2倍量の血液を失うことになる。最後に、深さの異なる複数の熱傷部位が熱傷領域の全体にわたって存在する場合、熱傷ケアの提供はさらに複雑になる。このような熱傷の切除および移植において、生存可能な皮膚の切除を最小限に抑えつつ非生存組織を最大限に除去するように計画を立てることは、困難である。 Physicians are trained for years for proper surgical necrotic tissue removal. Inexperienced surgeons face countless obstacles when it becomes necessary to perform multiple surgeries in a situation where a large number of injuries occur. Any excess or deficiency of tissue excision leads to severe complications. Inadequate resection of burns results in the placement of the graft on inactivated tissue, resulting in poor graft survival and an increased risk of infection. On the other hand, excessive resection carries the risk of excessive blood loss, which can also lead to poor graft engraftment. In addition to performing the surgery technically, the surgeon must be able to direct proper management of fluids and blood during the perioperative period. In addition, timing is important, and after just 48 hours, a patient undergoing wound resection will lose twice as much blood as a similar patient who underwent
熱傷外科医と熱傷が専門ではない外科医とのギャップを低減するためには、支援ツールが必要とされる。理想的な解決策は、切除すべき部位を特定し、切除の適切な深さを判定し、患者の治療管理をガイドする生命兆候を監視するものである。臨床応用のためのさらなる要件は、診断精度の向上、患者の現実的な条件への適応、および治療チームへの有用なデータの即時提供である。さらに、最適な解決策は、多数の負傷者が発生する事故のような、熱傷専門家に比べて患者が圧倒的に多い状況下で、非専門家を支援するために容易に採用できるものである。 Assistive tools are needed to reduce the gap between burn surgeons and non-burn surgeons. The ideal solution is to identify the site to be excised, determine the appropriate depth of excision, and monitor life signs that guide the patient's treatment management. Further requirements for clinical application are improved diagnostic accuracy, adaptation to the patient's realistic conditions, and immediate provision of useful data to the treatment team. In addition, the best solution is one that can be easily adopted to assist non-specialists in situations where the number of patients is overwhelmingly higher than that of burn specialists, such as accidents that result in a large number of injuries. is there.
上述のように、この問題に対する有望な解決策として、いくつかのイメージングモダリティが提案されている。ほとんどの技術は、理由は様々であるが、臨床診療において実用的でないことがこれまでに判明している。外科医が自力で行う臨床判断と比べて精度が低い技術もある。他の解決策は、患者が長時間じっと横たわっていることを要したり、データの取得に何日もかかったり、正確な診断のために侵襲的処置を要したりする。このような制限を伴う臨床ツールは、医療提供者が容易に採用できるものではない。 As mentioned above, several imaging modalities have been proposed as promising solutions to this problem. Most techniques have previously been found to be impractical in clinical practice for a variety of reasons. Some techniques are less accurate than the clinical decisions that surgeons make on their own. Other solutions require the patient to sit still for long periods of time, take days to obtain data, or require invasive procedures for accurate diagnosis. Clinical tools with such restrictions are not readily available to healthcare providers.
MSIおよびPPGイメージングは、本明細書で概説した実験も含めて、熱傷ケアを改善するためのこれらの要件を実際に満たしうる技術であることが示されている。これらの技術をベッドサイドで利用できる臨床ツールに転換する作業を行うことにより、米国の熱傷犠牲者の生活の質を向上させることができる。 MSI and PPG imaging have been shown to be techniques that can actually meet these requirements for improving burn care, including the experiments outlined herein. By transforming these technologies into bedside clinical tools, the quality of life of US burn victims can be improved.
この解決策は世界的な影響を与えるであろう。発展途上国の貧しい人々は、調理や照明をたき火に頼っている。このような生活環境により、女性や子どもは、重度熱傷の高いリスクに曝されている。例えば、南アジアでは、HIV/エイズやマラリアに感染して死亡する女性や子どもよりも、重度の熱傷で死亡する女性や子どものほうが多い。医療へのアクセスの欠如は、比較的軽度の熱傷が恒久的な障害となることを意味するが、この恒久的な障害は、熱傷治療支援装置の利用によって治療を施す際に高度な技能が必要とされなくなれば、予防できるものである。
1.4. 実施例4:外れ値の検出と除去によって熱傷診断イメージング装置の精度を改 善するための実験 This solution will have a global impact. Poor people in developing countries rely on bonfires for cooking and lighting. This living environment puts women and children at high risk of severe burns. For example, in South Asia, more women and children die from severe burns than women and children who die from HIV / AIDS and malaria. Lack of access to medical care means that relatively mild burns become a permanent disability, which requires a high degree of skill in treating with the use of burn treatment support devices. If it is not said, it can be prevented.
1.4. Example 4: outlier detection and experiments to improve the accuracy of the burn diagnostic imaging apparatus by removing
この実施例4に記載される方法、システム、アルゴリズム、技術、および/または開示、ならびに実質的に類似したバージョンおよび/または変形は、本開示に記載される任意の方法または装置における計算に使用することができる。 The methods, systems, algorithms, techniques, and / or disclosures described in Example 4 and substantially similar versions and / or variants are used for calculations in any of the methods or devices described in this disclosure. be able to.
この実験では、熱傷の壊死組織除去を計画し実施する熱傷外科医を支援する熱傷診断装置を開発するために、マルチスペクトルイメージング(MSI)を使用した。モデルを構築するには、熱傷組織を正確に代表するトレーニングデータが必要となる。正確なトレーニングデータを取得することは困難であるが、その理由の一部として、生のMSIデータを適切な組織クラスに分類する際に誤りが生じやすいことが挙げられる。トレーニングデータセットから外れ値を除去することによってその困難を乗り越えることができ、分類精度の改善につながると仮定した。最初のMSIトレーニングデータベースを構築し、熱傷に存在する臨床的に重要な組織を分類する我々のアルゴリズムの能力を調べるために、ブタの熱傷モデルを開発した。ブタの画像からグラウンドトゥルースのデータベースを作成した後、トレーニングデータセットの外れ値を計算するために、Z検定および単変量解析に基づく多段階法を開発した。10倍交差検定を用いて、トレーニングの都度、外れ値の有無にかかわらずアルゴリズムの精度を比較した。この外れ値除去法によって、波長空間におけるトレーニングデータの分散を低減できることが示された。外れ値をトレーニングデータセットから除去することで、試験の精度は63%から76%に改善され、より良い出力が得られた。トレーニングデータを調整するためのこの簡単な方法の確立により、我々のアルゴリズムの精度は、熱傷評価における現在のケア標準と同等のレベルまで向上した。熱傷外科医や熱傷治療施設が国内にほとんどないことを考えると、この技術は、専門施設へのアクセスが十分でない熱傷患者のための熱傷のケア標準を改善するものと期待される。
1.4.1. マルチスペクトルイメージングの応用 In this experiment, multispectral imaging (MSI) was used to develop a burn diagnostic device to assist burn surgeons in planning and performing burn necrotic tissue removal. Training data that accurately represents burn tissue is needed to build the model. Obtaining accurate training data is difficult, partly because it is prone to errors in classifying raw MSI data into the appropriate tissue class. It was hypothesized that the difficulty could be overcome by removing outliers from the training dataset, leading to improved classification accuracy. We developed the first MSI training database and developed a porcine burn model to examine the ability of our algorithm to classify clinically important tissues present in burns. After creating a database of ground truth from pig images, we developed a multi-step method based on Z-test and univariate analysis to calculate outliers in the training dataset. A 10-fold cross-validation was used to compare the accuracy of the algorithms with and without outliers at each training session. It was shown that this outlier removal method can reduce the dispersion of training data in the wavelength space. By removing the outliers from the training dataset, the accuracy of the test was improved from 63% to 76%, resulting in better output. With the establishment of this simple method for adjusting training data, the accuracy of our algorithm has improved to a level comparable to current care standards in burn assessment. Given the scarcity of burn surgeons and burn treatment facilities in the country, this technology is expected to improve burn care standards for burn patients with inadequate access to specialized facilities.
1.4.1. Applications of multispectral imaging
カメラ技術の開発とともに、NASAによる天文学、農業、防衛、地質学、医療イメージングアプリケーション等の様々な異なる技術から生まれたマルチスペクトルイメージング(MSI)およびハイパースペクトルイメージング(HSI)の技術。 Multispectral imaging (MSI) and hyperspectral imaging (HSI) technologies born from a variety of different technologies such as astronomy, agriculture, defense, geology, and medical imaging applications by NASA, along with the development of camera technology.
熱傷の解析のための、MSI技術の応用について紹介する。熱傷を治療するためには、最初の創傷の深さの判定が重要である。浅達性中間層熱傷として知られている浅い熱傷は、外科的治療を必要とせず、典型的には支援療法で治癒する。深さに応じて深達性中間層熱傷または全層熱傷として分類される、より重度の熱傷は、移植手術の土台となる生存創傷床を露出させるために、壊死組織をすべて外科的に切除しなければならない。現時点では、熱傷を分類するためのゴールドスタンダードは、熟練した熱傷外科医による臨床判断である。しかしながら、そのような専門家の正確さは60〜80%に過ぎないと推定されており、非専門家の正確さは50%以下である。熱傷治療に関する臨床上の意思決定を改善するためには、熱傷の分類精度を、特に熱傷の専門家のいない医療センターにおいて向上させるための技術的解決策が必要である。MSIは、熱傷組織を潜在的に高い精度で異なる臨床カテゴリーに分類することができ、これにより、外科医は適切な治療手段をより頻繁に、より迅速に選択することができる。重度の熱傷から壊死組織を除去する際、外科医は、健康な組織の過剰な除去を最小限に抑えようとする。MSIは、さらに、術中に熱傷組織を分類して熱傷と健康な創傷床とを区別し、健康な組織の不必要な切除を防ぐことで外科的切除を支援する可能性を有している。 Introducing the application of MSI technology for the analysis of burns. Determining the depth of the initial wound is important for treating burns. Shallow burns, known as superficial middle-layer burns, do not require surgical treatment and typically heal with supportive care. More severe burns, classified as deep intermediate or full-thickness burns, depending on depth, surgically remove all necrotic tissue to expose the surviving wound bed that underlies the graft surgery. There must be. At this time, the gold standard for classifying burns is the clinical judgment of a skilled burn surgeon. However, the accuracy of such experts is estimated to be only 60-80%, and the accuracy of non-experts is less than 50%. To improve clinical decision-making regarding burn treatment, technical solutions are needed to improve the accuracy of burn classification, especially in medical centers without burn specialists. MSI can potentially classify burned tissue into different clinical categories with a high degree of accuracy, which allows surgeons to select appropriate treatments more frequently and more quickly. When removing necrotic tissue from severe burns, surgeons seek to minimize excessive removal of healthy tissue. MSI also has the potential to support surgical resection by classifying burn tissue intraoperatively to distinguish between burns and healthy wound beds and preventing unnecessary resection of healthy tissue.
ヒトの皮膚は、複数の発色団成分からなる多層組織であり、その中に血液、水、メラニン、および脂肪という4つの重要な成分が存在する。様々な皮膚層の血液、水、メラニン、および脂肪は、特定の波長の光、特に可視帯域および近赤外帯域の光照射に対して、確立されたスペクトル応答を示す。MSIを用いて複数の特徴的な入射波長に対する異なる組織の応答を捕捉し解析することにより、例えば、他の組織の間に存在する血液を、その固有のスペクトル応答によって特定することができる。入射光に対する組織応答は、その吸光度によって定量化される。MSIにより、特定の波長範囲にわたる吸光度データを収集することで、組織クラスのそれぞれに存在する組織成分の相対量に基づいて、異なる種類の組織を分類することができる。 Human skin is a multi-layered tissue composed of multiple chromophore components, in which four important components, blood, water, melanin, and fat, are present. Blood, water, melanin, and fat in various skin layers exhibit an established spectral response to light of specific wavelengths, especially in the visible and near-infrared bands. By capturing and analyzing the responses of different tissues to multiple characteristic incident wavelengths using MSI, for example, blood existing between other tissues can be identified by its unique spectral response. The tissue response to incident light is quantified by its absorbance. By collecting absorbance data over a particular wavelength range, MSI can classify different types of tissue based on the relative amount of tissue components present in each of the tissue classes.
MSIは様々な種類の組織から、固有のスペクトルデータを捕捉することができるが、新しいスペクトル画像を解釈し、組織を正しく特定するためには、分類モデルを開発する必要がある。このモデルを開発する際には困難が生じるが、これは、後に分類に使用されるものと同種のデータから、機械学習と呼ばれるプロセスを通じて、構築されなければならないことによる。したがって、最初のモデルを構築する際、まず「トレーニング」データセットを収集し、「グラウンドトゥルース」として手動で分類する必要がある。グラウンドトゥルースを確立することは、どのような機械学習アプリケーションにおいても重要なステップであり、したがって、このようなアプリケーションの開発において、最も吟味される段階の1つである。正確な分類モデルを構築するには、極めて正確なグラウンドトゥルースが必要である。グラウンドトゥルースを確立する方法は、構成される分類モデルが何を評価するためのものであるかによって異なる。しかし、いずれの事例においても、必要な情報を収集するためには、現在のゴールドスタンダードを使用している臨床専門家によって、グラウンドトゥルースの確立がなされなければならない。熱傷の場合、組織分類のゴールドスタンダードは組織病理学的評価である。グラウンドトゥルースを確立するための、我々の技術の詳細を提示する。 Although MSI can capture unique spectral data from various types of tissue, it is necessary to develop a classification model in order to interpret new spectral images and correctly identify the tissue. Difficulties arise in developing this model because it must be constructed from the same kind of data that will be used later for classification through a process called machine learning. Therefore, when building the first model, it is necessary to first collect the "training" dataset and manually classify it as "ground truth". Establishing ground truth is an important step in any machine learning application and is therefore one of the most scrutinized steps in the development of such an application. To build an accurate classification model, we need a very accurate ground truth. The method of establishing ground truth depends on what the constructed classification model is for evaluation. However, in each case, ground truth must be established by clinical professionals using current gold standards in order to gather the necessary information. In the case of burns, the gold standard for histology is histopathological assessment. We present the details of our technology for establishing ground truth.
その後、トレーニングセットを使用して分類モデルを作成し、次いで、さらに収集したデータによって分類モデルの試験を行い、グラウンドトゥルースに対する精度を判定する。グラウンドトゥルーストレーニングデータセットから分類モデルを構築するための様々なアルゴリズムが開発されている。例えば、サポートベクターマシン(SVM)アルゴリズムは、ハイパースペクトルイメージングデータ解析のためのカーネルベースの機械学習において、これまでに使用されている。 The training set is then used to create a classification model, which is then tested with the collected data to determine accuracy for ground truth. Various algorithms have been developed to build classification models from ground truth training datasets. For example, Support Vector Machine (SVM) algorithms have been used in kernel-based machine learning for hyperspectral imaging data analysis.
結局のところ、グラウンドトゥルースを確立するには、トレーニングデータに対して手作業による境界設定がなされるため、結果として得られるモデルには分類誤差に起因する潜在的な偏りがある。例えば、健康な皮膚がトレーニングデータにおいて血液として不適切に分類された場合、結果として得られるモデルでは、健康な皮膚と血液とを正確に分類することが困難になる。トレーニングデータは分類モデルを構築するために使用されるサンプル空間であるため、そのような偏りを減らすことは、モデルの精度を改善するための鍵である。 After all, establishing ground truth involves manual demarcation of the training data, so the resulting model has potential bias due to classification errors. For example, if healthy skin is improperly classified as blood in the training data, it will be difficult to accurately classify healthy skin and blood in the resulting model. Since training data is the sample space used to build the classification model, reducing such bias is the key to improving the accuracy of the model.
どのようなトレーニングセットによっても避けられない偏りのために、開発後の試験におけるモデルの精度は低くなる。分散を低減し、モデルの精度を向上させるためには、トレーニングデータセットの「外れ値」を特定して除去することが有用である。外れ値は、他の観測変数と統計的に異なる観測変数として定義される。外れ値検出(異常検出または特異点検出とも呼ばれる)は統計的パターン認識調査の重要な要素であり、クレジットカード詐欺、センサイベント、医療診断、およびネットワークセキュリティ等の分野で応用されている。外れ値検出には、確立された方法がいくつか存在する。一般に実施されている外れ値検出技術の1つは、モデルベースのアルゴリズムである。 The inevitable bias of any training set reduces the accuracy of the model in post-development testing. In order to reduce the variance and improve the accuracy of the model, it is useful to identify and eliminate "outliers" in the training dataset. Outliers are defined as observation variables that are statistically different from other observation variables. Outlier detection (also called anomaly detection or singularity detection) is an important element of statistical pattern recognition research and has applications in areas such as credit card fraud, sensor events, medical diagnostics, and network security. There are several established methods for outlier detection. One of the commonly practiced outlier detection techniques is a model-based algorithm.
モデルベースのアルゴリズムでは、統計的検定により、サンプル分布のパラメータが推定される。例えば、ガウス分布は、平均と標準偏差という2つのパラメータによって記述される。これらのパラメータは、最尤推定または最大事後確率推定によって決定される。単変量ガウス分布において、外れ値とは、Zスコア(標準スコア)によって定量化されるモデルパラメータ内に含まれる確率が両極端である(高いまたは低い)点を言う。従来、確率が0.95よりも大きい、あるいは0.05よりも小さいサンプルは、単変量解析において外れ値とみなされる。 In model-based algorithms, statistical tests estimate the parameters of the sample distribution. For example, the Gaussian distribution is described by two parameters, the mean and the standard deviation. These parameters are determined by maximum likelihood estimation or maximum posteriori estimation. In the univariate Gaussian distribution, outliers are the points at which the probabilities of being included in the model parameters quantified by the Z-score (standard score) are extreme (high or low). Traditionally, samples with a probability greater than 0.95 or less than 0.05 are considered outliers in univariate analysis.
モデルベースのアルゴリズムは、多くの場合に外れ値を正しく識別する。しかし、これらのモデルを定義するパラメータは、最初に計算される時点で、潜在的な外れ値の影響を受けることに注意しなければならない。すなわち、外れ値を特定して除去することが可能になる前に、サンプルセット全体を使用してパラメータが生成される。したがって、これらのアルゴリズムが分類モデルを生成する前に外れ値を特定して除去することによって、モデルの精度を高めることができる。この研究では、外れ値除去の概念を適用した、医療空間における機械学習アルゴリズムを提供する。MSIイメージングデータはまず、確立されたブタの熱傷モデルから捕捉した。次いで、マルチスペクトル画像の評価を行い、熱傷の画像に存在する異なる組織を分類するために設計されたモデルの分類精度を定量的に改善するための統計的解決手段を提供した。
1.4.2 外れ値の検出および除去 Model-based algorithms often correctly identify outliers. However, it should be noted that the parameters that define these models are affected by potential outliers when they are first calculated. That is, parameters are generated using the entire sample set before it becomes possible to identify and eliminate outliers. Therefore, the accuracy of the model can be improved by identifying and removing outliers before these algorithms generate the classification model. This study provides a machine learning algorithm in the medical space that applies the concept of outlier removal. MSI imaging data were first captured from an established porcine burn model. Multispectral images were then evaluated to provide a statistical solution for quantitatively improving the classification accuracy of models designed to classify different tissues present in burn images.
14.2 Outlier detection and removal
外れ値の検出および除去は、統計およびパターン認識の領域では重要な一領域であり、クレジットカード詐欺、興味深いセンサイベント、医療診断、ネットワークセキュリティ等の様々な分野で広く使用されている。外れ値の検出は、異常検出、特異点検出のような別名で呼ばれることもある。外れ値検出のほとんどが、モデルベースおよび近接度ベースで行われる。モデルベースのアルゴリズムでは、統計的検定を使用してサンプル分布のパラメータを推定することができ、サンプル分布は、例えば、中心極限定理(CLT)に基づくガウス分布とみなすことができる。ガウス分布の場合、2つのパラメータは、平均値および標準偏差と考えることができる。これらのパラメータは、最尤推定または最大事後確率推定から得ることができる。モデルベースのアプローチにおいて、外れ値は発生確率の低い点であり、Zスコア(標準スコア)を計算することで推定できる。経験則として、確率の値が0.95より大きい場合、または0.05より小さい場合、そのようなサンプルは外れ値とみなされる。これは単変量解析に基づいている。多変量正規分布であれば、
近接度ベースの外れ値検出では、最近傍の考え方を用いて包含または除外の近似を生成することができる。まず、距離の概念が重要である。N個のサンプルとM個の変数がある場合、行列のサイズはN×Mであり、例えばユークリッド距離を使用することによって、サンプル空間における距離を
中心傾向の別の定義に基づく方法は、他にも存在する。例えば、局所外れ値因子(LOF)は密度に基づくものである。密度は、点のクラスタから推定できる。特定のクラスタまたは点群の密度が隣接するものよりも低い場合、このクラスタに含まれる点は外れ値の可能性がある。ここでも、データセットが高次元データであれば、これらのアルゴリズムは機能しないかもしれない。高次元のデータセットを扱うために、角度ベースの外れ値検出(ABOD)およびグリッドベースの部分空間外れ値検出が提案されている。
2. 手法
2.1 ハードウェアおよびイメージングおよび動物モデル
マルチスペクトル画像データは、自製ベンチトップイメージング構成を用いて取得した。図1に、この画像取得システムの概要を示す。照射源および画像捕捉モジュールはいずれも、ターゲットの表面から60cmの距離に、反射モードで配置した。タングステン光(ViP Pro−light、Lowel Inc.)は、DCモードでターゲット表面上に広域スペクトルを投影した。タングステン光の正面に擦りガラス(iP−50、Lowel Inc.)を1枚取り付け、光を拡散させて空間照射の均一性を高めた。入射光のいくらかはターゲット表面を透過したが、一方で画像捕捉モジュールによって、後方散乱光信号を収集した。画像捕捉モジュールは、高性能IR強化光学レンズ(型式:Distagon T * F−2.8/25mm、Zeiss)、8スロットフィルターホイール、および12ビットモノクロカメラ(BM−141GE、JAI Inc.)から構成されていた。光学バンドパスフィルターは、カメラのために、光から単一の波長を分離するように設計され、選択された。以下の8枚のバンドパスフィルターを、フィルターホイールに取り付けた。8枚のフィルターの中心波長(CWL)および半値全幅(FWHM)は、420−20、542−10、581−20、601−13、726−41、800−10、860−20、および972−10であった(CWL−FWHM、いずれもnm)。反射率ゼニスライトパネル(SphereOptics GmbH)を用いて波長強度を正規化した。画素の最大値は4098(12ビット)であった。実装された8つの波長は、各波長における既知の皮膚組織吸収挙動に基づいて、組織を正確に識別して有用な分類が行えるように選択された。フィルターホイールが回転する際、カメラは8枚のフィルターのそれぞれを通して、単一波長の画像を連続的に捕捉した。画像は、非圧縮形式でコンピュータに保存された。計算および統計はすべて、MATLAB(登録商標)ソフトウェア(バージョン2014b)を用いて実行した。There are other methods based on another definition of central tendency. For example, the local outlier factor (LOF) is based on density. The density can be estimated from the cluster of points. If the density of a particular cluster or point cloud is lower than that of its neighbors, the points contained in this cluster may be outliers. Again, these algorithms may not work if the dataset is cluster high-dimensional data. Angle-based outlier detection (ABOD) and grid-based subspace outlier detection have been proposed to work with high-dimensional datasets.
2. Method
2.1 Hardware and Imaging and Animal Model Multispectral image data were acquired using a homebrew benchtop imaging configuration. FIG. 1 shows an outline of this image acquisition system. Both the source and the image capture module were placed in reflection mode at a distance of 60 cm from the surface of the target. Tungsten light (ViP Pro-light, Lowel Inc.) projected a broad spectrum onto the target surface in DC mode. A piece of frosted glass (iP-50, Lowel Inc.) was attached to the front of the tungsten light to diffuse the light and improve the uniformity of spatial irradiation. Some of the incident light passed through the target surface, while the backscattered light signal was collected by the image capture module. The image capture module consists of a high-performance IR-enhanced optical lens (model: Distagon T * F-2.8 / 25 mm, Zeiss), an 8-slot filter wheel, and a 12-bit monochrome camera (BM-141GE, JAI Inc.). Was there. Optical bandpass filters have been designed and selected for cameras to separate a single wavelength from light. The following eight bandpass filters were attached to the filter wheel. The center wavelength (CWL) and full width at half maximum (FWHM) of the eight filters are 420-20, 542-10, 581-20, 601-13, 726-41, 800-10, 860-20, and 972-10. (CWL-FWHM, both nm). Wavelength intensity was normalized using a reflectance Zenith light panel (SphereOptics GmbH). The maximum value of the pixel was 4098 (12 bits). The eight wavelengths implemented were selected for accurate tissue identification and useful classification based on known skin tissue absorption behavior at each wavelength. As the filter wheel rotated, the camera continuously captured single-wavelength images through each of the eight filters. The image was stored on the computer in uncompressed format. All calculations and statistics were performed using MATLAB® software (version 2014b).
図43A−43Cは、ハードウェアシステム構成の一例を示す(図43A)。マルチスペクトル画像データは、自製ベンチトップイメージング構成を用いて取得した。図43Aに、この画像取得システムの概要を示す。図43A−43Cの例ではタングステン光を用いたが、他の実施形態における光源は、任意の広域スペクトル照射源またはデータ解析に必要な所望の波長の光に一致する任意の照射源とすることができる。 43A-43C show an example of a hardware system configuration (FIG. 43A). Multispectral image data was acquired using a self-made benchtop imaging configuration. FIG. 43A shows an outline of this image acquisition system. Tungsten light was used in the example of FIGS. 43A-43C, but the light source in other embodiments may be any wide spectrum irradiation source or any irradiation source that matches the light of the desired wavelength required for data analysis. it can.
上記システムを使用し、動物実験委員会(IACUC)のもとで設計された熱傷モデル科学研究プロトコルに従って、動物のデータを収集した。ヒトの皮膚(表皮の厚さ:50〜120μm)に近いものとするため、動物モデルとしては、雄性ハンフォードブタ(表皮の厚さ:30〜40μm)を選択した。 Using the above system, animal data were collected according to a burn model scientific research protocol designed under the Animal Care and Use Committee (IACUC). A male Hanford pig (epidermis thickness: 30-40 μm) was selected as an animal model in order to make it close to human skin (epidermis thickness: 50 to 120 μm).
ブタの背中に円形の熱傷(直径=3.6cm)を作製した(図43B、43C)。この段階では、3種類の皮膚組織、すなわち健康、熱傷、および充血(受傷後の血液灌流の増加による皮膚の発赤)が視覚化された。壊死組織除去は、深さ1mmの接線方向の切除により連続した切除層が得られるように実施され、それぞれの熱傷において、壊死組織除去を行う領域は6cm×6cmであった(図43B)。壊死組織除去中、6つの異なる皮膚組織、すなわち健康、中間層熱傷または全層熱傷(熱傷の重症度による)、血液、創傷床、および充血が認められた。接線方向に切除された層はそれぞれ、10%中性緩衝ホルマリン中に保存し、組織病理学検査に送った。各サンプルを薄片化し、ヘマトキシリンおよびエオシン(H&E)で染色した。組織学的検査の目的は、上記した種類の組織を識別する「ゴールドスタンダード」を得て、マルチスペクトル画像におけるそれらの位置を知ることであった。熱傷の損傷の深さ、および生きた組織に到達した切除層が正確にどれであるかを、病理学者2名が判定した。 Circular burns (diameter = 3.6 cm) were made on the back of the pig (FIGS. 43B, 43C). At this stage, three types of skin tissue were visualized: health, burns, and hyperemia (skin redness due to increased hemoperfusion after injury). The necrotic tissue removal was performed so that a continuous excision layer was obtained by tangential excision at a depth of 1 mm, and in each burn, the area for necrotic tissue removal was 6 cm × 6 cm (FIG. 43B). During necrotic tissue removal, six different skin tissues were observed: healthy, intermediate or full-thickness burns (depending on the severity of the burn), blood, wound bed, and hyperemia. Each tangentially resected layer was stored in 10% neutral buffered formalin and sent for histopathological examination. Each sample was sliced and stained with hematoxylin and eosin (H & E). The purpose of histological examination was to obtain a "gold standard" that identifies the above types of tissue and to know their location in multispectral images. Two pathologists determined the depth of the burn injury and exactly which resection layer reached the living tissue.
それぞれ6箇所に熱傷を有する3頭のブタを使用した。熱傷の箇所それぞれについて、8つの波長すべてを用いて、少なくとも5つの異なる時点において画像を取得した。すなわち、受傷前のベースライン画像、熱傷直後の画像、デルマトームによる最初の1mmの接線方向の切除後の画像、およびさらに2回の接線方向の切除後の画像である。
2.2 トレーニングデータの収集および分類アルゴリズム Three pigs were used, each with 6 burns. For each burn site, images were taken at at least 5 different time points using all 8 wavelengths. That is, a baseline image before injury, an image immediately after burn, an image after the first 1 mm tangential excision by Dermatome, and an image after two more tangential excisions.
2.2 Training data collection and classification algorithm
分類モデルを生成するために教師あり学習法を実施した。6つの皮膚組織分類からなるトレーニングデータベースを構築するために、組織学的データを参照として使用して、取得した画像ごとに画素強度および6種類の組織それぞれの位置を抽出した。接線方向に切除された皮膚の各切片を、確立されたプロトコルに従って、認定病理学者によって決定された熱傷深さを示すように区分した(図44)。また、健康、中間層熱傷、完全な熱傷、血液、創傷床、および充血の部位を示すための描画ツールを開発した。病理学者は、H&E染色からこれらの部位を決定するために、以下のパラメータを使用した。焼痂は、最大の損傷を受けた全層熱傷である。コラーゲンおよび他の組織成分の凝固による不可逆的な組織喪失が存在する。組織学的に、この部位は、細胞全体の喪失を特徴とする。中間層熱傷では組織における灌流が低減し、血管閉塞の所見がある。コラーゲンは全般的にその構造的完全性を保持している。しかしながら、核濃縮を伴う細胞壊死の形跡が見られる。この組織区分は、回復の見込みがあると考えられる。健康な創傷床は、熱傷よりも深部に存在し、本質的に正常な組織学的所見の見られる場所として画定される。これらの部位は、先に取得されたスペクトルイメージングデータと関連付けられ、それによって、我々の分類アルゴリズムを判定するグラウンドトゥルースが確立される。 A supervised learning method was performed to generate a classification model. To build a training database of 6 skin tissue classifications, histological data was used as a reference to extract pixel intensities and the positions of each of the 6 tissue types for each image acquired. Each section of tangentially resected skin was segmented according to an established protocol to indicate the burn depth determined by a certified pathologist (FIG. 44). We have also developed drawing tools to show the sites of health, middle layer burns, complete burns, blood, wound beds, and hyperemia. Pathologists used the following parameters to determine these sites from H & E staining. Scabs are the most damaged full-thickness burns. There is irreversible tissue loss due to coagulation of collagen and other tissue components. Histologically, this site is characterized by the loss of whole cells. Intermediate burns reduce perfusion in the tissue and there is evidence of vascular occlusion. Collagen generally retains its structural integrity. However, there is evidence of cell necrosis with pyknosis. This organizational division is expected to recover. A healthy wound bed is deeper than a burn and is defined as a place of essentially normal histological findings. These sites are associated with the previously acquired spectral imaging data, thereby establishing the ground truth to determine our classification algorithm.
サポートベクターマシン(SVM)アルゴリズムとk最近傍(KNN)分類アルゴリズム(図49(A2)および図49(B2)参照)では、良好な結果を得られなかった。健康な状態であるA1の出力には健康な皮膚組織が存在するはずであったが、出力に創傷床が存在する等、他の組織の存在が観察された。熱傷の場合、生理学から、熱傷の周囲には充血が存在すべきであることがわかっていた。さらに、健康な皮膚は、出力において全層熱傷として分類されるべきではなかった(図49(B2))。10分割交差検証によるモデルの精度は63%であり、これは期待した必要精度よりもはるかに低かった。この2つの結果から、検出を正当化し、小さなデータベースから外れ値を除去することができる。2.3 外れ値の検出 Good results were not obtained with the support vector machine (SVM) algorithm and the k-nearest neighbor (KNN) classification algorithm (see FIGS. 49 (A2) and 49 (B2)). Healthy skin tissue should have been present in the output of A1 in a healthy state, but the presence of other tissues was observed, such as the presence of a wound bed in the output. In the case of burns, physiology has shown that there should be redness around the burn. In addition, healthy skin should not have been classified as full-thickness burns in power (Fig. 49 (B2)). The accuracy of the model by 10-fold cross validation was 63%, which was much lower than the expected required accuracy. From these two results, we can justify the detection and remove outliers from a small database. 2.3 Outlier detection
外れ値がモデルに及ぼす影響を低減するために、上述した確立された最尤推定を基に、2つの新規概念を利用した外れ値検出アルゴリズムを開発した。まず、サンプル空間の中央付近に位置するサンプルのサブセットを部分空間として取り出し、最尤推定を用いてモデルの平均値および標準偏差パラメータを計算した。この部分空間を「第1のウィンドウ」と呼び、新規な係数α1およびα2(0〜0.5、無名数)によってそのサイズを調整した。これらの係数は、当該サンプル空間の中央から左右それぞれの距離として定義される(したがって、第1のウィンドウの幅はα1+α2に等しい)。サンプル空間全体の幅が1となるよう正規化すると、α1=α2=0.5の設定において、サンプル全体が第1のウィンドウとして選択されることになる。これらの係数を適切に調整することによって、分類モデルの分布パラメータ[ガウス分布における平均(μ)および標準偏差(σ)]を計算する前に外れ値を除去することができる。次に、第1のウィンドウ内の外れ値を検出するための閾値を生成するために、(Zスコアまたは他の分布関数による)確率を新しい特徴の重要度(wi)で重み付け(Wi)した。これらのステップの技術的詳細は以下の通りである。 In order to reduce the effect of outliers on the model, we have developed an outlier detection algorithm using two new concepts based on the established maximum likelihood estimation described above. First, a subset of the samples located near the center of the sample space was taken as a subspace, and maximum likelihood estimation was used to calculate the mean and standard deviation parameters of the model. This subspace was called the "first window" and its size was adjusted by new coefficients α1 and α2 (0-0.5, dimensionless). These coefficients are defined as the left and right distances from the center of the sample space (thus, the width of the first window is equal to α1 + α2). If the width of the entire sample space is normalized to 1, the entire sample will be selected as the first window at the setting of α1 = α2 = 0.5. By adjusting these coefficients appropriately, outliers can be removed before calculating the distribution parameters of the classification model [mean (μ) and standard deviation (σ) in the Gaussian distribution]. The probabilities (by Z-score or other distribution function) were then weighted (Wi) by the importance (wi) of the new feature to generate a threshold for detecting outliers in the first window. The technical details of these steps are as follows.
我々は、動物モデルから収集したスペクトルデータからなる大きなサンプル空間から始めた。アルゴリズムの基礎は、確立された最尤推定技術からなる。独立同分布のサンプルであれば、結合密度関数は
![]()
![]()
x1;x2;x3;...;xnはサンプル、θはモデルのパラメータである。関数の尤度は
実際に、対数尤度として知られる尤度関数の対数は、以下のように適用することができる。
θ0を推定するには、次の方程式を最大にするθの値を計算する。
![]()
![]()
最尤推定の方法により、パラメータθ0を計算することができる。サンプルの分布がガウス分布であれば、最尤推定パラメータを表す数学的方程式は
![]()
![]()
ここで、外れ値を検出して除去するための、第2の新規な方法を適用する。外れ値を検出する際に、確率を置き換える重みを指定する。まず、確率(pi)および特徴の重要度(wi)を決定する。確率piは、サンプル分布関数の分布パラメータを用いて計算することができる。例えば、ガウス分布であれば、piは標準Zスコアから生成され、Zスコアは
我々の外れ値検出アルゴリズムについては、下記に従って確率値piの調整を行った。
特徴の重要度wiは、所望のアプリケーション20、21に依存して変わる可能性があり、任意のモデルの精度を改善するために調整することができる。我々の場合、特徴の重要度は、異なる組織クラスをそれぞれ区別するためにMSI装置に実装された8つの波長それぞれの相対的有用性によって決定した。機械学習の領域では、判別情報の多い波長ほど、高い重み値が付与された。Severity w i of features may vary depending on the desired
上記のステップにおいて確率piおよび特徴の重要度wiが計算されると、サンプルの重み(Wi)は次のように計算される。
最後に、データの「第2のウィンドウ」を生成するために、閾値の重み(Wthres hold)が割り当てられる。与えられたサンプルのWiがWthresholdより大きければ、このサンプルはトレーニングセット(第2のウィンドウ)に割り当てられる。さもなければ、このサンプル点は外れ値とみなされ、トレーニングセットから除去される。Finally, in order to generate the "second window" of data, the weight threshold (W thres hold) is assigned. If W i for a given sample is greater than the W threshold The, the sample is assigned to the training set (second window). Otherwise, this sample point is considered an outlier and is removed from the training set.
アルゴリズムの係数(α1,α2,wi、およびWthreshold)として有効な値を見出すために、実験を繰り返した。
3. 結果
3.1 外れ値の検出 Factor Algorithm (α 1, α 2, w i, and W threshold The) to find a valid value as, the experiment was repeated.
3. 3. result
3.1 Outlier detection
データを分類して外れ値を除去するためのアルゴリズムの実行に先立ち、フィルタリングされていないスペクトルイメージングデータをSVMアルゴリズムおよびk最近傍(KNN)分類アルゴリズムによって解析し、複数の熱傷分類モデルのトレーニングを行った。トレーニング後、これらのモデルに分類すべき試験データを与えた際、分類の平均精度は、グラウンドトゥルースに対して全体として63%であった。熱傷モデルにおいてこのベースライン精度を確立した後、同じ分類アルゴリズムのトレーニングを行う前に、スペクトルイメージングデータセットに対してデータ分類外れ値除去アルゴリズムを適用した。 Prior to executing the algorithm for classifying the data and removing outliers, unfiltered spectral imaging data was analyzed by the SVM algorithm and the k-nearest neighbor (KNN) classification algorithm, and multiple burn classification models were trained. It was. After training, when given test data to be classified into these models, the average accuracy of the classification was 63% overall for ground truth. After establishing this baseline accuracy in the burn model, a data outlier removal algorithm was applied to the spectral imaging dataset before training the same classification algorithm.
実験を通じて、アルゴリズムの係数の実効値は、α1=α2=0.2、w1=w2=...=w8=1、Wthreshold=7であることがわかった。これらのパラメータを割り当てた後、「第1のウィンドウ」の平均値および標準偏差のパラメータを、MSIに実装された8つの波長それぞれについて計算した。Throughout the experiment, the effective values of the coefficients of the algorithm are α 1 = α 2 = 0.2, w 1 = w 2 =. .. .. It was found that = w 8 = 1 and W thrashold = 7. After assigning these parameters, the "first window" mean and standard deviation parameters were calculated for each of the eight wavelengths implemented in the MSI.
外れ値を検出して除去した後のデータ分類アルゴリズムの結果を、図48Aおよび図48Bに示す。2次元特徴空間における6つのクラスを、図48Aでは外れ値を含めて示し、図48Bでは外れ値を除去して示している。説明のために、サンプル空間(赤色)は2次元で示し、実装した8つの波長のうち2つのみを表示している。外れ値の検出および除去の後、熱傷分類モデルのトレーニングに使用される部分空間である第2のウィンドウ(青色)は、より均質かつ緊密なクラスタとなっており、理論的に、結果として得られるモデルは精度の高いものとなる。 The results of the data classification algorithm after detecting and removing outliers are shown in FIGS. 48A and 48B. Six classes in the two-dimensional feature space are shown in FIG. 48A including outliers and in FIG. 48B with outliers removed. For illustration purposes, the sample space (red) is shown in two dimensions and only two of the eight wavelengths implemented are displayed. After the detection and removal of outliers, the second window (blue), which is the subspace used for training the burn classification model, is a more homogeneous and intimate cluster, theoretically resulting. The model will be highly accurate.
データ分類と外れ値検出を行うアルゴリズムの結果を8つのMSI波長すべてにわたって視覚化するために、外れ値を検出して除去する前と後の、組織分類のそれぞれにおいてすべての波長で収集したサンプルを表す箱ひげ図を描いた。最初のサンプル空間(図46A−46Fおよび図47A、図47B)では、組織分類はいずれも、特に血液は、相当数の外れ値を含んでいた。外れ値の検出および除去を行うと、部分空間内に残存する外れ値の数は、図47Bに示すように大幅に減少した。 To visualize the results of the data classification and outlier detection algorithms across all eight MSI wavelengths, samples collected at all wavelengths in each of the tissue classifications before and after outlier detection and removal were taken. I drew a box plot to represent it. In the first sample space (FIGS. 46A-46F and 47A, 47B), all tissue classifications, especially blood, contained a significant number of outliers. When the outliers were detected and removed, the number of outliers remaining in the subspace was significantly reduced, as shown in FIG. 47B.
6つの組織分類すべてのスペクトルデータを同時に表示した代表的な2次元サンプル空間を、図48Aおよび図48Bに示す。図47Aおよび図47Bの箱ひげ図のデータは、組織分類ごとに、8つの波長すべてについて、外れ値の検出および除去前(a)および後(b)のサンプル空間を示している。箱は四分位範囲を表している。赤い+の記号は、データの外れ値との境界を示す。外れ値の検出後、サンプル空間に残存する外れ値の数は、いずれの組織クラスにおいても有意に減少したが、とりわけ血液のクラスの減少が顕著であった。血液は明らかな例外であるとしても、様々な組織クラスのプロットは、概してクラスタ状であった。しかし、クラスタ間にはかなりの重複が認められた。外れ値の検出および除去を行うアルゴリズムを適用すると、組織クラス間の分離が、明らかに改善された。外れ値を除去した後、同じ分類アルゴリズム(SVM、KNN等)を使用して、新たな熱傷分類モデルを生成した。全体としての平均モデル精度は、63%から76%へと改善された。 Representative two-dimensional sample spaces displaying spectral data of all six tissue classifications at the same time are shown in FIGS. 48A and 48B. The boxplot data in FIGS. 47A and 47B show sample spaces before and after (a) and after (b) outlier detection and removal for all eight wavelengths for each tissue classification. The box represents the interquartile range. The red + symbol indicates the boundary with the outliers of the data. After the detection of outliers, the number of outliers remaining in the sample space was significantly reduced in all tissue classes, but the blood class was particularly significantly reduced. The plots of the various tissue classes were generally clustered, with the obvious exception of blood. However, there was considerable overlap between the clusters. Applying algorithms to detect and remove outliers clearly improved the separation between tissue classes. After removing the outliers, the same classification algorithm (SVM, KNN, etc.) was used to generate a new burn classification model. The overall average model accuracy improved from 63% to 76%.
外れ値検出のプロセスを示した後の統計的な効果を、各バンドの箱ひげ図によって、図46A−46Fならびに図47Aおよび図47Bに示す。さらに、提案したアルゴリズムの効果を示すために、最も重要な2つの波長を使用して、2次元特徴空間を構築した。可視および近赤外バンドにおける血液の性質のため、サンプル空間全体に青色が広がる。我々のアルゴリズムの使用により、血液のクラスの収束が見られることは明らかである。赤色の健康のクラスについても、同じ説明が適用される。
3.2 動物モデルの結果 The statistical effects after showing the process of outlier detection are shown in FIGS. 46A-46F and 47A and 47B by boxplots for each band. Furthermore, in order to show the effect of the proposed algorithm, a two-dimensional feature space was constructed using the two most important wavelengths. Due to the nature of blood in the visible and near-infrared bands, a blue color spreads throughout the sample space. It is clear that the use of our algorithm results in the convergence of blood classes. The same description applies to the red health class.
3.2 Animal model results
図49に、モデル分類精度の改善を示す。外れ値を除去する前の分類モデルは、健康な皮膚と、生理学的に熱傷を取り囲んでいる充血部とを正確に区別して検出することができなかった。このモデルでは、実際には健康な皮膚の存在する場所が、別のいくつかの組織クラスであると予測された。熱傷の周囲の充血部は、血液の存在として予測された。さらに、充血ゾーンの外側の健康な皮膚は、誤って全層熱傷として分類された。しかし、外れ値を除去した後のモデルは、対照の画像および熱傷の画像のいずれにおいても、健康な皮膚と、熱傷の周囲の充血部とを正確に分類した。
4. 結論 FIG. 49 shows the improvement of the model classification accuracy. The classification model prior to removing outliers failed to accurately distinguish between healthy skin and the hyperemic area that physiologically surrounds the burn. In this model, the location of actually healthy skin was predicted to be some other tissue class. The hyperemic area around the burn was predicted to be the presence of blood. In addition, healthy skin outside the hyperemic zone was incorrectly classified as a full-thickness burn. However, after removing the outliers, the model accurately classified healthy skin and the hyperemic area around the burn in both the control image and the burn image.
4. Conclusion
この実験には、強調に価する点がいくつか存在する。まず、アルゴリズムの係数に割り当てられた値(α1、再帰的処理におけるアプローチ)である。これらの値は、本稿で提示する特定のMSIアプリケーションにおいて効果的に精度を高めたことにより選択された。しかし、他のアプリケーションにおいては、望ましい結果を得るためにこれらの値を調整する必要があるだろう。 There are some points in this experiment that deserve emphasis. First, the value assigned to the coefficient of the algorithm (α1, approach in recursive processing). These values were chosen for their effective accuracy in the particular MSI application presented here. However, in other applications, you may need to adjust these values to get the desired results.
興味深いことに、最適な特徴の重要度(wi)は、波長ごとに最適な値を特定するための実験を行った後に、全波長について1という値に設定された。特徴の重要度(wi)として、最終的にいずれも1が割り当てられたということは、MSI装置に採用された8つの波長それぞれが、互いから独立して特有の分光情報を提供するよう選択されたという事実を反映している。この結果は、波長の選択が、先に記載した皮膚組織と熱傷組織の光学特性に従ってなされたのであれば、驚くには値しない。Interestingly, the importance of the optimal feature (w i), after performing an experiment to determine the best value for each wavelength, which is set to a value of 1 for all wavelengths. Selected as the importance of the feature (w i), and finally that any 1 is assigned, each of the eight wavelengths employed in the MSI device, to provide a specific spectral information independently of each other It reflects the fact that it was done. This result is not surprising if the wavelength selection was made according to the optical properties of the skin and burn tissues described above.
正確に分類することが最も困難な組織は血液であった。図47Aおよび図47Bならびに図48Aおよび図48Bに示されているように、血液として収集されたサンプル空間が不均一であることから、明らかである。血液を特徴付けるスペクトルデータの二峰性分布は、可視光バンドおよび近赤外光バンドにおける血液固有の吸光スペクトルの結果であり、これもまた二峰性である。他の組織クラスはそれぞれ単一の吸光度ピークを有し、スペクトルデータの分布は多少均質度の高いものとなる。 The most difficult tissue to classify accurately was blood. This is evident from the non-uniform sample space collected as blood, as shown in FIGS. 47A and 47B and 48A and 48B. The bimodal distribution of the spectral data that characterizes blood is the result of blood-specific absorption spectra in the visible and near-infrared bands, which are also bimodal. Each of the other tissue classes has a single absorbance peak and the distribution of the spectral data is somewhat more homogeneous.
最終的に、外れ値を検出して除去するアルゴリズムは、皮膚組織を分類するためのMSIアプリケーションの精度を大幅に改善した。このアルゴリズムにより、各組織クラスのサンプル空間における分散を減少させることができた。このようにして分散を抑制することにより、それに対応してスペクトル特性の重なりが低減された。重なりが減少すると、分類モデルのトレーニングが改善され、分類精度の明らかな向上が認められた。最終精度76%を達成したことで、少なくとも、熱傷組織の分類における現在の臨床基準(熱傷専門家による臨床判断)を満たすようにモデルを改善できたと言える。このモデルは、熱傷の専門家を容易には得られない環境において、熱傷の被災者を処置する医師の意思決定を支援する可能性を有している。
切断に関する例示的実施形態の概要 Ultimately, the algorithm for detecting and removing outliers has significantly improved the accuracy of MSI applications for classifying skin tissue. This algorithm was able to reduce the variance in the sample space of each tissue class. By suppressing the dispersion in this way, the overlap of the spectral characteristics was correspondingly reduced. When the overlap was reduced, the training of the classification model was improved, and a clear improvement in classification accuracy was observed. Achieving a final accuracy of 76% can at least improve the model to meet current clinical criteria (clinical judgment by burn specialists) in the classification of burn tissue. This model has the potential to assist physicians in treating burn victims in environments where burn specialists are not readily available.
Overview of exemplary embodiments relating to cutting
上記したような、治癒の可能性を決定するための十分に正確な計測/試験および身体の創傷治癒能力に影響を与えることが知られている複数の因子の欠如は、評価の改善には診断に対する多変量法が必要であることを意味している。Spectral MDは、この問題に対処するための独特の位置にある。というのは、我々の装置は、組織の病理学的プロセスを分類するために、独立した複数の変数として情報を扱うよう設計されているからである。Spectral MDのイメージング装置は、機械学習アルゴリズムを使用して、2つの光学イメージング技術、すなわちフォトプレチスモグラフィイメージング(PPGイメージング)とマルチスペクトルイメージング(MSI)とを組み合わせることにより、糖尿病コントロールや喫煙等の患者の健康指標を用いて予後情報を生成する(図50)。 The lack of sufficiently accurate measurements / tests to determine healing potential and multiple factors known to affect the body's ability to heal wounds, as described above, is diagnosed in improving the assessment. It means that a multivariate method for is needed. Spectral MD is in a unique position to address this issue. This is because our device is designed to treat information as independent variables to classify the pathological processes of tissues. Spectral MD imaging devices use machine learning algorithms to combine two optical imaging techniques: photopretismography imaging (PPG imaging) and multispectral imaging (MSI) for patients with diabetes control, smoking, etc. Prognosis information is generated using the health index of (Fig. 50).
図50に、本明細書の開示に従って患者の健康指標と組み合わせることで、予後情報を生成することのできる2つの光学イメージング技術、すなわちフォトプレチスモグラフィイメージング(PPGイメージング)およびマルチスペクトルイメージング(MSI)を高度に概略化して示す。この装置をDeepView(Gen2)と呼ぶ。DeepView(Gen2)は、血行障害性疾患の患者において適切なLOAを選択するために必要な高感度および高特異性を保持するものとして期待されている。これら2つの光学イメージング法は、動脈灌流および組織の酸素化を含む重要な組織特性を推定するように設計されている。これらの2つの尺度は、LOAの選択にとって重要な鍵となるが、これは、血行障害性疾患を有する患者における創傷治癒が、動脈潅流の深刻な欠如に起因する組織の酸素化の低下によって妨げられることによる(Norgren,Hiatt,Dormandy,Nehler,Harris,& Fowkes,TASC II Working Group. Inter−Society Consensus for the Management of Peripheral Arterial Disease(TASC II),2007)(Mohler III,Screening for Peripheral Artery Disease,2012)。我々の方法を使用すれば、脚の広範囲にわたる組織レベルの灌流を同時に評価して、下肢の低灌流部位を特定することができる。これは、患者の病歴および診察と血管調査(患者の微小循環の詳細な評価を含むことはまれである)との組み合わせに基づいて観察者が適切なLOAを評価しなければならない臨床判断のみに頼った当て推量とは対照的である。一方、DeepView(Gen2)は、創傷治癒の可能性に関して全身的影響を及ぼすような、患者の健康指標の評価も行う。組織の微小循環の局所評価と創傷治癒に影響を与える全身的要因の総合評価とを組み合わせることにより、DeepView(Gen2)は、単一の変数ではなく、創傷治癒に影響を与える複数の要因について説明するものである。 FIG. 50 shows two optical imaging techniques that can generate prognostic information when combined with patient health indicators as disclosed herein: photoplethysmography imaging (PPG imaging) and multispectral imaging (MSI). It is shown in a highly schematic manner. This device is called DeepView (Gen2). DeepView (Gen2) is expected to retain the high sensitivity and specificity required to select the appropriate LOA in patients with hemorrhagic disorders. These two optical imaging methods are designed to estimate important tissue properties, including arterial perfusion and tissue oxygenation. These two measures are important keys to the choice of LOA, which prevent wound healing in patients with impaired hemorrhagic disease by reduced tissue oxygenation due to a severe lack of arterial perfusion. due to the fact that be (Norgren, Hiatt, Dormandy, Nehler, Harris, & Fowkes, TASC II Working Group. Inter-Society Consensus for the Management of Peripheral Arterial Disease (TASC II), 2007) (Mohler III, Screening for Peripheral Artery Disease, 2012). Our method can be used to simultaneously assess extensive tissue-level perfusion of the legs to identify hypoperfused sites in the lower extremities. This is only for clinical decisions where the observer must assess the appropriate LOA based on the combination of the patient's medical history and examination and vascular examination (which rarely includes a detailed assessment of the patient's microcirculation). This is in contrast to the guesswork that we relied on. DeepView (Gen2), on the other hand, also evaluates patient health indicators that have a systemic effect on the likelihood of wound healing. By combining a local assessment of tissue microcirculation with a comprehensive assessment of systemic factors affecting wound healing, DeepView (Gen2) describes multiple factors affecting wound healing rather than a single variable. Is what you do.
DeepView(Gen2)システムでは、適切な予測解析のための多変量システムを調査することを目的として、機械学習と呼ばれる統計学的訓練規律を利用している。このアプローチは、創傷治癒に影響を及ぼす全身的要因(糖尿病、喫煙状況、年齢、栄養状態等)に、現在の技術では微小循環において容易に観察することができない局所的微小循環評価から得られるデータを組み込むことによって、患者の一次創傷治癒の全体的な可能性についての重要な情報を提供するものと考えられる。局所的要因および全身的要因はいずれも最終的な治癒の可能性に影響するため、これらの要因すべてを併せて考慮することによって、DeepView(Gen2)システムの精度が向上する。 The DeepView (Gen2) system utilizes statistical training discipline called machine learning for the purpose of investigating multivariate systems for proper predictive analytics. This approach provides data on systemic factors affecting wound healing (diabetes, smoking status, age, nutritional status, etc.) from local microcirculation assessments that cannot be easily observed in the microcirculation with current technology. By incorporating, it is believed to provide important information about the overall potential of the patient's primary wound healing. Since both local and systemic factors affect the ultimate healing potential, the combined consideration of all of these factors improves the accuracy of the DeepView (Gen2) system.
我々の装置は、研究レベルでは、切断後の一次創傷治癒の可能性予測において、少なくとも95%の感度および95%の特異性を有するであろう(第I相の実現可能性試験および第II相の達成基準参照)。この感度および特異性で切断前の患者の日常的評価に使用されれば、DeepView(Gen2)は再切断率を67%低下させることが期待される。これにより、年間の再切断数を10000回減らすことができ、切断を受けた患者の生活の質が改善され、切断を受けた患者のケアに関する医療経費が削減される。現在、切断前のABI検査に関して、メディケア(Medicare:高齢者向け医療保険制度)は患者1人当たり約150ドルの医療費を負担しているが、費用の大部分は検査を実施する技術者の時間および検査結果を解釈する医師の時間によるものである(Criqui,et al.,2008)。提案する装置は、現行の血管評価と同等の費用で賄えると予想されるため、LOA評価の現在の費用に影響を与えることはない。現行のLOA試験とは異なり、我々のイメージングシステムは消耗品を必要としない。日常的な洗浄および点検の費用は、現在市販されているシステムの費用と同等である。費用については、「商業化計画」において詳述する。 At the research level, our device will have at least 95% sensitivity and 95% specificity in predicting the likelihood of primary wound healing after amputation (Phase I feasibility study and Phase II feasibility study). See Success Criteria for). When used in routine evaluation of pre-cutting patients with this sensitivity and specificity, DeepView (Gen2) is expected to reduce re-cutting rates by 67%. This can reduce the number of amputations per year by 10,000 times, improve the quality of life of amputated patients, and reduce medical costs associated with the care of amputated patients. Currently, Medicare pays about $ 150 per patient for ABI testing before disconnection, but most of the cost is the time of the technician performing the test. And due to the physician's time interpreting the test results (Criqui, et al., 2008). The proposed device is expected to cover the cost of the current vessel assessment and will not affect the current cost of the LOA assessment. Unlike current LOA tests, our imaging system does not require consumables. The cost of routine cleaning and inspection is comparable to the cost of systems currently on the market. The costs will be described in detail in the "Commercialization Plan".
Spectral MDのDeepView(Gen2)イメージング技術は、我々の知る限り、フォトプレチスモグラフィイメージング(PPGイメージング)とマルチスペクトルイメージング(MSI)の光学イメージング技術を融合させて設計された最初のシステムである。図51に、2つの光学イメージング技術、すなわちフォトプレチスモグラフィイメージング(PPGイメージング)およびマルチスペクトルイメージング(MSI)を融合させて設計された装置(DeepView)の例を示す。さらに、これは、我々の知る限り、患者の重要な健康指標をその評価アルゴリズムに組み込むことのできる最初のイメージング技術である。このシステムの開発以前、Spectral MDは、プレチスモグラフィ波形の2次元画像を提供する、米国での販売に関してFDAの認可を受けた最初の企業であった(第1世代(Gen1)技術))。第2世代(Gen2)の技術では、血流評価(すなわち、動脈パルス振幅)と組織の特徴付け(すなわち、スペクトル分析)とを組み合わせることができる。組織からこれらの測定値を同時に取得できれば、いずれかの測定値単独の場合と比べて、組織をより正確に評価することができる(下記の「予備的研究」を参照のこと)。 Spectral MD's DeepView (Gen2) imaging technology is, as far as we know, the first system designed to combine the optical imaging technologies of photopretismography imaging (PPG imaging) and multispectral imaging (MSI). FIG. 51 shows an example of an apparatus (DeepView) designed by fusing two optical imaging techniques, namely photopretismography imaging (PPG imaging) and multispectral imaging (MSI). Moreover, as far as we know, this is the first imaging technique that can incorporate important patient health indicators into its evaluation algorithm. Prior to the development of this system, Spectral MD was the first FDA-approved company to offer two-dimensional images of plethysmography waveforms for sale in the United States (1st generation (Gen1) technology). Second generation (Gen2) techniques can combine blood flow assessment (ie, arterial pulse amplitude) with tissue characterization (ie, spectral analysis). If these measurements can be obtained simultaneously from the tissue, the tissue can be evaluated more accurately than with either measurement alone (see "Preliminary Study" below).
特定のLOAにおける治癒の可能性を判定するための研究から、切断が成功する部位と失敗する部位とでは、組織の酸素レベルに顕著な差があることがわかっている。これらの研究では、経皮酸素化測定(TCOM)を使用して、組織の酸素化についての調査が行われた。しかしながら、TCOMは、数十年にわたって利用可能であったにもかかわらず臨床評価を超えるものとはなっていない。また、大規模な臨床試験でも、特定のLOAにおいて切断の成功の予兆となる組織の酸素化に関する明確なカットオフ値は得られていない。専門家の評価によれば、TCOMが臨床診療に採用されていないことには、いくつかの理由がある。何よりもまず、TCOMでは、データは非常に小さな関心領域から収集される。また、TCOMでは患者の皮膚を熱することが必要となり、これは、特に血行障害性疾患の患者において、時として皮膚の熱傷につながる。さらに、TCOMの結果は、周囲温度の変動や局所的な組織浮腫の影響を受けるため、装置の経時的整合性が制限される。 Studies to determine the healing potential in a particular LOA have shown that there is a significant difference in tissue oxygen levels between successful and unsuccessful cleavage sites. In these studies, transdermal oxygenation measurements (TCOM) were used to investigate tissue oxygenation. However, TCOM has been available for decades but has not exceeded clinical evaluation. Also, large clinical trials have not provided clear cut-off values for tissue oxygenation that are predictive of successful cleavage in a particular LOA. According to expert evaluation, there are several reasons why TCOM has not been adopted in clinical practice. First and foremost, at TCOM, data is collected from a very small area of interest. In addition, TCOM requires the patient's skin to heat, which can sometimes lead to skin burns, especially in patients with hemorrhagic disorders. In addition, TCOM results are affected by changes in ambient temperature and local tissue edema, limiting the integrity of the device over time.
DeepView(Gen2)は、TCOMや利用可能な他の装置の様々な制限を克服することで、選択されたLOAにおける治癒の可能性を予知できるように設計されている。この装置は組織表面の広い領域のデータを捕捉するため、単独の領域ではなく表面全体にわたって組織の酸素化および灌流のばらつきに関する特徴付けおよびマッピングを行うことが可能となる。DeepView(Gen2)は、非侵襲かつ非接触であり、有害な放射線を放出することもないため、患者に害をなす重大なリスクを伴わない。この装置は、周囲温度が多少変動しても、その影響を受けない。しかしながら、最も重要であるのは、DeepView(Gen2)が、臨床的に重要な患者の健康指標(糖尿病の病歴、感染症の存在、喫煙状況、栄養状態等)を解析し、創傷治癒の可能性の包括的な評価をエンドユーザに提供することである。以前の技術では、局所的な組織の酸素化を評価することしかできなかった。
アプローチ DeepView (Gen2) is designed to predict healing potential in selected LOAs by overcoming various limitations of TCOM and other devices available. The device captures data from large areas of the tissue surface, allowing characterization and mapping of tissue oxygenation and perfusion variability over the entire surface rather than alone. DeepView (Gen2) is non-invasive, non-contact, and does not emit harmful radiation, so there is no significant risk of harm to the patient. This device is not affected by slight fluctuations in ambient temperature. However, most importantly, DeepView (Gen2) analyzes clinically important patient health indicators (diabetes history, presence of infections, smoking status, nutritional status, etc.) and the potential for wound healing. To provide end users with a comprehensive assessment of. Previous techniques could only assess local tissue oxygenation.
approach
提案するイメージング装置の態様には、LOAの最適な選択を含む組織分類の様々な用途のための非侵襲的光学イメージングが包含される。Spectral MDのDeepView(Gen2)イメージングシステムは、組織灌流の測定および患者の健康指標に基づく診断画像を提供するポイントオブケア(POC)灌流イメージングシステムである。看護スタッフがイメージング検査を行うためのトレーニングは、容易である。手足のイメージングに要する時間は約10分間であり、結果は、医師が検討できるように電子的に保存される。患者側から見れば、この検査には有害な副作用がなく、皮膚への接触がなく、不快感も生じないため、非常に受け入れやすい。 The proposed imaging device aspects include non-invasive optical imaging for a variety of tissue classification applications, including optimal selection of LOA. The Septral MD DeepView (Gen2) imaging system is a point-of-care (POC) perfusion imaging system that provides diagnostic images based on tissue perfusion measurements and patient health indicators. Training for nursing staff to perform imaging tests is easy. The time required for limb imaging is approximately 10 minutes and the results are stored electronically for review by the physician. From the patient's perspective, this test is very acceptable as it has no harmful side effects, no skin contact, and no discomfort.
この提案において研究すべき重要な革新的事項は、切断計画における創傷の治癒可能性についての診断精度を向上させるために、微小循環評価に患者の健康指標を追加することである。次のセクションで、DeepViewの各要素の個々の値を提示し、これら複数の変数をどのように組み合わせることで創傷の治癒可能性についての1つの予測を得ることができるか、簡単な考察を述べて締めくくることとする。 An important innovation to be studied in this proposal is to add patient health indicators to the microcirculatory assessment to improve the diagnostic accuracy of wound healability in cutting strategies. In the next section, we present the individual values for each element of DeepView and give a brief look at how these multiple variables can be combined to give a single prediction of wound healing potential. I will conclude.
上述の通り、DeepView(Gen2)装置は、血流評価の2つの光学イメージング法を同時に実行する。2つのイメージング法のうち1つ目のPPGイメージングは、心拍数、呼吸数、およびSpO2等のバイタルサインを捕捉するためのパルスオキシメトリで使用されている技術と同一であるが、DeepView(Gen2)は、組織の広い範囲にわたって100万に及ぶ固有のPPG信号を捕捉することから、より進んだ技術であると言える(Severinghaus&Honda,1987)。PPG信号は、光と血管組織における動的変化との相互作用の測定によって生成される。血管組織は、心拍周期の収縮期血圧波に合わせてその容積が約1〜2%の膨張および収縮を繰り返す(Webster,1997)。この血液の流入は、組織の容積を増し、光を強く吸収するヘモグロビンタンパクをさらに運び入れる。そのため、この組織における光の総吸収度は、心拍に合わせて規則的に変動する。この情報は、パルスオキシメータによって報告される生命信号に翻訳されうる。 As mentioned above, the DeepView (Gen2) device simultaneously performs two optical imaging methods for blood flow evaluation. The first of the two imaging methods, PPG imaging, is identical to the technique used in pulse oximetry to capture vital signs such as heart rate, respiratory rate, and SpO2, but DeepView (Gen2). Is a more advanced technique because it captures one million unique PPG signals over a wide area of the tissue (Severinghaus & Honda, 1987). The PPG signal is generated by measuring the interaction of light with dynamic changes in vascular tissue. The vascular tissue repeats expansion and contraction with a volume of about 1 to 2% in accordance with the systolic blood pressure wave of the heartbeat cycle (Webster, 1997). This influx of blood increases the volume of tissue and further carries in hemoglobin protein, which absorbs light strongly. Therefore, the total light absorption in this tissue fluctuates regularly with the heartbeat. This information can be translated into a life signal reported by a pulse oximeter.
プレチスモグラムから画像を生成するために、組織を通る光路を利用する(Thatcher,Plant,King,Block,Fan,&iMaio,2014)。組織の表面に入射する光の一部は、組織内で散乱する。この散乱光の一部は、最初に入射したときと同じ表面を通って組織から出る(Hu,Peris,Echiadis,Zheng,& Shi,2009)。高感度のデジタルカメラを用いて、組織のある領域におけるこの後方散乱光の収集を行うが、その際、イメージング装置の各画素が、散乱光の強度の変化によって決まる固有のPPG波形を含むようにする。相対的な組織血流2次元ビジュアルマップを生成するために、固有の波形それぞれの振幅を測定する。精度を向上させるために、多くの拍動サンプルの平均振幅を測定する。 Optical paths through tissues are used to generate images from plethysmograms (Thatcher, Plant, King, Block, Fan, & iMaio, 2014). Some of the light incident on the surface of the tissue is scattered within the tissue. Some of this scattered light exits the tissue through the same surface as when it was first incident (Hu, Peris, Echiadis, Zheng, & Shi, 2009). A sensitive digital camera is used to collect this backward scattered light in a region of the tissue so that each pixel of the imaging device contains a unique PPG waveform that is determined by the change in the intensity of the scattered light. To do. The amplitude of each unique waveform is measured to generate a two-dimensional visual map of relative tissue blood flow. To improve accuracy, measure the average amplitude of many beating samples.
DeepView(Gen2)が行う2つ目の光学的測定はMSIである。この技術は、可視光と近赤外(NIR)光(400〜100nm)の選択波長に関して、組織の表面からの反射率を測定するものである。物質のスペクトルによる特性評価は、主として地質探査や軍事標的の検出のためのリモートセンシング(例えば、衛星や飛行中のイメージング)に使用されているが、この技術は、医療用途に進出しつつある(Li,He,Wang,Liu,Xu,& Guo,2013)。この方法は、PADを含む多くの病態に関連する重要な皮膚特性の定量化に有効である。LOAの選択に関して、MSIは、ヘモグロビンの容積分率および酸素化されたヘモグロビンの存在を定量化することができる(Jolivot,Benezeth,& Marzani,2013)(Zonios,Bykowski,& Kollias,2001)。この技術の他の用途については、後の「予備的研究」において記載する。 The second optical measurement made by DeepView (Gen2) is MSI. This technique measures the reflectance from the surface of a tissue with respect to selected wavelengths of visible and near infrared (NIR) light (400-100 nm). Spectral characterization of materials is primarily used for remote sensing for geological exploration and detection of military targets (eg, satellite and in-flight imaging), but this technology is advancing into medical applications (eg, satellite and in-flight imaging). Li, He, Wang, Liu, Xu, & Guo, 2013). This method is effective in quantifying important skin properties associated with many pathologies, including PAD. With respect to LOA selection, MSI can quantify the volume fraction of hemoglobin and the presence of oxygenated hemoglobin (Jolivot, Benezeth, & Marzani, 2013) (Zonios, Bykouski, & Kollias, 2001). Other uses of this technique will be described later in the "Preliminary Study".
DeepView(Gen2)のMSIで使用する光の波長は、光と組織との相互作用の確立された特徴付けに基づいて選択される。角質層および表皮に存在するメラニンは、主として紫外波長および可視波長を吸収する。近赤外光波長(700〜5000nm)は、メラニンにほとんど吸収されず真皮を貫通するため、真皮の深さの測定には最良であることがわかっている。ヘモグロビンは、真皮を通る血管内に多く含まれ、その濃度によって、320nmを超える波長が真皮に吸収される度合いが決まる。ヘモグロビンによる光の吸収は、分子が酸素化されているか否かによっても変化する。組織におけるメラニンおよびヘモグロビンの濃度ならびに酸素化されたヘモグロビンの割合が疾患状態の間に変化すると、MSIは結果として生じる反射スペクトルの変化を検出することができる。したがって、異常な皮膚組織は、その反射スペクトルの変化を健康な組織と比較することによって特定することができる。MSIは、より新しいハイパースペクトルイメージング装置と比較すると、組織を特徴付けるための固有の波長数は少ないが、空間分解能、スペクトル範囲、画像取得速度、およびコストの組み合わせを総合的に考慮すると、より優れている(Lu&Fei,2014)。 The wavelength of light used in DeepView (Gen2) MSI is selected based on the established characterization of light-tissue interactions. Melanin present in the stratum corneum and epidermis mainly absorbs ultraviolet and visible wavelengths. Near-infrared light wavelengths (700-5000 nm) are known to be the best for measuring the depth of the dermis because they are hardly absorbed by melanin and penetrate the dermis. Hemoglobin is abundantly contained in blood vessels passing through the dermis, and its concentration determines the degree to which wavelengths exceeding 320 nm are absorbed by the dermis. The absorption of light by hemoglobin also depends on whether the molecule is oxygenated or not. When the concentration of melanin and hemoglobin in the tissue and the proportion of oxygenated hemoglobin change during the disease state, MSI can detect the resulting changes in the reflection spectrum. Therefore, abnormal skin tissue can be identified by comparing changes in its reflection spectrum with healthy tissue. MSI has fewer unique wavenumbers to characterize tissue when compared to newer hyperspectral imaging devices, but is better when combined with spatial resolution, spectral range, image acquisition speed, and cost. (Lu & Fei, 2014).
DeepView(Gen2)が利用するデータの第3の要素は、日常的な患者の評価において収集された、関連する患者の健康指標である。創傷治癒に影響を及ぼす様々な因子が特定され、詳細に記載されている。通常、これらの因子(患者の年齢、糖尿病の診断、喫煙歴、感染症、肥満、投薬、栄養状態を含む)の多くまたはすべてが、血行障害性疾患により下肢切断を受ける患者に影響を与える。臨床医は現在、見込みのあるLOAを評価する際に、これらの変数をゲシュタルト的に考慮するが、DeepView(Gen2)は、これらの指標を定量的に評価することにより、所定のLOAにおける一次創傷治癒の可能性を予測することができる。患者の健康指標と光学イメージングデータとの統合は、DeepView装置の機械学習アルゴリズムによって実行される。医師は、イメージングに際して、関連する患者の健康指標を装置に入力するだけでよい。このデータは、PPGイメージングおよびMSIによって収集された光学データと同様に、機械学習アルゴリズムには追加の変数として扱われる。機械学習アルゴリズムは、トレーニングにより、DeepView(Gen2)によって収集されたすべてのデータを評価した後、定量的な出力を生成する。定量的出力は翻訳されて、走査された組織表面の複数の領域が切断後に治癒する可能性の高い領域であるか低い領域であるかを特定できる画像となる。 A third element of the data utilized by DeepView (Gen2) is the relevant patient health indicators collected in routine patient assessments. Various factors affecting wound healing have been identified and described in detail. Usually, many or all of these factors, including patient age, diabetes diagnosis, smoking history, infections, obesity, medications, and nutritional status, affect patients undergoing lower limb amputation due to hemorrhagic disorders. Clinicians currently consider these variables in a gestalt manner when assessing prospective LOA, but DeepView (Gen2) quantitatively evaluates these indicators to provide primary wounds in a given LOA. The possibility of healing can be predicted. The integration of patient health indicators with optical imaging data is performed by the machine learning algorithm of the DeepView device. The physician only needs to enter the relevant patient health indicators into the device for imaging. This data, like the optical data collected by PPG imaging and MSI, is treated as an additional variable in machine learning algorithms. The machine learning algorithm evaluates all the data collected by DeepView (Gen2) by training and then produces a quantitative output. The quantitative output is translated into an image that can identify whether multiple regions of the scanned tissue surface are regions that are likely or less likely to heal after cutting.
DeepView(Gen2)の装置は、DeepView(Gen1)のPPGイメージング装置と、MSIカメラと、患者の客観的健康指標の入力とを組み合わせたものである(図52)。図52に、DeepView(Gen1)PPGイメージング装置、MSIカメラ、および患者の客観的健康指標の入力の組み合わせの例を示す。
予備的研究 The DeepView (Gen2) device is a combination of a DeepView (Gen1) PPG imaging device, an MSI camera, and an input of an objective health index for the patient (FIG. 52). FIG. 52 shows an example of a combination of a DeepView (Gen1) PPG imaging device, an MSI camera, and a patient's objective health index input.
Preliminary research
システムの設定およびアルゴリズムを調整することにより、異なる病理学的条件下で組織特性を評価することができるようにDeepView(Gen2)を調整することができる。この提案の第I相におけるLOAの研究に向けて、特定のアルゴリズムを開発し、一次切断後の創傷治癒を予測するためにパルス振幅および組織の酸素化の測定に合わせた特定の光学機器とフィルターを使用することとする(「実験の計画および方法」のセクションを参照のこと)。提案する技術に関して、可能性のある別用途のために一連のベンチトップ試験、前臨床試験、およびパイロット臨床試験を行い、成功を収めた。LOAを選択における本装置の使用をサポートするために、これらのテストの結果を提示する。
前臨床熱傷モデル By adjusting the system settings and algorithms, DeepView (Gen2) can be adjusted so that tissue characteristics can be evaluated under different pathological conditions. For the study of LOA in Phase I of this proposal, specific algorithms were developed and specific optics and filters tailored to pulse amplitude and tissue oxygenation measurements to predict wound healing after primary amputation. (See the "Experimental Planning and Methods" section). A series of benchtop, preclinical, and pilot clinical trials have been successfully performed on the proposed technology for possible alternative uses. The results of these tests are presented to support the use of the device in selecting LOA.
Preclinical burn model
熱傷の壊死組織除去における外科医をガイドするための使用を意図して、血流(すなわち、動脈パルス振幅)と組織構造の完全性(血液量、炎症、および壊死を含む)との組み合わせの検出(例えば、スペクトル解析)に特有の光学機器、フィルター、およびアルゴリズムを使用した。表皮の微小血管系の状態を評価するための、我々のPPGアルゴリズムおよびMSIアルゴリズムは、個別に用いても同時に使用しても、熱傷後の壊死組織を正確に特定することが続いて実証された。DeepView(Gen2)PPGイメージングシステムの使用により、熱傷により壊死した組織における血流は周囲の健康な組織における血流と顕著に異なることを確認した。MSIカメラを用いて、IACUCに承認されたブタ熱傷モデル実験において、外科的に除去する必要のある熱傷組織の存在を、組織病理学的なゴールドスタンダードに従って正確に特定できる(96%の感度および82%の特異性)ことを実証した。 Detection of a combination of blood flow (ie, arterial pulse amplitude) and tissue structural integrity (including blood volume, inflammation, and necrosis), intended for use to guide the surgeon in the removal of necrotic tissue from burns. For example, spectrum analysis) specific optical equipment, filters, and algorithms were used. Our PPG and MSI algorithms for assessing the condition of the microvascular system of the epidermis, both individually and simultaneously, have subsequently been demonstrated to accurately identify necrotic tissue after burns. .. By using the DeepView (Gen2) PPG imaging system, it was confirmed that the blood flow in the tissue necrotic due to burns was significantly different from the blood flow in the surrounding healthy tissue. Using an MSI camera, in an IACUC-approved porcine burn model experiment, the presence of burn tissue that needs to be surgically removed can be accurately identified according to the histopathological gold standard (96% sensitivity and 82). % Specificity) was demonstrated.
簡単に説明すると、熱した棒を圧力を制御しつつ4匹のミニブタに押し当て、24箇所の深達性中間層熱傷を作製した。受傷の10分後に、1.0mmの壊死組織除去を、健康な組織に達するまで連続的に行い、除去直後のPPG信号およびMSI信号を得た。壊死組織を除去する都度、切除した組織サンプルを処理し、盲検法で評価を行う組織病理学者に提供した。ゴールドスタンダードである組織病理学的評価において、認定組織病理学者は、各切除片における健康な創傷床組織および非生存熱傷組織を特定した。さらに、認定外科医が熱傷のカラー写真を盲検的に観察し、健康な創傷床組織および非生存熱傷組織を特定した。我々は組織病理学者および外科医の解析結果を知ることなく独立して作業を行い、PPGおよびMSIの評価結果を決定した。 Briefly, a heated rod was pressed against four mini pigs with controlled pressure to create 24 deep intermediate burns. Ten minutes after injury, 1.0 mm necrotic tissue removal was performed continuously until healthy tissue was reached to obtain PPG and MSI signals immediately after removal. Each time the necrotic tissue was removed, the resected tissue sample was treated and provided to a histopathologist for a blinded evaluation. In a gold standard histopathological assessment, certified histopathologists identified healthy wound bed tissue and non-surviving burn tissue in each excision. In addition, a certified surgeon blindly observed a color photograph of the burn to identify healthy wound bed tissue and non-surviving burn tissue. We worked independently without knowing the analysis results of histopathologists and surgeons to determine the evaluation results of PPG and MSI.
異なる組織クラス間のPPG信号強度の差異を特定することにより、我々のPPGイメージング装置は、組織学的評価による判定と同様に、壊死組織除去の適切な点を特定することができた。一連のデータの収集は、熱傷を導入する前の関心部位におけるPPG信号の測定から開始したが、無傷の皮膚のPPG信号は、予想通りに一様に健康な組織を示した。しかしながら、熱傷が発生すると、熱傷が生じた場所に相当する画像の中心部のPPG信号は劇的に低下する。一方、周囲の組織はなお、健康な無傷の組織に一致する信号を示していた。 By identifying differences in PPG signal strength between different tissue classes, our PPG imaging device was able to identify appropriate points for necrotic tissue removal, as well as histological assessment. The collection of data began with the measurement of the PPG signal at the site of interest prior to the introduction of the burn, but the PPG signal of intact skin showed uniformly healthy tissue as expected. However, when a burn occurs, the PPG signal in the center of the image corresponding to the location of the burn is dramatically reduced. The surrounding tissue, on the other hand, still showed a signal consistent with healthy, intact tissue.
図53に、熱傷組織の信号と、壊死組織除去によって現れた健康な創傷床の信号の違いを示す。連続的な壊死組織除去に続いて処理された画像は、さらなる切除を必要とする熱傷組織の信号と、壊死組織除去によって最終的に現れた健康な創傷床の信号との顕著な違いを示している。熱傷組織の平均信号強度は2.8±1.8dBであり、健康な皮膚および健康な創傷床組織の信号強度は、いずれもそれよりも相当大きく、それぞれ4.4±2.2dBおよび4.2±2.6dBであった(p<0.05)。驚くには値しないが、PPGの所見と組織病理学者および外科医の所見とは、完全に一致していた。 FIG. 53 shows the difference between the burn tissue signal and the healthy wound bed signal manifested by necrotic tissue removal. Images processed following continuous necrotic tissue removal show a striking difference between the signal of burned tissue requiring further excision and the signal of a healthy wound bed ultimately manifested by necrotic tissue removal. There is. The average signal strength of burned tissue was 2.8 ± 1.8 dB, and the signal strength of healthy skin and healthy wound bed tissue were both significantly higher, 4.4 ± 2.2 dB and 4., respectively. It was 2 ± 2.6 dB (p <0.05). Not surprisingly, the findings of PPG and those of histopathologists and surgeons were in perfect agreement.
同じ実験を通して、MSIによる評価は、熱傷壊死組織除去中に存在する重要な生理学的組織クラスを、82%の精度で正確に分類することができた。特に、熱傷壊死組織については、組織病理学的判定によれば、96%の感度および82%の特異性を達成した。このMSIによる評価では、健康な皮膚、充血、創傷床、血液、軽度の熱傷、および重度の壊死熱傷の6つの可能な生理学的クラスが組み入れられた。図54に、これら6つの例示的生理学的クラスを示す。熱傷部位の複数の相を通る一連のPPG信号と同様に、MSIの結果においても、熱傷発生前の健康な皮膚の均一性が最初に検出され、続いて、健康な創傷床に到達するまでの連続的な壊死組織除去の間、様々な種類の生存組織および非生存組織が、正確に識別された。 Throughout the same experiment, the MSI assessment was able to accurately classify the important physiological tissue classes present during burn necrotic tissue removal with an accuracy of 82%. In particular, for burned necrotic tissue, histopathological determination achieved 96% sensitivity and 82% specificity. This MSI assessment included six possible physiological classes: healthy skin, hyperemia, wound bed, blood, mild burns, and severe necrotic burns. FIG. 54 shows these six exemplary physiological classes. Similar to the series of PPG signals that pass through multiple phases of the burn site, the MSI results first detect healthy skin uniformity before the burn, followed by reaching a healthy wound bed. During continuous necrotic tissue removal, various types of viable and non-viable tissue were accurately identified.
最後のステップで、組み合わせされたPPGデータとMSIのデータの有効性を評価した。上述の通り、同一の熱傷におけるPPG信号とMSI信号を、1つのイメージングシステムで同時に収集した。組み合わせたデータおよび機械学習アルゴリズムを使用して、2つの測定を融合させる効果を試験した。このデータセットから、MSI単独での精度は82%であることがわかった。MSIデータを有するクラシファイヤにPPGデータを含めると、全体の精度は88%に向上した。図55は、PPGデータ、MSIデータ、およびPPGデータとMSIデータとを組み合わせた結果を示す画像である。
パイロット臨床試験(実現可能性試験) In the final step, the validity of the combined PPG and MSI data was evaluated. As mentioned above, the PPG and MSI signals for the same burn were simultaneously collected by one imaging system. The combined data and machine learning algorithms were used to test the effect of fusing the two measurements. From this dataset, it was found that the accuracy of MSI alone was 82%. Including PPG data in classifiers with MSI data improved overall accuracy to 88%. FIG. 55 is an image showing the PPG data, the MSI data, and the result of combining the PPG data and the MSI data.
Pilot clinical trial (feasibility study)
図56に、手、大腿、および足の部位におけるPPG信号の例を示す。DeepView(Gen1)PPGイメージング装置についても、様々な臨床応用において有用な血流データを提供するために、PPGイメージングの能力を確認するパイロット臨床試験を実施した。データには、褥瘡潰瘍、皮膚移植、および下肢虚血における組織生存率を決定するために心血管ICUの患者から収集した皮膚血流のPPG画像が含まれていた。パイロット臨床評価の一例として、大動脈解離により膝窩動脈の両側凝固および四肢への血流異常が生じている女性の症例を示す。血管外科医の臨床評価から、膝よりも遠位の脚部における血流減少が予測された。手、大腿(膝の近位)および足の脈動性血流の存在を測定した。得られた画像によれば、手および大腿部にはPPG信号(脈動性部位)が存在するが、足には脈動流が存在せず、この結果は、患者の既知の臨床状態と相関するものであった。これらの予備調査によって証明されたDeepView技術の血流検出能は、LOAの選択をガイドする能力を有するDeepView装置の重要な特徴である。
要約および考察 FIG. 56 shows an example of PPG signals at the hands, thighs, and feet. The DeepView (Gen1) PPG imaging device was also subjected to a pilot clinical trial to confirm the ability of PPG imaging to provide useful blood flow data in various clinical applications. The data included PPG images of skin blood flow collected from patients in cardiovascular ICU to determine tissue survival in decubitus ulcers, skin grafts, and lower extremity ischemia. As an example of a pilot clinical evaluation, a case of a woman who has bilateral coagulation of the popliteal artery and abnormal blood flow to the limbs due to aortic dissection is shown. Clinical evaluation by a vascular surgeon predicted decreased blood flow in the legs distal to the knee. The presence of pulsatile blood flow in the hands, thighs (proximal to the knees) and feet was measured. The images obtained show the presence of PPG signals (pulsatile sites) in the hands and thighs, but no pulsatile flow in the feet, a result that correlates with the patient's known clinical status. It was a thing. The blood flow detection capability of the DeepView technique proven by these preliminary studies is an important feature of the DeepView device capable of guiding the selection of LOA.
Summary and discussion
PPGおよびMSIの機能を備えた装置の使用により、熱傷モデルおよび患者の症例において血流および酸素含有量が不足している組織を特定できることを実証した。我々の技術の直接的な実現方法は、熱傷の分類とPADにおけるLOAの特定とでは異なるが、プロセスの基本的な原理は同じである。臨床ユーザが熱傷を調査しているか、様々なLOAにおける潜在的な一次創傷部位を評価しているかに関わらず、いずれの状況においても同じ物理的組織成分の測定を行う。熱傷の評価とLOAの評価(または可能なその他の評価)で異なるのは、異なるアルゴリズムとフィルターセットが使用されることのみである。上で示したように、我々の技術では、PPGとMSIをいずれも使用することにより、表皮の微小血管系および血液灌流の減少によって引き起こされる病理をより正確に調べることができる。我々の技術によれば、熱傷の調査で情報をもたらした原理と同じ原理に基づいて、所定のLOAにおける治癒の可能性を予測することができる。創傷治癒の結果に影響を与える重要な患者の健康指標を追加することで、DeepView(Gen2)の精度はさらに向上するはずである。第I相試験において、この仮説を検証する。
実験計画および方法:第I相 パイロット臨床試験 It has been demonstrated that the use of devices with PPG and MSI capabilities can identify tissues with deficient blood flow and oxygen content in burn models and patient cases. The direct implementation of our technology differs between the classification of burns and the identification of LOA in PAD, but the basic principles of the process are the same. The same physical tissue composition measurements are made in all situations, regardless of whether the clinical user is investigating burns or assessing potential primary wound sites in various LOAs. The only difference between the burn assessment and the LOA assessment (or any other possible assessment) is the use of different algorithms and filter sets. As shown above, our technique allows the use of both PPG and MSI to more accurately investigate the pathology caused by the reduction of epidermal microvasculature and hemoperfusion. According to our technique, it is possible to predict the likelihood of healing in a given LOA based on the same principles that provided information in the investigation of burns. The accuracy of DeepView (Gen2) should be further improved by adding important patient health indicators that affect the outcome of wound healing. This hypothesis will be tested in Phase I trials.
Design of Experiments and Methods: Phase I Pilot Clinical Trials
第I相での具体的な目的は、パイロット臨床試験における切断部位の治癒能力診断に我々の装置を使用することの実現可能性の試験である。この評価の一環として、様々な切断シナリオにおける治癒能力を診断するための機械学習診断アルゴリズムをトレーニングする目的で、多数の切断患者からデータを収集する。試験のこの段階では、ヒトが適切なモデルとなるが、これは、装置が迅速かつ非侵襲的であり、ベッドサイドや術前のような日常のケア環境でイメージングによる研究を実施できることによる。 The specific purpose of Phase I is to test the feasibility of using our device to diagnose the healing ability of amputated sites in pilot clinical trials. As part of this assessment, data will be collected from a large number of amputated patients for the purpose of training machine learning diagnostic algorithms for diagnosing healing ability in various amputation scenarios. At this stage of the study, humans are a suitable model because the device is rapid and non-invasive, allowing imaging studies to be performed in routine care environments such as bedside and preoperatively.
図57に、機械学習診断アルゴリズムをトレーニングするプロセスの例を示す。機械学習診断アルゴリズムをトレーニングするには、それを最終的に使用する母集団からのデータが必要とされる(図57)。重要であるのは、アルゴリズムの精度は、トレーニングデータの真の状態(この場合は、治癒しない切断グループと治癒する切断グループ)を特定するために使用される方法と同程度にしかならないことである。これに対処する目的で、結果を追跡し、分類するための標準切断治癒評価システムを作成した。試験対象についての結果が積み上がると、アルゴリズムを発展させ、解析する作業を開始できる。機械学習アルゴリズムの開発では、初期精度の決定、精度改善のための調査の実行、および新たな精度の評価が繰り返される。この実行可能性パイロット試験は、微小循環イメージングと患者の健康指標とを組み合わせると、より大規模な中枢試験における成功の可能性が高くなることを示す証拠となる。 FIG. 57 shows an example of the process of training a machine learning diagnostic algorithm. Training a machine learning diagnostic algorithm requires data from the population that will ultimately use it (Fig. 57). Importantly, the accuracy of the algorithm is only comparable to the method used to identify the true state of the training data (in this case, the non-healing and healing cutting groups). .. To address this, a standard amputation healing assessment system was created to track and classify the results. Once the results for the test subject are accumulated, the work of developing and analyzing the algorithm can be started. In the development of machine learning algorithms, the determination of initial accuracy, the execution of surveys to improve accuracy, and the evaluation of new accuracy are repeated. This feasibility pilot trial provides evidence that the combination of microcirculatory imaging and patient health indicators increases the likelihood of success in larger central trials.
これは、60人の患者の調査からなるパイロット臨床試験計画であり、PAD患者の切断の一次治癒に関するDeepView(Gen2)システムの予測精度を、現在のケア標準と比較するものである。 This is a pilot clinical trial program consisting of a study of 60 patients, comparing the predictive accuracy of the DeepView (Gen2) system for primary cure of amputation in PAD patients with current care standards.
DeepView(Gen2)イメージング装置は、光学的方法によって、皮膚の血液供給に関するスペクトル信号およびPPG信号を、広い範囲(最大15×20cmの組織)から収集する。この装置は、下肢の皮膚の微小循環を複数の大きな部位にわたって調査することに適している。DeepView装置の特徴は、患者の重要な健康特性をその診断アルゴリズムに統合して精度を高められることである。パイロット試験では、中枢試験で確認されることになる患者の重要な健康指標を特定する。この試験の主要な目的は、装置の機械学習診断アルゴリズムに含まれる患者の健康指標によって、微小循環測定単独の場合よりも精度が高まることの確認である。この試験では、従来のLOAそれぞれにおける微小循環を測定し、創傷治癒に影響を及ぼす患者の健康特性と組み合わせることで、切断後の患者における一次創傷治癒の見込みとの相関を見極める。 The DeepView (Gen2) imaging device collects spectral and PPG signals relating to the blood supply of the skin from a wide range (tissues up to 15 x 20 cm) by optical methods. This device is suitable for investigating the microcirculation of the skin of the lower extremities over multiple large sites. A feature of the DeepView device is that it integrates the patient's important health characteristics into its diagnostic algorithm for increased accuracy. Pilot trials identify important patient health indicators that will be confirmed in central trials. The main purpose of this study is to confirm that the patient health indicators included in the device's machine learning diagnostic algorithms are more accurate than microcirculation measurements alone. In this study, microcirculation in each conventional LOA is measured and combined with the patient's health characteristics that affect wound healing to determine the correlation with the likelihood of primary wound healing in the patient after amputation.
すべての患者の切断予定の下肢について検査を行い、試験に含める。臨床関連の患者の健康情報は、施設のケア提供者が収集する。我々の実験的イメージング装置を用いた測定は、Spectral MDによってあらかじめトレーニングされた病院のスタッフが行うこととして、イメージング試験が実施される。 All patients will be examined for amputated lower limbs and included in the study. Health information for clinically relevant patients is collected by the institutional care provider. Measurements using our experimental imaging equipment are performed by imaging tests as performed by hospital staff pre-trained by Spectral MD.
切断端を覆うために使用される皮膚の部位は、DeepView(Gen2)LOAアルゴリズムによって、治癒能力の有無について評価される。DeepView(Gen2)による解析を担当する技術者には、切断が行われる箇所についての臨床判断の結果は知らされない。 The area of skin used to cover the cut end is evaluated for healing ability by the DeepView (Gen2) LOA algorithm. The technician responsible for the analysis by DeepView (Gen2) is not informed of the results of the clinical decision as to where the amputation will take place.
真の陽性(+)および真の陰性(−)の事象、あるいは治癒しない対象および治癒した対象を得るために、切断後の一次創傷治癒評価標準(表2)を使用する。この評価は、3つのカテゴリー、すなわち切断成功、治癒遅延を伴う切断成功、および治癒不全から構成されている。切断成功は、30日以内に肉芽組織が完成して治癒し、さらなる切断の必要がない状態と考えられる。治癒遅延を伴う切断成功は、治癒が遅延して30日後の肉芽組織形成は不完全であるが、6ヶ月以内に最終的な治癒に至り、さらに近位での再切断の必要はない状態と考えられる。治癒不全は、壊死および/もしくは壊疽が生じ、かつ/またはさらに近位での再切断の必要がある状態と特徴付けられる。また、治癒に血管再建が必要となる創傷は、切断失敗と考える。
この治癒評価は、手術の30日後に行う。治癒の遅れている対象については、手術の6ヶ月後に2回目の治癒評価を行う。6カ月後も治癒せず、かつより近位での再切断を受けていない対象は、非治癒群に分類される。 This cure assessment is performed 30 days after surgery. For subjects with delayed healing, a second healing assessment will be performed 6 months after surgery. Subjects who have not healed after 6 months and have not undergone more proximal re-cutting are classified in the non-healing group.
図58に、臨床検査のフローの例を示す。DeepViewイメージング評価(図58):Spectral MDのGen 2装置を用いた皮膚をイメージングすることによって、対象それぞれの微小循環データを収集する。切断が予定されている脚を、それぞれ約30秒間走査する。PAD患者における従来の外科的切断法に従い、足首および足の各部位をイメージングする。従来の切断とは、膝上(AKA)、膝下(BKA)、足首の上(すなわち足)、中足骨横断、またはつま先である。断端を覆う組織片として使用する皮膚部位を選択して解析する(図59)。 FIG. 58 shows an example of the flow of clinical examination. DeepView Imaging Evaluation (FIG. 58): Microcirculation data for each subject is collected by imaging the skin using the
図59に、従来の切断手術に関わる組織を例示する。点線は皮膚の切開位置を示し、赤い楕円は、切断の一次治癒を成功させるためには生存している必要のある皮膚の位置を示す。 FIG. 59 illustrates tissues involved in conventional amputation. The dotted line indicates the location of the incision in the skin, and the red ellipse indicates the location of the skin that must be alive for successful primary healing of the cut.
診断モデルで使用される患者の重要な健康指標は、個々の臨床現場の臨床スタッフにより収集される。ケア標準を超えるデータは一切収集しない。そのような指標としては、糖尿病コントロール(例えば、HbA1c、グルコース、およびインスリン)、喫煙歴、肥満(例えば、BMIまたは腹囲)、栄養物(例えば、アルブミン、プレアルブミン、トランスフェリン等)、感染症(例えば、白血球数、顆粒球の状態、体温、抗生物質の使用)、年齢、傷害のメカニズム、および重要な投薬(例えば、グルココルチコイドまたは化学療法)等が挙げられるが、これらに限定されない。この情報は、DeepViewイメージング装置のソフトウェアへの入力により、診断アルゴリズムに追加される。 Important patient health indicators used in the diagnostic model are collected by clinical staff in individual clinical settings. We do not collect any data that exceeds the care standard. Such indicators include diabetes control (eg, HbA1c, glucose, and insulin), smoking history, obesity (eg, BMI or abdominal circumference), nutrients (eg, albumin, prealbumin, transferase, etc.), infections (eg, albumin, prealbumin, transferase, etc.). , White blood cell count, granulocyte status, body temperature, use of antibiotics), age, mechanism of injury, and important medications (eg, glucocorticoid or chemotherapy), but not limited to these. This information is added to the diagnostic algorithm by inputting it into the software of the DeepView imaging device.
対象を非治癒(+の事象)と治癒(−の事象)クラスへと分類する機械学習アルゴリズムの開発は、各患者について収集された臨床的特徴に基づいて行われる。最初に、特徴のすべてをアルゴリズムに含める。次いで、以下のような10分割交差検証によって、アルゴリズムの精度を判定する。ランダムに選択した60%の対象を用いてアルゴリズム係数を生成し、次いで、トレーニングされたクラシファイヤによって残りの40%を分類する。40%のホールドアウト群を分類する際のアルゴリズムの精度は、標準的な感度・特異度の方法を使用して計算する。これを10回繰り返すことで、精度についてのロバストな定量化が達成される。 The development of machine learning algorithms that classify subjects into non-curable (plus-event) and curative (-event) classes is based on the clinical features collected for each patient. First, include all of the features in the algorithm. Next, the accuracy of the algorithm is determined by the following 10-fold cross-validation. Algorithmic coefficients are generated using 60% of randomly selected subjects, and then the remaining 40% are classified by trained classifiers. The accuracy of the algorithm in classifying the 40% holdout group is calculated using standard sensitivity and specificity methods. By repeating this 10 times, robust quantification of accuracy is achieved.
図60に、切断レベルのためのクラシファイヤモデルを生成するステップの例を示す。最初の精度が確立された後、精度を向上させるための標準的な一連の手法を用いて、アルゴリズムを発展させる作業を開始する(図60)。このプロセスにおける重大な問題の1つは、この段階で有するモデルのような大きなモデルにおけるバイアスとバリアンスのトレードオフを解決することである。別の言い方をすれば、このアルゴリズムは現在の試験集団のデータには非常に良く適合するものの、一般的な母集団には転用できないかもしれない。これに対処する目的で、高精度であるが変数間の冗長性が最小であるような(すなわち、共分散のモデルから情報を削除した)微小循環測定と患者健康データの組み合わせを確立するために、特徴選択(Toward Integrating Feature
Selection Algorithms for Classification
and Clustering,Huan Liu and Lei Yu)を実行する。この段階で、データを分類するための様々なクラシファイヤモデルについても検討する。これには、線形判別分析、二次判別解析、決定木、クラスタリング、およびニューラルネットワークが含まれる。FIG. 60 shows an example of the steps to generate a classifier model for the cutting level. After the initial accuracy is established, the work of developing the algorithm is started using a standard set of techniques to improve the accuracy (Fig. 60). One of the key issues in this process is solving the bias-variance trade-off in large models such as the ones we have at this stage. In other words, while this algorithm fits very well with current test population data, it may not be applicable to the general population. To address this, to establish a combination of microcirculation measurements and patient health data that is accurate but has minimal redundancy between variables (ie, with information removed from the covariance model). , Feature selection (Toward Integrating Fairure)
Selection Algorithms for Classification
And Clustering, Huan Liu and Lei Yu) is executed. At this stage, we also consider various classifier models for classifying the data. This includes linear discriminant analysis, secondary discriminant analysis, decision trees, clustering, and neural networks.
成功の判定基準:我々の装置における切断の一次治癒予測確率が現在のケア標準(70〜90%)に匹敵することを実証し、より大きな臨床検査において、この精度のさらなる向上が十分に達成可能であることを示す必要がある。 Criteria for success: Demonstrated that the predictive probability of primary cure of amputation in our device is comparable to current care standards (70-90%), and further improvements in this accuracy are fully achievable in larger clinical tests. It is necessary to show that.
考えられる問題と解決策:切断手術に伴って血管再建術が実施されることもあり、この処置が診断結果に影響を及ぼす場合がある。そのような症例を記録し、統計解析において考慮することで、該処置と診断決定との間に関連があるか否かを特定する。 Possible problems and solutions: Vascular reconstruction may be performed with amputation, and this procedure may affect diagnostic outcomes. By recording such cases and considering them in statistical analysis, it is possible to identify whether there is an association between the treatment and the diagnostic decision.
潜在する別の問題は、2値のいずれかとして得られる装置の出力において、治癒群と治癒遅延群とが組み合わさっていることである。実際に、治癒遅延群と治癒群とでは、診断出力において別カテゴリーとできるような有意な差が見られることもある。逆に、治癒遅延群は、非治癒群により近く、容易には区別できないこともある。この場合、より近位の画像のデータをアルゴリズムに含めてもよい。装置の臨床的有用性は、この場合、単に成功または失敗を特定するだけでなく、切断における合併症をも特定するツールとして、さらに価値があるかもしれない。 Another potential problem is the combination of healing and delayed healing groups in the output of the device, which is obtained as either of the two values. In fact, there may be significant differences in diagnostic output between the delayed healing group and the healing group, which can be classified into different categories. Conversely, the delayed healing group is closer to the non-healing group and may not be easily distinguishable. In this case, the data of the more proximal image may be included in the algorithm. The clinical utility of the device may in this case be even more valuable as a tool to identify not only successes or failures, but also complications in amputation.
皮膚の色素沈着に差があれば、本試験で対象から収集する測定値にばらつきが生じることとなる。このような差を克服するために、我々の方法は、患者の組織の健康な部位を特定することを含み、これを基準としてDeepViewによる測定の正規化を行うことができる。 Differences in skin pigmentation will result in variability in the measurements collected from the subject in this study. To overcome these differences, our method involves identifying healthy areas of the patient's tissue, on which can normalization of measurements by DeepView can be performed.
別の問題は、PAD患者において、皮膚への正常な血流が観察されうることである。これは、側副血管による補償の結果かもしれない。しかしながら、PADを有する患者は、運動や短期虚血に対する応答が低いことが示されている。容易に実施できるように改変した試験として、測定する肢の圧力カフを膨らませて3分間虚血状態とした後に、患者のDeepView信号を試験することが挙げられる。PADでは、反応性充血応答におけるピークの50%に達するまでの時間が長くなることが知られているが、これは、DeepViewが評価するものと同じ組織の光学特性によって測定することができる。
実験の計画および方法 第II相 Another problem is that normal blood flow to the skin can be observed in PAD patients. This may be the result of compensation by the collateral vessels. However, patients with PAD have been shown to be less responsive to exercise and short-term ischemia. An easily modified test includes testing the patient's DeepView signal after inflating the pressure cuff of the limb to be measured to cause ischemia for 3 minutes. PAD is known to increase the time to reach 50% of the peak in the reactive hyperemic response, which can be measured by the same tissue optical properties as evaluated by DeepView.
Experimental planning and method Phase II
第II相は、臨床診断性能試験であり、PAD患者が最初の切断を受けた後の一次創傷治癒の可能性予測における、我々の装置の感度および特異性を評価するものである。この母集団を選択した理由は、現在の臨床ケア標準を用いてLOAを選択した場合に創傷治癒が陰性となる対象を得る確率において約20%の改善が見込まれるからである。DeepView(Gen2)装置の臨床診断性能は、DeepView(Gen2)による診断が、主要エンドポイントとしての創傷治癒結果をいかに正確に予測できるかを定量化する手段によって特徴付けられる。先の試験で用いられたゴールドスタンダードの方法を用いて創傷治癒評価を標準化し、PADにおける切断後の創傷治癒を分類する。 Phase II is a clinical diagnostic performance test that assesses the sensitivity and specificity of our device in predicting the likelihood of primary wound healing after a PAD patient undergoes the first amputation. The reason for choosing this population is that when LOA is chosen using current clinical care standards, an improvement of about 20% is expected in the probability of getting a subject with negative wound healing. The clinical diagnostic performance of the DeepView (Gen2) device is characterized by means of quantifying how diagnosis by DeepView (Gen2) can accurately predict wound healing outcomes as a primary endpoint. The gold standard method used in the previous study is used to standardize wound healing assessments and classify post-cutting wound healing in PADs.
DeepView(Gen2)の画像は、従来の各切断レベルにおける断端の最遠位部を覆う皮膚組織片に使用される皮膚部位から収集される。この組織部位が選択されるのは、手術部位の一次治癒にとって決定的に重要であることによる。切断後の治癒可能性についての従来の診断は、微小血管流を測定するのみであったが、本試験の目的は、微小循環の測定と患者の健康指標のいずれをも含むDeepView(Gen2)アルゴリズムの精度を評価することである。 Images of DeepView (Gen2) are collected from the skin site used for the skin tissue strip covering the most distal part of the stump at each conventional cutting level. This tissue site is selected because it is crucial for the primary healing of the surgical site. Whereas conventional diagnosis of curability after cleavage has only measured microvascular flow, the purpose of this study is the DeepView (Gen2) algorithm, which includes both measurement of microcirculation and patient health indicators. Is to evaluate the accuracy of.
標準化された創傷治癒評価により決定される切断成功の可能性を評価するための、DeepView(Gen2)イメージングの感度と特異度。 Sensitivity and specificity of DeepView (Gen2) imaging to assess the likelihood of successful amputation as determined by a standardized wound healing assessment.
これは、354人の患者の調査からなる中枢臨床試験計画であり、PAD患者の切断の一次治癒に関するDeepView(Gen2)システムの予測精度を、現在のケア標準と比較するものである。 This is a central clinical trial program consisting of a study of 354 patients, comparing the predictive accuracy of the DeepView (Gen2) system for primary cure of amputation in PAD patients with current care standards.
DeepView(Gen2)イメージング装置は、光学的方法によって、皮膚の血液供給に関するスペクトル信号およびPPG信号を、広い範囲(最大15×20cmの組織)から収集する。この装置は、下肢の皮膚の微小循環を広い範囲にわたって調査することに適している。この装置の特徴は、患者の重要な健康指標をその診断アルゴリズムに統合して精度を高められることである。パイロット試験は、この中枢試験で確認されることになる、患者の最も重要な健康指標を特定するために行われる。この試験の主要な目的は、パイロット試験で特定され、重要な情報として装置の機械学習診断アルゴリズムに含まれることになる患者の健康指標を確認することである。この試験では、従来のLOAそれぞれにおける微小循環を測定し、創傷治癒に影響を及ぼす患者の健康特性と組み合わせることで、切断後の患者における一次創傷治癒の見込みとの相関を見極める。 The DeepView (Gen2) imaging device collects spectral and PPG signals relating to the blood supply of the skin from a wide range (tissues up to 15 x 20 cm) by optical methods. This device is suitable for extensive examination of the skin microcirculation of the lower extremities. A feature of this device is that it integrates important patient health indicators into its diagnostic algorithm for increased accuracy. Pilot studies will be conducted to identify the most important health indicators of the patient that will be confirmed in this central study. The main purpose of this study is to identify patient health indicators that will be identified in the pilot study and will be included in the device's machine learning diagnostic algorithms as important information. In this study, microcirculation in each conventional LOA is measured and combined with the patient's health characteristics that affect wound healing to determine the correlation with the likelihood of primary wound healing in the patient after amputation.
データの収集:すべての患者の切断予定の下肢について検査を行い、試験に含める。臨床的に意義のある患者の健康指標は、施設のケア提供者により収集される。我々の実験的イメージング装置を用いた測定は、Spectral MDによってあらかじめトレーニングされた病院のスタッフが行うこととして、イメージング試験が実施される。 Data collection: All patients will be examined for amputated lower limbs and included in the study. Clinically meaningful patient health indicators are collected by institutional care providers. Measurements using our experimental imaging equipment are performed by imaging tests as performed by hospital staff pre-trained by Spectral MD.
切断端を覆うために使用される皮膚の部位は、DeepView(Gen2)LOAアルゴリズムによって、治癒能力の有無について評価される。DeepView(Gen2)による解析を担当する技術者には、切断が行われる箇所についての臨床判断の結果は知らされない。 The area of skin used to cover the cut end is evaluated for healing ability by the DeepView (Gen2) LOA algorithm. The technician responsible for the analysis by DeepView (Gen2) is not informed of the results of the clinical decision as to where the amputation will take place.
真の陽性(+)および真の陰性(−)の事象、すなわち治癒しない対象および治癒した対象を得るために、切断後の一次創傷治癒評価標準(表2)を使用する。この評価は、3つのカテゴリー、すなわち切断成功、治癒遅延を伴う切断成功、および治癒不全から構成されている。切断成功は、30日以内に肉芽組織が完成して治癒し、さらなる切断の必要がない状態と考えられる。治癒遅延を伴う切断成功は、治癒が遅延して30日後の肉芽組織形成は不完全であるが、6ヶ月以内に最終的な治癒に至り、さらに近位での再切断の必要はない状態と考えられる。治癒不全は、壊死および/もしくは壊疽が生じ、かつ/またはさらに近位での再切断の必要がある状態と特徴付けられる。また、治癒に血管再建が必要となる創傷は、切断失敗と考える。 To obtain true positive (+) and true negative (-) events, i.e. non-healing and healed subjects, the post-cut primary wound healing criteria (Table 2) are used. This assessment consists of three categories: successful amputation, successful amputation with delayed healing, and incomplete healing. Successful cutting is considered to be a condition in which the granulation tissue is completed and healed within 30 days and does not require further cutting. Successful amputation with delayed healing means that granulation tissue formation is incomplete 30 days after delayed healing, but final healing is reached within 6 months and no need for proximal re-cutting. Conceivable. Healing deficiency is characterized as a condition in which necrosis and / or gangrene occurs and / or needs to be re-cut further proximally. Wounds that require vascular reconstruction for healing are considered to be cutting failures.
この治癒評価は、手術の30日後に行う。治癒の遅れている対象については、手術の6ヶ月後に2回目の治癒評価を行う。6カ月後も治癒せず、かつより近位での再切断を受けていない対象は、非治癒群に分類される。 This cure assessment is performed 30 days after surgery. For subjects with delayed healing, a second healing assessment will be performed 6 months after surgery. Subjects who have not healed after 6 months and have not undergone more proximal re-cutting are classified in the non-healing group.
図61に、DeepViewによるイメージングを評価するための、臨床検査のフローの例を示す。切断部位の治癒の診断は、Spectral MD(Gen2)イメージング装置を用いたイメージング中に行われる。切断が予定されている脚を、それぞれ約30秒間走査する。PAD患者における従来の外科的切断法に従い、足首および足の各部位をイメージングする。従来の切断とは、膝上(AKA)、膝下(BKA)、足首の上(AAA)、中足骨横断、またはつま先である。断端を覆う組織片として使用する皮膚部位を選択して解析する(図59)。 FIG. 61 shows an example of a clinical examination flow for evaluating imaging with DeepView. Diagnosis of healing of the cut site is made during imaging with a Spectral MD (Gen2) imaging device. Each leg scheduled for amputation is scanned for approximately 30 seconds. Ankle and foot sites are imaged according to conventional surgical amputations in PAD patients. Conventional amputations are above the knee (AKA), below the knee (BKA), above the ankle (AAA), across the metatarsal bones, or toes. A skin site to be used as a piece of tissue covering the stump is selected and analyzed (Fig. 59).
患者の健康指標の収集:診断モデルで使用される患者の重要な健康指標は、個々の臨床現場の臨床スタッフにより収集される。ケア標準を超えるデータは一切収集しない。そのような指標は、パイロット試験で特定されるが、糖尿病コントロール(例えば、HbA1c、グルコース、およびインスリン)、喫煙歴、肥満(例えば、BMIまたは腹囲)、栄養物(例えば、アルブミン、プレアルブミン、トランスフェリン等)、感染症(例えば、白血球数、顆粒球の状態、体温、抗生物質の使用)、年齢、傷害のメカニズム、および重要な投薬(例えば、グルココルチコイドまたは化学療法)等を含むことが期待される。この情報は、DeepViewイメージング装置のソフトウェアへの入力により、診断アルゴリズムに追加される。 Collection of patient health indicators: The important patient health indicators used in the diagnostic model are collected by clinical staff in individual clinical settings. We do not collect any data that exceeds the care standard. Such indicators are identified in pilot studies, such as diabetes control (eg, HbA1c, glucose, and insulin), smoking history, obesity (eg, BMI or abdominal circumference), nutrients (eg, albumin, prealbumin, transferase). Etc.), infections (eg, white blood cell count, granulocyte status, body temperature, use of antibiotics), age, mechanism of injury, and important medications (eg, glucocorticoid or chemotherapy), etc. are expected to be included. To. This information is added to the diagnostic algorithm by inputting it into the software of the DeepView imaging device.
データの解析と統計:患肢の5箇所の切断部位から得たDeepView(Gen2)イメージングによる測定値を評価し、創傷治癒の可能性を判定する。それぞれの肢について、全般的な治癒スコアを決定し、その測定値と切断の実際の成否とを比較して、評価の全般的な精度を得る。これは、受信者操作特性(ROC)、すなわち感度および特異性に関する重要な結果評価基準となる。 Data analysis and statistics: Evaluate deepview (Gen2) imaging measurements from 5 amputations in the affected limb to determine the likelihood of wound healing. For each limb, a general healing score is determined and the measurements are compared to the actual success or failure of the amputation to obtain the overall accuracy of the assessment. This is an important result evaluation criterion for receiver operating characteristic (ROC), that is, sensitivity and specificity.
創傷の治癒を評価する重要な結果評価基準を得るために、臨床医により決定された切断部位から得たDeepView(Gen2)の診断と、標準化された創傷治癒評価により決定される切断の成否とを比較する。この解析により、DeepViewの診断のアルゴリズムのための受信者操作特性(ROC)曲線が得られる。 A diagnosis of DeepView (Gen2) obtained from a clinician-determined amputation site and the success or failure of the amputation as determined by a standardized wound healing assessment to obtain important outcome criteria for assessing wound healing. Compare. This analysis provides a receiver operating characteristic (ROC) curve for DeepView's diagnostic algorithm.
検出力解析:臨床試験は、装置の感度と特異性を確立し、それらの数値がLOAを選択する臨床判断をしのぐものであるか否かを試験するよう計画される。我々が定めた試験の目標は、LOAの診断においてDeepView(Gen2)システムが95%の感度と95%の特異性を達成し、現在の臨床判断における70〜90%という不十分な精度を克服することである。サンプルサイズを確立するには、まず陽性予測値(PPV)と陰性予測値(NPV)を定める必要があり、そのためには有病率が既知でなければならない。DeepView(Gen2)によってスクリーニングされる集団(血行障害性疾患によって患肢の最初の切断を必要とする18歳を超える患者)における、より近位レベルでの再切断の有病率が約20%(参考値)であることを確認した。したがって、所望の陽性予測値(PPV DeepView)は97%であり、所望の陰性予測値(NPV DeepView)は93%である。 Detectability analysis: Clinical trials are designed to establish the sensitivity and specificity of the device and to test whether those numbers outperform the clinical decision to choose LOA. The goal of our study is that the DeepView (Gen2) system achieves 95% sensitivity and 95% specificity in the diagnosis of LOA, overcoming the inadequate accuracy of 70-90% in current clinical judgment. That is. To establish a sample size, it is first necessary to determine a positive predictive value (PPV) and a negative predictive value (NPV), for which the prevalence must be known. The prevalence of re-amputation at a more proximal level in the population screened by DeepView (Gen2) (patients over 18 years of age who require the first amputation of the affected limb due to hemorrhagic disease) is about 20% ( It was confirmed that it was a reference value). Therefore, the desired positive predicted value (PPV DeepView) is 97%, and the desired negative predicted value (NPV DeepView) is 93%.
以下の仮説を検証するためのサンプルサイズの解析は、Steinberg et al., 2008,“Sample size for positive and negative predictive value in diagnostic research using case−control designs,”Biostatistics,vol.10,no.1,pp.94−105,2009に概説される方法を用いて実施した。有意水準(α)は0.05、所望の検出力(β)は0.80である。
PPVについて
H0:PPVDeepView=PPVclinical judgement
H1:PPVDeepView>PPVclinical judgement
NPVについて
H0:NPVDeepView=NPVclinical judgement
H1:NPVDeepView>NPVclinical judgement For sample size analysis to test the following hypothesis, see Steinberg et al. , 2008, "Sample size for positive and negative public value in diagnostics research case-control designs," Biostatistics, ol. 10, no. 1, pp. It was performed using the method outlined in 94-105, 2009. The significance level (α) is 0.05 and the desired detection power (β) is 0.80.
About PPV H 0 : PPV DeepView = PPV clinical judgement
H 1 : PPV DeepView > PPV clinical judgement
About NPV H 0 : NPV DeepView = NPV clinical judgement
H 1 : NPV DeepView > NPV clinical judgement
その結果、これらの帰無仮説(H0)が棄却されるためには、登録した計236の下肢の1/5が、我々の治癒評価により非治癒(+の事象)となる必要があることが示される(図62)。しかしながら、登録前に対象の病状を知りうるわけではないため、我々は1/5という比率をあらかじめ選択することはできない。したがって、この比率は異なりうる。この比率がはるかに低く、肢の1/10が非治癒(+)であれば、試験には約450の肢が必要となる。また、この比がはるかに高く、肢の3/5が非治癒(+)であれば、計124の肢で足りる。As a result, in order for these null hypotheses (H 0 ) to be rejected, 1/5 of the registered lower limbs of 236 must be non-healing (+ event) by our healing evaluation. Is shown (Fig. 62). However, we cannot preselect a ratio of 1/5 because we do not know the subject's medical condition prior to registration. Therefore, this ratio can vary. If this ratio is much lower and 1/10 of the limbs are non-healing (+), the test requires about 450 limbs. Also, if this ratio is much higher and 3/5 of the limbs are non-healing (+), a total of 124 limbs will suffice.
図62に、統計的なサンプルサイズ解析の結果を例示する。試験集団における切断非治癒(+)の切断治癒(−)に対する比率を基にした全サンプルサイズ。有意水準(α)は0.05であり、所望の検出力(β)は0.80である。 FIG. 62 illustrates the results of a statistical sample size analysis. Total sample size based on the ratio of non-healing (+) to cutting healing (-) in the test population. The significance level (α) is 0.05 and the desired detection power (β) is 0.80.
陰性の対象に対する陽性の対象の比率のばらつきを考慮し、最初の見積もりの236に対して約50%の対象をさらに加える。したがって、合計サンプルサイズは、計354名の対象から構成されることとなる。試験は最小リスク試験であり、多忙な診療所では年間約100例の切断が行われるため、この数字は十分に達成可能であると考えられる。試験データの取得と同時に監視を行い、試験した肢の総数と、切断成功(−の事象)に対する切断失敗(+の事象)の比率とを計算し、適切な比率および合計サンプルサイズが得られたところで試験を中止する。 Considering the variation in the ratio of positive subjects to negative subjects, about 50% of subjects are added to the initial estimate of 236. Therefore, the total sample size will consist of a total of 354 subjects. This number is considered to be fully achievable, as the study is a minimal risk study and about 100 amputations are made annually in busy clinics. Monitoring was performed at the same time as the test data was acquired, and the total number of limbs tested and the ratio of amputation failure (+ event) to amputation success (-event) were calculated to obtain an appropriate ratio and total sample size. By the way, the test is stopped.
期待される結果:DeepViewの出力と一次創傷治癒との相関の程度を判定するために、DeepViewの結果と、対象を治癒群または非治癒群に分類する標準的な治癒評価とを比較する。この比較により、切断後の一次治癒を予測するための高感度および高特異性をサポートする相関の存在が示されるものと期待される。 Expected Results: To determine the degree of correlation between DeepView output and primary wound healing, DeepView results are compared with standard healing assessments that classify subjects into healing or non-healing groups. This comparison is expected to indicate the presence of correlations that support high sensitivity and specificity for predicting primary healing after cleavage.
成功の判定基準:ROCは、現在のケア標準(70〜90%の精度)によって確立された必要値よりも高い感度および特異性が得られるような決定閾値を含む必要がある。 Criteria for success: The ROC should include a determination threshold that results in higher sensitivity and specificity than the required values established by current care standards (70-90% accuracy).
考えられる問題と解決策:診断アルゴリズムで使用されるすべての非イメージングデータ(患者の健康指標)の重要度を強化するのに十分な大きさのサンプルサイズを得ることが困難な場合がある。例えば、糖尿病は重要な臨床上の特徴であるが、集団内のすべての患者が糖尿病を有していたり、あるいはその効果を試験するのに十分な力を発揮できる比率で存在していなかったりすることがある。そのために、診断アルゴリズムにおいて、この並存症の存在を解釈できないことがある。この患者集団は、全般的な健康状態としては多くの類似点を有することが予想されるが、その変数の中には、様々なレベルで測定されるため単なる二値として扱うことのできないものも存在する。例えば、糖尿病を有する対象の場合、HbA1cおよび血糖試験の測定値は、コントロール範囲を有するかもしれない。これが不可能な場合には、格段に大きな切断集団について調査を行うことのできる市販後解析においてデータを継続的に収集することも考えられる。
性能例の概要 Possible problems and solutions: It can be difficult to obtain a sample size large enough to enhance the importance of all non-imaging data (patient health indicators) used in diagnostic algorithms. For example, diabetes is an important clinical feature, but not all patients in the population have diabetes or are present in proportions that are not sufficient to test its effects. Sometimes. Therefore, the diagnostic algorithm may not be able to interpret the existence of this comorbidity. This patient population is expected to have many similarities in overall health, but some of its variables cannot be treated as mere binary because they are measured at various levels. Exists. For example, in the case of subjects with diabetes, the HbA1c and blood glucose test measurements may have a control range. If this is not possible, it may be possible to continuously collect data in post-marketing analyzes that can investigate significantly larger amputated populations.
Overview of performance examples
実験データにより、PPGの特徴とMSIの特徴とを1つのアルゴリズム内で融合させることの利点が例示されるが、これは、以下で説明する図に示されている。 Experimental data illustrates the benefits of fusing PPG features and MSI features within one algorithm, which is shown in the figures described below.
以下の説明において、特徴セットには、フォトプレチスモグラフィ(PPG)、マルチスペクトルイメージング(MSI)、および実画像(RI)が含まれる。例示的手法には、グラウンドトゥルースを描くこと、3つの特徴集合のそれぞれを個々に、また組み合わせて使用し、分類アルゴリズムをトレーニングすること、画像を分類すること、および異なる特徴セットの要素を有するクラシファイヤと比較するために誤差を報告することが含まれる。現時点で、特徴は既に開発されており、分類に使用することができる。これらの特徴を、特徴セットの3つのカテゴリー、すなわちPPG、MSI、およびRIに分類する。以下の例では、クラシファイヤであるQDA(二次判別分析)に対し、様々な特徴セットを用いたトレーニングを行った。33の特徴すべてがモデルに組み込まれるまで、特徴セットの組み合わせを続けた。発展させた各クラシファイヤ(すなわち別個の特徴セットを備えた各クラシファイヤ)を、その分類誤差に基づいて比較した。 In the description below, the feature set includes photoplethysmography (PPG), multispectral imaging (MSI), and real image (RI). Illustrative techniques include drawing ground truth, using each of the three feature sets individually or in combination, training classification algorithms, classifying images, and class with different feature set elements. Includes reporting errors for comparison with fire. At this time, the features have already been developed and can be used for classification. These features fall into three categories of feature sets: PPG, MSI, and RI. In the example below, the classifier QDA (Secondary Discriminant Analysis) was trained using various feature sets. The combination of feature sets was continued until all 33 features were incorporated into the model. Each developed classifier (ie, each classifier with a separate set of features) was compared based on its classification error.
図63B−63Fは、様々なクラシファイヤについての参照画像、グラウンドトゥルース画像、分類結果、およびエラー画像を示す。これらについて、以下でより詳細に説明する。図63Aは、図63B−63Fの結果における色分けを説明する図である。青色は健康な組織、緑色は切除した組織、オレンジ色は浅い熱傷、赤色は熱傷を示す。 FIGS. 63B-63F show reference images, ground truth images, classification results, and error images for various classifiers. These will be described in more detail below. FIG. 63A is a diagram illustrating color coding in the results of FIGS. 63B-63F. Blue indicates healthy tissue, green indicates excised tissue, orange indicates light burns, and red indicates burns.
DeepViewクラシファイヤは、以下の14の特徴を含む。
1. Deep Viewの出力
2. 最大/平均
3. 平均からの標準偏差
4. 交差数
5. SNR 小近傍
6. 改善されたSNR
7. 正規化された照射
8. 正規化されたDeepView画像
9. 標準偏差
10. 歪度
11. 尖度
12. X勾配
13. Y勾配
14. 勾配の標準偏差The DeepView classifier includes the following 14 features.
1. 1.
7.
図63Bに、DeepViewクラシファイヤにおける、参照画像、グラウンドトゥルース画像、分類結果、およびエラー画像を示す。エラー画像内の黄色(図63Bのモノクロ複写の場合は白/明色)の割合で示されているように、DeepViewクラシファイヤの全誤差率は45%であった。 FIG. 63B shows a reference image, a ground truth image, a classification result, and an error image in the DeepView classifier. The total error rate of the DeepView classifier was 45%, as shown by the percentage of yellow in the error image (white / bright in the case of the monochrome copy of FIG. 63B).
実画像クラシファイヤは、以下の11の特徴を含む。
1. 実画像
2. 正規化された実画像
3. 歪度
4. 尖度
5. X勾配
6. Y勾配
7. X勾配の標準偏差
8. 小近傍領域
9. 正規化された小近傍領域
10. 大近傍領域
11. 正規化された大近傍領域The real image classifier includes the following 11 features.
1. 1.
図63Cに、実画像クラシファイヤにおける、参照画像、グラウンドトゥルース画像、分類結果、およびエラー画像を示す。エラー画像内の黄色(図63Cのモノクロ複写の場合は白/明色)の割合で示されているように、実画像クラシファイヤの全誤差率は16%であった。 FIG. 63C shows a reference image, a ground truth image, a classification result, and an error image in the real image classifier. As shown by the ratio of yellow in the error image (white / light color in the case of the monochrome copy of FIG. 63C), the total error rate of the real image classifier was 16%.
図63Dに、DeepViewクラシファイヤと実画像クラシファイヤの組み合わせにおける、参照画像、グラウンドトゥルース画像、分類結果、およびエラー画像を示す。このDeepView/実画像組み合わせクラシファイヤでは、上記したDeepViewの14の特徴と実画像の11の特徴を含む25の特徴を使用した。エラー画像内の黄色(図63Bのモノクロ複写の場合は白/明色)の割合で示されているように、DeepView/実画像組み合わせクラシファイヤの全誤差率は19%であった。 FIG. 63D shows a reference image, a ground truth image, a classification result, and an error image in the combination of the DeepView classifier and the real image classifier. In this DeepView / real image combination classifier, 25 features including the 14 features of DeepView and 11 features of the real image described above were used. As shown by the ratio of yellow in the error image (white / bright color in the case of the monochrome copy of FIG. 63B), the total error rate of the DeepView / real image combination classifier was 19%.
MSIクラシファイヤは、以下の8つの特徴を含む。
1. MSIλ1
2. MSIλ2
3. MSIλ3
4. MSIλ4
5. MSIλ5
6. MSIλ6
7. MSIλ7
8. MSIλ8 The MSI classifier includes eight features:
1. 1. MSIλ 1
2. MSIλ 2
3. 3. MSIλ 3
4. MSIλ 4
5. MSIλ 5
6. MSIλ 6
7. MSIλ 7
8. MSIλ 8
図63Eに、MSIクラシファイヤにおける、参照画像、グラウンドトゥルース画像、分類結果、およびエラー画像を示す。エラー画像内の黄色(図63Eのモノクロ複写の場合は白/明色)の割合で示されているように、DeepView/実画像組み合わせクラシファイヤの全誤差率は3.4%であった。 FIG. 63E shows a reference image, a ground truth image, a classification result, and an error image in the MSI classifier. As shown by the ratio of yellow in the error image (white / bright color in the case of the monochrome copy of FIG. 63E), the total error rate of the DeepView / real image combination classifier was 3.4%.
図63Fに、DeepViewクラシファイヤと実画像クラシファイヤとMSIとの組み合わせにおける、参照画像、グラウンドトゥルース画像、分類結果、およびエラー画像を示す。このDeepView/実画像/MSI組み合わせクラシファイヤでは、上記したDeepViewの14の特徴と実画像の11の特徴とMSIの8つの特徴を含む33の特徴を使用した。エラー画像内の黄色(図63Fのモノクロ複写の場合は白/明色)の割合で示されているように、DeepView/実画像/MSI組み合わせクラシファイヤの全誤差率は2.7%であった。 FIG. 63F shows a reference image, a ground truth image, a classification result, and an error image in the combination of the DeepView classifier, the real image classifier, and MSI. In this DeepView / real image / MSI combination classifier, 33 features including the above 14 features of DeepView, 11 features of the real image and 8 features of MSI were used. As shown by the ratio of yellow in the error image (white / bright color in the case of monochrome copying in FIG. 63F), the total error rate of the DeepView / real image / MSI combination classifier was 2.7%. ..
図64A、64Bは、異なる分類技術の特徴構成(feature composition)を比較する図である。図64Aに、DVO(DeepView)クラシファイヤ、RIクラシファイヤ、DVO+RIクラシファイヤ、MSIクラシファイヤ、およびDVO+RI+MSIクラシファイヤの誤差(e)の比較を示す。ここで、e=誤差=全体(不正確な分類)/全体(分類全体)である。図に示すように、DVO+RI+MSIクラシファイヤの誤差は、DVO+RIクラシファイヤの誤差と比べて71.7%少ない。 FIGS. 64A and 64B are diagrams for comparing feature configurations of different classification techniques. FIG. 64A shows a comparison of the errors (e) of the DVO (DeepView) classifier, RI classifier, DVO + RI classifier, MSI classifier, and DVO + RI + MSI classifier. Here, e = error = whole (inaccurate classification) / whole (whole classification). As shown in the figure, the error of the DVO + RI + MSI classifier is 71.7% smaller than the error of the DVO + RI classifier.
図64Bに、試験時点のDVO(DeepView)クラシファイヤ、RIクラシファイヤ、DVO+RIクラシファイヤ、MSIクラシファイヤ、およびDVO+RI+MSIクラシファイヤの誤差(e)の比較を示す。 FIG. 64B shows a comparison of the errors (e) of the DVO (DeepView) classifier, RI classifier, DVO + RI classifier, MSI classifier, and DVO + RI + MSI classifier at the time of the test.
図63B−64Bのデータが示すように、特徴を追加するにつれて、エラーは低減される。特徴群は、重要度の順にランク付けすることができ、一例では、(1)MSI、(2)RI、(3)PPGとしてランク付けすることができる。分類アルゴリズムのいくつかの実施形態は転用可能である。これは、第1の対象でトレーニングしたアルゴリズムを、次いで第2の対象の創傷の分類に使用できることを意味する。
システムの実装および用語 As the data in FIGS. 63B-64B show, the errors are reduced as features are added. Feature groups can be ranked in order of importance, for example, as (1) MSI, (2) RI, (3) PPG. Some embodiments of the classification algorithm can be diverted. This means that the algorithm trained in the first subject can then be used to classify the wounds in the second subject.
System implementation and terminology
本明細書で開示される実施形態は、対象の組織を特定、評価、および/または分類するためのシステム、方法、および装置を提供する。当業者であれば、このような代替物を、ハードウェア、ソフトウェア、ファームウェア、またはこれらの任意の組み合わせにおいて実施できることを理解するであろう。 The embodiments disclosed herein provide systems, methods, and devices for identifying, assessing, and / or classifying tissues of interest. Those skilled in the art will appreciate that such alternatives can be implemented in hardware, software, firmware, or any combination thereof.
上記の実験のいずれにおいても、特定の態様、代替形態、または実施例に関して記載された特徴、材料、特性、または群は、両立が不可能な場合を除いて、本明細書に記載された別の態様、代替形態、または実施例に適用可能であると理解されるべきである。本明細書(添付の特許請求の範囲、要約書および図面を含む)に開示された特徴および/または開示された方法もしくはプロセスのステップはいずれも、そのような特徴および/またはステップの少なくともいくつかが互いに排他的である組み合わせを除く任意の組み合わせとすることができる。保護対象は、上記の代替形態の詳細に限定されない。保護対象は、本明細書(添付の特許請求の範囲、要約書、および図面を含む)に開示された特徴の中の任意の新規な特徴または任意の新規な特徴の組み合わせに及び、また、本明細書に開示された任意の方法またはプロセスの任意の新規なステップまたは任意の新規なステップの組み合わせに及ぶ。 In any of the above experiments, the features, materials, properties, or groups described for a particular embodiment, alternative form, or example are different from those described herein, unless they are incompatible. It should be understood that it is applicable to the embodiment, alternative form, or embodiment of. Any of the features and / or disclosed methods or process steps disclosed herein (including the appended claims, abstracts and drawings) is at least some of such features and / or steps. Can be any combination except those in which are exclusive to each other. The object of protection is not limited to the details of the above alternative forms. The scope of protection extends to any new feature or any combination of new features within the features disclosed herein (including the appended claims, abstracts, and drawings), and also the book. It extends to any new step or any combination of new steps of any method or process disclosed in the specification.
特定の代替形態が記載されているが、これらの代替形態は単なる一例として提示されたものであり、保護範囲の限定を意図するものではない。実際、本明細書に記載の新規な方法およびシステムは、他の様々な形態で具体化されてもよい。さらに、本明細書に記載された方法およびシステムの形態には、様々な省略、置換、および変更がなされてもよい。いくつかの代替案では、説明および/または開示されたプロセスの実際のステップが、図示されたものと異なる場合があることを、当業者であれば理解するであろう。代替形態に応じて、上記のステップのうち特定のいくつかを削除してもよく、別のステップを追加してもよい。さらに、本明細書で開示された特定の代替形態の特徴および属性は、異なる方法で組み合わせられてさらなる代替形態を形成してもよく、それらはすべて本明細書の開示の範囲内にある。 Although specific alternatives have been described, these alternatives are presented as examples only and are not intended to limit the scope of protection. In fact, the novel methods and systems described herein may be embodied in various other forms. In addition, various omissions, substitutions, and modifications may be made to the methods and forms of the system described herein. Those skilled in the art will appreciate that in some alternatives, the actual steps of the described and / or disclosed process may differ from those illustrated. Depending on the alternative form, some of the above steps may be removed or another step may be added. Moreover, the features and attributes of the particular alternative forms disclosed herein may be combined in different ways to form additional alternative forms, all of which are within the scope of the disclosure herein.
本明細書の要素を「第1の」、「第2の」のように指定したとしても、それらの要素の数量や順序を一般に限定するわけではない。本明細書において、このような指定は、2つ以上の要素または1つ以上の要素の2つ以上の例を区別する簡便な方法として使用されている。したがって、第1の要素および第2の要素に言及したとしても、そこで使用される要素が2つのみであることや、第1の要素が何らかの方法で第2の要素に先行する必要があることを意味するわけではない。また、別段の記載がない限り、要素のセットは、1つ以上の要素を含むことができる。 Designating the elements of the present specification as "first", "second", etc. does not generally limit the quantity or order of those elements. As used herein, such designations are used as a convenient way to distinguish between two or more examples of two or more elements or one or more elements. Therefore, even if the first element and the second element are mentioned, only two elements are used there, and the first element must somehow precede the second element. Does not mean. Also, unless otherwise stated, a set of elements may include one or more elements.
当業者であれば、情報や信号は、様々な異なる科学技術や手法のうち任意の技術または手法を用いて表現可能であることを理解するであろう。例えば、上記の説明を通して参照されるデータ、命令、コマンド、情報、信号、ビット、シンボル、およびチップは、電圧、電流、電磁波、磁場もしくは磁性粒子、光場もしくは光学粒子、またはこれらの任意の組み合わせによって表すことができる。 Those skilled in the art will appreciate that information and signals can be represented using any of a variety of different science and technology or methods. For example, the data, instructions, commands, information, signals, bits, symbols, and chips referenced through the above description may be voltage, current, electromagnetic waves, magnetic or magnetic particles, light fields or optical particles, or any combination thereof. Can be represented by.
当業者であれば、本明細書で開示される態様に関連して記載された様々な例示、モジュール、プロセッサ、手段、回路、およびアルゴリズムステップはいずれも、電子ハードウェア(例えば、ソースコーディングまたは他の技術を用いて設計されていてもよい、デジタル実装、アナログ実装、またはこれら2つの組み合わせ)、命令を組み込んだプログラムもしくは設計コードの様々な形態(本明細書では、便宜上、「ソフトウェア」または「ソフトウェアモジュール」と呼ぶこともある)、または両者の組み合わせとして実装されうることを理解するであろう。ハードウェアとソフトウェアとのこの互換性を明確に説明するために、種々の例示的なコンポーネント、ブロック、モジュール、回路、およびステップについて、それらの機能に関して説明してきた。そのような機能がハードウェアとして実装されるかソフトウェアとして実装されるかは、特定のアプリケーションおよび設計によりシステム全体にかかる制約に依存する。当業者であれば、記載の機能をアプリケーションごとに様々な方法で実装することができるが、そのような実装の決定は、本明細書の開示の範囲から逸脱するものと解釈されるべきではない。 To those skilled in the art, the various examples, modules, processors, means, circuits, and algorithmic steps described in connection with aspects disclosed herein are all electronic hardware (eg, source coding or other). Various forms of programming or design code incorporating instructions (in the present specification, for convenience, "software" or "software" or "software" or "a combination of the two), digital or analog implementations, which may be designed using the techniques of. You will understand that it can be implemented as a "software module") or a combination of the two. To articulate this compatibility between hardware and software, various exemplary components, blocks, modules, circuits, and steps have been described with respect to their functionality. Whether such functionality is implemented as hardware or software depends on the system-wide constraints of a particular application and design. Those skilled in the art may implement the described functionality in a variety of ways on a per-application basis, but such implementation decisions should not be construed as departing from the scope of the disclosure herein. ..
本明細書において、図面に関連して開示し、説明した態様に関連して説明した種々の例示的な論理、コンポーネント、モジュール、および回路は、集積回路(IC)、アクセス端末、またはアクセスポイント内に実装されてもよく、それらの内部で実行されてもよい。ICは、本明細書に開示された機能を実行するよう設計された汎用プロセッサ、デジタル信号プロセッサ(DSP)、特定用途向け集積回路(ASIC)、フィールドプログラマブルゲートアレイ(FPGA)、もしくは他のプログラマブルロジックデバイス、ディスクリートゲート、もしくはトランジスタロジック、ディスクリートハードウェアコンポーネント、電子コンポーネント、光学コンポーネント、機械コンポーネント、またはそれらの組み合わせを含んでいてもよく、当該IC内、IC外、または内外いずれにも存在するコードまたは命令を実行するものであってよい。論理ブロック、モジュール、および回路は、ネットワーク内または装置内の様々なコンポーネントと通信するためのアンテナおよび/またはトランシーバを含むことができる。汎用プロセッサは、マイクロプロセッサであってもよいが、代替として、任意の従来型のプロセッサ、コントローラ、マイクロコントローラ、またはステートマシーンであってもよい。プロセッサはまた、複数のコンピュータデバイスの組み合わせ、例えば、DSPとマイクロプロセッサとの組み合わせ、複数のマイクロプロセッサの組み合わせ、1以上のマイクロプロセッサとDSPコアとの組み合わせ、または類似の別の構成として実装されてもよい。モジュールの機能は、本明細書で教示される何らかの別の方法で実施されてもよい。本明細書に(例えば、添付図面の1以上に関して)記載される機能は、いくつかの態様において、添付の特許請求の範囲において機能に替えて「手段」とすることもできる。 Various exemplary logics, components, modules, and circuits described herein in connection with the drawings and described in connection with the embodiments are within integrated circuits (ICs), access terminals, or access points. It may be implemented in or run inside them. An IC is a general purpose processor, digital signal processor (DSP), application specific integrated circuit (ASIC), field programmable gate array (FPGA), or other programmable logic designed to perform the functions disclosed herein. It may include a device, a discrete gate, or transistor logic, a discrete hardware component, an electronic component, an optical component, a mechanical component, or a combination thereof, and the code or code that exists inside, outside, or inside or outside the IC. It may be the one that executes the instruction. Logical blocks, modules, and circuits can include antennas and / or transceivers for communicating with various components within the network or equipment. The general purpose processor may be a microprocessor, but as an alternative, it may be any conventional processor, controller, microcontroller, or state machine. Processors are also implemented as a combination of multiple computer devices, such as a combination of DSP and microprocessor, a combination of multiple microprocessors, a combination of one or more microprocessors and a DSP core, or another similar configuration. May be good. The functionality of the module may be implemented in any other way taught herein. The functions described herein (eg, with respect to one or more of the accompanying drawings) may, in some embodiments, be "means" in place of the functions within the appended claims.
ソフトウェアに実装される場合、機能は、コンピュータ可読媒体上の1以上の命令またはコードとして保存または伝送されてもよい。本明細書に開示される方法またはアルゴリズムのステップは、コンピュータ可読媒体上に存在してもよくかつプロセッサでの実行が可能なソフトウェアモジュール内に実装されてもよい。コンピュータ可読媒体は、コンピュータの記憶媒体と、コンピュータプログラムを1つの場所から別の場所へ転送することの可能な任意の媒体を含む通信媒体とを、いずれも包含する。記憶媒体は、コンピュータによってアクセスされうる、利用可能な任意の媒体であってよい。そのようなコンピュータ可読媒体は、RAM、ROM、EEPROM、CD−ROM、もしくは他の光ディスク記憶装置、磁気ディスク記憶装置、もしくは他の磁気記憶装置、または、コンピュータによるアクセスが可能であり、かつ命令またはデータ構造の形態にある所望のプログラムコードを保存するための使用が可能な任意の別の媒体を含んでもよいが、これらは例示であり、限定ではない。また、任意の接続を、コンピュータ可読媒体と適切に称してもよい。本明細書で使用するディスク(disk)およびディスク(disc)は、コンパクトディスク(disc)(CD)、レーザーディスク(disc)、光ディスク(disc)、デジタルバーサタイルディスク(disc)(DVD)、フロッピーディスク(disk)およびブルーレイディスク(disc)を含むが、これらのディスク(disc)はレーザーを用いてデータを光学的に再生するものであり、一方ディスク(disk)は、通常、データを磁気的に再生するものである。上記の組み合わせもまた、コンピュータ可読媒体の範囲に含まれるべきである。加えて、方法またはアルゴリズムのオペレーションは、コードおよび命令のうちの1つまたは任意の組み合わせまたはセットとして、コンピュータプログラム製品に組み込まれていてもよい機械可読媒体およびコンピュータ可読媒体上に存在してもよい。 When implemented in software, features may be stored or transmitted as one or more instructions or codes on a computer-readable medium. The steps of methods or algorithms disclosed herein may reside on a computer-readable medium and may be implemented within a software module that can be executed on a processor. A computer-readable medium includes both a computer storage medium and a communication medium including any medium capable of transferring a computer program from one place to another. The storage medium may be any available medium accessible by the computer. Such computer-readable media are RAM, ROM, EEPROM, CD-ROM, or other optical disc storage, magnetic disk storage, or other magnetic storage, or computer accessible and instructional or Any other medium that can be used to store the desired program code in the form of a data structure may be included, but these are exemplary, but not limited to. In addition, any connection may be appropriately referred to as a computer-readable medium. The discs and discs used herein are compact discs (disks), laser discs, optical discs, digital versatile discs (DVDs), floppy discs (discs), and floppy discs (discs). Includes discs and Blu-ray discs, these discs use lasers to optically reproduce data, while discs typically reproduce data magnetically. It is a thing. The above combinations should also be included in the scope of computer readable media. In addition, the operation of the method or algorithm may reside on machine-readable and computer-readable media, which may be incorporated into a computer program product, as one or any combination or set of code and instructions. ..
開示の任意のプロセスにおいて複数のステップが特定の順序または階層で記載されていたとしても、そのような順序や階層は、サンプルアプローチの一例であることが理解される。設計嗜好に基づいて、本明細書の開示の範囲内にとどまりながら、プロセスにおけるステップの特定の順序または階層を再構成できることが理解される。添付の、方法の請求項は、様々なステップの要素を例示的な順序で提示するが、提示された特定の順序または階層への限定を意味するものではない。 Even if multiple steps are described in a particular order or hierarchy in any process of disclosure, it is understood that such order or hierarchy is an example of a sample approach. It is understood that, based on design preferences, the particular order or hierarchy of steps in the process can be reconstructed while remaining within the scope of the disclosure herein. The accompanying method claims present the elements of the various steps in an exemplary order, but do not imply a limitation to the particular order or hierarchy presented.
本開示で説明した実施形態に対する様々な変更は、当業者には容易かつ明らかであり、本明細書で定義される一般的な原理は、本明細書の開示の精神および範囲から逸脱することなく、別の実施形態に適用されうる。したがって、本開示は、ここに示された実施態様への限定を意図するものではなく、開示された請求項、原理および新規な特徴に相応する最も広い範囲を許容するものである。 Various changes to the embodiments described herein are easy and obvious to those skilled in the art, and the general principles defined herein do not deviate from the spirit and scope of the disclosure herein. , Can be applied to other embodiments. Accordingly, the present disclosure is not intended to be limited to the embodiments presented herein, but allows the broadest scope corresponding to the disclosed claims, principles and novel features.
本明細書の別個の実施形態の文脈に記載される複数の特徴を組み合わせて、単一の実施形態で実施することもできる。逆に、単一の実施形態の文脈に記載されている様々な特徴を、複数の実施形態で別個に、または任意適切なサブコンビネーションとして実施することもできる。さらに、特徴が、特定の組み合わせで作用するものとして記載されていたり、当初の請求の範囲にそのように記載されていたとしても、場合によっては、請求の範囲に記載された組み合わせから1以上の特徴を切り出すことができ、また請求の範囲に記載された組み合わせをサブコンビネーションまたはサブコンビネーションのバリエーションとしてもよい。 It is also possible to combine a plurality of features described in the context of separate embodiments herein in a single embodiment. Conversely, the various features described in the context of a single embodiment can be implemented separately in multiple embodiments or as an optional subcombination. Moreover, even if the features are described as acting in a particular combination, or as such in the claims, in some cases one or more of the combinations described in the claims. The features can be cut out, and the combination described in the claims may be a sub-combination or a variation of the sub-combination.
同様に、オペレーションは、図面には特定の順序で示されているが、所望の結果を得るためには、そのようなオペレーションを示された順序で順次に実行したり、図示したオペレーションのすべてを実行したりする必要があると理解されるべきではない。特定の状況では、マルチタスク処理や並列処理が有利な場合もある。さらに、上記の実施形態における様々なシステムコンポーネントの分離は、あらゆる実施形態においてそのような分離を要するものと理解されるべきではなく、記載のプログラムコンポーネントやシステムは、一般に、単一のソフトウェア製品内に一体化されたり、複数のソフトウェア製品にパッケージされてもよいと理解されるべきである。さらに、別の実施形態もまた、以下の請求項の範囲内にある。場合によっては、請求項に列挙された動作を異なる順序で実行しながら、なお所望の結果を得ることもできる。 Similarly, operations are shown in the drawings in a particular order, but to achieve the desired result, such operations may be performed sequentially in the order shown, or all of the operations shown may be performed. It should not be understood that it needs to be done. In certain situations, multitasking or parallel processing may be advantageous. Moreover, the separation of the various system components in the above embodiments should not be understood to require such separation in any embodiment, and the program components and systems described are generally within a single software product. It should be understood that it may be integrated into or packaged into multiple software products. Furthermore, another embodiment is also within the scope of the following claims. In some cases, the operations listed in the claims can be performed in different orders while still obtaining the desired result.
本明細書の開示は、特定の代替形態、実施例、および用途を含むが、当業者であれば、本明細書の開示は、具体的に開示された代替形態を超えて、別の代替的な代替形態および/または使用、明らかな改変物およびそれらの均等物に及び、ここに記載されている機能と利点のすべてを提供するものではない代替物をも含むことを理解するであろう。したがって、本開示の範囲は、ここに示される好ましい代替形態の具体的な開示によって限定されることを意図するものではなく、ここに提示する請求項または将来提示される請求項によって定義されるものであってよい。例えば、ここに提示される任意の請求項に加えて、以降の代替形態もまた本開示の範囲内に包含されることが意図される。 The disclosure of the present specification includes specific alternative forms, examples, and uses, but for those skilled in the art, the disclosure of the present specification goes beyond the specifically disclosed alternative forms to another alternative. It will be appreciated that it covers various alternative forms and / or uses, obvious modifications and their equivalents, and also includes alternatives that do not provide all of the features and benefits described herein. Accordingly, the scope of this disclosure is not intended to be limited by the specific disclosure of the preferred alternatives set forth herein, but as defined by the claims presented herein or in the future. It may be. For example, in addition to any of the claims presented herein, subsequent alternative forms are also intended to be included within the scope of the present disclosure.
先の説明では、実施例を完全に理解するために具体的な詳細が示されている。しかしながら、当業者であれば、そのような実施例は、記載の具体的な詳細がなくとも実施可能であることを理解するであろう。例えば、電気的構成要素/デバイスをブロック図で示すことで、不必要な詳細によって実施例が不明瞭になることを回避できる。別の例では、そのような構成要素、別の構造、および技術を詳細に示すことにより、実施例をさらに説明することができる。 The above description provides specific details for a complete understanding of the embodiments. However, one of ordinary skill in the art will appreciate that such an embodiment is feasible without the specific details described. For example, showing electrical components / devices in a block diagram can prevent unnecessary details from obscuring the embodiment. In another example, examples can be further described by showing such components, different structures, and techniques in detail.
開示の実施形態に関する先の説明は、当業者による本発明の実施または使用を可能にするために提供される。これらの実施形態に対する様々な変更は、当業者には容易かつ明らかであり、本明細書で定義される一般的な原理は、本発明の精神または範囲から逸脱することなく他の実施形態にも適用され得る。したがって、本発明は、ここに示された実施態様への限定を意図するものではなく、開示された原理および新規な特徴に相応する最も広い範囲を許容するものである。 The above description of the embodiments of the disclosure is provided to allow those skilled in the art to practice or use the invention. Various changes to these embodiments are easy and obvious to those skilled in the art, and the general principles defined herein apply to other embodiments without departing from the spirit or scope of the invention. Can be applied. Accordingly, the present invention is not intended to be limited to the embodiments presented herein, but tolerate the widest range corresponding to the disclosed principles and novel features.
Claims (31)
組織部位を照射するよう構成された1以上の光源と、
前記組織部位から反射された光を受けるよう構成された1以上の画像取得装置と、
ある共通の周波数帯において複数の異なる時間に捕捉された画像からなる第1のサブセットと、複数の異なる周波数帯において捕捉された画像からなる第2のサブセットとを含む前記組織部位の複数の画像を取得する手段と、
前記画像の第1のサブセットから得られたフォトプレチスモグラフィ(PPG)データによる潅流値および前記画像の第2のサブセットから得られたマルチスペクトルデータによる反射率値によって、画素を異なる生理学的クラスに分類することにより、前記組織部位の各領域を異なる生理学的クラスに分類する手段と、
マルチスペクトルデータおよびPPGデータの両方の少なくとも一部に基づいて組織部位の分類された画像を生成する手段とを含み、
分類された画像は異なる生理学的クラスに分類された画素を有するとともに異なる表示の異なる生理学的クラスを示すこと
を含むシステム。 It ’s an imaging system,
One or more light sources configured to illuminate tissue sites,
One or more image acquisition devices configured to receive the light reflected from the tissue site,
Multiple images of the tissue site, including a first subset of images captured at multiple different times in a common frequency band and a second subset of images captured at multiple different frequency bands. Means to get and
Pounds are classified into different physiological classes according to perfusion values from photoplethysmography (PPG) data obtained from the first subset of the images and reflectance values from multispectral data obtained from the second subset of the images. By doing so, a means of classifying each region of the tissue site into different physiological classes, and
Including means for generating a classified image of a tissue site based on at least a portion of both multispectral data and PPG data.
A system involving classified images having pixels classified into different physiological classes and showing different physiological classes with different displays.
組織部位を照射するよう構成された1以上の光源と、
前記組織部位から反射された光を受けるよう構成された1以上の画像取得装置と、
前記1以上の光源および前記1以上の画像取得装置を制御して、ある共通の周波数帯において複数の異なる時間に捕捉された画像からなる第1のサブセットと、複数の異なる周波数帯において捕捉された画像からなる第2のサブセットとを含む複数の画像を取得するよう構成された1以上のコントローラと、
前記画像の第1のサブセットから得られたフォトプレチスモグラフィ(PPG)データによる潅流値および前記画像の第2のサブセットから得られたマルチスペクトルデータによる反射率値によって、画素を異なる生理学的クラスに分類することにより、前記組織部位の領域を異なる生理学的クラスに分類し、かつ、マルチスペクトルデータおよびPPGデータの両方の少なくとも一部に基づいて組織部位の分類された画像を生成するように構成されたプロセッサとを含み、
分類された画像は異なる生理学的クラスに分類された画素を有するとともに異なる表示の異なる生理学的クラスを示すこと
を含むシステム。 It ’s an imaging system,
One or more light sources configured to illuminate tissue sites,
One or more image acquisition devices configured to receive the light reflected from the tissue site,
Controlling the one or more light sources and the one or more image acquisition device, a first subset of images captured at a plurality of different times in a common frequency band and captured in a plurality of different frequency bands. One or more controllers configured to acquire multiple images, including a second subset of images.
The pixels are classified into different physiological classes according to the perfusion value from the photoplethysmography (PPG) data obtained from the first subset of the image and the reflectance value from the multispectral data obtained from the second subset of the image. It was configured to classify the region of the tissue site into different physiological classes and generate a classified image of the tissue site based on at least a portion of both the multispectral data and the PPG data. Including the processor
A system involving classified images having pixels classified into different physiological classes and showing different physiological classes with different displays.
組織部位を照射するよう構成された1以上の光源と、
前記組織部位から反射された光を受けるよう構成された1以上の画像取得装置と、
プロセッサと
を含み、該プロセッサが、
前記1以上の光源および前記1以上の画像取得装置を制御して、複数の異なる時間において捕捉した前記組織部位の複数の画像からなる第1のサブセットと、複数の異なる周波数帯において捕捉した前記組織部位の複数の画像からなる第2のサブセットとを含む、前記組織部位の複数の画像を取得し、
前記複数の画像の第1のサブセットから得られたフォトプレチスモグラフィ(PPG)データによる潅流値および前記複数の画像の第2のサブセットから得られたマルチスペクトルデータによる反射率値によって、画素を異なる生理学的クラスに分類することにより、前記組織部位の各領域の熱傷の状態を異なる生理学的クラスに分類し、かつ
マルチスペクトルデータおよびPPGデータの両方の少なくとも一部に基づいて組織部位の分類された画像を生成し、
分類された画像は異なる生理学的クラスに分類された画素を有するとともに異なる表示の異なる生理学的クラスを示すこと
を含む装置。 A device for assessing the severity of a subject's burns
One or more light sources configured to illuminate tissue sites,
One or more image acquisition devices configured to receive the light reflected from the tissue site,
Including a processor, the processor
A first subset consisting of a plurality of images of the tissue site captured at a plurality of different times by controlling the one or more light sources and the one or more image acquisition device, and the tissue captured at a plurality of different frequency bands. Obtain multiple images of the tissue site, including a second subset of images of the site.
Physiology of pixels differs depending on the perfusion value from the photopretismography (PPG) data obtained from the first subset of the plurality of images and the reflectance value from the multispectral data obtained from the second subset of the plurality of images. By classifying into different physiological classes, the state of burns in each region of the tissue site is classified into different physiological classes, and the tissue site is classified based on at least a part of both multispectral data and PPG data. To generate
A device that includes a classified image having pixels classified into different physiological classes and showing different physiological classes with different displays.
Applications Claiming Priority (13)
| Application Number | Priority Date | Filing Date | Title |
|---|---|---|---|
| US201462072177P | 2014-10-29 | 2014-10-29 | |
| US62/072,177 | 2014-10-29 | ||
| US201562112348P | 2015-02-05 | 2015-02-05 | |
| US62/112,348 | 2015-02-05 | ||
| US201562114027P | 2015-02-09 | 2015-02-09 | |
| US62/114,027 | 2015-02-09 | ||
| US201562115536P | 2015-02-12 | 2015-02-12 | |
| US62/115,536 | 2015-02-12 | ||
| US201562136398P | 2015-03-20 | 2015-03-20 | |
| US62/136,398 | 2015-03-20 | ||
| US201562214885P | 2015-09-04 | 2015-09-04 | |
| US62/214,885 | 2015-09-04 | ||
| PCT/US2015/057882 WO2016069788A1 (en) | 2014-10-29 | 2015-10-28 | Reflective mode multi-spectral time-resolved optical imaging methods and apparatuses for tissue classification |
Publications (3)
| Publication Number | Publication Date |
|---|---|
| JP2018502677A JP2018502677A (en) | 2018-02-01 |
| JP2018502677A5 JP2018502677A5 (en) | 2018-12-20 |
| JP6893877B2 true JP6893877B2 (en) | 2021-06-23 |
Family
ID=55858322
Family Applications (1)
| Application Number | Title | Priority Date | Filing Date |
|---|---|---|---|
| JP2017542793A Active JP6893877B2 (en) | 2014-10-29 | 2015-10-28 | Reflection Mode Multispectral Time-Resolved Optical Imaging Methods and Devices for Tissue Classification |
Country Status (5)
| Country | Link |
|---|---|
| US (1) | US11304604B2 (en) |
| EP (1) | EP3212057B1 (en) |
| JP (1) | JP6893877B2 (en) |
| CN (1) | CN107205624B (en) |
| WO (1) | WO2016069788A1 (en) |
Families Citing this family (91)
| Publication number | Priority date | Publication date | Assignee | Title |
|---|---|---|---|---|
| US10709365B2 (en) | 2014-08-21 | 2020-07-14 | I. R. Med Ltd. | System and method for noninvasive analysis of subcutaneous tissue |
| US10772541B2 (en) | 2014-08-21 | 2020-09-15 | I. R. Med Ltd. | System and method for noninvasive analysis of subcutaneous tissue |
| US9717417B2 (en) | 2014-10-29 | 2017-08-01 | Spectral Md, Inc. | Reflective mode multi-spectral time-resolved optical imaging methods and apparatuses for tissue classification |
| KR102031738B1 (en) | 2015-02-02 | 2019-10-14 | 노바다크 테크놀러지즈 유엘씨 | Methods and systems for characterizing the tissue of a subject |
| JP6464004B2 (en) * | 2015-03-19 | 2019-02-06 | 株式会社東芝 | Measuring apparatus, measuring method and program |
| US20170000392A1 (en) * | 2015-07-01 | 2017-01-05 | Rememdia LC | Micro-Camera Based Health Monitor |
| US9913583B2 (en) | 2015-07-01 | 2018-03-13 | Rememdia LC | Health monitoring system using outwardly manifested micro-physiological markers |
| TWI556793B (en) * | 2015-07-09 | 2016-11-11 | 國立臺灣科技大學 | Non-contact method for detecting physiological signals and motion in real time |
| KR20170008043A (en) * | 2015-07-13 | 2017-01-23 | 엘지전자 주식회사 | Apparatus and method for measuring heart beat/stree of moble terminal |
| KR102634161B1 (en) * | 2015-10-28 | 2024-02-05 | 스펙트랄 엠디, 인크. | Reflection mode multispectral time-resolved optical imaging methods and devices for tissue classification |
| US10304569B2 (en) * | 2015-12-03 | 2019-05-28 | Heartflow, Inc. | Systems and methods for associating medical images with a patient |
| CA3010164C (en) | 2015-12-31 | 2024-03-12 | Wear2B Ltd | Device, system and method for non-invasive monitoring of physiological measurements |
| JP6951348B2 (en) * | 2016-02-12 | 2021-10-20 | ブライトシード・エルエルシーBriteseed,Llc | Systems and methods for determining organizational characteristics |
| WO2017139895A1 (en) | 2016-02-17 | 2017-08-24 | Nuralogix Corporation | System and method for detecting physiological state |
| US11202573B2 (en) * | 2016-03-04 | 2021-12-21 | Design Net Technical Products, Inc. | System and method for capturing high resolution color video images of the skin with position data |
| KR101799184B1 (en) * | 2016-03-07 | 2017-11-20 | 재단법인대구경북과학기술원 | Illumination system attachable to a mobile device for multispectral imaging of skin regions |
| US10448881B2 (en) * | 2016-04-15 | 2019-10-22 | Universal Care Solutions, Llc | Systems and methods for classification and treatment of decubitus ulcers |
| US11134848B2 (en) * | 2016-04-25 | 2021-10-05 | Samsung Electronics Co., Ltd. | Mobile hyperspectral camera system and human skin monitoring using a mobile hyperspectral camera system |
| CA3023735C (en) * | 2016-05-12 | 2021-12-28 | William Marsh Rice University | High resolution blood perfusion imaging using a camera and a pulse oximeter |
| JP6551316B2 (en) * | 2016-06-10 | 2019-07-31 | 京セラドキュメントソリューションズ株式会社 | Image reading apparatus and image forming apparatus |
| US10335045B2 (en) | 2016-06-24 | 2019-07-02 | Universita Degli Studi Di Trento | Self-adaptive matrix completion for heart rate estimation from face videos under realistic conditions |
| CN109843176A (en) * | 2016-07-29 | 2019-06-04 | 诺瓦达克技术有限公司 | For characterizing the method and system of the tissue of subject using machine learning |
| ES2842850T3 (en) * | 2016-11-22 | 2021-07-15 | Univ De Las Palmas De Gran Canaria | Non-invasive detection procedure for tumor tissue and / or healthy tissue and hyper spectral imaging apparatus |
| CN107067017B (en) * | 2016-11-29 | 2020-04-24 | 吴军 | Burn depth prediction system based on near infrared spectrum of CAGA and SVM |
| JP2018108173A (en) * | 2016-12-28 | 2018-07-12 | ソニー株式会社 | Medical image processing apparatus, medical image processing method, and program |
| WO2018160963A1 (en) | 2017-03-02 | 2018-09-07 | Spectral Md, Inc. | Machine learning systems and techniques for multispectral amputation site analysis |
| DE102017204491A1 (en) * | 2017-03-17 | 2018-09-20 | Henkel Ag & Co. Kgaa | Method and apparatus for determining skin moisture content |
| SG11201908815SA (en) | 2017-03-22 | 2019-10-30 | Adiuvo Diagnostics Pvt Ltd | Device and method for detection and classification of pathogens |
| US10580130B2 (en) | 2017-03-24 | 2020-03-03 | Curadel, LLC | Tissue identification by an imaging system using color information |
| US10945661B2 (en) * | 2017-04-21 | 2021-03-16 | Physio-Control, Inc. | Physiological feedback systems and methods |
| EP3641634A4 (en) * | 2017-06-20 | 2021-03-10 | I.R Med Ltd | System and method for noninvasive analysis of subcutaneous tissue |
| WO2019003245A1 (en) * | 2017-06-28 | 2019-01-03 | Skincurate Research Private Limited | Multispectral optical imaging device and method for contactless functional imaging of skin |
| US10852236B2 (en) | 2017-09-12 | 2020-12-01 | Curadel, LLC | Method of measuring plant nutrient transport using near-infrared imaging |
| US11748598B2 (en) * | 2017-10-23 | 2023-09-05 | Koninklijke Philips N.V. | Positron emission tomography (PET) system design optimization using deep imaging |
| CA3079625C (en) | 2017-10-24 | 2023-12-12 | Nuralogix Corporation | System and method for camera-based stress determination |
| WO2019157190A1 (en) * | 2018-02-07 | 2019-08-15 | Arthur Wallace | Methods and systems for patient monitoring |
| US20210169394A1 (en) * | 2018-05-08 | 2021-06-10 | Acutus Medical, Inc. | Cardiac information processing system |
| US11259710B2 (en) * | 2018-05-16 | 2022-03-01 | Mitsubishi Electric Research Laboratories, Inc. | System and method for remote measurements of vital signs |
| EP3576096A1 (en) * | 2018-05-30 | 2019-12-04 | Koninklijke Philips N.V. | Sensitivity analysis for digital pathology |
| CN108846838B (en) * | 2018-06-04 | 2021-05-11 | 卢龙 | Three-dimensional MRI (magnetic resonance imaging) semi-automatic focus image segmentation method and system |
| JP7312957B2 (en) * | 2018-06-21 | 2023-07-24 | パナソニックIpマネジメント株式会社 | Skin evaluation device, skin evaluation system, skin evaluation method, and computer-readable recording medium storing a program for skin evaluation |
| CN109191560B (en) * | 2018-06-29 | 2021-06-15 | 西安电子科技大学 | Monocular polarization three-dimensional reconstruction method based on scattering information correction |
| US20210267488A1 (en) * | 2018-07-02 | 2021-09-02 | 3M Innovative Properties Company | Sensing system and method for monitoring time-dependent processes |
| AU2019298235A1 (en) * | 2018-07-06 | 2021-01-21 | Enzyvant Therapeutics Gmbh | Tissue potency determination through quantitative histomorphology analysis |
| US11419604B2 (en) | 2018-07-16 | 2022-08-23 | Cilag Gmbh International | Robotic systems with separate photoacoustic receivers |
| US20220012874A1 (en) * | 2018-07-31 | 2022-01-13 | Deutsches Krebsforschungszentrum Stiftung des öffentlichen Rechts | Method and system for augmented imaging using multispectral information |
| JP2021532891A (en) * | 2018-07-31 | 2021-12-02 | ドイチェス クレープスフォルシュングスツェントルム シュティフトゥング デス エッフェントリッヒェン レヒツ | Methods and systems for extended imaging in open treatment with multispectral information |
| GB2577700B (en) * | 2018-10-02 | 2021-12-08 | Kinsler Veronica | Method and device for determining nature or extent of skin disorder |
| DE102019134142A1 (en) * | 2018-12-12 | 2020-06-18 | Analog Devices, Inc. | BUILT-IN CALIBRATION OF RUN TIME DEPTH IMAGING SYSTEMS |
| EP3666176A1 (en) * | 2018-12-14 | 2020-06-17 | Koninklijke Philips N.V. | Apparatus for detecting tissue inflammation |
| JP7186298B2 (en) | 2018-12-14 | 2022-12-08 | スペクトラル エムディー,インコーポレイテッド | Systems and methods for high-precision multi-aperture spectral imaging |
| US10740884B2 (en) | 2018-12-14 | 2020-08-11 | Spectral Md, Inc. | System and method for high precision multi-aperture spectral imaging |
| EP3893733A4 (en) | 2018-12-14 | 2022-10-12 | Spectral MD, Inc. | Machine learning systems and methods for assessment, healing prediction, and treatment of wounds |
| US10783632B2 (en) * | 2018-12-14 | 2020-09-22 | Spectral Md, Inc. | Machine learning systems and method for assessment, healing prediction, and treatment of wounds |
| CN111420301A (en) * | 2019-01-10 | 2020-07-17 | 中国科学院沈阳自动化研究所 | Robotized body surface focus area positioning and tracking system |
| CN111420290A (en) * | 2019-01-10 | 2020-07-17 | 中国科学院沈阳自动化研究所 | Robotized laser cosmetic and therapeutic system |
| CN109589101B (en) * | 2019-01-16 | 2020-08-21 | 四川大学 | Non-contact physiological parameter acquisition method and device based on video |
| US20220215514A1 (en) * | 2019-04-17 | 2022-07-07 | Nikon Corporation | Video processing apparatus, video processing method, and recording medium |
| US11145052B2 (en) * | 2019-04-25 | 2021-10-12 | International Business Machines Corporation | Intelligent classification of regions of interest of an organism from multispectral video streams using perfusion models |
| TWI750504B (en) * | 2019-08-29 | 2021-12-21 | 鉅怡智慧股份有限公司 | Method of liveness detection and related device |
| US11276176B2 (en) | 2019-09-04 | 2022-03-15 | International Business Machines Corporation | Intelligent boundary delineation of regions of interest of an organism from multispectral video streams using perfusion models |
| US11854676B2 (en) * | 2019-09-12 | 2023-12-26 | International Business Machines Corporation | Providing live first aid response guidance using a machine learning based cognitive aid planner |
| BR112022006093A2 (en) * | 2019-10-02 | 2022-06-21 | Chemimage Corp | Fusion of molecular chemical imaging with rgb imaging |
| EP4057893A4 (en) * | 2019-11-15 | 2023-10-04 | Bruin Biometrics, LLC | Spectral imaging |
| US11426076B2 (en) | 2019-11-27 | 2022-08-30 | Vivonics, Inc. | Contactless system and method for assessing and/or determining hemodynamic parameters and/or vital signs |
| BR112022011380A2 (en) * | 2019-12-18 | 2022-08-23 | Chemimage Corp | SYSTEMS AND METHODS OF COMBINED IMAGE MODALITIES FOR ENHANCED TISSUE DETECTION |
| US11219501B2 (en) | 2019-12-30 | 2022-01-11 | Cilag Gmbh International | Visualization systems using structured light |
| US11776144B2 (en) | 2019-12-30 | 2023-10-03 | Cilag Gmbh International | System and method for determining, adjusting, and managing resection margin about a subject tissue |
| US11759283B2 (en) | 2019-12-30 | 2023-09-19 | Cilag Gmbh International | Surgical systems for generating three dimensional constructs of anatomical organs and coupling identified anatomical structures thereto |
| US11284963B2 (en) | 2019-12-30 | 2022-03-29 | Cilag Gmbh International | Method of using imaging devices in surgery |
| US11896442B2 (en) | 2019-12-30 | 2024-02-13 | Cilag Gmbh International | Surgical systems for proposing and corroborating organ portion removals |
| US11832996B2 (en) | 2019-12-30 | 2023-12-05 | Cilag Gmbh International | Analyzing surgical trends by a surgical system |
| US11648060B2 (en) | 2019-12-30 | 2023-05-16 | Cilag Gmbh International | Surgical system for overlaying surgical instrument data onto a virtual three dimensional construct of an organ |
| US11744667B2 (en) | 2019-12-30 | 2023-09-05 | Cilag Gmbh International | Adaptive visualization by a surgical system |
| CN111461171B (en) * | 2020-03-04 | 2023-05-26 | 中南大学 | Data optimization method and system for constructing blast furnace molten iron silicon content prediction model |
| CN111312062B (en) * | 2020-03-20 | 2022-09-16 | 中国人民解放军陆军军医大学 | Inserted rod type disaster site injury information identification device |
| US11715326B2 (en) * | 2020-06-17 | 2023-08-01 | Microsoft Technology Licensing, Llc | Skin tone correction for body temperature estimation |
| US20230268074A1 (en) * | 2020-07-01 | 2023-08-24 | The Research Institute At Nationwide Children's Hospital | Body surface area chart and method |
| CN111759323B (en) * | 2020-07-08 | 2021-06-29 | 刘明明 | Multi-module microcirculation function evaluation device and biological tissue microcirculation visualization method based on same |
| TWI755918B (en) * | 2020-10-30 | 2022-02-21 | 國家中山科學研究院 | Wound Assessment Methods |
| US20220156606A1 (en) * | 2020-11-13 | 2022-05-19 | International Business Machines Corporation | Identification of a section of bodily tissue for pathology tests |
| US20240074735A1 (en) * | 2021-01-14 | 2024-03-07 | The Regents Of The University Of California | Point of care ultrasound as a tool to assess wound size and tissue regenration after skin grafting |
| US20220378310A1 (en) * | 2021-05-27 | 2022-12-01 | Microsoft Technology Licensing, Llc | Detecting heart rates using eye-tracking cameras |
| CN113552025B (en) * | 2021-06-23 | 2024-04-16 | 安图实验仪器(郑州)有限公司 | Method for detecting resonance frequency of blood sample and blood sample resonance detector |
| CN113657486B (en) * | 2021-08-16 | 2023-11-07 | 浙江新再灵科技股份有限公司 | Multi-label multi-attribute classification model building method based on elevator picture data |
| WO2023110465A1 (en) * | 2021-12-16 | 2023-06-22 | Koninklijke Philips N.V. | Simultaneous measurement of tissue perfusion and tissue oxygenation |
| CN114248435B (en) * | 2021-12-28 | 2024-01-26 | 广州医科大学附属顺德医院(佛山市顺德区乐从医院) | Preparation method of 3D printing bracket for maintaining branched morphology of specimen skin |
| WO2023141216A2 (en) * | 2022-01-21 | 2023-07-27 | Spectral Md, Inc. | System and method for topological characterization of tissue |
| CN114581410B (en) * | 2022-03-04 | 2023-03-21 | 深圳市澈影医生集团有限公司 | Training system and method of neural network |
| WO2023187828A1 (en) * | 2022-03-29 | 2023-10-05 | Niramai Health Analytix Pvt. Ltd | System and method to detect presence of skin abnormalities |
| CN115581444B (en) * | 2022-09-29 | 2023-12-12 | 汉王科技股份有限公司 | Blood pressure detection device |
Family Cites Families (129)
| Publication number | Priority date | Publication date | Assignee | Title |
|---|---|---|---|---|
| US4170987A (en) | 1977-11-28 | 1979-10-16 | California Institute Of Technology | Medical diagnosis system and method with multispectral imaging |
| US4693255A (en) * | 1985-04-22 | 1987-09-15 | Beall Harry C | Medical apparatus method for assessing the severity of certain skin traumas |
| EP0505478B1 (en) | 1989-12-14 | 1996-11-27 | Elof Eriksson | A treatment system for wounds and other disorders |
| US5074306A (en) | 1990-02-22 | 1991-12-24 | The General Hospital Corporation | Measurement of burn depth in skin |
| US5701902A (en) | 1994-09-14 | 1997-12-30 | Cedars-Sinai Medical Center | Spectroscopic burn injury evaluation apparatus and method |
| GB9521784D0 (en) | 1995-10-24 | 1996-01-03 | Rosslyn Medical Ltd | Diagnostic apparatus |
| US6081612A (en) | 1997-02-28 | 2000-06-27 | Electro Optical Sciences Inc. | Systems and methods for the multispectral imaging and characterization of skin tissue |
| US6008889A (en) | 1997-04-16 | 1999-12-28 | Zeng; Haishan | Spectrometer system for diagnosis of skin disease |
| US6058352A (en) | 1997-07-25 | 2000-05-02 | Physical Optics Corporation | Accurate tissue injury assessment using hybrid neural network analysis |
| US6353753B1 (en) | 1998-05-05 | 2002-03-05 | Stephen Thomas Flock | Optical imaging of deep anatomic structures |
| US6352517B1 (en) | 1998-06-02 | 2002-03-05 | Stephen Thomas Flock | Optical monitor of anatomical movement and uses thereof |
| US5982497A (en) | 1998-07-09 | 1999-11-09 | Optical Insights, Llc | Multi-spectral two-dimensional imaging spectrometer |
| DE19850350C1 (en) * | 1998-11-02 | 2000-09-28 | Jena Optronik Gmbh | Method and device for generating data for the diagnosis of the degree of damage to a patient's skin tissue |
| US6381488B1 (en) | 1999-06-15 | 2002-04-30 | Sandia Corporation | Method and apparatus to measure the depth of skin burns |
| US6640132B1 (en) | 1999-11-17 | 2003-10-28 | Hypermed, Inc. | Forensic hyperspectral apparatus and method |
| US7860554B2 (en) * | 2000-01-27 | 2010-12-28 | National Research Council Of Canada | Visible-near infrared spectroscopy in burn injury assessment |
| US6889075B2 (en) | 2000-05-03 | 2005-05-03 | Rocky Mountain Biosystems, Inc. | Optical imaging of subsurface anatomical structures and biomolecules |
| US6638668B2 (en) | 2000-05-12 | 2003-10-28 | Ocean Optics, Inc. | Method for making monolithic patterned dichroic filter detector arrays for spectroscopic imaging |
| JP2004534607A (en) | 2001-07-16 | 2004-11-18 | アート アドヴァンスド リサーチ テクノロジーズ インコーポレイテッド | Multi-wavelength imaging of high turbidity media |
| US20060072109A1 (en) | 2004-09-03 | 2006-04-06 | Andrew Bodkin | Hyperspectral imaging systems |
| TW512058B (en) | 2001-12-24 | 2002-12-01 | Yung-Jian Yang | Spectral analysis system for burning and scalding injuries and device used in the system |
| EP1532431A4 (en) | 2002-07-09 | 2010-03-31 | Medispectra Inc | Methods and apparatus for characterization of tissue samples |
| DE60314282T2 (en) | 2002-12-02 | 2008-03-20 | River Diagnostics B.V. | USE OF HIGH-WAVE RAMAN SPECTROSCOPY FOR TISSUE MEASUREMENT |
| WO2005002425A2 (en) * | 2003-07-02 | 2005-01-13 | U.S. Government As Represented By The Secretary Of The Army | Wearable tissue viability diagnostic unit |
| US7693069B2 (en) | 2003-07-28 | 2010-04-06 | Alcatel-Lucent Usa Inc. | Method, apparatus and system for improved inter-domain routing convergence |
| RU2372117C2 (en) | 2003-09-18 | 2009-11-10 | Аркюо Медикал, Инк. | Method of opto-thermo-mechanical impact onto biological tissue and device to this end |
| US7920908B2 (en) | 2003-10-16 | 2011-04-05 | David Hattery | Multispectral imaging for quantitative contrast of functional and structural features of layers inside optically dense media such as tissue |
| WO2005046248A1 (en) | 2003-11-11 | 2005-05-19 | Olympus Corporation | Multi-spectrum image pick up device |
| US7433042B1 (en) | 2003-12-05 | 2008-10-07 | Surface Optics Corporation | Spatially corrected full-cubed hyperspectral imager |
| US7648808B2 (en) | 2004-01-12 | 2010-01-19 | Ocean Thin Films, Inc. | Patterned coated dichroic filter |
| US8583216B2 (en) | 2004-04-27 | 2013-11-12 | University Of Utah Research Foundation | Skin type assessment and nevi screening for skin cancer with a noninvasive, portable reflectance spectrophotometer |
| US20070179482A1 (en) * | 2004-05-07 | 2007-08-02 | Anderson Robert S | Apparatuses and methods to treat biological external tissue |
| SE0402576D0 (en) | 2004-10-25 | 2004-10-25 | Forskarpatent I Uppsala Ab | Multispectral and hyperspectral imaging |
| US8224425B2 (en) | 2005-04-04 | 2012-07-17 | Hypermed Imaging, Inc. | Hyperspectral imaging in diabetes and peripheral vascular disease |
| US8548570B2 (en) | 2004-11-29 | 2013-10-01 | Hypermed Imaging, Inc. | Hyperspectral imaging of angiogenesis |
| US8374682B2 (en) | 2005-04-04 | 2013-02-12 | Hypermed Imaging, Inc. | Hyperspectral imaging in diabetes and peripheral vascular disease |
| US9078619B2 (en) | 2004-12-28 | 2015-07-14 | Hypermed Imaging, Inc. | Hyperspectral/multispectral imaging in determination, assessment and monitoring of systemic physiology and shock |
| US7729750B2 (en) | 2005-01-20 | 2010-06-01 | The Regents Of The University Of California | Method and apparatus for high resolution spatially modulated fluorescence imaging and tomography |
| US20060241495A1 (en) | 2005-03-23 | 2006-10-26 | Eastman Kodak Company | Wound healing monitoring and treatment |
| US8971984B2 (en) | 2005-04-04 | 2015-03-03 | Hypermed Imaging, Inc. | Hyperspectral technology for assessing and treating diabetic foot and tissue disease |
| US8106956B2 (en) | 2005-06-27 | 2012-01-31 | Nokia Corporation | Digital camera devices and methods for implementing digital zoom in digital camera devices and corresponding program products |
| EP2284509B1 (en) | 2005-11-04 | 2018-01-31 | George Themelis | System for multispectral imaging |
| JP5292104B2 (en) | 2006-01-05 | 2013-09-18 | ユニバーシティ オブ バージニア パテント ファウンデーション | Computer-implemented method, system, and computer program for evaluating blood glucose variability in diabetes from self-monitoring data |
| JP4655991B2 (en) | 2006-04-21 | 2011-03-23 | カシオ計算機株式会社 | Imaging apparatus, electronic zoom method, and program |
| EP2077753B1 (en) * | 2006-09-12 | 2012-12-19 | The General Hospital Corporation | Apparatus, probe and method for providing depth assessment in an anatomical structure |
| US20120321759A1 (en) | 2007-01-05 | 2012-12-20 | Myskin, Inc. | Characterization of food materials by optomagnetic fingerprinting |
| SG177951A1 (en) * | 2007-01-05 | 2012-02-28 | Myskin Inc | System, device and method for dermal imaging |
| US8639309B2 (en) | 2007-07-31 | 2014-01-28 | J&M Shuler, Inc. | Method and system for monitoring oxygenation levels of compartments and tissue |
| US7879020B1 (en) | 2007-03-19 | 2011-02-01 | The United States Of America As Represented By The Secretary Of The Army | Decision-assist method for resuscitation of patients |
| JP2008283442A (en) | 2007-05-10 | 2008-11-20 | Olympus Corp | Imaging apparatus |
| CN101784227B (en) | 2007-07-06 | 2013-12-04 | 工业研究有限公司 | Laser speckle imaging systems and methods |
| US20090072142A1 (en) | 2007-09-14 | 2009-03-19 | Forensicare Incorporated | Scanning system and techniques for medical and/or forensic assessment using the same |
| US20090118600A1 (en) | 2007-11-02 | 2009-05-07 | Ortiz Joseph L | Method and apparatus for skin documentation and analysis |
| US8509879B2 (en) | 2007-11-06 | 2013-08-13 | The Regents Of The University Of California | Apparatus and method for widefield functional imaging (WiFI) using integrated structured illumination and laser speckle imaging |
| US20100210931A1 (en) | 2008-04-04 | 2010-08-19 | Modulate Imaging Inc. | Method for performing qualitative and quantitative analysis of wounds using spatially structured illumination |
| AU2009239460B2 (en) | 2008-04-21 | 2015-04-23 | Drexel University | Methods for measuring changes in optical properties of wound tissue and correlating near infrared absorption (fNIR) and diffuse reflectance spectroscopy scattering (DRS) with tissue neovascularization and collagen concentration to determine whether wound is healing |
| US8838211B2 (en) * | 2008-04-30 | 2014-09-16 | Board Of Regents, The University Of Texas System | Multi-wavelength diagnostic imager |
| WO2009135081A2 (en) | 2008-04-30 | 2009-11-05 | Board Of Regents, The University Of Texas System | Integrated patient bed system |
| CA3162577C (en) * | 2008-05-20 | 2023-09-26 | University Health Network | Device and method for fluorescence-based imaging and monitoring |
| US20090318815A1 (en) | 2008-05-23 | 2009-12-24 | Michael Barnes | Systems and methods for hyperspectral medical imaging |
| US8694266B2 (en) | 2008-06-05 | 2014-04-08 | The Regents Of The University Of Michigan | Multimodal spectroscopic systems and methods for classifying biological tissue |
| US9572494B2 (en) | 2008-08-12 | 2017-02-21 | New Jersy Institute of Technology | Method and apparatus for multi-spectral imaging and analysis of skin lesions and biological tissues |
| JP2010043979A (en) | 2008-08-13 | 2010-02-25 | Yuichi Kamata | Spectral image measuring device |
| US9206482B2 (en) * | 2009-04-29 | 2015-12-08 | Genomedx Biosciences Inc. | Systems and methods for expression-based classification of thyroid tissue |
| US8330832B2 (en) | 2009-06-23 | 2012-12-11 | Research In Motion Limited | Adjustment of sharpness during digital zoom in digital photography |
| CN101627902B (en) | 2009-07-15 | 2011-12-28 | 深圳先进技术研究院 | Low-power consumption and high-precision front processing module of photoelectric plethysmograph signal based on ambient light |
| CN102473238B (en) | 2009-08-20 | 2014-08-06 | 皇家飞利浦电子股份有限公司 | Method and system for image analysis |
| EP2486539B1 (en) * | 2009-10-06 | 2016-09-07 | Koninklijke Philips N.V. | Method and system for obtaining a first signal for analysis to characterize at least one periodic component thereof |
| US9220412B2 (en) | 2009-11-19 | 2015-12-29 | Modulated Imaging Inc. | Method and apparatus for analysis of turbid media via single-element detection using structured illumination |
| US8692912B2 (en) | 2010-01-25 | 2014-04-08 | Pixelteq, Inc. | Multi-spectral camera |
| US8488024B2 (en) | 2010-02-10 | 2013-07-16 | Panasonic Corporation | Image capture device |
| US8294570B2 (en) * | 2010-02-24 | 2012-10-23 | Clawson Jeffrey J | Burn diagnostic and intervention tool for emergency dispatch |
| US20120078088A1 (en) | 2010-09-28 | 2012-03-29 | Point of Contact, LLC. | Medical image projection and tracking system |
| CA2825167C (en) | 2011-01-19 | 2019-01-15 | Majid Sarrafzadeh | Apparatus, systems, and methods for tissue oximetry and perfusion imaging |
| US8761853B2 (en) * | 2011-01-20 | 2014-06-24 | Nitto Denko Corporation | Devices and methods for non-invasive optical physiological measurements |
| US8994819B2 (en) * | 2011-02-04 | 2015-03-31 | Raytheon Company | Integrated optical detection system |
| US8694067B2 (en) * | 2011-02-15 | 2014-04-08 | General Electric Company | Sensor, apparatus and method for non-invasively monitoring blood characteristics of a subject |
| US9372118B1 (en) | 2011-03-07 | 2016-06-21 | Fluxdata, Inc. | Apparatus and method for multispectral based detection |
| KR101983402B1 (en) * | 2011-03-07 | 2019-05-28 | 웨이크 포리스트 유니버시티 헬스 사이언시즈 | Delivery system |
| US20120288230A1 (en) | 2011-05-13 | 2012-11-15 | Kestrel Labs, Inc. | Non-Reflective Optical Connections in Laser-Based Photoplethysmography |
| WO2012170963A1 (en) * | 2011-06-08 | 2012-12-13 | Digital Light Innovations | System and method for hyperspectral imaging |
| JP6131250B2 (en) | 2011-06-24 | 2017-05-17 | ケーエルエー−テンカー コーポレイション | Method and apparatus for inspection of light emitting semiconductor devices using photoluminescence imaging |
| KR101134770B1 (en) | 2011-07-22 | 2012-04-13 | 양완석 | Portable exoscope with ccd camera for human body opening |
| US8942459B2 (en) | 2011-09-12 | 2015-01-27 | Perkinelmer Cellular Technologies Germany Gmbh | Methods and apparatus for fast identification of relevant features for classification or regression |
| US9295402B1 (en) * | 2012-01-17 | 2016-03-29 | University Of Washington Through Its Center For Commercialization | Methods and systems for assessing a burn injury |
| US20150011892A1 (en) * | 2012-01-20 | 2015-01-08 | Harvard Apparatus Regenerative Technology, Inc. | Methods for evaluating tissue injuries |
| US9593982B2 (en) | 2012-05-21 | 2017-03-14 | Digimarc Corporation | Sensor-synchronized spectrally-structured-light imaging |
| US9766382B2 (en) | 2012-06-05 | 2017-09-19 | Hypermed Imaging, Inc. | Single-sensor hyperspectral imaging device |
| US9036877B2 (en) * | 2012-06-20 | 2015-05-19 | Xerox Corporation | Continuous cardiac pulse rate estimation from multi-channel source video data with mid-point stitching |
| US9547178B2 (en) | 2012-08-15 | 2017-01-17 | Semrock. Inc. | Dichroic image splitter |
| HUE047212T2 (en) | 2012-09-13 | 2020-04-28 | Polyheal Ltd | Improved wound healing compositions comprising microspheres |
| EP2898326B1 (en) | 2012-11-07 | 2018-03-14 | Modulated Imaging Inc. | Efficient modulated imaging |
| US10964001B2 (en) | 2013-01-10 | 2021-03-30 | Akoya Biosciences, Inc. | Multispectral imaging systems and methods |
| US20140213910A1 (en) * | 2013-01-25 | 2014-07-31 | The Regents Of The University Of California | Method and apparatus for performing qualitative and quantitative analysis of burn extent and severity using spatially structured illumination |
| EP2951543B1 (en) | 2013-01-31 | 2022-05-25 | Ventana Medical Systems, Inc. | Systems and methods for calibrating, configuring and validating an imaging device or system for multiplex tissue assays |
| US11653874B2 (en) | 2013-02-01 | 2023-05-23 | Acceleritas Corporation | Method and system for characterizing tissue in three dimensions using multimode optical measurements |
| CN105143448A (en) | 2013-02-01 | 2015-12-09 | 丹尼尔·法卡斯 | Method and system for characterizing tissue in three dimensions using multimode optical measurements |
| GB201302451D0 (en) * | 2013-02-12 | 2013-03-27 | Isis Innovation | Method and system for signal analysis |
| US20150073271A1 (en) | 2013-08-14 | 2015-03-12 | Nanyang Technological University | Systems and methods for revascularization assessment |
| CN103815875B (en) | 2013-10-28 | 2015-06-03 | 重庆西南医院 | Near-infrared spectrum imaging system for diagnosis of depth and area of burn skin necrosis |
| US10258242B2 (en) | 2014-01-06 | 2019-04-16 | The Florida International University Board Of Trustees | Near-infrared optical imaging system for hemodynamic imaging, pulse monitoring, and mapping spatio-temporal features |
| US20150208923A1 (en) * | 2014-01-28 | 2015-07-30 | The Texas A&M University System | Non-Invasive Monitoring of Tissue Mechanical Properties |
| WO2015116823A1 (en) | 2014-01-29 | 2015-08-06 | The Johns Hopkins University | System and method for wound imaging and debridement |
| DE102014002514B4 (en) | 2014-02-21 | 2015-10-29 | Universität Stuttgart | Device and method for multi- or hyperspectral imaging and / or for distance and / or 2-D or 3-D profile measurement of an object by means of spectrometry |
| CA2943502C (en) | 2014-03-21 | 2022-05-31 | Hypermed Imaging, Inc. | Compact light sensor |
| DE102014106974A1 (en) | 2014-05-16 | 2015-11-19 | Cubert GmbH | Spatially and spectrally resolving hyperspectral camera and method |
| WO2015187489A1 (en) | 2014-06-04 | 2015-12-10 | University Of Massachusetts Medical School | Hyperspectral imaging for prediction of skin injury after exposure to thermal energy or ionizing radiation |
| WO2016057633A1 (en) | 2014-10-08 | 2016-04-14 | Revealix, Inc. | Automated systems and methods for skin assessment and early detection of a latent pathogenic bio-signal anomaly |
| US9717417B2 (en) | 2014-10-29 | 2017-08-01 | Spectral Md, Inc. | Reflective mode multi-spectral time-resolved optical imaging methods and apparatuses for tissue classification |
| JP6654634B2 (en) | 2014-12-03 | 2020-02-26 | ベンタナ メディカル システムズ, インコーポレイテッド | Methods, systems and devices for quantitatively analyzing heterogeneous biomarker distributions |
| US9990472B2 (en) | 2015-03-23 | 2018-06-05 | Ohio State Innovation Foundation | System and method for segmentation and automated measurement of chronic wound images |
| US11037070B2 (en) | 2015-04-29 | 2021-06-15 | Siemens Healthcare Gmbh | Diagnostic test planning using machine learning techniques |
| US10921186B2 (en) | 2015-09-22 | 2021-02-16 | Hypermed Imaging, Inc. | Methods and apparatus for imaging discrete wavelength bands using a mobile device |
| JP2018534965A (en) | 2015-09-23 | 2018-11-29 | ノバダック テクノロジーズ ユーエルシー | Methods and systems for assessing tissue healing |
| KR102634161B1 (en) | 2015-10-28 | 2024-02-05 | 스펙트랄 엠디, 인크. | Reflection mode multispectral time-resolved optical imaging methods and devices for tissue classification |
| US10013811B2 (en) | 2016-06-13 | 2018-07-03 | Umm-Al-Qura University | Hyperspectral image visualization in patients with medical conditions |
| CN109843176A (en) | 2016-07-29 | 2019-06-04 | 诺瓦达克技术有限公司 | For characterizing the method and system of the tissue of subject using machine learning |
| US10223788B2 (en) | 2016-08-31 | 2019-03-05 | International Business Machines Corporation | Skin lesion segmentation using deep convolution networks guided by local unsupervised learning |
| CA3048632A1 (en) | 2016-12-27 | 2018-07-05 | Urugus S.A. | Hyper-spectral imaging when observed object is still |
| US10145740B2 (en) | 2017-02-27 | 2018-12-04 | Visera Technologies Company Limited | Sensing multiple peak wavelengths using combination of dual-band filters |
| US10806334B2 (en) | 2017-02-28 | 2020-10-20 | Verily Life Sciences Llc | System and method for multiclass classification of images using a programmable light source |
| WO2018160963A1 (en) | 2017-03-02 | 2018-09-07 | Spectral Md, Inc. | Machine learning systems and techniques for multispectral amputation site analysis |
| WO2019099096A1 (en) | 2017-11-16 | 2019-05-23 | MultiSensor Scientific, Inc. | Systems and methods for multispectral imaging and gas detection using a scanning illuminator and optical sensor |
| US20190290117A1 (en) | 2018-03-22 | 2019-09-26 | Kabushiki Kaisha Topcon | Interferometric fundus imaging method |
| EP3893733A4 (en) | 2018-12-14 | 2022-10-12 | Spectral MD, Inc. | Machine learning systems and methods for assessment, healing prediction, and treatment of wounds |
| US10740884B2 (en) | 2018-12-14 | 2020-08-11 | Spectral Md, Inc. | System and method for high precision multi-aperture spectral imaging |
| US10783632B2 (en) | 2018-12-14 | 2020-09-22 | Spectral Md, Inc. | Machine learning systems and method for assessment, healing prediction, and treatment of wounds |
| JP7186298B2 (en) | 2018-12-14 | 2022-12-08 | スペクトラル エムディー,インコーポレイテッド | Systems and methods for high-precision multi-aperture spectral imaging |
| WO2021173763A1 (en) | 2020-02-28 | 2021-09-02 | Spectral Md, Inc. | Machine learning systems and methods for assessment, healing prediction, and treatment of wounds |
-
2015
- 2015-10-28 WO PCT/US2015/057882 patent/WO2016069788A1/en active Application Filing
- 2015-10-28 JP JP2017542793A patent/JP6893877B2/en active Active
- 2015-10-28 CN CN201580070907.8A patent/CN107205624B/en active Active
- 2015-10-28 EP EP15855895.7A patent/EP3212057B1/en active Active
- 2015-10-28 US US15/523,287 patent/US11304604B2/en active Active
Also Published As
| Publication number | Publication date |
|---|---|
| EP3212057A1 (en) | 2017-09-06 |
| US20170367580A1 (en) | 2017-12-28 |
| US11304604B2 (en) | 2022-04-19 |
| CN107205624A (en) | 2017-09-26 |
| WO2016069788A1 (en) | 2016-05-06 |
| EP3212057A4 (en) | 2018-06-27 |
| JP2018502677A (en) | 2018-02-01 |
| EP3212057B1 (en) | 2021-12-01 |
| CN107205624B (en) | 2019-08-06 |
Similar Documents
| Publication | Publication Date | Title |
|---|---|---|
| JP6893877B2 (en) | Reflection Mode Multispectral Time-Resolved Optical Imaging Methods and Devices for Tissue Classification | |
| JP6785307B2 (en) | Tissue classification system | |
| JP2018502677A5 (en) | ||
| US11337643B2 (en) | Machine learning systems and techniques for multispectral amputation site analysis | |
| US9962090B2 (en) | Reflective mode multi-spectral time-resolved optical imaging methods and apparatuses for tissue classification | |
| US20220142484A1 (en) | Reflective mode multi-spectral time-resolved optical imaging methods and apparatuses for tissue classification | |
| TWI801370B (en) | Optical measurement system for assessing diabetic circulatory complications and method to estimate tissue vascular health | |
| JP7045999B2 (en) | Methods and Devices for Assessing Tissue Vascular Health | |
| JP2018508259A (en) | Method and system for characterizing a target tissue | |
| Thatcher et al. | Multispectral and photoplethysmography optical imaging techniques identify important tissue characteristics in an animal model of tangential burn excision | |
| CN112151177A (en) | System and method for assessing and managing chronic wound surface | |
| JP2021534893A (en) | Systems and methods for measuring oxygenated blood volume in biological tissues | |
| Zhang et al. | Convenient prediction of TcPO2 level using machine learning techniques with the PPG signal’s characteristic features | |
| Ong | Reflectance spectroscopy system for real time and non-invasive detection of transcutaneous bilirubin level |
Legal Events
| Date | Code | Title | Description |
|---|---|---|---|
| A521 | Request for written amendment filed |
Free format text: JAPANESE INTERMEDIATE CODE: A523 Effective date: 20170705 |
|
| A524 | Written submission of copy of amendment under article 19 pct |
Free format text: JAPANESE INTERMEDIATE CODE: A524 Effective date: 20181029 |
|
| A621 | Written request for application examination |
Free format text: JAPANESE INTERMEDIATE CODE: A621 Effective date: 20181029 |
|
| A977 | Report on retrieval |
Free format text: JAPANESE INTERMEDIATE CODE: A971007 Effective date: 20190711 |
|
| A131 | Notification of reasons for refusal |
Free format text: JAPANESE INTERMEDIATE CODE: A131 Effective date: 20190903 |
|
| A601 | Written request for extension of time |
Free format text: JAPANESE INTERMEDIATE CODE: A601 Effective date: 20191125 |
|
| A601 | Written request for extension of time |
Free format text: JAPANESE INTERMEDIATE CODE: A601 Effective date: 20200122 |
|
| A521 | Request for written amendment filed |
Free format text: JAPANESE INTERMEDIATE CODE: A523 Effective date: 20200302 |
|
| A131 | Notification of reasons for refusal |
Free format text: JAPANESE INTERMEDIATE CODE: A131 Effective date: 20200728 |
|
| A601 | Written request for extension of time |
Free format text: JAPANESE INTERMEDIATE CODE: A601 Effective date: 20201022 |
|
| A521 | Request for written amendment filed |
Free format text: JAPANESE INTERMEDIATE CODE: A523 Effective date: 20201216 |
|
| TRDD | Decision of grant or rejection written | ||
| A01 | Written decision to grant a patent or to grant a registration (utility model) |
Free format text: JAPANESE INTERMEDIATE CODE: A01 Effective date: 20210525 |
|
| A61 | First payment of annual fees (during grant procedure) |
Free format text: JAPANESE INTERMEDIATE CODE: A61 Effective date: 20210602 |
|
| R150 | Certificate of patent or registration of utility model |
Ref document number: 6893877 Country of ref document: JP Free format text: JAPANESE INTERMEDIATE CODE: R150 |