JP6885545B2 - Blood pressure estimation device, blood pressure estimation method, computer program and recording medium - Google Patents
Blood pressure estimation device, blood pressure estimation method, computer program and recording medium Download PDFInfo
- Publication number
- JP6885545B2 JP6885545B2 JP2018003887A JP2018003887A JP6885545B2 JP 6885545 B2 JP6885545 B2 JP 6885545B2 JP 2018003887 A JP2018003887 A JP 2018003887A JP 2018003887 A JP2018003887 A JP 2018003887A JP 6885545 B2 JP6885545 B2 JP 6885545B2
- Authority
- JP
- Japan
- Prior art keywords
- blood pressure
- fluctuation
- waveform
- biological signal
- slope
- Prior art date
- Legal status (The legal status is an assumption and is not a legal conclusion. Google has not performed a legal analysis and makes no representation as to the accuracy of the status listed.)
- Active
Links
Images


Classifications
-
- A—HUMAN NECESSITIES
- A61—MEDICAL OR VETERINARY SCIENCE; HYGIENE
- A61B—DIAGNOSIS; SURGERY; IDENTIFICATION
- A61B5/00—Measuring for diagnostic purposes; Identification of persons
- A61B5/02—Detecting, measuring or recording pulse, heart rate, blood pressure or blood flow; Combined pulse/heart-rate/blood pressure determination; Evaluating a cardiovascular condition not otherwise provided for, e.g. using combinations of techniques provided for in this group with electrocardiography or electroauscultation; Heart catheters for measuring blood pressure
- A61B5/021—Measuring pressure in heart or blood vessels
- A61B5/02108—Measuring pressure in heart or blood vessels from analysis of pulse wave characteristics
- A61B5/02116—Measuring pressure in heart or blood vessels from analysis of pulse wave characteristics of pulse wave amplitude
-
- A—HUMAN NECESSITIES
- A61—MEDICAL OR VETERINARY SCIENCE; HYGIENE
- A61B—DIAGNOSIS; SURGERY; IDENTIFICATION
- A61B5/00—Measuring for diagnostic purposes; Identification of persons
- A61B5/02—Detecting, measuring or recording pulse, heart rate, blood pressure or blood flow; Combined pulse/heart-rate/blood pressure determination; Evaluating a cardiovascular condition not otherwise provided for, e.g. using combinations of techniques provided for in this group with electrocardiography or electroauscultation; Heart catheters for measuring blood pressure
- A61B5/026—Measuring blood flow
-
- A—HUMAN NECESSITIES
- A61—MEDICAL OR VETERINARY SCIENCE; HYGIENE
- A61B—DIAGNOSIS; SURGERY; IDENTIFICATION
- A61B5/00—Measuring for diagnostic purposes; Identification of persons
- A61B5/24—Detecting, measuring or recording bioelectric or biomagnetic signals of the body or parts thereof
- A61B5/316—Modalities, i.e. specific diagnostic methods
- A61B5/318—Heart-related electrical modalities, e.g. electrocardiography [ECG]
- A61B5/346—Analysis of electrocardiograms
- A61B5/349—Detecting specific parameters of the electrocardiograph cycle
- A61B5/352—Detecting R peaks, e.g. for synchronising diagnostic apparatus; Estimating R-R interval
-
- A—HUMAN NECESSITIES
- A61—MEDICAL OR VETERINARY SCIENCE; HYGIENE
- A61B—DIAGNOSIS; SURGERY; IDENTIFICATION
- A61B5/00—Measuring for diagnostic purposes; Identification of persons
- A61B5/68—Arrangements of detecting, measuring or recording means, e.g. sensors, in relation to patient
- A61B5/6801—Arrangements of detecting, measuring or recording means, e.g. sensors, in relation to patient specially adapted to be attached to or worn on the body surface
- A61B5/6813—Specially adapted to be attached to a specific body part
- A61B5/6823—Trunk, e.g., chest, back, abdomen, hip
Description
本発明は、人の背部から得られる生体信号を用いて、血圧を推定する技術に関する。 The present invention relates to a technique for estimating blood pressure using a biological signal obtained from the back of a person.
本発明者らは、特許文献1〜4等において、人の上体の背部の体表面に生じる振動を非拘束で捉え、その振動を解析して人の状態を推定する技術を提案している。人の上体の背部の体表面に生じる振動は、心臓と大動脈等の生体内の振動が伝播したものであり、心房及び心室の収縮期及び拡張期の情報や、循環の補助ポンプとなる血管壁の弾力情報及び反射波の情報を含んでいる。
The present inventors have proposed techniques in
特許文献1では、体表面を介して伝播する振動(生体信号)から抽出した1Hz近傍の背部体表脈波(Aortic Pulse Wave(APW))の時系列波形に所定の時間幅を適用してスライド計算を行って周波数傾きの時系列波形を求め、その変化の傾向から、例えば、振幅が増幅傾向にあるか、減衰傾向にあるかなどによって生体状態の推定を行っている。また、生体信号を周波数解析し、予め定めたULF帯域(極低周波帯域)からVLF帯域(超低周波帯域)に属する機能調整信号、疲労受容信号及び活動調整信号に相当する各周波数のパワースペクトルを求め、各パワースペクトルの時系列変化から人の状態を判定することも開示している。
In
特許文献2〜4では、恒常性維持機能レベルを判定する手段を開示している。恒常性維持機能レベルを判定する手段は、周波数傾き時系列波形の微分波形の正負、周波数傾き時系列波形を積分した積分波形の正負、ゼロクロス法を利用した周波数傾き時系列波形とピーク検出法を利用した周波数傾き時系列波形をそれぞれ絶対値処理して得られた各周波数傾き時系列波形の絶対値等のうち、少なくとも1つ以上を用いて判定する。これらの組み合わせにより、恒常性維持機能のレベルがいずれに該当するかを求める。
上記した技術によれば、生体調節機能に関する人の状態、すなわち、入眠予兆現象、切迫睡眠現象、覚低走行状態、恒常性維持機能レベル、初期疲労状態、気分の状態などを捉えることができる。
その一方、高血圧の人や心疾患等を患っている人は、健常者と比較すると、血管壁の状態、心臓の動き方等に起因して、血液の流れにも影響が生じる。従来、高血圧か否かを判断する場合、カフを腕に巻き付けるタイプの血圧計によって血圧を測定するのが一般的である。しかしながら、これらの測定には、人体を拘束しかつ安定した状態とした上で、各装置を取り付けて実施する必要がある。そのため、人体の拘束等を極力減らし、血圧をより簡易に測定できる技術の開発が望まれている。
According to the above-mentioned technique, it is possible to capture a person's state related to the bioregulatory function, that is, a sleep onset sign phenomenon, an imminent sleep phenomenon, a low-sensitivity running state, a homeostatic function level, an initial fatigue state, a mood state, and the like.
On the other hand, a person with high blood pressure or a person suffering from a heart disease or the like has an influence on the blood flow due to the condition of the blood vessel wall, the movement of the heart, etc., as compared with a healthy person. Conventionally, when determining whether or not hypertension is present, it is common to measure blood pressure with a sphygmomanometer of the type in which a cuff is wrapped around the arm. However, these measurements need to be carried out by attaching each device after restraining the human body and keeping it in a stable state. Therefore, it is desired to develop a technique capable of measuring blood pressure more easily by reducing the restraint of the human body as much as possible.
本発明は上記に鑑みなされたものであり、人の背部の体表面を介して伝播する生体信号を非拘束で捉えることができる生体信号測定装置を用い、取得した生体信号を解析し、非拘束で血圧の推定を行う技術を提供することを課題とする。 The present invention has been made in view of the above, and the acquired biological signal is analyzed and unconstrained by using a biological signal measuring device capable of capturing the biological signal propagating through the body surface of the back of a person without restraint. The subject is to provide a technique for estimating blood pressure.
上記課題を解決するため、本発明者は、酸素の摂取量と血圧の相関性から、静脈還流の変動及び心筋収縮力の変動に伴う血流量の変動が血圧変動を生むことに着目した。また、左心室の収縮は血液の体循環の原動力となるが、右心室は左心室を包むように存在し、左心室は胸腔内の正中面左方に深く隠れていると共に、右心室の前面にある心膜は胸骨心膜靱帯で前胸壁と結合している。そのため、前胸壁から得られる心臓の情報は限られ、特に、体循環の原動力である左心室の情報は前胸壁からは計測しがたい。左心室の情報は、前胸壁よりも、背部の体表面に伝播される振動(本明細書において、単に「振動」という場合には、音(音波)も含む)に多く含まれている。そこで、本発明者は、背部の体表面に伝播される振動(生体信号)から、血流変動の状態を知ることで、血圧を推定できると考え、本発明を完成するに至った。 In order to solve the above problems, the present inventor has focused on the fact that fluctuations in venous return and fluctuations in blood flow due to fluctuations in myocardial contractile force cause fluctuations in blood pressure from the correlation between oxygen intake and blood pressure. The contraction of the left ventricle is the driving force for blood circulation, but the right ventricle surrounds the left ventricle, and the left ventricle is deeply hidden to the left of the midline in the thoracic cavity and in front of the right ventricle. One pericardium is connected to the anterior chest wall by the thoracic pericardial ligament. Therefore, the information on the heart obtained from the anterior chest wall is limited, and in particular, the information on the left ventricle, which is the driving force of systemic circulation, is difficult to measure from the anterior chest wall. Information on the left ventricle is contained more in the vibration propagated to the body surface of the back than in the anterior chest wall (in the present specification, the term "vibration" includes sound (sound wave)). Therefore, the present inventor considered that the blood pressure could be estimated by knowing the state of blood flow fluctuation from the vibration (biological signal) propagated on the body surface of the back, and completed the present invention.
すなわち、本発明の血圧推定装置は、人の背部に当接され、前記背部の体表面を介して伝播する生体信号を非拘束で捉える生体信号測定装置から前記生体信号を受信し、受信した前記生体信号を解析する生体信号処理手段を有しており、前記生体信号処理手段が、 前記生体信号の時系列波形を所定の周波数帯域でフィルタリングし、心周期を顕在化させたフィルタ処理波形を得るフィルタリング手段と、前記生体信号の測定と同時に測定した心電計から得られる心電図波形データに前記フィルタ処理波形を照合し、前記フィルタ処理波形における心室充満期から等容性収縮期における時系列波形の範囲の波形成分を特定し、心室充満期から等容性収縮期における血流変動に起因して生じる振動に関する指標を求める血流変動指標算出手段と、前記血流変動に起因して生じる振動に関する指標の時系列波形を求め、その時系列波形の変動の仕方を示すゆらぎに関する指標を求めるゆらぎ指標算出手段と、前記ゆらぎに関する指標を、予め記憶部に記憶された前記ゆらぎに関する指標と血圧との関係を示す血圧推定用相関データを用いて、前記人の血圧を推定する推定手段とを有することを特徴とする。 That is, the blood pressure estimation device of the present invention receives and receives the biometric signal from the biometric signal measuring device that is in contact with the back of a person and captures the biometric signal propagating through the body surface of the back without restraint. It has a biological signal processing means for analyzing a biological signal, and the biological signal processing means filters the time-series waveform of the biological signal in a predetermined frequency band to obtain a filtered waveform in which the cardiac cycle is manifested. The filtered waveform is collated with the electrocardiogram waveform data obtained from the filtering means and the electrocardiograph measured at the same time as the measurement of the biological signal, and the time-series waveform from the ventricular filling period to the isotropic contraction period in the filtered waveform is displayed. Regarding the blood flow fluctuation index calculation means for specifying the waveform component in the range and obtaining the index related to the vibration caused by the blood flow fluctuation from the ventricular filling period to the isotropic contraction period, and the vibration generated due to the blood flow fluctuation. The relationship between the fluctuation index calculation means for obtaining the time-series waveform of the index and the fluctuation-related index indicating how the time-series waveform fluctuates, and the fluctuation-related index stored in advance in the storage unit and the blood pressure. It is characterized by having an estimation means for estimating the blood pressure of the person by using the correlation data for blood pressure estimation showing the above.
前記生体信号処理手段は、連続的に受信した前記生体信号を用い、前記人の血圧を連続的に推定可能である。
前記ゆらぎ指標算出手段が、前記血流変動に起因して生じる振動に関する指標の時系列波形を求めると共に、その時系列波形を周波数解析し、パワースペクトルと周波数の両対数グラフに周波数解析結果であるゆらぎ解析図を得るゆらぎ解析手段と、前記ゆらぎ解析図の回帰直線の傾きを求め、前記ゆらぎ解析図の回帰直線の傾きを前記ゆらぎに関する指標とするゆらぎ解析図傾き算出手段とを有することが好ましい。
前記ゆらぎ解析図傾き算出手段は、前記ゆらぎ解析図に関する回帰直線の傾きとして、VLFからLFの範囲に属する所定の周波数帯の回帰直線の傾きを求め、その傾きを前記ゆらぎに関する指標とする手段であることが好ましい。
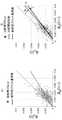
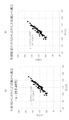
前記血圧推定用相関データは、前記VLFからLFの範囲に属する所定の周波数帯の回帰直線の傾きが、正常域血圧では−1に近い傾向を示し、高血圧では+1に近い傾向を示す相関データとして形成されていることが好ましい。
前記血流変動指標算出手段が、前記生体信号中、前記心室充満期から等容性収縮期に対応する時系列波形の範囲において2つの波形成分を一組以上特定し、前記2つの波形成分の各全振幅を用いて散布図を作成する散布図作成手段と、前記散布図にプロットされた点群の回帰直線の傾きを求め、前記点群の回帰直線の傾きを前記血流変動に起因して生じる振動に関する指標とする散布図傾き算出手段とを有することが好ましい。
The biological signal processing means can continuously estimate the blood pressure of the person by using the biological signal received continuously.
The fluctuation index calculation means obtains a time-series waveform of an index related to vibration caused by the blood flow fluctuation, frequency-analyzes the time-series waveform, and displays the fluctuation as a frequency analysis result in a log-log graph of both the power spectrum and the frequency. It is preferable to have a fluctuation analysis means for obtaining an analysis diagram and a fluctuation analysis diagram inclination calculation means for obtaining the slope of the regression line of the fluctuation analysis diagram and using the inclination of the regression line of the fluctuation analysis diagram as an index for the fluctuation.
The fluctuation analysis diagram slope calculation means is a means for obtaining the slope of a regression line in a predetermined frequency band belonging to the range from VLF to LF as the slope of the regression line related to the fluctuation analysis diagram, and using the slope as an index related to the fluctuation. It is preferable to have.
The correlation data for blood pressure estimation is used as correlation data in which the slope of the regression line of a predetermined frequency band belonging to the range from VLF to LF tends to be close to -1 in normal blood pressure and close to +1 in high blood pressure. It is preferably formed.
The blood flow fluctuation index calculating means identifies one or more sets of two waveform components in the range of the time-series waveform corresponding to the ventricular filling period to the isotonic contraction period in the biological signal, and the two waveform components of the two waveform components. A scatter plot creating means for creating a scatter plot using each total waveform and the inclination of the regression line of the point group plotted on the scatter diagram are obtained, and the inclination of the regression line of the point group is caused by the blood flow fluctuation. It is preferable to have a scatter plot tilt calculation means as an index for the vibration generated.
前記散布図作成手段が、前記心室充満期の心房収縮時における前記2つの波形成分の各全振幅を用いた第1の散布図と、前記第1の散布図に用いた前記2つの波形成分より後のタイミング以降であって等容性収縮期に移行する房室弁閉鎖時付近のタイミングに対応する前記2つの波形成分の各全振幅を用いた第2の散布図とを作成する手段であり、前記ゆらぎ指標算出手段が前記第1の散布図を用いて求めたゆらぎ指標から、前記推定手段が拡張期血圧を推定し、前記ゆらぎ指標算出手段が前記第2の散布図を用いて求めたゆらぎ指標から、前記推定手段が収縮期血圧を推定する構成であることが好ましい。 The scatter plot creating means is based on the first scatter plot using the total amplitude of each of the two waveform components at the time of atrial contraction during the ventricular filling period and the two waveform components used in the first scatter plot. It is a means for creating a second scatter plot using each total amplitude of the two waveform components corresponding to the timing near the time when the atrioventricular valve is closed, which is after the later timing and shifts to the isotonic systole. , The estimation means estimated the systolic blood pressure from the fluctuation index obtained by the fluctuation index calculation means using the first scatter plot, and the fluctuation index calculation means obtained it using the second scatter plot. It is preferable that the estimation means estimates the systolic blood pressure from the fluctuation index.
本発明の血圧推定方法は、人の背部に当接され、前記背部の体表面を介して伝播する生体信号を非拘束で捉える生体信号測定装置から前記生体信号を受信し、前記生体信号の時系列波形を所定の周波数帯域でフィルタリングし、心周期を顕在化させたフィルタ処理波形を得て、前記生体信号の測定と同時に測定した心電計から得られる心電図波形データに前記フィルタ処理波形を照合し、前記フィルタ処理波形における心室充満期から等容性収縮期における時系列波形の範囲の波形成分を特定し、心室充満期から等容性収縮期における血流変動に起因して生じる振動に関する指標を求め、前記血流変動に起因して生じる振動に関する指標の時系列波形を求めた後、その時系列波形の変動の仕方を示すゆらぎに関する指標を求め、前記ゆらぎに関する指標を、予め記憶部に記憶された前記ゆらぎに関する指標と血圧との関係を示す血圧推定用相関データを用いて、前記人の血圧を推定することを特徴とする。 The blood pressure estimation method of the present invention receives the biometric signal from a biometric signal measuring device that is in contact with the back of a person and captures the biometric signal propagating through the body surface of the back without restraint, and at the time of the biometric signal. The series waveform is filtered in a predetermined frequency band to obtain a filtered waveform in which the cardiac cycle is manifested, and the filtered waveform is collated with the electrocardiogram waveform data obtained from the electrocardiograph measured at the same time as the measurement of the biological signal. Then, the waveform components in the range of the time-series waveform from the ventricular filling period to the isotropic contraction period in the filtered waveform are specified, and an index relating to the vibration caused by the blood pressure fluctuation in the ventricular filling period to the isotropic contraction period is specified. After obtaining the time-series waveform of the index related to the vibration caused by the blood pressure fluctuation, the index related to the fluctuation indicating how the time-series waveform fluctuates is obtained, and the index related to the fluctuation is stored in the storage unit in advance. It is characterized in that the blood pressure of the person is estimated by using the correlation data for blood pressure estimation showing the relationship between the index related to the fluctuation and the blood pressure.
前記生体信号測定装置から、前記生体信号を連続的に受信し、前記人の血圧を連続的に推定することが好ましい。
前記生体信号測定装置の生体信号検出部を、前記人の背部において、鎖骨の位置に対応する部位から剣状突起の位置に対応する部位までの範囲に設けて前記生体信号を捉えることが好ましい。
It is preferable to continuously receive the biological signal from the biological signal measuring device and continuously estimate the blood pressure of the person.
It is preferable that the biological signal detection unit of the biological signal measuring device is provided in the range from the portion corresponding to the position of the clavicle to the portion corresponding to the position of the xiphoid process on the back of the person to capture the biological signal.
本発明のコンピュータプログラムは、人の背部に当接され、前記背部の体表面を介して伝播する生体信号を非拘束で捉える生体信号測定装置から前記生体信号を受信し、受信した前記生体信号を解析する生体信号処理手順を実行させ、コンピュータを血圧推定装置として機能させるコンピュータプログラムであって、前記生体信号処理手順として、前記生体信号の時系列波形を所定の周波数帯域でフィルタリングし、心周期を顕在化させたフィルタ処理波形を得る手順と、前記生体信号の測定と同時に測定した心電計から得られる心電図波形データに前記フィルタ処理波形を照合し、前記フィルタ処理波形における心室充満期から等容性収縮期における時系列波形の範囲の波形成分を特定し、心室充満期から等容性収縮期における血流変動に起因して生じる振動に関する指標を求める手順と、前記血流変動に起因して生じる振動に関する指標の時系列波形を求め、その時系列波形の変動の仕方を示すゆらぎに関する指標を求める手順と、前記ゆらぎに関する指標を、予め記憶部に記憶された前記ゆらぎに関する指標と血圧との関係を示す血圧推定用相関データを用いて、前記人の血圧を推定する手順とを前記コンピュータに実行させることを特徴とする。 The computer program of the present invention receives the biometric signal from a biometric signal measuring device that abuts on the back of a person and captures the biometric signal propagating through the body surface of the back without restraint, and receives the biometric signal. A computer program that executes a biometric signal processing procedure to be analyzed and causes the computer to function as a blood pressure estimation device. As the biometric signal processing procedure, the time-series waveform of the biometric signal is filtered in a predetermined frequency band to determine the cardiac cycle. The filtered waveform is collated with the procedure for obtaining the actualized filtered waveform and the electrocardiogram waveform data obtained from the electrocardiograph measured at the same time as the measurement of the biological signal, and the equivalent from the ventricular filling period in the filtered waveform. The procedure for identifying the waveform components in the range of the time-series waveform in the sexual contraction period and obtaining the index related to the vibration caused by the blood flow fluctuation from the ventricular filling period to the isotropic contraction period, and the procedure due to the blood flow fluctuation. The relationship between the procedure for obtaining the time-series waveform of the index related to the generated vibration and the index related to the fluctuation indicating how the time-series waveform fluctuates, and the index related to the fluctuation stored in advance in the storage unit and the blood pressure. It is characterized in that the computer is made to perform the procedure of estimating the blood pressure of the person by using the correlation data for blood pressure estimation showing the above.
前記生体信号処理手順は、連続的に受信した前記生体信号を用い、前記コンピュータに、前記人の血圧の推定を連続的に実行させることが好ましい。
前記ゆらぎに関する指標を求める手順では、前記血流変動に起因して生じる振動に関する指標の時系列波形を求めると共に、その時系列波形を周波数解析し、パワースペクトルと周波数の両対数グラフに周波数解析結果であるゆらぎ解析図を得る手順と、前記ゆらぎ解析図の回帰直線の傾きを求め、前記ゆらぎ解析図の回帰直線の傾きを前記ゆらぎに関する指標とする手順とを前記コンピュータに実行させることが好ましい。
前記ゆらぎ解析図に関する回帰直線の傾きとして、VLFからLFの範囲に属する所定の周波数帯の回帰直線の傾きを求め、その傾きを前記ゆらぎに関する指標とすることが好ましい。
It is preferable that the biological signal processing procedure uses the continuously received biological signal and causes the computer to continuously estimate the blood pressure of the person.
In the procedure for obtaining the index related to the fluctuation, the time-series waveform of the index related to the vibration caused by the blood flow fluctuation is obtained, the time-series waveform is frequency-analyzed, and the frequency analysis result is displayed on both the power spectrum and the frequency log-log graph. It is preferable to have the computer execute a procedure for obtaining a certain fluctuation analysis diagram and a procedure for obtaining the slope of the regression line of the fluctuation analysis diagram and using the slope of the regression line of the fluctuation analysis diagram as an index related to the fluctuation.
As the slope of the regression line related to the fluctuation analysis diagram, it is preferable to obtain the slope of the regression line of a predetermined frequency band belonging to the range from VLF to LF and use the slope as an index related to the fluctuation.
血流変動に起因して生じる振動に関する指標を求める手順では、前記生体信号中、前記心室充満期から等容性収縮期に対応する時系列波形の範囲において2つの波形成分を一組以上特定し、前記2つの波形成分の各全振幅を用いて散布図を作成する手順と、前記散布図にプロットされた点群の回帰直線の傾きを求め、前記点群の回帰直線の傾きを前記血流変動に起因して生じる振動に関する指標とする手順とを前記コンピュータに実行させることが好ましい。
前記散布図を作成する手順として、前記心室充満期の心房収縮時における前記2つの波形成分の各全振幅を用いた第1の散布図と、前記第1の散布図に用いた前記2つの波形成分より後のタイミング以降であって等容性収縮期に移行する房室弁閉鎖時付近のタイミングに対応する前記2つの波形成分の各全振幅を用いた第2の散布図とを作成する手順が実行され、前記ゆらぎに関する指標を求める手順では、前記第1の散布図を用いて求めたゆらぎ指標から拡張期血圧を推定し、前記第2の散布図を用いて求めたゆらぎ指標から、収縮期血圧を推定することが好ましい。
In the procedure for obtaining an index related to vibration caused by blood flow fluctuation, one or more sets of two waveform components are specified in the biological signal in the range of the time-series waveform corresponding to the ventricular filling period to the isotropic contraction period. , The procedure for creating a scatter plot using each total amplitude of the two waveform components, and the inclination of the regression line of the point group plotted on the scatter diagram are obtained, and the inclination of the regression line of the point group is used as the blood flow. It is preferable to have the computer perform a procedure that serves as an index for vibrations caused by fluctuations.
As a procedure for creating the scatter plot, a first scatter plot using each total amplitude of the two waveform components at the time of atrioventricular systole during the ventricular diastole, and the two waveforms used in the first scatter plot. Procedure for creating a second scatter plot using each total amplitude of the two waveform components corresponding to the timing after the component and the timing near the closing of the atrioventricular valve that shifts to the isotonic systole. Is executed, and in the procedure for obtaining the index related to the fluctuation, the diastolic blood pressure is estimated from the fluctuation index obtained using the first scatter plot, and the systolic blood pressure is estimated from the fluctuation index obtained using the second scatter plot. It is preferable to estimate the systolic blood pressure.
本発明のコンピュータ読み取り可能な記録媒体は、人の背部に当接され、前記背部の体表面を介して伝播する生体信号を非拘束で捉える生体信号測定装置から前記生体信号を受信し、受信した前記生体信号を解析する生体信号処理手順を実行させ、コンピュータを血圧推定装置として機能させる上記コンピュータプログラムが記録されていることを特徴とする。 The computer-readable recording medium of the present invention receives and receives the biological signal from a biological signal measuring device that is in contact with the back of a person and captures the biological signal propagating through the body surface of the back without restraint. It is characterized in that the computer program for executing the biological signal processing procedure for analyzing the biological signal and causing the computer to function as a blood pressure estimation device is recorded.
ここで、本発明によって血圧が推定できる原理を説明する。
人の心拍出量は、身体の代謝需要に応じて規定され、心拍出量は、心拍数と一回拍出量の積に等しい。心拍数は心臓血管中枢を中心とする自律神経系支配と体液性支配で制御されている。拍出量は、室の前負荷に影響を受け、一回拍出量は心収縮力と前負荷・後負荷によって決まる。血流量の変動の様子は、ベルヌーイ定理を用いた数理モデルで説明することができる。ベルヌーイの定理は圧力エネルギー、運動エネルギー、位置エネルギーからなり、水柱の高さに置き換えて圧力水頭(pressure head)、速度水頭(velocity head)、位置水頭(elevation head)と呼ばれ、各水頭の総和が全水頭(total head)となる。摩擦・曲がり・出入り口で失われるエネルギーは、速度水頭に比例する損失水頭(head loss)であり、流量変動の支配方程式は、前負荷・後負荷の血液の水頭と流量の関数で求められる。
Here, the principle that blood pressure can be estimated by the present invention will be described.
A person's cardiac output is defined according to the body's metabolic demand, and the cardiac output is equal to the product of the heart rate and the stroke volume. Heart rate is controlled by autonomic nervous system control and humoral control centered on the cardiovascular center. Cardiac output is affected by the preload of the chamber, and stroke volume is determined by myocardial contractile force and preload / afterload. The state of fluctuations in blood flow can be explained by a mathematical model using Bernoulli's theorem. Bernoulli's theorem consists of pressure energy, kinetic energy, and position energy, which are called pressure head, velocity head, and elevation head in place of the height of the water column, and are the sum of each head. Is the total head. The energy lost at friction, bending, and entrance / exit is the head loss, which is proportional to the velocity head, and the governing equation of the flow rate fluctuation is calculated by the function of the head and flow rate of preloaded and postloaded blood.
本発明者は、これらを応用し、上記の体循環の原動力である左心室の血流量の変動の仕方、血流制御の在り方を知る方法として、損失水頭の変動から知ることを考えた。心臓から背部体表面に伝わる振動(音)の変動情報は心筋の収縮力の変動による血流量の変動より作られる。血流量の変動は、心筋の拡張能、収縮能より作られる。心拍出量と全末梢血管抵抗の積は血圧となり、心拍数と心収縮力の変動が血圧変動を生む。血圧の勾配によって、血液は流れる。収縮と弛緩により拍動が生じ、拡張期と収縮期が交互にある心臓の拍動により、動脈圧は変化する。つまり、この動脈圧の変動を捉えるためのパラメータが、左心室の振動(音)変動情報の中に隠されているということになる。そして心周期のどの時相の変動を見ればよいのか、それが重要なポイントになる。心室周期は四つの期に分けて考えられる。心室充満期、等容性収縮期、拍出期、等容性弛緩期である。心室充満期は、初期の急速充満期、ゆるやかな充満期、そして最後の心房収縮による充満期がある。心房収縮は心電図P波に始まる。圧格差に基づく自然の心室充満に対して、左心房はブースター機能となり、併せて左室の前負荷となる。この静脈還流に基づく前負荷により、左室の拡張末期圧が上昇する。心房収縮時以降の血流変動は左心拡張期圧変動と心拍数の変動に相関することは知られている。ここに拡張期血圧を知る手掛かりは心室充満期、特に心房収縮による充満期にあると考えられる。 By applying these, the present inventor considered to know from the fluctuation of the head loss as a method of knowing how the blood flow in the left ventricle, which is the driving force of the systemic circulation, fluctuates and how the blood flow is controlled. Vibration (sound) fluctuation information transmitted from the heart to the surface of the back body is created from fluctuations in blood flow due to fluctuations in the contractile force of the myocardium. Fluctuations in blood flow are created by the diastolic and contractile capacities of the myocardium. The product of cardiac output and total peripheral vascular resistance is blood pressure, and fluctuations in heart rate and myocardial contractility produce blood pressure fluctuations. Blood flows due to the gradient of blood pressure. The contraction and relaxation cause pulsation, and the pulsation of the heart, which alternates between diastole and systole, changes arterial pressure. That is, the parameter for capturing the fluctuation of the arterial pressure is hidden in the vibration (sound) fluctuation information of the left ventricle. And which time phase of the cardiac cycle should be seen is an important point. The ventricular cycle can be divided into four phases. It is the ventricular filling period, isotonic systole, expulsion period, and isotropic relaxation period. Ventricular filling period includes an early rapid filling period, a slow filling period, and a filling period due to the final atrial contraction. Atrial contraction begins with the electrocardiogram P wave. The left atrium functions as a booster for natural ventricular filling based on the pressure gap, and also serves as a preload for the left ventricle. Preload based on this venous return increases the end-diastolic pressure of the left ventricle. It is known that fluctuations in blood flow after atrial contraction correlate with fluctuations in left diastolic pressure and fluctuations in heart rate. Here, the clue to know the diastolic blood pressure is considered to be in the ventricular filling period, especially in the filling period due to atrial contraction.
血流変動の定常性は平均値、相関関数(PSD)などの統計量が測定時刻によらず一定であるという性質にある。平均値は心拍数であり、心拍数の変動からなる時系列波形のPSDによって自律神経系活動が定量され、心拍ゆらぎと呼ばれる。心拍ゆらぎは、1/fβゆらぎと呼ばれる数値で表される。心拍数の時系列データが定常であれば、PSDの対数表示が周波数の対数表示に反比例する。スペクトル指数β=1、1/fゆらぎと呼ばれるものであり、βが1より大きい場合、生理学的意味においては非定常と定義される。言い換えると、一般的に定常状態と呼ばれる安静時では、心拍ゆらぎは、全体として1/fゆらぎとなり、フラクタル・ブラウン運動を示す。時折の血圧上昇や降圧剤は、ゆらぎを高止まりにする。高止まりとなる周期成分が任意の時間幅で混入すると、心拍数と心収縮力に変動が生じ、血圧が変化する。ストレスは血圧を変化させ、血流変動をもたらす。血流変動は、各周期成分のPSDに大変動と停滞をもたらし、時刻に依存する時系列信号を生み出す。大変動と停滞は、血流変動のゆらぎに非定常性をもたらす。 The stationarity of blood flow fluctuation has the property that statistics such as the average value and correlation function (PSD) are constant regardless of the measurement time. The average value is the heart rate, and the autonomic nervous system activity is quantified by the PSD of the time-series waveform consisting of the fluctuation of the heart rate, which is called the heart rate fluctuation. Heart rate fluctuation is expressed by a numerical value called 1 / f β fluctuation. If the time series data of heart rate is steady, the logarithmic display of PSD is inversely proportional to the logarithmic display of frequency. The spectral index β = 1, 1 / f fluctuation, and when β is larger than 1, it is defined as unsteady in the physiological sense. In other words, at rest, which is generally called a steady state, the heart rate fluctuation becomes 1 / f fluctuation as a whole, indicating fractal Brownian motion. Occasional increases in blood pressure and antihypertensive drugs keep fluctuations high. When a cycle component that stays high is mixed in at an arbitrary time width, the heart rate and myocardial force fluctuate, and the blood pressure changes. Stress changes blood pressure, resulting in blood flow fluctuations. Blood flow fluctuations cause cataclysms and stagnation in the PSD of each periodic component, producing time-dependent time-series signals. Cataclysms and stagnation cause non-stationary fluctuations in blood flow fluctuations.
生体に対する外乱が存在しない状態、すなわちストレスフリーの状態では、心拍数や血流量のゆらぎは1/fβ型となり、正常血圧者は、β=1、1/fβは−1になる。高血圧患者は、自律神経系支配と体液性支配が安静状態でも現れ、フラクタル・ブラウン運動に交感神経支配による周期成分が含まれるようになる。すなわち、高血圧患者は、心拍数や血流量のゆらぎを示す1/fβは全体としておおよそ−1となるが、そのうち交感神経支配の状態を示すLF帯域を含む領域のゆらぎに高止まりが現れ、その領域において+成分が現れる。 In the state where there is no disturbance to the living body, that is, in the stress-free state, the fluctuation of heart rate and blood flow becomes 1 / f β type, and in the normal blood pressure person, β = 1 and 1 / f β becomes -1. In hypertensive patients, autonomic nervous system innervation and humoral innervation appear even in the resting state, and fractal Brownian motion includes a periodic component due to sympathetic innervation. That is, in hypertensive patients, 1 / f β, which indicates fluctuations in heart rate and blood flow, is approximately -1 as a whole, but the fluctuations in the region including the LF band, which indicates the state of sympathetic innervation, remain high. A + component appears in that region.
また、降圧剤投与による人為的な血圧低下は、反射性交感神経緊張による心収縮性の増大により、血圧変動は抑制される。また生体の反射性調節が働かない場合には、心室と動脈系の力学的相互関係の最適結合に従って決定される血圧が維持される。自律神経系が作動する状況では、生体はあらかじめ設定した血圧を維持することを優先して、血液循環を調節する。すなわち、心血管系の整合は自律神経系により大きく修飾されるが、心臓および血管の交感神経応答性の違いにより変化し、その整合状況が維持されるわけではない。人為的な降圧剤投与は、心血管系の整合に対して、強い影響力を発揮し、降圧剤による制御は、血流変動のゆらぎが1/fβの一部に線形部分、すなわち、+成分が現れるように推移していくことが考えられる。 In addition, the artificial decrease in blood pressure due to the administration of antihypertensive agents is suppressed by the increase in cardiac contractility due to reflex sympathetic tone. In addition, when the reflex regulation of the living body does not work, the blood pressure determined according to the optimal connection of the mechanical interrelationship between the ventricle and the arterial system is maintained. In situations where the autonomic nervous system operates, the body regulates blood circulation in favor of maintaining a preset blood pressure. That is, the alignment of the cardiovascular system is greatly modified by the autonomic nervous system, but it changes due to the difference in sympathetic nerve responsiveness between the heart and blood vessels, and the alignment status is not maintained. Artificial antihypertensive agent administration, against cardiovascular matching, exert a strong influence, control by antihypertensive agents are linear portion in a portion fluctuations of blood flow variation of 1 / f beta, i.e., + It is conceivable that the components will change so that they appear.
また、左心拡張期圧の支配方程式は、心拍数の自律神経支配と体液性支配に相関するパラメータであるVLFからLF帯域までのゆらぎの積分強度が関与している。血流変動並びに正常化因子は、心臓に帰ってきた血流によって引き起こされる物理現象から心機能を判断でき、心室の前負荷が鍵となり、時相は心房収縮から心室収縮に至る境界にあるとする。そこで、解析対象の時相は、等容性収縮期の直前直後となる。 In addition, the governing equation of left diastolic pressure involves the integrated intensity of fluctuations from VLF to the LF band, which is a parameter that correlates with the autonomic innervation and humoral innervation of heart rate. Blood flow variability and normalization factors can determine cardiac function from the physical phenomena caused by the blood flow returning to the heart, and the preload of the ventricles is the key, and the time phase is at the boundary from atrial contraction to ventricular contraction. To do. Therefore, the time phase to be analyzed is immediately before and after the isotropic systole.
交感神経は、β受容体刺激により促進性G蛋白を介して心拍数増加、心収縮力増強などを生じさせる。これら交感神経緊張に伴い、臨床的に観察される現象は、約15秒でピークに達するといわれている。一方、交感神経刺激に対する効果の発現は、心拍数に対して、一拍ごとの動的な調整はできないことも知られている。ここに安静状態での心拍変動と心収縮力のゆらぎを観察することで、β受容体刺激による心拍数増加、心収縮力増強による血圧変動を捉えられる可能性があると考えられる。血圧変動は、血流変動のゆらぎと相関し、血流変動は背部体表音の周波数帯域上に現れる。 The sympathetic nerve causes an increase in heart rate, an increase in cardiac contractility, and the like via a promoter G protein by β-receptor stimulation. With these sympathetic tone, the clinically observed phenomenon is said to reach its peak in about 15 seconds. On the other hand, it is also known that the expression of the effect on sympathetic nerve stimulation cannot be dynamically adjusted for each beat with respect to the heart rate. By observing the fluctuation of the heart rate and the fluctuation of the myocardial force in the resting state, it is considered that the increase in the heart rate due to the stimulation of β-receptor and the fluctuation of the blood pressure due to the enhancement of the cardiac contractile force may be captured. Blood pressure fluctuations correlate with fluctuations in blood flow fluctuations, and blood flow fluctuations appear in the frequency band of the back body surface sound.
ところで、外側の心膜と内側の心膜の間にある心膜腔には数mlの液体がたまっている。この心膜腔液は心臓のポンプ作用に影響を与える。成人の心臓の重さは200〜300gで心音の周波数は25〜45Hz、ないし50Hzといわれている。心音の周波数が心臓を浮動させる構造体の固有振動数に一致するとして心臓浮動構造体の動的ばね定数を計算すると、約2.5kg/mm前後となる。この計算結果を正として考えると、心臓浮動構造体は70Hz以上の高周波に対して除振機能を有し、低周波帯域は剛体として考えられ、固有振動数以下の25Hz前後の低周波数帯域の振動・音響波形は線形・弱非線形情報となる。 従って、共振帯域を除く25Hz以下の振動波形を計測対象とする。 By the way, several ml of liquid is accumulated in the pericardial cavity between the outer pericardium and the inner pericardium. This pericardial fluid affects the pumping action of the heart. It is said that an adult heart weighs 200 to 300 g and the frequency of heart sounds is 25 to 45 Hz or 50 Hz. When the dynamic spring constant of the floating heart structure is calculated assuming that the frequency of the heart sound matches the natural frequency of the structure that floats the heart, it is about 2.5 kg / mm. Considering this calculation result as positive, the floating cardiac structure has a vibration isolation function for high frequencies of 70 Hz or higher, the low frequency band is considered to be a rigid body, and vibration in the low frequency band of around 25 Hz below the natural frequency.・ Acoustic waveforms are linear and weakly nonlinear information. Therefore, the vibration waveform of 25 Hz or less excluding the resonance band is targeted for measurement.
体循環の支配因子である自律神経支配とホルモンによる体液性支配は、心拍変動の周波数帯域のゆらぎの積分強度で識別され、0.15〜0.4HzのHF帯域と0.04〜0.15HzのLF帯域のゆらぎの積分強度は、副交感間神経および交感神経の各活動状態を表し、0.003〜0.04HzのVLF帯域の積分強度は体液性支配により発現するといわれている。そして、経験的に得られたVLFの亢進は、視床下部室傍核のコルチコトロピン分泌ホルモン(CRH)により活動を亢進される副腎皮質刺激ホルモン(ACTH)と副交感神経およびエピネフリンの亢進、そして交感神経とアンジオテンシンの抑制が条件となり、心拍数増大に寄与する。またCRH−ACTH系と交感神経がともに賦活するのは耐ストレス反応である。なお、夜間はメラトニン分泌による交感神経系の強力な抑制により、CRH−ACTH系の亢進と副交感神経の賦活化にもかかわらず心拍数および血圧は低値に維持されることも知られている。 Autonomic innervation, which is the governing factor of body circulation, and humoral innervation by hormones are identified by the integrated intensity of fluctuations in the frequency band of heart rate variability, and are identified by the HF band of 0.15 to 0.4 Hz and 0.04 to 0.15 Hz. The integrated intensity of fluctuations in the LF band represents the active states of the parasympathetic nerve and the sympathetic nerve, and the integrated intensity of the VLF band of 0.003 to 0.04 Hz is said to be expressed by humoral control. The empirically obtained enhancement of VLF includes the enhancement of adrenocorticotropic hormone (ACTH), which is enhanced by corticotropin-secreting hormone (CRH) in the paraventricular nucleus of the hypothalamus, and the enhancement of parasympathetic nerve and epinephrine, and the sympathetic nerve. Suppression of angiotensin is a condition and contributes to an increase in heart rate. Moreover, it is the stress-resistant response that both the CRH-ACTH system and the sympathetic nerve are activated. It is also known that the heart rate and blood pressure are maintained at low values at night despite the enhancement of the CRH-ACTH system and the activation of the parasympathetic nerve due to the strong suppression of the sympathetic nervous system by melatonin secretion.
血流変動は、一回拍出量と心拍数の変動で表され、計測状態を安静状態かつ短時間で規定すると一回拍出量の変動は安定し、心拍数の変動が血流変動の支配因子として高い寄与率を持つ。心拍数の変動は、VLFとLFが支配因子となるため、計測のための時間幅をVLFから求めると、360秒間となり、1/360は0.003HzでVLFの帯域の周波数となる。左心室の拡張能と収縮能が血圧の変動に対して依存性を持つと考えられ、血流変動は、質量の変動と速度の変動が支配因子で、質量の変動は血液量の変動として現れ、速度の変動は心拍変動として現れる。力積となる血圧変動は、質量の変動と速度の変動が支配因子で、結果として2つの因子が絡み合って生じるのが時系列波形の振幅変動(ゆらぎ)となる。ここに、弁を管路とした数理モデルを検討する。 Blood flow fluctuations are represented by stroke volume and heart rate fluctuations. If the measurement state is defined in a resting state and in a short period of time, stroke volume fluctuations are stable, and heart rate fluctuations are blood flow fluctuations. Has a high contribution rate as a controlling factor. Since VLF and LF are the controlling factors for the fluctuation of the heart rate, the time width for measurement is obtained from VLF for 360 seconds, and 1/360 is 0.003 Hz, which is the frequency of the VLF band. The diastolic and contractile abilities of the left ventricle are thought to be dependent on blood pressure fluctuations, and blood flow fluctuations are dominated by mass fluctuations and velocity fluctuations, and mass fluctuations appear as blood volume fluctuations. , Speed fluctuations appear as heart rate fluctuations. Blood pressure fluctuations, which are impulses, are governed by mass fluctuations and velocity fluctuations, and as a result, the amplitude fluctuations (fluctuations) of the time-series waveform are caused by the intertwining of the two factors. Here, we consider a mathematical model with a valve as a pipeline.
図24(a),(b)は、心室充満期から等容性収縮期で弁が解放していくまでの心房と心室の容積変化と血液の動きを示したものである。x は心房・僧帽弁・心室を移動する血液の線座標を示す。僧帽弁の入り口を0とし、出口をx=lとする。添え字は入り口で1、出口で2とする。僧帽弁の断面積をA、単位体積の血液の重量をγ、重力加速度をg、流速をv、血液の水頭をh、圧力をPとする。 FIGS. 24 (a) and 24 (b) show the volume change and blood movement of the atrium and the ventricle from the ventricular filling period to the isotonic systole when the valve is released. x indicates the line coordinates of blood moving through the atrium, mitral valve, and ventricle. The entrance of the mitral valve is 0, and the exit is x = l. Subscripts are 1 at the entrance and 2 at the exit. Let A be the cross-sectional area of the mitral valve, γ be the weight of blood in a unit volume, g be the gravitational acceleration, v be the flow velocity, h be the head of blood, and P be the pressure.
僧帽弁入り口x=0のときの血液の圧力はP1=γh1
となり、
時間Δtの間に流量Q の血液を押し込むのに要する仕事ΔW1は、
ΔW1=P1QΔt=γh1QΔt・・・(1)
となる。
The blood pressure when the mitral valve entrance x = 0 is P1 = γh1
Next,
The work ΔW1 required to push the blood at the flow rate Q during the time Δt is
ΔW1 = P1QΔt = γh1QΔt ... (1)
Will be.
同様に僧帽弁出口端でなされる仕事は、
ΔW2=γh2QΔt ・・・(2)
となる。
Similarly, the work done at the outlet of the mitral valve is
ΔW2 = γh2QΔt ・ ・ ・ (2)
Will be.
流体の圧力損失は流量Qの関数であるからf(Q)とする。この損失のために僧帽弁内で、時間Δtの間に費やされるエネルギーΔLは、
ΔL=γf(Q)QΔt・・・(3)
となる。
Since the pressure loss of the fluid is a function of the flow rate Q, it is assumed to be f (Q). The energy ΔL spent during the time Δt in the mitral valve due to this loss is
ΔL = γf (Q) QΔt ... (3)
Will be.
僧帽弁内の移動量dxに対応する運動エネルギーは、
dK=(V2/2g)×Aγdx ・・・(4)
で表される。
Aは血液の面積で、Aγは血液の重量である。
The kinetic energy corresponding to the amount of movement dx in the mitral valve is
dK = (V 2 / 2g) × Aγdx ・ ・ ・ (4)
It is represented by.
A is the area of blood and Aγ is the weight of blood.
従って、
dk=(1/2gA)×γQ2dx・・・(5)
となる。
Therefore,
dk = (1 / 2gA) x γQ 2 dx ... (5)
Will be.
ゆえに血液の持つ運動エネルギーKは、
K=γQ2m/2・・・(6)
で表される。
但し、mは僧帽弁の性状により定まる定数で、弁定数と呼ぶ。
Therefore, the kinetic energy K of blood is
K = γQ 2 m / 2 ... (6)
It is represented by.
However, m is a constant determined by the properties of the mitral valve and is called a valve constant.
微小時間Δt間の僧帽弁内の血液の運動エネルギーの変化ΔKを求める。
ΔK=mγQ(dQ/Δt)・・・(7)
となる。
The change ΔK of the kinetic energy of blood in the mitral valve during the minute time Δt is obtained.
ΔK = mγQ (dQ / Δt) ・ ・ ・ (7)
Will be.
ΔK=ΔW1−ΔW2−ΔL・・・(8)
なる関係より、
m(dQ/dt)=h1−h2−f(Q)・・・(9)
が求められる。
ΔK = ΔW1-ΔW2-ΔL ... (8)
From the relationship
m (dQ / dt) = h1-h2-f (Q) ... (9)
Is required.
図24(a)に示すh1は前負荷である心房収縮による圧力水頭、h2は後負荷で心室拡張期圧による圧力水頭である。
心室拡張気圧の変化は、流量Qの時間的変化が与えられれば、求めることができる。
(9)式は整理すると、
h1−h2=m(dQ/dt)+f(Q)・・・(10)
で表され、
中心静脈圧、心房圧は、心房収縮時直前では、ほぼ一定と考え、かつ水頭損失はIVが小さいため、f(Q)≒0とすると、
h1−h2=m(dQ/dt)・・・(11)
となる。
In FIG. 24A, h1 is a pressure head due to atrial contraction, which is a preload, and h2 is a pressure head due to ventricular diastolic pressure, which is an afterload.
The change in ventricular diastolic pressure can be determined given the temporal change in flow rate Q.
(9) can be summarized as follows.
h1-h2 = m (dQ / dt) + f (Q) ... (10)
Represented by
Central venous pressure and atrial pressure are considered to be almost constant immediately before atrial contraction, and head loss is small in IV. Therefore, if f (Q) ≒ 0,
h1-h2 = m (dQ / dt) ... (11)
Will be.
流量はQ0から0に急速に、かつ一様に変化するとし、僧房弁閉鎖に要する時間はTmで表すと、心室拡張圧の上昇Δ(h1−h2)は、
Δ(h1−h2)=mQ0/Tm=l/gA×Q0/Tm=lv0/gTm...(12)となる。
Assuming that the flow rate changes rapidly and uniformly from Q0 to 0, and the time required for mitral valve closure is expressed in Tm, the increase in ventricular diastolic pressure Δ (h1-h2) is
Δ (h1-h2) = mQ0 / Tm = l / gA × Q0 / Tm = lv0 / gTm. .. .. (12).
ここに、水頭の上昇は急速充満期の流速が大きいほど、僧房弁を閉じる時間が短いほど、水撃作用は大きくなり、大きなI音が生じることがわかる。mは僧帽弁・大動脈弁の導管としての機能によって決まる定数である。h1は前負荷を表し、心房収縮の静脈還流圧と心房収縮能で決定される心房圧である。後負荷は心室内圧である。ここにh1−h2は、心室まで帰ってくる血液を押し出すのに必要な心房の収縮能に相関し、上腕の拡張期血圧とも相関性がある。また左房内圧と左室内圧の差がh1−h2で、この差が等しくなる時がR波の出現ポイントで僧房弁の閉鎖の時である。
f(Q)=m(dQ/dt)・・・(13)
Δf(Q)∝dPmax/dt・・・(14)
となり、収縮期血圧も同様にしてR波近傍の血液量の変動と相関性が取れる可能性が示唆される。
Here, it can be seen that the higher the flow velocity during the rapid filling period and the shorter the closing time of the mitral valve, the greater the water hammer action and the louder I sound is generated. m is a constant determined by the function of the mitral valve / aortic valve as a conduit. h1 represents preload and is the atrial pressure determined by the venous return pressure of atrial contraction and the atrial contractility. Afterload is the intraventricular pressure. Here, h1-h2 correlates with the contractile capacity of the atrium required to push the blood returning to the ventricles, and also with the diastolic blood pressure of the upper arm. The difference between the left atrial pressure and the left ventricular pressure is h1-h2, and the time when this difference becomes equal is the time when the mitral valve is closed at the appearance point of the R wave.
f (Q) = m (dQ / dt) ... (13)
Δf (Q) ∝dPmax / dt ... (14)
Therefore, it is suggested that the systolic blood pressure may be similarly correlated with the fluctuation of the blood volume near the R wave.
ここで、高血圧患者と正常被験者の差について検討してみる。心室は拡張しきると、静脈圧によって血液がさらに心室内に流入する。充満期の最後の時相で、左房収縮でさらなる血液が左室内に押し込まれる。20〜30歳代の成人で安静状態では、心房収縮による血液の流入量は全体の10〜20%に過ぎないが、加齢とともにその比率は上昇し、46%前後まで上昇することは知られている。左房収縮による血液充満は、高血圧患者では、その比率が上昇すると考えられる。なぜなら、高血圧患者は20〜30歳代の若年成人時に比べて比較的心拍数は増加傾向にある。心拍数が増加すると受動的な血液充満のための時間が短くなる。この充満期の最後の時相における流量は、左房収縮による左室充満が拡張期血圧を決定する際の重要なファクターになるとし、このファクターは、交感神経刺激により変動する。この変動の仕方は、神経伝達物質であるノルアドレナリン、アドレナリンの分泌の影響を受け、ノルアドレナリンは心筋細胞膜のβ1受容体と結合し、アドレナリンも心筋β1受容体に作用する。アドレナリンとノルアドレナリンは、カテコールアミンと呼ばれ、β1受容体を活性化させ、心拍数の増加、収縮力の増加を引き起こす。 Here, let us examine the difference between hypertensive patients and normal subjects. When the ventricles are fully dilated, venous pressure causes more blood to flow into the ventricles. At the end of the full period, left atrial contraction pushes more blood into the left chamber. In the resting state of adults in their 20s and 30s, the inflow of blood due to atrial contraction is only 10 to 20% of the total, but it is known that the ratio increases with aging and rises to around 46%. ing. Blood filling due to left atrial contraction is thought to increase in hypertensive patients. This is because hypertensive patients tend to have a relatively higher heart rate than young adults in their 20s and 30s. As the heart rate increases, the time for passive blood filling decreases. The flow rate in the last phase of this filling period is considered to be an important factor in determining diastolic blood pressure due to left ventricular filling due to left atrial contraction, and this factor fluctuates due to sympathetic nerve stimulation. This variation is influenced by the secretion of the neurotransmitters noradrenaline and adrenaline, which binds to the β1 receptor on the myocardial cell membrane, and adrenaline also acts on the myocardial β1 receptor. Adrenaline and noradrenaline, called catecholamines, activate β1 receptors, causing increased heart rate and increased contractility.
次に、式(10)中のdQ/dtを代数方程式に変換するために、血流量の変動を捉える図式解法としてのローレンツプロット法の利用について説明する。心電図を用いて心室周期の任意の時相を限定して、任意の時相に相当する時系列波形の振幅変動を、ローレンツプロット法により隣り合う振幅変動a1,a2のプロット群を作図する。振幅a1,a2の集合体から最小二乗法により傾きtanθ(以下、場合により、この傾きtanθを「Fractal Angle(FA)」と呼ぶ)を求める。この傾きtanθの時間変動を時系列波形で表し、時系列波形の周波数解析結果を両対数表示して、周波数とPSDに関する傾きを求める。具体的には、計測時間幅は前述の360秒間とし、30秒間の傾きを求め、30秒間の90%ラップ、すなわち3秒毎にtanθのゆらぎをプロットし、tanθの変動時系列波形を求める。tanθの変動時系列波形を周波数解析し、両対数表示図からLF帯域の傾き(この傾きを「Fractal Slope(FS)」と呼ぶ)を求める。このLF帯域の傾きFSが「+」の値を取るか、「−」の値を取るかで、β1受容体の活性化の有無を判定できる。「+」の値を取る場合は周期成分が強く強い制御が行われている状態で、「−」の値を取る場合は、フラクタル・ブラウン運動で1/fのゆらぎとなり、正常被験者が安静状態の定常状態において恒常性維持機能を発現している状態を示す。 Next, in order to convert dQ / dt in the equation (10) into an algebraic equation, the use of the Lorenz plot method as a schematic solution method for capturing fluctuations in blood flow will be described. By limiting an arbitrary time phase of the ventricular cycle using an electrocardiogram, plotting groups of adjacent amplitude fluctuations a1 and a2 are drawn by the Lorentz plot method for the amplitude fluctuation of the time series waveform corresponding to the arbitrary time phase. The slope tan θ (hereinafter, in some cases, this slope tan θ is referred to as “Fractal Angle (FA)”) is obtained from the aggregate of amplitudes a1 and a2 by the method of least squares. The time variation of this slope tan θ is represented by a time-series waveform, and the frequency analysis result of the time-series waveform is displayed in both logarithms to obtain the slope with respect to frequency and PSD. Specifically, the measurement time width is set to 360 seconds as described above, the slope for 30 seconds is obtained, 90% lap for 30 seconds, that is, the fluctuation of tan θ is plotted every 3 seconds, and the fluctuation time series waveform of tan θ is obtained. The fluctuation time-series waveform of tan θ is frequency-analyzed, and the slope of the LF band (this slope is called “Fractal Slope (FS)”) is obtained from the log-log display diagram. Whether or not the β1 receptor is activated can be determined depending on whether the slope FS of this LF band takes a value of “+” or a value of “−”. When the value of "+" is taken, the periodic component is strong and strong control is performed, and when the value of "-" is taken, the fluctuation is 1 / f due to fractal Brownian motion, and the normal subject is in a resting state. It shows a state in which the homeostatic function is expressed in the steady state of.
以上より、左心血流変動の全体の傾きは、VLF〜LF帯域に現れ、また、交感神経活動が亢進した場合の全体の傾きと様相の異なる傾きもこれらの帯域に現れる。そして、交感神経活動が亢進した場合に発現する傾きは、「+」と「−」の傾きがあり、特に「+」の値を示す場合は心筋β1受容体に作用して心拍数は周波数成分に、血圧についてはFSに、周期性をもたらし、ゆらぎは線形化する。自律神経支配と体液性支配の二重支配構造をもつ心拍数(HR)制御は、心電図のRRIの時系列波形の周波数解析結果のPSD−Hzの両対数表示図から求められる。この心電図RRIの周波数解析によるゆらぎには、β1受容体の活性化による心筋の収縮力の増加による血流量の変動から生じるゆらぎ成分は含まれていない。心筋の収縮力変動による血流変動は、後負荷の心室の拡張圧の変動からも影響を受ける。したがって心室の拡張圧の変動は、血流変動のゆらぎと相関する。 From the above, the overall inclination of the left heart blood flow fluctuation appears in the VLF to LF bands, and the inclination different in appearance from the overall inclination when the sympathetic nerve activity is enhanced also appears in these bands. The slope that appears when sympathetic nerve activity is enhanced has a slope of "+" and "-". In particular, when the value of "+" is shown, it acts on the myocardial β1 receptor and the heart rate is a frequency component. In addition, blood pressure brings periodicity to the FS, and fluctuations are linearized. Heart rate (HR) control, which has a dual control structure of autonomic nerve control and humoral control, is obtained from the PSD-Hz log-log display diagram of the frequency analysis result of the time series waveform of the RRI of the electrocardiogram. The fluctuation by frequency analysis of this electrocardiogram RRI does not include the fluctuation component caused by the fluctuation of blood flow due to the increase in the contractile force of the myocardium due to the activation of β1 receptor. Fluctuations in blood flow due to fluctuations in myocardial contractility are also affected by fluctuations in afterload ventricular diastolic pressure. Therefore, fluctuations in ventricular diastolic pressure correlate with fluctuations in blood flow fluctuations.
心房収縮力は、静脈還流による血圧変動を超える圧力を生み出し、心室拡張圧、さらに心室拡張圧と平衡状態にある大動脈の拡張圧を超える時に、僧房弁閉鎖となる。僧房弁閉鎖直前の血流量変動のゆらぎと平均上腕拡張期血圧および平均上腕収縮期血圧に関する代数方程式を、FS(±LF)をパラメータにして表すと、
Δ(h1−h2)=l/gA・Q(±LF)/Tm=l/gA・Ffs(±LF)・・・(15)
となる。
Atrial contractile force produces pressure that exceeds blood pressure fluctuations due to venous return, resulting in mitral valve closure when the pressure exceeds the ventricular diastolic pressure and the diastolic pressure of the aorta in equilibrium with the ventricular diastolic pressure. The algebraic equations for fluctuations in blood flow immediately before mitral valve closure, mean brachial diastolic blood pressure, and mean brachial systolic blood pressure are expressed using FS (± LF) as parameters.
Δ (h1-h2) = l / gA · Q (± LF) / Tm = l / gA · F fs (± LF) ... (15)
Will be.
したがって、 拡張期血圧(D.B.P)は、
H(D.B.P)=Δ(h1−h2)+H0=l/gA・Q・Ffs(±LF)+H0・・・(16)
となる。
Therefore, diastolic blood pressure (DBP) is
H (DBP) = Δ (h1-h2) + H0 = l / gA · Q · F fs (± LF) + H0 ... (16)
Will be.
ここに、H0はFSが0のときなので、安静状態では、高血圧と正常域血圧の境界の値となる。これは、正常被験者は、安静状態では、1/fゆらぎは−1となるためである。一方高血圧患者は、拡張期血圧が高値にあるため高心拍数、高心収縮力と相関関係にある正の傾きをもつLF値を用いることになる。 Here, since H0 is when FS is 0, it is a value at the boundary between hypertension and normal blood pressure in the resting state. This is because a normal subject has a 1 / f fluctuation of -1 in a resting state. On the other hand, hypertensive patients use an LF value having a positive slope that correlates with high heart rate and high myocardial contractility because diastolic blood pressure is high.
上記の考え方を心室収縮期に適応させると収縮期血圧の推定が可能になる。約0.35秒の心室収縮期は等容性収縮期とそれより長い心室拍出期で構成される。図24(b)に示すように、等容性収縮期に左室圧が上昇し、大動脈圧を上回ると、大動脈弁が開き、左室から大動脈への血液の駆出が始まる。左室から拍出される血流は末梢の血管に流れ去る血流より大きなエネルギー量をもつため、弾性血管を拡張させ、一時的に留まることにより、動脈圧が上昇し、収縮期血圧に達することになる。そして動脈圧は左室圧を上回るが、慣性力により左室から大動脈への血液の流れは続く。血管の弾性の低下は血管拡張によるエネルギー損失が少なくし、末梢血管からの反射波により収縮期血圧をより高くする。そして急速拍出期の時間も短くなることから、収縮期血圧を高くする。そのため、高血圧者のII音は、大動脈弁閉鎖の時間短縮効果による水撃作用との合わせ技でI音よりも振幅が大きくなる可能性が示唆される。ここで式(9)を、心室収縮期の時相に合わせた式に変換する。 Applying the above idea to systolic systole makes it possible to estimate systolic blood pressure. The ventricular systole of about 0.35 seconds consists of an isotropic systole and a longer ventricular systole. As shown in FIG. 24 (b), when the left ventricular pressure rises during isotonic systole and exceeds the aortic pressure, the aortic valve opens and blood begins to be ejected from the left ventricle into the aorta. Since the blood flow pumped from the left ventricle has a larger amount of energy than the blood flow flowing away to the peripheral blood vessels, the arterial pressure rises and reaches systolic blood pressure by dilating the elastic blood vessels and temporarily staying there. It will be. The arterial pressure then exceeds the left ventricular pressure, but the inertial force continues the flow of blood from the left ventricle to the aorta. Decreased vascular elasticity reduces energy loss due to vasodilation and increases systolic blood pressure due to reflected waves from peripheral blood vessels. And since the time of the rapid pumping period is shortened, the systolic blood pressure is increased. Therefore, it is suggested that the second sound of a hypertensive person may have a larger amplitude than the I sound in combination with the water hammer action due to the effect of shortening the time of aortic valve closure. Here, equation (9) is converted into an equation that matches the time phase of the ventricular systole.
前負荷h1がh3となり、時相は心房収縮から心室収縮にかわる。後負荷h2はh4となる。Δh4が心室の収縮能を示し、収縮期血圧に関係するパラメータとなる。時相は、心電図R波の終わり近くから等容性収縮期の時間帯となる。dQ/dtは等容性収縮期の心臓の収縮性の指標としてよく用いられるdP/dtmaxと相関し、初期駆出血流変動は左室収縮期圧変動と相関する。動脈の収縮期血圧は、心拍変動と等容性収縮期の心室収縮能と良く相関し、ここでもLFをパラメータにした式が成立する。 The preload h1 becomes h3, and the time phase changes from atrial contraction to ventricular contraction. The afterload h2 becomes h4. Δh4 indicates the contractility of the ventricle and is a parameter related to systolic blood pressure. The time phase is the time zone of isotropic systole from near the end of the electrocardiogram R wave. dQ / dt correlates with dP / dt max, which is often used as an indicator of cardiac systole during isotonic systole, and initial ejection blood flow variability correlates with left ventricular systolic pressure variability. Arterial systolic blood pressure correlates well with heart rate variability and isotonic systolic ventricular contractility, and again the equation with LF as a parameter holds.
したがって、 収縮期血圧(S.B.P)は、FSを因子とした関数Ffsを含む式で表され、
H(S.B.P)=Δh4+H0=l/gA・Q・Ffs(±LF)+H0・・・(17)
となる。
Therefore, systolic blood pressure (SBP) is expressed by an equation including the function Ffs with FS as a factor.
H (SBP) = Δh4 + H0 = l / gA · Q · F fs (± LF) + H0 ... (17)
Will be.
本発明は、人の背部から採取される生体信号を解析し、心室充満期から等容性収縮期の血流変動によって生じる生体内の振動(生体内振動)を捉え、さらにこの生体内振動の様子を示す指標のゆらぎの様子(ゆらぎに関する指標(ゆらぎ指標))を捉える構成である。このゆらぎ指標は、上記のように人の状態、特に、血圧に関する情報と関連性がある。よって、本発明によれば、乗物のシート、事務用や家具用などの各種椅子、あるいは、ベッドなどの寝具等に取り付けられた、非拘束で生体信号を測定できる生体信号測定装置に、人が着席あるいは仰臥して背部を当該生体信号測定装置に当接するだけで、容易に血圧の推定、特に、正常域血圧(拡張期血圧が90mmHg未満、収縮期血圧が140mmHg未満)を示す領域に含まれるか高血圧を示す領域に含まれるかの推定を行うことができる。また、カフを用いる血圧測定では、1回測定後、次の測定までに再度上腕を圧迫しなければならず、その間数分程度を要し、連続的な血圧測定を行うことは困難であったが、本発明によれば、非拘束であるため、背部から次々に捉えられる生体信号を用いて、連続的(ここでいう「連続的」には、カフを用いる場合よりも短い間隔で間欠的に測定する場合も含む)に血圧を推定することができる。 The present invention analyzes biological signals collected from the back of a person, captures in-vivo vibrations (in-vivo vibrations) caused by blood flow fluctuations from the ventricular filling period to the isotonic systole, and further, the in-vivo vibrations. It is a structure that captures the state of fluctuation of the index showing the state (index related to fluctuation (fluctuation index)). This fluctuation index is related to information on a person's condition, especially blood pressure, as described above. Therefore, according to the present invention, a person can use a biological signal measuring device that can measure biological signals without restraint, which is attached to a vehicle seat, various chairs for office or furniture, or bedding such as a bed. It is included in the region that easily estimates blood pressure, especially normal blood pressure (diastolic blood pressure is less than 90 mmHg, systolic blood pressure is less than 140 mmHg) by simply sitting or lying down and touching the back to the biological signal measuring device. It is possible to estimate whether it is included in the region showing hypertension. In addition, in blood pressure measurement using a cuff, after one measurement, the upper arm must be pressed again before the next measurement, which takes about several minutes during that time, and it is difficult to perform continuous blood pressure measurement. However, according to the present invention, since it is unconstrained, it uses biometric signals that are captured one after another from the back, and is continuous (“continuous” here is intermittent at shorter intervals than when a cuff is used. Blood pressure can be estimated (including the case of measuring in).
以下、図面に示した本発明の実施形態に基づき、本発明をさらに詳細に説明する。本発明においては人の背部の体表面を伝播する生体信号(背部体表脈波)を用いる。この背部体表脈波は、上記のように、心房や心室の収縮期や拡張期において心房や心室内の血液の流れによる各弁や心筋内壁に衝突する際の振動、大動脈を流れる際に血管壁を押圧することによって生じる振動(音として伝わる振動を含む)が体表面に伝達されたものである。従って、背部体表脈波には、本発明においてターゲットとする心室充満期における生体内の振動、すなわち心室充満期から等容性収縮期の血流変動によって生じる生体内の振動(生体内振動)の情報が含まれる。 Hereinafter, the present invention will be described in more detail based on the embodiments of the present invention shown in the drawings. In the present invention, a biological signal (back body surface pulse wave) propagating on the body surface of the back of a person is used. As described above, this dorsal body surface pulse wave is a vibration when colliding with each valve or myocardial inner wall due to blood flow in the atrium or ventricle during systole or diastole of the atrium or ventricle, and a blood vessel when flowing through the aorta. The vibration generated by pressing the wall (including the vibration transmitted as sound) is transmitted to the body surface. Therefore, the back body surface pulse wave includes the vibration in the living body during the ventricular filling period, which is the target in the present invention, that is, the vibration in the living body caused by the blood flow fluctuation from the ventricular filling period to the isotonic systole (in vivo vibration). Information is included.
背部体表脈波を採取するための生体信号測定装置は、好ましくは、(株)デルタツーリング製の居眠り運転警告装置(スリープバスター(登録商標))で使用されている生体信号測定装置1を用いる。図1は生体信号測定装置1の概略構成を示したものである。この生体信号測定装置1は、図示しない電気的な配線等に加え、生体信号検出部10を有してなり、該生体信号検出部10が、測定用の椅子、ベッド、あるいは、乗物の運転席のシート等に組み込んで使用することができ、腕、手、指等を拘束することなく生体信号を採取できる。
As the biological signal measuring device for collecting the back body surface pulse wave, the biological
生体信号検出部10は、図1(a),(b)に示したように、それぞれ所定の幅及び長さを有する略長方形の第一層部材11、第二層部材12及び第三層部材13が積層された三層構造で構成されている。第一層部材11は、三次元立体編物等からなり、生体信号の検出対象である人体側に位置させて用いられ、人体の背部の体表面を介しての生体信号は第一層部材11にまず伝播される。第二層部材12は、第一層部材11から伝播される微弱な背部体表脈波を共鳴現象又はうなり現象によって強調させる共鳴層として機能し、ビーズ発泡体等からなるベース部材121、固有振動子の機能を果たす三次元立体編物122、膜振動を生じるフィルム123を有して構成される。ベース部材121の中心を挟んだ対称位置に、2つの配置孔121a,121aが形成され、この配置孔121a,121aに固有振動子の機能を果たす三次元立体編物122、122が配置されている。フィルム123,123は、この固有振動子の機能を果たす三次元立体編物122,122の各露出面を覆うように、第二層部材12の両面に積層される。そして、一方の三次元立体編物122とフィルム123との間に背部体表脈波による振動(音)を検出するマイクロフォンセンサ14が配設されている。なお、微弱な振動(音)である背部体表脈波を検出できるものであればマイクロフォンセンサ14に限定されず他のセンサを用いてもよい。また、必要に応じて、2つの三次元立体編物122,122のそれぞれに対応してセンサを配置することもできる。第三層部材13は、第二層部材12を介して第一層部材11の反対側に積層され、外部からの振動入力を低減する。第三層部材13は、好ましくは100Hzを超える高周波の外部振動を除振する機能を有する。第三層部材13としては、このようなフィルタリング機能を果たすために、第一層部材11と同様に三次元立体編物を用いることが好ましい。
As shown in FIGS. 1A and 1B, the biological
なお、三次元立体編物は、グランド編地の編目密度、グランド糸の太さや素材、連結糸の配設密度、連結糸の太さや素材などを調整することにより、必要な除振性能をもたせることができる。また、第一層部材11として用いた三次元立体編物、第二層部材12の固有振動子として用いた三次元立体編物122のいずれよりも、連結糸の配設密度を高くした三次元立体編物を第三層部材13として用いることにより、所定以上の高周波振動を伝わり難くしている。
The three-dimensional three-dimensional knitted fabric should have the required vibration isolation performance by adjusting the stitch density of the ground knitted fabric, the thickness and material of the ground yarn, the arrangement density of the connecting yarn, the thickness and material of the connecting yarn, and the like. Can be done. Further, a three-dimensional three-dimensional knit having a higher arrangement density of connecting threads than either the three-dimensional three-dimensional knit used as the
生体信号検出部10は、上記のように第一層部材11、第二層部材12及び第三層部材13を備えてなるが、背部の体表面を介して伝播される生体信号、特に、左心室の拡張、左心室の収縮に伴う大動脈への血液の流出による生体内の振動情報を含む背部体表脈波を検出するため、上記の椅子、ベッド等において、鎖骨に対応する高さから剣状突起に対応する高さまでの範囲に対応するに設けられることが好ましい。これは、本発明者が生体信号検出部10の取り付け位置を種々変化させた中で、この範囲における検出感度が高かったことに基づくものである。但し、「心臓血液駆出に伴う胸部インピーダンス変化検出による電気的インピーダンス心拍出量計測用至適スポット電極配置」、生体医工学、46巻6号(2008年12月)という研究報告によれば、心拍出量(cardiac output(co))を電気的インピーダンス法を用いて計測するに当たって、電極を胸部前面に配置する場合、鎖骨から剣状突起に対応する範囲では、心房及び心室間の血液量変化の影響が大きく、動脈の血液量変化を捉えるには不十分で、鎖骨レベル、剣状突起レベルに電極を配置することが望ましいとする一方で、電極を背部に配置した場合には、鎖骨対応部位と剣状突起対応部位間では、一方から他方にずらしていくにしたがって、動脈の血液量が一定の率で変化していくと共に、心房及び心室間の血液量も一定の率で変化していくことをデータとして示している。このことは、背部においては、鎖骨対応部位と剣状突起対応部位間に生体信号検出部10を当接すると、特に、左心室の拡張期における血液量の変化と、左心室が収縮して大動脈が駆出する際の大動脈における血液量の変化の両方を感度良く捉えることができることを示す間接的な裏付けとも言える。
The biological
次に、本実施形態の血圧推定装置100の構成について図2に基づいて説明する。血圧推定装置100は、生体信号処理手段200を有して構成される。血圧推定装置100は、コンピュータ(パーソナルコンピュータ、機器に組み込まれるマイクロコンピュータ等も含む)から構成され、生体信号処理手段200として機能する生体信号処理手順を実行させるコンピュータプログラムが記憶部(当該コンピュータ(生体信号測定装置100)の内蔵のハードディスク等の記録媒体のほか、リムーバブルの各種記録媒体、通信手段で接続された他のコンピュータの記録媒体等も含む)に記憶されている。また、生体信号処理手段200として機能するコンピュータプログラムは、フィルタリング手段210、血流変動指標算出手段220、ゆらぎ指標算出手段230、推定手段240として機能し、フィルタリング手順、血流変動指標算出手順、ゆらぎ指標算出手順、推定手順をコンピュータに実行させる。また、フィルタリング手順、血流変動指標算出手順、ゆらぎ指標算出手順、推定手順を実現するコンピュータプログラムが組み込まれた1以上の記憶回路を有する電子回路で実現することもできる。
Next, the configuration of the blood
また、コンピュータプログラムは、記録媒体に記憶させて提供することができる。コンピュータプログラムを記憶した記録媒体は、非一過性の記録媒体であっても良い。非一過性の記録媒体は特に限定されないが、例えば フレキシブルディスク、ハードディスク、CD−ROM、MO(光磁気ディスク)、DVD−ROM、メモリカードなどの記録媒体が挙げられる。また、通信回線を通じてコンピュータプログラムをコンピュータに伝送してインストールすることも可能である。 Further, the computer program can be stored in a recording medium and provided. The recording medium that stores the computer program may be a non-transient recording medium. Non-transient recording media are not particularly limited, and examples thereof include recording media such as flexible disks, hard disks, CD-ROMs, MOs (magneto-optical disks), DVD-ROMs, and memory cards. It is also possible to transmit a computer program to a computer through a communication line and install it.
フィルタリング手段210は、生体信号測定装置1の生体信号検出部10に組み込まれたセンサ14から得られる生体信号の時系列波形(搬送波に生体情報がのり、生体信号検出部10の第二層部材12において共鳴現象等により強調された波形(以下、「センサ波形」))をフィルタリングする。フィルタリング手段210は、例えば、中心周波数20Hz近傍のバンドパスフィルタ、好ましくは、10〜30Hzの周波数帯域のバンドパスフィルタをかける手段であり、より好ましくは、高周波成分を除くため、これにさらに50Hzと35Hzのノッチフィルタをかける手段を有しており、これらのフィルタリングにより、センサ波形が、10〜30Hzのフィルタ処理波形(図3(c)の波形(以下、「RCW」という)に変換される。心拍数は約1〜1.5Hz前後が標準的な範囲であるが、RCWは、図3(c)に示したように、約1秒周期で相対的に大きな全振幅の波形成分が出現していることが捉えられていることから、心周期が顕在化される。この点は、図3(a)の心電図の波形、図3(b)の心音図の波形と比較して明らかである。しかしながら、RCWには、心周期のリズムだけでなく、血流変動に伴う生体内の振動(音)のエネルギーが含まれている。
The filtering means 210 is a
血流変動指標算出手段220は、RCW中、心室充満期から等容性収縮期における時系列波形の範囲の波形成分を用いて、心室充満期から等容性収縮期における血流変動に起因して生体内で生じる振動に関する指標を求める手段である。血流変動指標算出手段220は、図2に示したように、散布図作成手段(散布図作成回路)221と、散布図傾き算出手段(散布図傾き算出回路)222とを有している。 The blood flow fluctuation index calculation means 220 uses waveform components in the range of the time-series waveform from the ventricular filling period to the isotonic systole during RCW, and is caused by the blood flow fluctuation during the ventricular filling period to the isotropic systole. It is a means to obtain an index related to vibration generated in a living body. As shown in FIG. 2, the blood flow fluctuation index calculating means 220 includes a scatter plot creating means (scatter plot creating circuit) 221 and a scatter plot tilt calculating means (scatter plot tilt calculating circuit) 222.
散布図作成手段221は、RCWから上記の波形成分を2つ特定すると共に、この2つの波形成分の各全振幅(an(i),an(i+1))を用いて散布図を作成する。心室充満期の心房収縮は、房室弁閉鎖前の約0.2秒間(例えば、安静時の人の平均的な1心周期が0.9秒程度(心拍数67回)の場合で約0.17秒間)である。RCW中、この間の波形成分を用いる。房室弁の閉鎖は、図3(a)に示した心電図の波形のR波の直後であり、それを境として心房収縮から等容性収縮期に移行するため、心電図のR波のタイミングを基準とした波形成分を選択する。図4は、図3(a)〜(c)における約101秒〜約101.8秒の範囲の拡大図である。図4に示したように、まず、心電図のR波の直前に位置する房室弁閉鎖の直前の極点Bn(0)を求める。次に、極点Bn(0)の一つ前に位置する極点をBn(1)とし、Bn(1)を基準として、その直前の波形成分の下側極点から上側極点までの縦軸に沿った振幅(すなわち全振幅(p−p))を「an(1)」とし、その直後の波形成分の全振幅を「an(2)」とする。ここで特定した全振幅:an(1),an(2)の波形成分はR波の直前0.1秒以内の範囲であり、この2つの波形成分の各全振幅は、心房収縮の際の血流変動を反映している。
Scatter
一方、R波の直後の極点、すなわち、極点Bn(0)の直後に位置する極点をBn(2)とし、極点Bn(2)を基準として、その直前の波形成分の全振幅を「an(2)」とし、その直後の全振幅を「an(3)」とする。これらは、心電図のR波を挟んだ直前及び直後の波形成分であり、心室充満期から等容性収縮期に移行する際の血流変動を反映している。 On the other hand, the pole point immediately after the R wave, that is, the pole point located immediately after the pole point B n (0) is defined as B n (2), and the total amplitude of the waveform component immediately before the pole point B n (2) is taken as a reference. and "a n (2)", the total amplitude immediately thereafter as "a n (3)." These are the waveform components immediately before and after the R wave of the electrocardiogram, and reflect the fluctuation of blood flow during the transition from the ventricular filling period to the isotropic systole.
次に、散布図作成手段221は、このようにして求めた隣接する2つの波形成分の各全振幅(an(i),an(i+1))の値を、一方の値を縦軸に、他方の値を横軸にとった座標系にプロットし、散布図(ローレンツプロット図)を作成する(図5参照)。この散布図にプロットされた点が、2つの波形成分の各全振幅の比を示す。
Next, scatter
ローレンツプロット法を用いることにより、Δtの間に流れる血液の変化量を求めることができる。すなわち、心房の収縮能により、血液に運動エネルギーが与えられ、この血流の振動系は増幅する自由振動になる。自由振動系は、一般的に粘性減衰と固体摩擦の二つの減衰が作用するが、ローレンツプロット法を用いて、不規則なゆらぎを見せる血流量の中で規則性を見出すことができる。 By using the Lorentz plot method, the amount of change in blood flowing during Δt can be determined. That is, kinetic energy is given to blood by the contractile ability of the atrium, and the vibration system of this blood flow becomes free vibration that is amplified. In a free vibration system, two dampings, viscous damping and solid friction, generally act, but the Lorentz plot method can be used to find regularity in the blood flow that shows irregular fluctuations.
上記のように、散布図を作成するための2つの波形成分を特定するためには、房室弁閉鎖直前の心電図波形に出現するR波を特定する必要がある。本実施形態では、図2に示したように、心電計300からの心電図波形データを血圧推定装置100で受信し、その情報を血流変動指標算出手段220の散布図作成手段221で上記のように用いるようになっている。なお、心電計300としては、R波のタイミングを特定できるものであればその種類は全く限定されるものではない。よって、本実施形態では、被験者の背部に生体信号測定装置1の生体信号検出部10を配置すると共に、心電計300の電極を被験者の胸部に装着してデータを採取する。
As described above, in order to specify the two waveform components for creating the scatter plot, it is necessary to specify the R wave appearing in the electrocardiogram waveform immediately before the atrioventricular valve is closed. In the present embodiment, as shown in FIG. 2, the electrocardiogram waveform data from the
図5(a)は、上記のようにして求めた心房収縮の際の血流変動を反映する2つの波形成分の各全振幅an(1)、an(2)をプロットした散布図(ローレンツプロット図)であり、図5(b)は、R波の出現直後である心室充満期から等容性収縮期に移行する際の血流変動を反映する2つの波形成分の各全振幅an(2)、an(3)をプロットした散布図である。いずれも、RCWの30秒間のデータを一つの座標系にプロットしたものである(例えば心拍数約60回/分の場合で約30点プロットされる)。散布図作成手段221は、このような散布図をRCWについて時系列に求めていくが、その際、RCWの時間幅を例えば90%ラップで重ねてスライドさせて求めていく。これにより、本例では全振幅の比を示す散布図が3秒間隔で作成されることになる。なお、この時間幅やスライド計算のラップ率はあくまで一例であり、これに限定されるものではない。但し、設定する時間幅が長すぎたり、ラップ率が低すぎたりすると、心房収縮の状態の把握精度が低下するため、時間幅は、10〜60秒程度の範囲とし、ラップ率は、70〜95%程度の範囲とすることが好ましい。 5 (a) is the full amplitude a n (1) of the two waveform components reflecting blood flow variation during atrial contraction obtained as described above, scatter diagram plotting the a n (2) ( Lorenz plot), FIG. 5 (b) is the total amplitude a of each of the two waveform components reflecting blood flow fluctuations during the transition from ventricular fullness to isotonic systole immediately after the appearance of the R wave. n (2), a scatter diagram plotting the a n (3). In each case, the RCW 30-second data is plotted in one coordinate system (for example, about 30 points are plotted when the heart rate is about 60 beats / minute). The scatter plot creating means 221 obtains such a scatter plot for RCW in chronological order, and at that time, the time width of RCW is obtained by, for example, overlapping with 90% lap and sliding. As a result, in this example, a scatter plot showing the ratio of all amplitudes is created at 3-second intervals. The time width and the lap rate of the slide calculation are merely examples, and are not limited to this. However, if the set time width is too long or the lap rate is too low, the accuracy of grasping the state of atrial contraction will decrease. Therefore, the time width should be in the range of about 10 to 60 seconds, and the lap rate should be 70 to 70 to 60 seconds. The range is preferably about 95%.
散布図傾き算出手段222は、散布図にプロットされた点群について、最小二乗法により回帰直線Aを引き、さらにその回帰直線Aの傾きを求める。なお、この傾きは、横軸又は縦軸に対する傾きをそのまま用いることもできるが、図6(b)に示したように、任意の基準線(総時間プロット基準線)に対する傾き(総時間プロット基準線と30秒間の回帰直線Aとの間の角度)を、散布図傾き算出手段222から出力される傾き(θi)とすることが好ましい。また、回帰直線Aの傾きtanθはθ(度)に近似していると見なして差し支えないため本実施形態では、θ(度)のゆらぎの時系列波形を計算に用いる。 The scatter plot inclination calculation means 222 draws a regression line A by the least squares method for the point cloud plotted on the scatter diagram, and further obtains the slope of the regression line A. The slope with respect to the horizontal axis or the vertical axis can be used as it is, but as shown in FIG. 6B, the slope with respect to an arbitrary reference line (total time plot reference line) (total time plot reference). The angle between the line and the regression line A for 30 seconds) is preferably the slope (θi) output from the scatter plot slope calculation means 222. Further, since the slope tan θ of the regression line A can be regarded as being close to θ (degrees), in the present embodiment, the time-series waveform of the fluctuation of θ (degrees) is used for the calculation.
総時間プロット基準線は、RCWについて、上記の各散布図を作成する時間幅よりも数倍以上長い時間(例えば計測総時間)について全振幅比を求め、その長い時間に関する散布図に引いた線である。具体的には、図6(a)に示したように、例えば計測総時間360秒間のデータの中で、ボックスカウンティング法により出現回数の少ないデータ(例えば20%以下)は棄却し、全振幅の小さい波形のプロットが集まっている点(プロット群の下端)を起点として、プロットの重心を通る絶対最大長の線を総時間プロット基準線とする。プロットの重心は、X座標(an(i+1))、Y座標(an(i))の平均値である。 The total time plot reference line is the line drawn on the scatter plot for the RCW after obtaining the total amplitude ratio for a time several times longer than the time width for creating each of the above scatter plots (for example, total measurement time). Is. Specifically, as shown in FIG. 6A, for example, among the data having a total measurement time of 360 seconds, the data having a small number of appearances (for example, 20% or less) is rejected by the box counting method, and the total amplitude is calculated. Starting from the point where the plots of small waveforms are gathered (the lower end of the plot group), the absolute maximum length line passing through the center of gravity of the plot is used as the total time plot reference line. The center of gravity of the plot, X-coordinate (a n (i + 1) ), the average value of the Y coordinate (a n (i)).
ゆらぎ指標算出手段230は、血流変動指標算出手段220の散布図傾き算出手段222により求められた生体内で生じる振動に関する指標(血流変動指標)の時系列波形を求めると共に、その時系列波形のゆらぎに関する指標を求める手段である。ゆらぎ指標算出手段230は、図2に示したように、ゆらぎ解析手段231とゆらぎ解析図傾き算出手段232とを有している。 The fluctuation index calculation means 230 obtains the time-series waveform of the index (blood flow fluctuation index) related to the vibration generated in the living body obtained by the scatter plot inclination calculation means 222 of the blood flow fluctuation index calculation means 220, and also obtains the time-series waveform of the time-series waveform. It is a means to find an index related to fluctuations. As shown in FIG. 2, the fluctuation index calculation means 230 has a fluctuation analysis means 231 and a fluctuation analysis diagram inclination calculation means 232.
ゆらぎ解析手段231は、まず、散布図傾き算出手段222により求められた点群の回帰直線の傾き(θi)の値(血流変動指標)を時系列にプロットする。上記の例では、点群の回帰直線の傾き(θi)の値(血流変動指標)が3秒間隔で求められるため、図7(a)に示したように、当該回帰直線の傾き(θi)の値を3秒間隔でプロットし、図7(b)に示した時系列波形を改めて構成する。なお、図7(b)では、回帰直線の傾き(θi)のそのままの値をプロットした時系列波形(全体の平均値をゼロ点にして引き直した時系列波形でもよい)を「θi時系列波形」とし、「θi時系列波形」に0.08Hzのローパスフィルターをかけた時系列波形を「LPF処理波形」として示している。上記の例の場合、3秒に1回のプロットになるため、0.08Hzを超える高周波成分は信頼性が低いと考えられる。この点群の回帰直線の傾き(θi)の値(血流変動指標)の時系列波形は、ある状態から次の状態へと移り変わることに対応するためのゆらぎがある。そこで、ゆらぎ解析手段231は、血流変動指標の時系列波形について周波数解析(FFT)を行って、パワースペクトル密度と周波数の両対数グラフに、周波数解析結果を表示する。なお、周波数解析の対象とする回帰直線の傾き(θi)の値(血流変動指標)の時系列波形は、図7(b)における「θi時系列波形」よりも「LPF処理波形」を用いることが好ましい。この周波数解析により、ゆらぎを支配する周波数がいずれであるかがわかる(図7(c)参照)。本明細書では、この周波数解析の結果を「ゆらぎ解析図」と称する。 The fluctuation analysis means 231 first plots the value (blood flow fluctuation index) of the slope (θi) of the regression line of the point cloud obtained by the scatter plot slope calculation means 222 in time series. In the above example, since the value (blood flow fluctuation index) of the slope (θi) of the regression line of the point group is obtained at intervals of 3 seconds, as shown in FIG. 7 (a), the slope of the regression line (θi). ) Are plotted at 3-second intervals, and the time-series waveform shown in FIG. 7B is reconstructed. In FIG. 7B, the time-series waveform (which may be a time-series waveform obtained by redrawing the entire average value as a zero point) obtained by plotting the value of the slope of the regression line (θi) as it is is referred to as “θi time series”. The time-series waveform obtained by applying a 0.08 Hz low-pass filter to the “θi time-series waveform” is shown as the “LPF-processed waveform”. In the case of the above example, since the plot is performed once every 3 seconds, the high frequency component exceeding 0.08 Hz is considered to be unreliable. The time-series waveform of the slope (θi) value (blood flow fluctuation index) of the regression line of this point group has fluctuations corresponding to the transition from one state to the next. Therefore, the fluctuation analysis means 231 performs frequency analysis (FFT) on the time-series waveform of the blood flow fluctuation index, and displays the frequency analysis result on a log-log graph of power spectral density and frequency. As the time-series waveform of the slope (θi) value (blood flow fluctuation index) of the regression line to be analyzed for frequency analysis, the “LPF-processed waveform” is used rather than the “θi time-series waveform” in FIG. 7 (b). Is preferable. By this frequency analysis, it is possible to know which frequency controls the fluctuation (see FIG. 7 (c)). In the present specification, the result of this frequency analysis is referred to as a “fluctuation analysis diagram”.
ゆらぎ解析図傾き算出手段232は、ゆらぎ解析手段231で得られたゆらぎ解析図の回帰直線Bを求めると共に、このゆらぎ解析図の回帰直線Bの傾き(本願では、このゆらぎ解析図の回帰直線Bの傾きを「フラクタルスロープ(FS)」と称する)を算出する。ゆらぎ解析図の回帰直線Bは、本実施形態では、図7(c)に示したように、パワースペクトル密度の対数が周波数の対数に全体的には反比例するため、パワースペクトル密度の対数目盛りを縦軸に周波数の対数目盛りを横軸にとると右肩下がりになる。例えば、45度で右肩下がりのゆらぎ解析図の回帰直線Bの傾き(フラクタルスロープ)は「−1(すなわち1/fゆらぎの傾き)」で示すことができる。 The fluctuation analysis diagram inclination calculation means 232 obtains the regression line B of the fluctuation analysis diagram obtained by the fluctuation analysis means 231 and the slope of the regression line B of this fluctuation analysis diagram (in the present application, the regression line B of this fluctuation analysis diagram). The slope of is referred to as "fractal slope (FS)"). In the present embodiment, the logarithm line B of the fluctuation analysis diagram has a logarithm scale of the power spectral density because the logarithm of the power spectral density is inversely proportional to the logarithm of the frequency as shown in FIG. 7 (c). If the logarithmic scale of frequency is taken on the vertical axis and the horizontal axis is taken, the scale becomes downward to the right. For example, the slope (fractal slope) of the regression line B in the fluctuation analysis diagram that descends to the right at 45 degrees can be indicated by "-1 (that is, the slope of 1 / f fluctuation)".
上記のように、左心血流変動の全体の傾きは、VLFからLF帯域に現れ、特に交感神経活動が亢進した場合は全体の傾きと様相の異なる傾きがこれらの帯域に現れ、また、これらの帯域の傾きが「+」の値を取るか、「−」の値を取るかで、高血圧患者に特有のβ1受容体の活性化の有無を判定できる。さらに、0.003〜0.08Hz付近が血圧調節ホルモン(レニン・アンジオテンシン・アルドステロン系)の働きを反映する周波数帯であり、Mayer波と呼ばれる0.1Hzの振動(交感神経性血管収縮神経の興奮レベルの周期的振動)も血圧に影響を及ぼしている。これらのことを勘案すると、ゆらぎ指標であるゆらぎ解析図の回帰直線Bの傾き(フラクタルスロープ)は、VLF帯域(超低周波帯域:0.0033〜0.04Hz)からLF帯域(低周波帯域:0.04〜0.15Hz)において設定される所定の周波数帯で求めることが好ましい。所定の周波数帯は、本実施形態の場合、上記のように血流変動指標の時系列波形を作成する際に0.08Hzでローパスフィルターをかけているため、まず上限値は0.08Hz付近に設定することが好ましい。一方、下限値は、0.01Hz以下の情報には血流量の変動情報が顕著には含まれていないことから、0.01〜0.04Hzの間で設定することが好ましい。例えば、心拍数が早くなることにより血圧が低下傾向となる場合があり、その際には、血流量変動のゆらぎが低周波側に現れる傾向となる場合もある。よって、所定の周波数帯は、例えば、0.03〜0.08Hzと一律に設定することも可能であるが、血圧を推定する被験者毎に設定することが好ましい。
血圧を推定する被験者毎に設定する方法として、本実施形態では次の方法を用いた。すなわち、後述するように、血圧の推定に当たっては、被験者のゆらぎ指標であるフラクタルスロープ(FS)を、血圧推定用相関データに照合して行われる。よって、上腕血圧値とフラクタルスロープ(FS)とを対応させて血圧推定用相関データ(血圧推定用相関式)を予め求めて記憶部に設定しておく必要がある。従って、この血圧推定相関データの作成には、各被験者のゆらぎ解析図毎に、被験者の心拍数等を考慮して個別に、フラクタルスロープ(FS)を求めるための適切な周波数帯が設定されている。そこで、これらのゆらぎ解析図を教師データとして用い、これから血圧を推定する被験者のゆらぎ解析図を各教師データに照合し、一致度の高い教師データを抽出し、その教師データに用いられている周波数帯を、これから血圧を推定する被験者のゆらぎ解析図において用い、フラクタルスロープ(FS)を算出することができる。このような手法を用いることで、血圧推定用相関データを作成した後は、所定の周波数帯を被験者毎に自動で設定することができる。なお、新たに求められたデータは、新たな教師データとして蓄積し、その新たな教師データも含めて血圧推定用相関データ(血圧推定用相関式)を改めて求める、というステップを繰り返すことで、血圧の推定精度を高めていくことができる。
As described above, the overall slope of the left cardiac blood flow fluctuation appears in the VLF to LF bands, and especially when the sympathetic nerve activity is enhanced, a slope different from the overall slope appears in these bands, and these Whether or not the β1 receptor is activated, which is peculiar to hypertensive patients, can be determined depending on whether the slope of the band takes a value of “+” or a value of “−”. Furthermore, around 0.003 to 0.08 Hz is a frequency band that reflects the action of blood pressure regulating hormones (renin, angiotensin, aldosterone system), and 0.1 Hz vibration called Mayer wave (excitation of sympathetic vasoconstrictor nerve). Level periodic vibrations) also affect blood pressure. Taking these things into consideration, the slope (fractal slope) of the regression line B in the fluctuation analysis diagram, which is a fluctuation index, is from the VLF band (very low frequency band: 0.0033 to 0.04 Hz) to the LF band (low frequency band:). It is preferable to obtain it in a predetermined frequency band set in (0.04 to 0.15 Hz). In the case of the present embodiment, the predetermined frequency band is first subjected to a low-pass filter at 0.08 Hz when creating the time-series waveform of the blood flow fluctuation index as described above, so that the upper limit value is first set to around 0.08 Hz. It is preferable to set it. On the other hand, the lower limit value is preferably set between 0.01 and 0.04 Hz because the information of 0.01 Hz or less does not significantly include the fluctuation information of blood flow rate. For example, blood pressure may tend to decrease as the heart rate increases, and in that case, fluctuations in blood flow may tend to appear on the low frequency side. Therefore, although the predetermined frequency band can be uniformly set to, for example, 0.03 to 0.08 Hz, it is preferable to set it for each subject whose blood pressure is estimated.
In this embodiment, the following method is used as a method for setting the blood pressure for each subject. That is, as will be described later, in estimating blood pressure, the fractal slope (FS), which is a fluctuation index of the subject, is collated with the correlation data for blood pressure estimation. Therefore, it is necessary to obtain the correlation data for blood pressure estimation (correlation formula for blood pressure estimation) in advance by associating the upper arm blood pressure value with the fractal slope (FS) and set it in the storage unit. Therefore, in creating this blood pressure estimation correlation data, an appropriate frequency band for obtaining the fractal slope (FS) is individually set for each subject's fluctuation analysis diagram in consideration of the subject's heart rate and the like. There is. Therefore, these fluctuation analysis diagrams are used as teacher data, the fluctuation analysis diagram of the subject whose blood pressure is estimated from this is collated with each teacher data, teacher data with a high degree of agreement is extracted, and the frequency used in the teacher data is used. The band can be used in the fluctuation analysis diagram of the subject whose blood pressure is estimated from this, and the fractal slope (FS) can be calculated. By using such a method, after the correlation data for blood pressure estimation is created, a predetermined frequency band can be automatically set for each subject. The newly obtained data is accumulated as new teacher data, and the blood pressure estimation correlation data (blood pressure estimation correlation formula) including the new teacher data is repeatedly obtained by repeating the step. It is possible to improve the estimation accuracy of.
ゆらぎ解析図傾き算出手段232により出力されるゆらぎ指標としてのフラクタルスロープ(FS)は、後述する推定手段240において血圧の推定に用いられるが、そのためには予め、血圧とフラクタルスロープ(FS)との相関データ(血圧推定用相関データ)を作成しておく必要がある。従って、本実施形態において生体信号処理手段200は、ゆらぎ解析図傾き算出手段232により出力されるゆらぎ指標としてのフラクタルスロープを用いて、血圧推定用相関データを作成する相関データ作成手段260を有している(図2)。この相関データ作成手段260では、次のような手順が実行されて相関データを作成し、記憶部に記憶させる。 Fluctuation analysis diagram The fractal slope (FS) as a fluctuation index output by the slope calculation means 232 is used for estimating blood pressure in the estimation means 240 described later, but for that purpose, the blood pressure and the fractal slope (FS) are combined in advance. It is necessary to create correlation data (correlation data for blood pressure estimation). Therefore, in the present embodiment, the biological signal processing means 200 has the correlation data creating means 260 for creating the correlation data for blood pressure estimation by using the fractal slope as the fluctuation index output by the fluctuation analysis diagram inclination calculating means 232. (Fig. 2). In the correlation data creating means 260, the following procedure is executed to create the correlation data and store it in the storage unit.
なお、血圧推定用相関データを作成する場合、散布図傾き算出手段222により求められた点群の回帰直線の傾き(θi)の値(血流変動指標)として、拡張期血圧の推定には、心房収縮の際の血流変動を反映する2つの波形成分の各全振幅an(1)、an(2)をプロットした散布図から得られるものを採用し、収縮期血圧の推定には、房室弁閉鎖の直前及び直後の心室充満期から等容性収縮期に移行する際の血流変動を反映する2つの波形成分の各全振幅an(2)、an(3)をプロットした散布図から得られるものを採用する。 When creating the correlation data for blood pressure estimation, the value of the slope (θi) of the regression line of the point group obtained by the scatter plot tilt calculation means 222 (blood pressure fluctuation index) is used to estimate the diastolic blood pressure. each full amplitude a n of the two waveform components reflecting blood flow variation during atrial contraction (1), adopted those obtained from scatter diagram plotting the a n (2), the estimation of the systolic blood pressure each full amplitude a n (2) of the two waveform components to reflect blood flow change when shifting the isovolumic contraction phase immediately before and from the ventricular filling phase of the immediately following atrioventricular valve closure, a n a (3) Use the one obtained from the plotted scatter plot.
そして、図8に示したように、ゆらぎ指標算出手段230により回帰直線Bの傾き(フラクタルスロープ(FS))を算出したならば(S1101)、相関データ作成手段260がこの情報を受け取る(S1103)。また、ほぼ同じタイミングで血圧計により測定した被験者の上腕血圧のデータ(S1102)も受信する(S1103)。なお、上腕血圧の測定方法は限定されるものではなく、上腕にカフを巻き付けるタイプの血圧計(上腕式血圧計)によって測定してもよいし、手首式血圧計等により測定してもよいことはもちろんである。このようにして、血圧推定用相関データ(血圧/fractal slope MAP)が作成され(S1104)、このデータが記憶部に記憶される。後述する図16あるいは図17が血圧推定用相関データの例であり、図16及び図17ともに、横軸にLF帯域の回帰直線Bの傾き(フラクタルスロープ(FS))をとり、縦軸に上腕血圧データをとり、拡張期血圧推定用相関データと収縮期血圧推定用相関データをそれぞれ示す二本の相関線(相関式)がそれぞれ求められている。 Then, as shown in FIG. 8, if the slope of the regression line B (fractal slope (FS)) is calculated by the fluctuation index calculating means 230 (S1101), the correlation data creating means 260 receives this information (S1103). .. In addition, the upper arm blood pressure data (S1102) of the subject measured by the sphygmomanometer at almost the same timing is also received (S1103). The method for measuring the upper arm blood pressure is not limited, and the blood pressure may be measured by a sphygmomanometer of the type in which a cuff is wrapped around the upper arm (brachial sphygmomanometer) or a wrist type sphygmomanometer. Of course. In this way, the correlation data for blood pressure estimation (blood pressure / fractal slope MAP) is created (S1104), and this data is stored in the storage unit. FIG. 16 or FIG. 17 described later is an example of correlation data for blood pressure estimation. In both FIGS. 16 and 17, the slope of the regression line B in the LF band (fractal slope (FS)) is taken on the horizontal axis, and the upper arm is shown on the vertical axis. Taking blood pressure data, two correlation lines (correlation formulas) showing correlation data for diastolic blood pressure estimation and correlation data for systolic blood pressure estimation are obtained respectively.
推定手段240は、ゆらぎ解析図傾き算出手段232により求められたフラクタルスロープの値をゆらぎ指標として用い、血圧の推定を行う。すなわち、評価対象者のフラクタルスロープ(FS)の値を、記憶部に記憶された上記の血圧推定用相関データに照合して血圧を推定する(図2参照)。例えば、an(1)(図中及び以下においては単に「a1」と表記)及びan(2)(図中及び以下においては単に「a2」と表記)を用いて求めたゆらぎ指標であるフラクタルスロープ(FS)が「−0.2」と出力された場合、図16では、y=19.039x+84.361の式に代入され、約81mmHgと求められ、図17を用いた場合には、y=20.414x+85.043の式に代入され、約81mmHgと推定される。また、a2及びan(3)(図中及び以下においては単に「a3」と表記)を用いて求めたゆらぎ指標であるフラクタルスロープ(FS)が「−1」と出力された場合、図16では、y=19.813x+142.5の式に代入され、約123mmHgと推定され、図17に照らすと、y=19.006x+141.93の式に代入され、約123mmHgと推定される。a1及びa2を用いたフラクタルスロープ(FS)、並びに、a2及びa3を用いたフラクタルスロープ(FS)のいずれも、本実施形態によれば、次々に求めることができるため、被験者の血圧を、非拘束でありながら連続的に推定することができる。 The estimation means 240 estimates the blood pressure by using the value of the fractal slope obtained by the fluctuation analysis diagram inclination calculation means 232 as a fluctuation index. That is, the blood pressure is estimated by collating the value of the fractal slope (FS) of the evaluation target person with the above-mentioned correlation data for blood pressure estimation stored in the storage unit (see FIG. 2). For example, is the fluctuation index obtained using (simply referred to as "a2" is in the drawing and the following) (simply referred to as "a1" is in the drawing and the following) and a n (2) a n ( 1) When the fractal slope (FS) is output as "-0.2", it is substituted into the equation of y = 19.039x + 84.361 in FIG. 16, and it is obtained to be about 81 mmHg. When FIG. 17 is used, it is obtained. Substituted in the equation y = 20.414x + 85.043, it is estimated to be about 81 mmHg. Moreover, a2 and a n (3) If the fractal slope is fluctuation index obtained by using the (simply referred to as "a3" is in the drawing and the following) (FS) is output as "-1", 16 Then, it is substituted into the formula of y = 19.813x + 142.5 and estimated to be about 123 mmHg, and in light of FIG. 17, it is substituted into the formula of y = 19.006x + 141.93 and estimated to be about 123 mmHg. Since both the fractal slope (FS) using a1 and a2 and the fractal slope (FS) using a2 and a3 can be obtained one after another according to the present embodiment, the blood pressure of the subject is not set. Although it is a constraint, it can be estimated continuously.
ここで、図9〜図15を用いて図16及び図17に示した血圧推定用相関データの作成過程を説明する。まず、図9〜図13は、代表的な被験者20人(被験者(Sub.)No.01〜20)の背部体表脈波をフィルタリング手段210によりフィルタリングした後、血流量変動指標算出手段220の散布図作成手段221によって作成した散布図(ローレンツプロット図)を示している。なお、これらの被験者から採油した背部体表脈波は安静状態のものである。これらは、いずれも、a1及びa2を用いて求めた点(図の凡例中、「a1a2」と表記)とa2及びa3を用いて求めた点(図の凡例中、「a2a3」と表記)の両方がプロットされている。また、「a1a2」点、「a2a3」点の各点群について、散布図傾き算出手段222によって求めた回帰直線A(それぞれ、「a1a2近似線」、「a2a3近似線」)が示されている。そして、散布図傾き算出手段222は、これらa1a2近似線及びa2a3近似線の傾き(θ1)を求める。 Here, the process of creating the correlation data for blood pressure estimation shown in FIGS. 16 and 17 will be described with reference to FIGS. 9 to 15. First, FIGS. 9 to 13 show the back body surface pulse waves of 20 representative subjects (subjects (Sub.) No. 01 to 20) filtered by the filtering means 210, and then the blood flow rate fluctuation index calculating means 220. A scatter plot (Lorentz plot diagram) created by the scatter plot creating means 221 is shown. The back body surface pulse waves collected from these subjects are in a resting state. All of these are points obtained using a1 and a2 (denoted as "a1a2" in the legend of the figure) and points obtained using a2 and a3 (denoted as "a2a3" in the legend of the figure). Both are plotted. Further, for each point cloud of the "a1a2" point and the "a2a3" point, a regression line A ("a1a2 approximate line" and "a2a3 approximate line", respectively) obtained by the scatter plot inclination calculation means 222 is shown. Then, the scatter plot inclination calculation means 222 obtains the inclination (θ1) of these a1a2 approximate lines and the a2a3 approximate lines.
なお、図9〜図15の分析に当たっては、日本高血圧学会の高血圧ガイドライン(2014年)の血圧分類に基づいて、安静状態における各被験者の上腕血圧値から、次のように血圧の種類を分類した。まず、収縮期血圧140mmHg以上かつ/又は拡張期血圧90mmHg以上の場合に「高血圧」と分類し、「高血圧」の条件未満の場合に「正常域血圧」と分類した。また、「正常域血圧」について、収縮期血圧130〜139mmHgかつ/又は拡張期血圧:85〜89mmHgの場合を「正常高値血圧」とし、収縮期血圧120〜129mmHgかつ/又は拡張期血圧:80〜84mmHgの場合を「正常血圧」とし、収縮期血圧120mmHg未満かつ拡張期血圧80mmHg未満の場合を「至適血圧」とした。「低血圧」については上記ガイドラインにおいて規定がないため、世界保健機関(WHO)に規定されている収縮期血圧100mmHg以下、拡張期血圧60mmHg以下の基準を採用した。
In the analysis of FIGS. 9 to 15, the types of blood pressure were classified as follows from the brachial blood pressure values of each subject in the resting state based on the blood pressure classification of the hypertension guideline (2014) of the Japanese Society of Hypertension. .. First, when the systolic blood pressure was 140 mmHg or more and / or the diastolic blood pressure was 90 mmHg or more, it was classified as "hypertension", and when it was less than the condition of "hypertension", it was classified as "normal blood pressure". Regarding "normal blood pressure", the case of
次に、ゆらぎ指標算出手段230のゆらぎ解析手段231が、散布図傾き算出手段222により求めたa1a2近似線及びa2a3近似線の各傾き(θ1)の時系列波形を求め(図7(b)参照)、周波数解析(FFT)を行って、パワースペクトル密度と周波数の両対数グラフからなるゆらぎ解析図を求める(図7(c)参照)。ゆらぎ解析図傾き算出手段232は、上記のようにVLFからLF帯域において、各被験者の心拍数等を参照して所定の周波数帯を設定し、ゆらぎ解析図の回帰直線Bの傾きであるフラクタルスロープ(FS)を求める。 Next, the fluctuation analysis means 231 of the fluctuation index calculation means 230 obtains the time-series waveforms of the slopes (θ1) of the a1a2 approximation line and the a2a3 approximation line obtained by the scatter plot inclination calculation means 222 (see FIG. 7B). ), Frequency analysis (FFT) is performed to obtain a fluctuation analysis diagram consisting of a log-log graph of power spectrum density and frequency (see FIG. 7 (c)). The fluctuation analysis diagram inclination calculation means 232 sets a predetermined frequency band in the VLF to LF band with reference to the heart rate of each subject as described above, and the fractal slope which is the inclination of the regression line B of the fluctuation analysis diagram. (FS) is calculated.
次に、相関データ作成手段260により、拡張期血圧に対応するa1a2に関しては図14に示したようなフラクタルスロープ(FS)が得られ、収縮期血圧に対応するa2a3に関しては図15に示したようなフラクタルスロープが得られる。図14及び図15中、中央列(「(2)」で表示した列)が上記のゆらぎ解析図に相当し、そこにおける所定の周波数帯のフラクタルスロープ(FS)を求めている。なお、図14及び図15中、左列(「(1)」で表示した列)は散布図(ローレンツプロット図)を示し、右列(「(3)」で表示した列は、心電計300から得られた心拍数の時系列波形のゆらぎを解析したスペクトルである。心拍数の時系列波形のゆらぎを解析したスペクトルのフラクタルスロープは血圧との有意な相関は見られなかった。
(2)の中央列を見ると、例えば、正常高値血圧の範囲に分類される血圧を示す被験者No.05は、図14のa1a2に基づいたものは「−0.05」のフラクタルスロープ(FS)が得られ、図15のa2a3に基づいたものは、「−0.78」のフラクタルスロープ(FS)が得られた。この際の被験者No.05の上腕血圧は、拡張期血圧が83、収縮期血圧が133であった。そして、図16において、a1a2に関するフラクタルスロープ(FS)の値「−0.05」に、拡張期血圧83を対応させてプロットし、a2a3に関するフラクタルスロープ(FS)の値「−0.78」に、収縮期血圧133を対応させてプロットする。
Next, the correlation data creating means 260 obtained a fractal slope (FS) as shown in FIG. 14 for a1a2 corresponding to diastolic blood pressure, and as shown in FIG. 15 for a2a3 corresponding to systolic blood pressure. Fractal slope can be obtained. In FIGS. 14 and 15, the central column (the column indicated by “(2)”) corresponds to the above fluctuation analysis diagram, and the fractal slope (FS) of a predetermined frequency band there is obtained. In FIGS. 14 and 15, the left column (the column displayed by "(1)") shows a scatter diagram (Lorentz plot diagram), and the right column (the column displayed by "(3)" is an electrocardiograph. It is the spectrum which analyzed the fluctuation of the time-series waveform of the heart rate obtained from 300. The scatter slope of the spectrum which analyzed the fluctuation of the time-series waveform of the heart rate did not show a significant correlation with blood pressure.
Looking at the central column of (2), for example, the subject No. indicating blood pressure classified in the range of normal high blood pressure. In 05, the fractal slope (FS) of "-0.05" was obtained for the one based on a1a2 of FIG. 14, and the fractal slope (FS) of "-0.78" was obtained for the one based on a2a3 of FIG. was gotten. Subject No. at this time. The brachial blood pressure of 05 was 83 for diastolic blood pressure and 133 for systolic blood pressure. Then, in FIG. 16, the
同様に、至適血圧の範囲に分類される血圧を示す被験者No.11は、図14のa1a2に基づいたものは「−0.53」のフラクタルスロープ(FS)が得られ、図15のa2a3に基づいたものは、「−1.30」のフラクタルスロープ(FS)が得られた。この際の被験者No.11の上腕血圧は、拡張期血圧が65、収縮期血圧が108であった。そして、図16において、a1a2に関するフラクタルスロープ(FS)の値「−0.53」に、拡張期血圧65を対応させてプロットし、a2a3に関するフラクタルスロープ(FS)の値「−1.30」に、収縮期血圧108を対応させてプロットする。
さらに、高血圧の範囲に分類される血圧を示す被験者No.01は、図14のa1a2に基づいたものは「+1.81」のフラクタルスロープ(FS)が得られ、図15のa2a3に基づいたものは、「+0.54」のフラクタルスロープ(FS)が得られた。この際の被験者No.01の上腕血圧は、拡張期血圧が116、収縮期血圧が164であった。そして、図16において、a1a2に関するフラクタルスロープ(FS)の値「+1.81」に、拡張期血圧116を対応させてプロットし、a2a3に関するフラクタルスロープ(FS)の値「+0.54」に、収縮期血圧164を対応させてプロットする。
Similarly, the subject No. indicating the blood pressure classified in the optimum blood pressure range. No. 11 obtained a fractal slope (FS) of "-0.53" based on a1a2 of FIG. 14, and a fractal slope (FS) of "-1.30" based on a2a3 of FIG. was gotten. Subject No. at this time. As for the brachial blood pressure of 11, the diastolic blood pressure was 65 and the systolic blood pressure was 108. Then, in FIG. 16, the
Furthermore, the subject No. indicating the blood pressure classified in the range of hypertension. For 01, the fractal slope (FS) of "+1.81" was obtained for the one based on a1a2 of FIG. 14, and the fractal slope (FS) of "+0.54" was obtained for the one based on a2a3 of FIG. Was done. Subject No. at this time. The brachial blood pressure of 01 was 116 for diastolic blood pressure and 164 for systolic blood pressure. Then, in FIG. 16, the
その他の被験者についても同様の処理を行い、図16にプロットしていく。このようにしてプロットしていくと、高血圧に分類される被験者のフラクタルスロープ(FS)の値はa1a2及びa2a3のいずれに関してもほぼ0以上となり、正常域血圧(正常高値血圧、正常血圧、至適血圧、低血圧)の被験者のフラクタルスロープ(FS)の値はa1a2及びa2a3のいずれに関してもほぼ0以下となった。そして、図16にプロットされたa1a2に基づいた点群に引いた回帰直線はy=19.039x+84.361となり、決定係数は0.7511で高い相関性が示された。また、フラクタルスロープ(FS)値が「0」のときのy切片の値が「84.361」であり、拡張期血圧の高血圧と正常域血圧との境界である90mmHgに近い値であると共に、正常高値血圧と正常血圧との境界である85mmHgとほぼ同じ値であった。この回帰直線が最終的に求める拡張期血圧推定用相関データとなる。 The same processing is performed for the other subjects, and the plots are made in FIG. When plotted in this way, the fractal slope (FS) value of the subjects classified as hypertension is almost 0 or more for both a1a2 and a2a3, and the normal blood pressure (normal high blood pressure, normal blood pressure, optimal). The fractal slope (FS) value of the subjects (blood pressure, hypotension) was almost 0 or less for both a1a2 and a2a3. Then, the regression line drawn on the point cloud based on a1a2 plotted in FIG. 16 was y = 19.039x + 84.361, and the coefficient of determination was 0.7511, showing a high correlation. Further, when the fractal slope (FS) value is "0", the value of the y-intercept is "84.361", which is close to 90 mmHg, which is the boundary between the hypertension of the diastolic blood pressure and the normal blood pressure, and also. It was almost the same value as 85 mmHg, which is the boundary between normal hypertension and normal blood pressure. This regression line becomes the correlation data for estimating diastolic blood pressure that is finally obtained.
一方、a2a3に基づいた点群に引いた回帰直線はy=19.882x+142.47となり、決定係数は0.9101で高い相関性が示された。また、フラクタルスロープ(FS)値が「0」のときのy切片の値が「142.47」であり、収縮期血圧の高血圧と正常域血圧との境界である140mmHgに近い値であった。この回帰直線が最終的に求める収縮期血圧推定用相関データとなる。なお、図16にプロットされたデータは、a1a2に関しては被験者25名分の192データであり、a2a3に関しては被験者34名分の146データである。 On the other hand, the regression line drawn to the point group based on a2a3 was y = 19.882x + 142.47, and the coefficient of determination was 0.9101, showing a high correlation. The value of the y-intercept when the fractal slope (FS) value was "0" was "142.47", which was close to 140 mmHg, which is the boundary between the hypertension of systolic blood pressure and the normal blood pressure. This regression line becomes the correlation data for estimating systolic blood pressure that is finally obtained. The data plotted in FIG. 16 is 192 data for 25 subjects for a1a2 and 146 data for 34 subjects for a2a3.
図17は、図16にプロットしたデータのうち、複数回計測を行った被験者のa1a2及びa2a3に関する各フラクタルスロープ(FS)の値の平均値、上腕血圧計により測定された拡張期血圧の平均値と収縮期血圧の平均値を用いて作成した血圧推定用相関データである。a1a2を用いた拡張期血圧推定用相関データの回帰直線はy=20.414x+85.043であり、その決定係数は0.9246であった。a2a3を用いた収縮期血圧推定用相関データの回帰直線はy=19.222x+142.08であり、その決定係数は0.9615であった。いずれも、図16で求めた回帰直線よりも相関性が高くなっており、血圧推定用相関データの作成に当たっては、被験者の複数の測定値の平均値を用いることが好ましい。 FIG. 17 shows the average value of each fractal slope (FS) for a1a2 and a2a3 of the subjects who measured a plurality of times among the data plotted in FIG. 16, and the average value of the diastolic blood pressure measured by the upper arm sphygmomanometer. It is the correlation data for blood pressure estimation created by using the average value of the systolic blood pressure. The regression line of the correlation data for diastolic blood pressure estimation using a1a2 was y = 20.414x + 85.043, and its coefficient of determination was 0.9246. The regression line of the correlation data for systolic blood pressure estimation using a2a3 was y = 19.222x + 142.08, and its coefficient of determination was 0.9615. All of them have a higher correlation than the regression line obtained in FIG. 16, and it is preferable to use the average value of a plurality of measured values of the subjects when creating the correlation data for blood pressure estimation.
ここで、図18(a)は、図18(b)との比較のために、図16の血圧推定用相関データを再掲したものである。図18(b)は、図18(a)とは逆に、a1a2に基づくフラクタルスロープ(FS)の値に対して、上腕血圧計により測定した収縮期血圧を対応させてプロットし、a2a3に基づくフラクタルスロープ(FS)の値に対して、上腕血圧計により測定した拡張期血圧を対応させてプロットした各点群を示したものである。図18(b)では、a1a2に基づくフラクタルスロープ(FS)の値に収縮期血圧を対比させた点群の回帰直線が、y=22.499x+131.34、決定係数が0.5244と、図18(a)と比較して相関性が大きく劣っていた。また、a2a3に基づくフラクタルスロープ(FS)の値に拡張期血圧を対比させた点群の回帰直線が、y=13.272x+90.037、決定係数が0.7309であった。決定係数の値が若干低くなっていると共に、y切片が90を若干上回っていた。また、図18(a)では収縮期血圧と拡張期血圧の各回帰直線の傾きがほぼ同じであるのに対し、図18(b)の手法では、収縮期血圧と拡張期血圧の各回帰直線の傾きが大きく異なっていることがわかる。換言すれば、図18(b)の手法の場合、収縮期血圧と拡張期血圧との差がほとんどないデータ構成が存在することになり、両者を明確に区別して推定するための相関データとしての信頼性が乏しいことがわかる。よって、本実施形態のように、拡張期血圧推定用にはa1a2に基づくフラクタルスロープ(FS)の値を用い、収縮期血圧推定用にはa2a3に基づくフラクタルスロープ(FS)の値を用いることが適切である。 Here, FIG. 18A is a reprint of the correlation data for blood pressure estimation of FIG. 16 for comparison with FIG. 18B. In FIG. 18 (b), contrary to FIG. 18 (a), the systolic blood pressure measured by the brachial sphygmomanometer is plotted in association with the value of the fractal slope (FS) based on a1a2, and is based on a2a3. Each point group plotted by associating the diastolic blood pressure measured by the brachial sphygmomanometer with the value of the fractal slope (FS) is shown. In FIG. 18B, the regression line of the point cloud in which the systolic blood pressure is compared with the value of the fractal slope (FS) based on a1a2 is y = 22.499x + 131.34, and the coefficient of determination is 0.5244. The correlation was significantly inferior to that of (a). The regression line of the point group in which the diastolic blood pressure was compared with the value of the fractal slope (FS) based on a2a3 was y = 13.272x + 90.307, and the coefficient of determination was 0.7309. The value of the coefficient of determination was slightly lower, and the y-intercept was slightly higher than 90. Further, in FIG. 18 (a), the slopes of the systolic blood pressure and the diastolic blood pressure return lines are almost the same, whereas in the method of FIG. 18 (b), the systolic blood pressure and the diastolic blood pressure return lines are almost the same. It can be seen that the slopes of are significantly different. In other words, in the case of the method of FIG. 18B, there is a data structure in which there is almost no difference between systolic blood pressure and diastolic blood pressure, and as correlation data for clearly distinguishing and estimating the two. It turns out that the reliability is poor. Therefore, as in the present embodiment, the value of the fractal slope (FS) based on a1a2 may be used for estimating the diastolic blood pressure, and the value of the fractal slope (FS) based on a2a3 may be used for estimating the systolic blood pressure. Appropriate.
次に、図19及び図20のフローチャートに基づき、血圧の推定過程を具体的に説明する。まず、血圧を推定する対象となる人(血圧推定対象者)は、背部体表脈波を検出する生体信号検出装置1の生体信号検出部10が上記のように背部に設けられた測定用の椅子等に着席する。また、血圧推定対象者には心電計300の電極を胸部に装着し、心電図波形データが血圧推定装置100に送信されるように設定する。
Next, the blood pressure estimation process will be specifically described with reference to the flowcharts of FIGS. 19 and 20. First, the person whose blood pressure is to be estimated (the person whose blood pressure is to be estimated) is for measurement in which the biological
測定が開始されると、血圧推定装置100は、血圧推定対象者の背部体表脈波(センサ波形)を生体信号測定装置1により受信する(S1901)。すると、血圧推定装置100におけるフィルタリング手段210が、受信したセンサ波形をフィルタリングし(S1902)、RCWを求める(S1903)。次に、血流量変動指標算出手段220の散布図作成手段221は、図4に示したように、心電計300から得た心電図波形データにおいてR波のタイミングを特定し(S1904)、それに基づいて上記の各全振幅a1,a2,a3を求める(S1905)。次に、散布図作成手段221は、a1及びa2を用いた散布図(ローレンツプロット)、a2及びa3を用いた散布図(ローレンツプロット)を作成する(S1906,S1907)。次に、散布図傾き算出手段222により、各散布図の回帰直線の傾きθiを求め、ゆらぎ指標算出手段230のゆらぎ解析手段231がθiの時系列波形を拡張期用、収縮期用のそれぞれについて作成する(S1908)。次に、ゆらぎ解析手段231は、周波数解析(スペクトル解析)を行い(S1909)、θi時系列波形のスペクトルであるゆらぎ解析図を拡張期用、収縮期用のそれぞれについて作成する(S1910)。
When the measurement is started, the blood
次に、ゆらぎ解析図傾き算出手段232が、S1910で求めた血圧推定対象者の拡張期用、収縮期用の各ゆらぎ解析図(スペクトル)を、記憶部のデータベースにアクセスし(図2参照)、ゆらぎ解析図(スペクトル)の教師データに照合する(S1911)。各教師データは、上記のように、被験者毎に応じて適切な回帰直線Bの傾き(フラクタルスロープ)を求めるために、VLFからLFに属する範囲でそれぞれの特性に合わせた所定の周波数帯が設定されている。そこで、S1911では、血圧推定対象者のS1910で求めたゆらぎ解析図(拡張期用、収縮期用)を、各教師データに設定された周波数帯の範囲において照合し、正規化相互相関関数を用いて一致度の高い教師データを抽出する。次に、ゆらぎ解析図傾き算出手段232が、抽出された教師データに設定されている周波数帯を、S1910で求めた血圧推定対象者のゆらぎ解析図(拡張期用、収縮期用)に適用し(S2001)、その範囲における回帰直線Bの傾きをフラクタルスロープ(FS)として求める(S2002、S2003)。図21は、その一例を示しており、図21(b)が血圧推定対象者のゆらぎ解析図(スペクトル)である。図21(a)が教師データの一例であり、太線がこの教師データの回帰直線Bを示し、この教師データの回帰直線Bを引いた周波数帯と同じ周波数帯においてゆらぎ解析図(スペクトル)の一致度が比較される。教師データに設定された周波数帯は、上記のように教師データ毎に異なるため、この一致度を全ての教師データについて比較し、一致度の高い教師データに設定された周波数帯と同じ周波数帯を図21(b)の血圧推定対象者のゆらぎ解析図に設定し、その周波数帯について回帰直線Bを引いてその傾きをフラクタルスロープとして求める。
なお、上記の教師データとの一致度の比較法はあくまで一例であり、一致度を比較するに当たって、例えば、VLFからLFに属するゆらぎ解析図(スペクトル)の全体について一致度を判定し、それによって一致度が高いと判定された教師データに設定された周波数帯を血圧推定対象者のゆらぎ解析図に利用するようにすることもできる。
Next, the fluctuation analysis diagram tilt calculation means 232 accesses the database of the storage unit for each fluctuation analysis diagram (spectrum) for the diastole and systole of the blood pressure estimation target obtained in S1910 (see FIG. 2). , Collate with the teacher data of the fluctuation analysis diagram (spectrum) (S1911). As described above, each teacher data is set with a predetermined frequency band according to each characteristic in the range belonging to VLF to LF in order to obtain an appropriate slope (fractal slope) of the regression line B for each subject. Has been done. Therefore, in S1911, the fluctuation analysis charts (for diastole and systole) obtained in S1910 of the blood pressure estimation subject are collated in the range of the frequency band set in each teacher data, and the normalized cross-correlation function is used. Extract teacher data with a high degree of agreement. Next, the fluctuation analysis diagram inclination calculation means 232 applies the frequency band set in the extracted teacher data to the fluctuation analysis diagram (for diastole and systole) of the blood pressure estimation target obtained in S1910. (S2001), the slope of the regression line B in that range is obtained as a fractal slope (FS) (S2002, S2003). FIG. 21 shows an example thereof, and FIG. 21 (b) is a fluctuation analysis diagram (spectrum) of the blood pressure estimation subject. FIG. 21 (a) is an example of the teacher data, the thick line shows the regression line B of the teacher data, and the fluctuation analysis diagram (spectrum) matches in the same frequency band as the frequency band where the regression line B of the teacher data is drawn. The degrees are compared. Since the frequency band set for the teacher data is different for each teacher data as described above, this matching degree is compared for all the teacher data, and the same frequency band as the frequency band set for the teacher data having a high degree of matching is selected. Set in the fluctuation analysis diagram of the blood pressure estimation target person in FIG. 21 (b), draw a regression line B for the frequency band, and obtain the slope as a fractal slope.
The method of comparing the degree of agreement with the teacher data described above is just an example, and in comparing the degree of agreement, for example, the degree of agreement is determined for the entire fluctuation analysis diagram (spectrum) belonging to VLF to LF, thereby determining the degree of agreement. It is also possible to use the frequency band set in the teacher data determined to have a high degree of agreement for the fluctuation analysis diagram of the blood pressure estimation target person.
次に、推定手段240が動作して記憶部に記憶されている図16又は図17に示された血圧推定用相関データにアクセスし(S2004)、拡張期用、収縮期用の各血圧推定用相関式に各フラクタルスロープ(FS)を代入する。これにより血圧推定対象者の拡張期血圧、収縮期血圧を求めることができる(S2005,S2006)。 Next, the estimation means 240 operates to access the correlation data for blood pressure estimation shown in FIG. 16 or FIG. 17 stored in the storage unit (S2004), and for each blood pressure estimation for diastole and systole. Substitute each fractal slope (FS) into the correlation equation. Thereby, the diastolic blood pressure and the systolic blood pressure of the blood pressure estimation target can be obtained (S2005 and S2006).
図22(a)は、図19〜図20に示したステップに従って推定した複数の血圧推定対象者(25名、49データ)の収縮期血圧と上腕血圧の実測値との比較を示した図である。図22(a)は、血圧推定用相関データとして、図16の全事例を用いて求めたものを利用して血圧を推定し、図22(b)は、血圧推定用相関データとして、図17の平均値を利用して求めたものを利用して血圧を推定したものである。いずれも、傾きが1に近いと共に、決定係数も高く、本実施形態の手法により推定される血圧が、上腕血圧と極めて高い相関を有することがわかる。 FIG. 22A is a diagram showing a comparison between the measured systolic blood pressure and the measured value of the brachial blood pressure of a plurality of blood pressure estimation subjects (25 persons, 49 data) estimated according to the steps shown in FIGS. 19 to 20. is there. FIG. 22 (a) estimates the blood pressure using the correlation data for blood pressure estimation obtained by using all the cases of FIG. 16, and FIG. 22 (b) shows the correlation data for blood pressure estimation in FIG. 17 The blood pressure was estimated using the one obtained by using the average value of. In each case, the slope is close to 1 and the coefficient of determination is high, and it can be seen that the blood pressure estimated by the method of the present embodiment has an extremely high correlation with the brachial blood pressure.
一方、図23(a),(b)は、血圧推定対象者(27名、75データ)について、教師データを参照して設定した所定の周波数帯で傾きを算出する際(図20のS2001,S2002)、その周波数帯におけるゆらぎ解析図の波形成分全体に関する回帰直線の傾き(図において単に「傾き」と表記)ではなく、図21(b)に示したように当該波形成分における図の上側のピーク点のみに対する回帰直線の傾き(図において「peak傾き」と表記)を求めて推定した収縮期血圧と上腕血圧の実測値との比較を示した図である。なお、図23(a)は、図16の全事例を用いた血圧推定用相関データを利用し、図23(b)は、図17の平均値を用いた血圧推定用相関データを利用したものである。図23(a),(b)から明らかなように、この場合の推定値は実測値との相関が極めて低かった。よって、上記のようにゆらぎ解析図における所定の周波数帯の波形成分に関し、その全体の回帰直線Bの傾きをフラクタルスロープ(FS)として採用することが好ましい。 On the other hand, FIGS. 23 (a) and 23 (b) show the slopes of the blood pressure estimation subjects (27 persons, 75 data) in the predetermined frequency band set with reference to the teacher data (S2001 in FIG. 20). S2002), not the slope of the regression line for the entire waveform component of the fluctuation analysis diagram in that frequency band (simply expressed as "slope" in the figure), but as shown in FIG. 21 (b), the upper side of the figure in the waveform component. It is a figure which showed the comparison between the measured value of the systolic blood pressure and the upper arm blood pressure estimated by obtaining the slope of the regression line (denoted as "peak slope" in the figure) with respect only to a peak point. Note that FIG. 23 (a) uses the correlation data for blood pressure estimation using all the cases of FIG. 16, and FIG. 23 (b) uses the correlation data for blood pressure estimation using the average value of FIG. Is. As is clear from FIGS. 23 (a) and 23 (b), the estimated value in this case had an extremely low correlation with the measured value. Therefore, as described above, it is preferable to adopt the slope of the entire regression line B as the fractal slope (FS) for the waveform component of the predetermined frequency band in the fluctuation analysis diagram.
本実施形態によれば、上記のように、複数人の被験者の上腕血圧とフラクタルスロープ(FS)との関係で血圧推定用相関データ(拡張期血圧推定用、収縮血圧推定用)を作成して記憶しておけば、その後は、血圧推定対象者のフラクタルスロープ(FS)を求めるだけで、この相関データに照らして、血圧を、非拘束、リアルタイムで推定でき、かつ連続的に推定することができる。 According to the present embodiment, as described above, correlation data for blood pressure estimation (for diastolic blood pressure estimation, contractile blood pressure estimation) is created in relation to the brachial blood pressure of a plurality of subjects and the fractal slope (FS). If you remember, after that, you can estimate the blood pressure unconstrained, in real time, and continuously in light of this correlation data by simply obtaining the fractal slope (FS) of the blood pressure estimation target. it can.
よって、例えば、生体信号測定装置1の生体信号検出部10をベッド、椅子の背部その他の人体支持手段に設けておけば、被験者の血圧をいつでも推定することができる。従って、被験者の血圧の急変も察知することができ、睡眠中の血圧の変動も知ることができる。もちろん、これらの推定した血圧情報は、血圧推定装置100に内蔵若しくは接続した通信手段(図示せず)により、モニタ、警告灯などの任意の表示装置にその旨を知らせたり、管理者等の端末装置に通知したりすることもできる。
Therefore, for example, if the biological
1 生体信号測定装置
10 生体信号検出部
11 コアパッド
12 スペーサパッド
14 センサ
100 血圧推定装置
200 生体信号処理手段
210 フィルタリング手段
220 血流変動指標算出手段
221 散布図作成手段
222 散布図傾き算出手段
230 ゆらぎ指標算出手段
231 ゆらぎ解析手段
232 ゆらぎ解析図傾き算出手段
240 推定手段
1 Biological
Claims (17)
前記生体信号処理手段が、
前記生体信号の時系列波形を所定の周波数帯域でフィルタリングし、心周期を顕在化させたフィルタ処理波形を得るフィルタリング手段と、
前記生体信号の測定と同時に測定した心電計から得られる心電図波形データに前記フィルタ処理波形を照合し、前記フィルタ処理波形における心室充満期から等容性収縮期における時系列波形の範囲の波形成分を特定し、心室充満期から等容性収縮期における血流変動に起因して生じる振動に関する指標を求める血流変動指標算出手段と、
前記血流変動に起因して生じる振動に関する指標の時系列波形を求め、その時系列波形の変動の仕方を示すゆらぎに関する指標を求めるゆらぎ指標算出手段と、
前記ゆらぎに関する指標を、予め記憶部に記憶された前記ゆらぎに関する指標と血圧との関係を示す血圧推定用相関データを用いて、前記人の血圧を推定する推定手段と
を有することを特徴とする血圧推定装置。 A biological signal processing means that receives the biological signal from a biological signal measuring device that abuts on the back of a person and propagates through the body surface of the back without restraint, and analyzes the received biological signal. Have and
The biometric signal processing means
A filtering means for filtering the time-series waveform of the biological signal in a predetermined frequency band to obtain a filtered waveform in which the cardiac cycle is manifested.
The filtered waveform is collated with the electrocardiogram waveform data obtained from the electrocardiograph measured at the same time as the measurement of the biological signal, and the waveform component in the range of the time-series waveform from the ventricular filling period to the isotonic systole in the filtered waveform. A blood flow fluctuation index calculation means for obtaining an index related to vibration caused by blood flow fluctuation from the ventricular filling period to the isotonic systole.
A fluctuation index calculation means for obtaining a time-series waveform of an index related to vibration caused by the blood flow fluctuation and obtaining an index related to fluctuation indicating how the time-series waveform fluctuates.
The index related to the fluctuation is characterized by having an estimation means for estimating the blood pressure of the person by using the correlation data for blood pressure estimation showing the relationship between the index related to the fluctuation and the blood pressure stored in advance in the storage unit. Blood pressure estimator.
前記血流変動に起因して生じる振動に関する指標の時系列波形を求めると共に、その時系列波形を周波数解析し、パワースペクトルと周波数の両対数グラフに周波数解析結果であるゆらぎ解析図を得るゆらぎ解析手段と、
前記ゆらぎ解析図の回帰直線の傾きを求め、前記ゆらぎ解析図の回帰直線の傾きを前記ゆらぎに関する指標とするゆらぎ解析図傾き算出手段と
を有する請求項1又は2記載の血圧推定装置。 The fluctuation index calculation means
Fluctuation analysis means for obtaining a time-series waveform of an index related to vibration caused by the blood flow fluctuation, frequency-analyzing the time-series waveform, and obtaining a fluctuation analysis diagram which is a frequency analysis result in a log-log graph of both power spectrum and frequency. When,
The blood pressure estimation device according to claim 1 or 2, further comprising a fluctuation analysis diagram inclination calculating means for obtaining the slope of the regression line of the fluctuation analysis diagram and using the inclination of the regression line of the fluctuation analysis diagram as an index related to the fluctuation.
前記ゆらぎ解析図に関する回帰直線の傾きとして、VLFからLFの範囲に属する所定の周波数帯の回帰直線の傾きを求め、その傾きを前記ゆらぎに関する指標とする手段である請求項3記載の血圧推定装置。 The fluctuation analysis diagram inclination calculation means is
The blood pressure estimation device according to claim 3, which is a means for obtaining the slope of a regression line in a predetermined frequency band belonging to the range from VLF to LF as the slope of the regression line related to the fluctuation analysis diagram and using the slope as an index related to the fluctuation. ..
前記生体信号中、前記心室充満期から等容性収縮期に対応する時系列波形の範囲において2つの波形成分を一組以上特定し、前記2つの波形成分の各全振幅を用いて散布図を作成する散布図作成手段と、
前記散布図にプロットされた点群の回帰直線の傾きを求め、前記点群の回帰直線の傾きを前記血流変動に起因して生じる振動に関する指標とする散布図傾き算出手段と
を有する請求項1〜5のいずれか1に記載の血圧推定装置。 The blood flow fluctuation index calculation means
In the biological signal, one or more sets of two waveform components are specified in the range of the time-series waveform corresponding to the ventricular filling period to the isotonic systole, and a scatter plot is drawn using each total amplitude of the two waveform components. Scatter plot creation means to create and
A claim having a scatter plot inclination calculating means for obtaining the inclination of the regression line of the point group plotted on the scatter diagram and using the inclination of the regression line of the point group as an index for vibration caused by the blood flow fluctuation. The blood pressure estimator according to any one of 1 to 5.
前記ゆらぎ指標算出手段が前記第1の散布図を用いて求めたゆらぎ指標から、前記推定手段が拡張期血圧を推定し、
前記ゆらぎ指標算出手段が前記第2の散布図を用いて求めたゆらぎ指標から、前記推定手段が収縮期血圧を推定する請求項6記載の血圧推定装置。 The scatter plot creating means is based on the first scatter plot using the total amplitude of each of the two waveform components at the time of atrioventricular systole during the ventricular filling period and the two waveform components used in the first scatter chart. It is a means for creating a second scatter plot using each total amplitude of the two waveform components corresponding to the timing near the closing of the atrioventricular valve, which is after the later timing and shifts to the isotonic systole. ,
The estimation means estimates diastolic blood pressure from the fluctuation index obtained by the fluctuation index calculation means using the first scatter plot.
The blood pressure estimation device according to claim 6, wherein the estimation means estimates systolic blood pressure from the fluctuation index obtained by the fluctuation index calculation means using the second scatter plot.
前記生体信号の時系列波形を所定の周波数帯域でフィルタリングし、心周期を顕在化させたフィルタ処理波形を得て、
前記生体信号の測定と同時に測定した心電計から得られる心電図波形データに前記フィルタ処理波形を照合し、前記フィルタ処理波形における心室充満期から等容性収縮期における時系列波形の範囲の波形成分を特定し、心室充満期から等容性収縮期における血流変動に起因して生じる振動に関する指標を求め、
前記血流変動に起因して生じる振動に関する指標の時系列波形を求めた後、その時系列波形の変動の仕方を示すゆらぎに関する指標を求め、
前記ゆらぎに関する指標を、予め記憶部に記憶された前記ゆらぎに関する指標と血圧との関係を示す血圧推定用相関データを用いて、前記人の血圧を推定することを特徴とする血圧推定方法。 The biological signal is received from a biological signal measuring device that abuts on the back of a person and captures the biological signal that propagates through the body surface of the back without restraint.
The time-series waveform of the biological signal is filtered in a predetermined frequency band to obtain a filtered waveform in which the cardiac cycle is manifested.
The filtered waveform is collated with the electrocardiogram waveform data obtained from the electrocardiograph measured at the same time as the measurement of the biological signal, and the waveform component in the range of the time-series waveform from the ventricular filling period to the isotonic systole in the filtered waveform. To find an index for vibrations caused by blood flow fluctuations from ventricular fullness to isotonic systole.
After obtaining the time-series waveform of the index related to the vibration caused by the blood flow fluctuation, the index related to the fluctuation indicating how the time-series waveform fluctuates was obtained.
A blood pressure estimation method for estimating a person's blood pressure by using the blood pressure estimation correlation data indicating the relationship between the fluctuation index and the blood pressure, which is stored in advance in a storage unit.
前記生体信号処理手順として、
前記生体信号の時系列波形を所定の周波数帯域でフィルタリングし、心周期を顕在化させたフィルタ処理波形を得る手順と、
前記生体信号の測定と同時に測定した心電計から得られる心電図波形データに前記フィルタ処理波形を照合し、前記フィルタ処理波形における心室充満期から等容性収縮期における時系列波形の範囲の波形成分を特定し、心室充満期から等容性収縮期における血流変動に起因して生じる振動に関する指標を求める手順と、
前記血流変動に起因して生じる振動に関する指標の時系列波形を求め、その時系列波形の変動の仕方を示すゆらぎに関する指標を求める手順と、
前記ゆらぎに関する指標を、予め記憶部に記憶された前記ゆらぎに関する指標と血圧との関係を示す血圧推定用相関データを用いて、前記人の血圧を推定する手順と
を前記コンピュータに実行させるコンピュータプログラム。 A biological signal processing procedure for receiving the biological signal from a biological signal measuring device that abuts on the back of a person and propagates through the body surface of the back without restraint, and analyzes the received biological signal. A computer program that runs and causes the computer to function as a blood pressure estimator.
As the biometric signal processing procedure,
A procedure for filtering the time-series waveform of the biological signal in a predetermined frequency band to obtain a filtered waveform in which the cardiac cycle is manifested, and
The filtered waveform is collated with the electrocardiogram waveform data obtained from the electrocardiograph measured at the same time as the measurement of the biological signal, and the waveform component in the range of the time-series waveform from the ventricular filling period to the isotonic systole in the filtered waveform. And the procedure for obtaining an index of vibration caused by blood flow fluctuations from the ventricular filling period to the isotonic systole.
A procedure for obtaining a time-series waveform of an index related to vibration caused by the fluctuation of blood flow, and a procedure for obtaining an index related to fluctuation indicating how the time-series waveform fluctuates.
A computer program that causes the computer to execute a procedure for estimating the blood pressure of the person by using the blood pressure estimation correlation data indicating the relationship between the fluctuation index and the blood pressure stored in the storage unit in advance. ..
前記血流変動に起因して生じる振動に関する指標の時系列波形を求めると共に、その時系列波形を周波数解析し、パワースペクトルと周波数の両対数グラフに周波数解析結果であるゆらぎ解析図を得る手順と、
前記ゆらぎ解析図の回帰直線の傾きを求め、前記ゆらぎ解析図の回帰直線の傾きを前記ゆらぎに関する指標とする手順と
を前記コンピュータに実行させる請求項11又は12記載のコンピュータプログラム。 In the procedure for obtaining the index related to the fluctuation,
A procedure for obtaining a time-series waveform of an index related to vibration caused by the blood flow fluctuation, frequency-analyzing the time-series waveform, and obtaining a fluctuation analysis diagram which is a frequency analysis result on a log-log graph of both the power spectrum and the frequency.
The computer program according to claim 11 or 12, wherein the computer executes a procedure of obtaining the slope of the regression line of the fluctuation analysis diagram and using the slope of the regression line of the fluctuation analysis diagram as an index related to the fluctuation.
前記生体信号中、前記心室充満期から等容性収縮期に対応する時系列波形の範囲において2つの波形成分を一組以上特定し、前記2つの波形成分の各全振幅を用いて散布図を作成する手順と、
前記散布図にプロットされた点群の回帰直線の傾きを求め、前記点群の回帰直線の傾きを前記血流変動に起因して生じる振動に関する指標とする手順と
を前記コンピュータに実行させる請求項11〜14のいずれか1に記載のコンピュータプログラム。 In the procedure for obtaining an index related to vibration caused by blood flow fluctuation,
In the biological signal, one or more sets of two waveform components are specified in the range of the time series waveform corresponding to the ventricular filling period to the isotonic systole, and a scatter diagram is drawn using each total amplitude of the two waveform components. Procedure to create and
A claim that causes the computer to perform a procedure of obtaining the slope of the regression line of the point cloud plotted on the scatter plot and using the slope of the regression line of the point cloud as an index for vibration caused by the blood flow fluctuation. The computer program according to any one of 11 to 14.
前記ゆらぎに関する指標を求める手順では、前記第1の散布図を用いて求めたゆらぎ指標から拡張期血圧を推定し、前記第2の散布図を用いて求めたゆらぎ指標から、収縮期血圧を推定する請求項15記載のコンピュータプログラム。 As a procedure for creating the scatter diagram, a first scatter diagram using each total amplitude of the two waveform components at the time of atrioventricular systole during the ventricular filling period and the two waveforms used in the first scatter diagram are used. Procedure for creating a second scatter plot using each total amplitude of the two waveform components corresponding to the timing after the component and the timing near the closing of the atrioventricular valve that shifts to the isotonic systole. Is executed,
In the procedure for obtaining the index related to the fluctuation, the diastolic blood pressure is estimated from the fluctuation index obtained using the first scatter plot, and the systolic blood pressure is estimated from the fluctuation index obtained using the second scatter plot. The computer program according to claim 15.
Priority Applications (6)
| Application Number | Priority Date | Filing Date | Title |
|---|---|---|---|
| JP2018003887A JP6885545B2 (en) | 2018-01-13 | 2018-01-13 | Blood pressure estimation device, blood pressure estimation method, computer program and recording medium |
| US16/961,875 US11937902B2 (en) | 2018-01-13 | 2019-01-11 | Blood pressure estimation device, blood pressure estimation method, computer program, and storage medium |
| CN201980008146.1A CN111655136A (en) | 2018-01-13 | 2019-01-11 | Blood pressure estimation device, blood pressure estimation method, computer program, and recording medium |
| AU2019206895A AU2019206895A1 (en) | 2018-01-13 | 2019-01-11 | Blood pressure estimation device, blood pressure estimation method, computer program, and storage medium |
| PCT/JP2019/000800 WO2019139155A1 (en) | 2018-01-13 | 2019-01-11 | Blood pressure estimation device, blood pressure estimation method, computer program, and storage medium |
| EP19738267.4A EP3738507A4 (en) | 2018-01-13 | 2019-01-11 | Blood pressure estimation device, blood pressure estimation method, computer program, and storage medium |
Applications Claiming Priority (1)
| Application Number | Priority Date | Filing Date | Title |
|---|---|---|---|
| JP2018003887A JP6885545B2 (en) | 2018-01-13 | 2018-01-13 | Blood pressure estimation device, blood pressure estimation method, computer program and recording medium |
Publications (2)
| Publication Number | Publication Date |
|---|---|
| JP2019122502A JP2019122502A (en) | 2019-07-25 |
| JP6885545B2 true JP6885545B2 (en) | 2021-06-16 |
Family
ID=67219656
Family Applications (1)
| Application Number | Title | Priority Date | Filing Date |
|---|---|---|---|
| JP2018003887A Active JP6885545B2 (en) | 2018-01-13 | 2018-01-13 | Blood pressure estimation device, blood pressure estimation method, computer program and recording medium |
Country Status (6)
| Country | Link |
|---|---|
| US (1) | US11937902B2 (en) |
| EP (1) | EP3738507A4 (en) |
| JP (1) | JP6885545B2 (en) |
| CN (1) | CN111655136A (en) |
| AU (1) | AU2019206895A1 (en) |
| WO (1) | WO2019139155A1 (en) |
Families Citing this family (2)
| Publication number | Priority date | Publication date | Assignee | Title |
|---|---|---|---|---|
| JP6988001B2 (en) * | 2018-08-30 | 2022-01-05 | オリンパス株式会社 | Recording device, image observation device, observation system, observation system control method, and observation system operation program |
| WO2023210668A1 (en) * | 2022-04-26 | 2023-11-02 | 株式会社デルタツーリング | Biological state evaluation device, biological state evaluation method, computer program, and recording medium |
Family Cites Families (24)
| Publication number | Priority date | Publication date | Assignee | Title |
|---|---|---|---|---|
| DE3807672A1 (en) * | 1988-03-09 | 1989-09-21 | Vectron Ges Fuer Technologieen | METHOD FOR CONTINUOUSLY MEASURING BLOOD PRESSURE ON HUMAN AND BLOOD PRESSURE MEASURING DEVICE FOR CARRYING OUT THE METHOD |
| WO2008154643A1 (en) * | 2007-06-12 | 2008-12-18 | Triage Wireless, Inc. | Vital sign monitor for measuring blood pressure using optical, electrical, and pressure waveforms |
| JP5132003B2 (en) * | 2008-04-09 | 2013-01-30 | 旭化成株式会社 | Blood pressure estimation device and blood pressure estimation method |
| WO2011046178A1 (en) * | 2009-10-14 | 2011-04-21 | 株式会社デルタツーリング | Biological state estimation device, biological state estimation system, and computer program |
| US11253159B2 (en) * | 2010-01-31 | 2022-02-22 | Vladimir Shusterman | Tracking cardiac forces and arterial blood pressure using accelerometers |
| JP5553303B2 (en) | 2010-02-18 | 2014-07-16 | 株式会社デルタツーリング | Biological state estimation device and computer program |
| JP5751475B2 (en) * | 2011-02-28 | 2015-07-22 | 株式会社デルタツーリング | Biological state estimation device and computer program |
| JP6118097B2 (en) | 2012-12-14 | 2017-04-19 | 株式会社デルタツーリング | Biological state determination device during operation and computer program |
| JP6209396B2 (en) * | 2013-04-17 | 2017-10-04 | 株式会社デルタツーリング | Driving support device and computer program |
| WO2016073945A1 (en) * | 2014-11-07 | 2016-05-12 | Respirix, Inc. | Devices and methods for monitoring physiologic parameters |
| US10849509B2 (en) * | 2014-11-21 | 2020-12-01 | Siemens Healthcare Gmbh | Patient signal filtering |
| US11298035B2 (en) * | 2015-03-17 | 2022-04-12 | Koninklijke Philips N.V. | Method and apparatus for measuring blood pressure |
| US10085665B2 (en) * | 2016-10-07 | 2018-10-02 | The Cooper Health System | Non-invasive system and method for monitoring lusitropic myocardial function in relation to inotropic myocardial function |
| US20180360315A1 (en) | 2015-12-12 | 2018-12-20 | Delta Kogyo Co., Ltd. | Biological state estimation device, biological state estimation method, computer program, and recording medium |
| US9757042B2 (en) * | 2016-01-05 | 2017-09-12 | Tosense, Inc. | Combined floormat and body-worn physiological sensors |
| GB2548626A (en) * | 2016-03-24 | 2017-09-27 | Imp Innovations Ltd | A method and an apparatus for determining haemodynamic status |
| CN106037694B (en) * | 2016-05-13 | 2019-11-05 | 吉林大学 | A kind of continuous blood pressure measurer based on pulse wave |
| US20190133516A1 (en) * | 2016-06-06 | 2019-05-09 | Tosense, Inc. | Physiological monitor for monitoring patients undergoing hemodialysis |
| WO2017216268A1 (en) * | 2016-06-14 | 2017-12-21 | Koninklijke Philips N.V. | Device and method for non-invasive assessment of maximum arterial compliance |
| WO2017220353A1 (en) * | 2016-06-22 | 2017-12-28 | Koninklijke Philips N.V. | Template-based analysis and classification of cardiovascular waveforms |
| US11058314B1 (en) * | 2016-07-12 | 2021-07-13 | Mahesh M. Galgalikar | Remote individual monitoring, training and recording system |
| EP3565461B1 (en) * | 2017-01-04 | 2023-03-29 | Koninklijke Philips N.V. | Device, system and method for determining pulse pressure variation of a subject |
| US10987517B2 (en) * | 2017-03-15 | 2021-04-27 | Medtronic, Inc. | Detection of noise signals in cardiac signals |
| US11666229B2 (en) * | 2017-11-24 | 2023-06-06 | Smartcardia Sa | Monitoring device for monitoring of vital signs |
-
2018
- 2018-01-13 JP JP2018003887A patent/JP6885545B2/en active Active
-
2019
- 2019-01-11 AU AU2019206895A patent/AU2019206895A1/en active Pending
- 2019-01-11 CN CN201980008146.1A patent/CN111655136A/en active Pending
- 2019-01-11 EP EP19738267.4A patent/EP3738507A4/en active Pending
- 2019-01-11 US US16/961,875 patent/US11937902B2/en active Active
- 2019-01-11 WO PCT/JP2019/000800 patent/WO2019139155A1/en active Application Filing
Also Published As
| Publication number | Publication date |
|---|---|
| US11937902B2 (en) | 2024-03-26 |
| US20200383588A1 (en) | 2020-12-10 |
| EP3738507A1 (en) | 2020-11-18 |
| JP2019122502A (en) | 2019-07-25 |
| EP3738507A4 (en) | 2021-03-17 |
| WO2019139155A1 (en) | 2019-07-18 |
| CN111655136A (en) | 2020-09-11 |
| AU2019206895A1 (en) | 2020-07-30 |
Similar Documents
| Publication | Publication Date | Title |
|---|---|---|
| US11583471B2 (en) | CPR chest compression system with tonometric input and feedback | |
| US20220211323A1 (en) | Method and apparatus for non-invasive detection of physiological and patho-physiological sleep conditions | |
| CN105283120B (en) | For determining the Flow-mediated dilation at blood vessel age | |
| WO2020262563A1 (en) | Health monitoring device, computer program, recording medium, and biosignal measuring device | |
| CN109414222A (en) | Dynamic calibration to blood pressure measurement device | |
| JP6876331B2 (en) | Biological condition estimator, computer program and recording medium | |
| JP6885545B2 (en) | Blood pressure estimation device, blood pressure estimation method, computer program and recording medium | |
| JP2020528307A (en) | Methods and systems for adjusting ventricular assist devices using wearable devices | |
| RU2268639C2 (en) | Method of pulse-measuring evaluation of functional condition and character of vegetative regulation of human cardio-vascular system | |
| JP6813897B2 (en) | Biological condition estimation device, biological condition estimation method, computer program and recording medium | |
| JP2023528682A (en) | Estimation of hemodynamic parameters | |
| JP2005523064A (en) | Blood vessel impedance measuring device | |
| Park et al. | Ballistocardiography | |
| EP3911228B1 (en) | A method to quantify the hemodynamic and vascular properties in vivo from arterial waveform measurements | |
| JP2016112144A (en) | Living body state analysis device and computer program | |
| JP2024004423A (en) | Blood pressure estimation device, computer program, and recording medium | |
| WO2023210668A1 (en) | Biological state evaluation device, biological state evaluation method, computer program, and recording medium | |
| RU2712045C1 (en) | Method for piezo-pulse-metric evaluation of the autonomous regulation of the cardiovascular system in humans | |
| JP6836264B2 (en) | Biological condition estimation device, biological condition estimation method, computer program and recording medium | |
| JP2022071786A (en) | Cardiac apex beating detector, computer program and recording medium | |
| CN117860223A (en) | Heart rate variability parameter acquisition and calculation method based on IMU signals | |
| Hast et al. | Baroreflex regulation measurement using a noninvasive laser Doppler method |
Legal Events
| Date | Code | Title | Description |
|---|---|---|---|
| A621 | Written request for application examination |
Free format text: JAPANESE INTERMEDIATE CODE: A621 Effective date: 20201224 |
|
| TRDD | Decision of grant or rejection written | ||
| A01 | Written decision to grant a patent or to grant a registration (utility model) |
Free format text: JAPANESE INTERMEDIATE CODE: A01 Effective date: 20210412 |
|
| A61 | First payment of annual fees (during grant procedure) |
Free format text: JAPANESE INTERMEDIATE CODE: A61 Effective date: 20210428 |
|
| R150 | Certificate of patent or registration of utility model |
Ref document number: 6885545 Country of ref document: JP Free format text: JAPANESE INTERMEDIATE CODE: R150 |