JP6813162B2 - High-speed displacement / strain distribution measurement method and measuring device by moire method - Google Patents
High-speed displacement / strain distribution measurement method and measuring device by moire method Download PDFInfo
- Publication number
- JP6813162B2 JP6813162B2 JP2016028169A JP2016028169A JP6813162B2 JP 6813162 B2 JP6813162 B2 JP 6813162B2 JP 2016028169 A JP2016028169 A JP 2016028169A JP 2016028169 A JP2016028169 A JP 2016028169A JP 6813162 B2 JP6813162 B2 JP 6813162B2
- Authority
- JP
- Japan
- Prior art keywords
- scanning
- sample
- moire
- pitch
- displacement
- Prior art date
- Legal status (The legal status is an assumption and is not a legal conclusion. Google has not performed a legal analysis and makes no representation as to the accuracy of the status listed.)
- Active
Links
- 238000000034 method Methods 0.000 title claims description 140
- 238000006073 displacement reaction Methods 0.000 title claims description 71
- 238000000691 measurement method Methods 0.000 title description 5
- 238000005259 measurement Methods 0.000 claims description 49
- 238000005070 sampling Methods 0.000 claims description 29
- 238000012545 processing Methods 0.000 claims description 21
- 238000000926 separation method Methods 0.000 claims description 3
- 238000003384 imaging method Methods 0.000 claims 3
- 230000035772 mutation Effects 0.000 claims 1
- 239000000523 sample Substances 0.000 description 92
- 239000011295 pitch Substances 0.000 description 49
- 239000000463 material Substances 0.000 description 13
- 230000035945 sensitivity Effects 0.000 description 11
- 238000011156 evaluation Methods 0.000 description 8
- XUIMIQQOPSSXEZ-UHFFFAOYSA-N Silicon Chemical compound [Si] XUIMIQQOPSSXEZ-UHFFFAOYSA-N 0.000 description 6
- 229910052710 silicon Inorganic materials 0.000 description 6
- 239000010703 silicon Substances 0.000 description 6
- 238000004088 simulation Methods 0.000 description 5
- 238000010586 diagram Methods 0.000 description 4
- 230000000694 effects Effects 0.000 description 4
- 238000012795 verification Methods 0.000 description 4
- 230000008859 change Effects 0.000 description 3
- 230000000052 comparative effect Effects 0.000 description 3
- 238000002474 experimental method Methods 0.000 description 3
- 230000006870 function Effects 0.000 description 3
- 238000001127 nanoimprint lithography Methods 0.000 description 3
- 230000008569 process Effects 0.000 description 3
- 239000004065 semiconductor Substances 0.000 description 3
- 230000002457 bidirectional effect Effects 0.000 description 2
- 239000000919 ceramic Substances 0.000 description 2
- 230000000295 complement effect Effects 0.000 description 2
- 239000002131 composite material Substances 0.000 description 2
- 230000001066 destructive effect Effects 0.000 description 2
- 238000005516 engineering process Methods 0.000 description 2
- 229910044991 metal oxide Inorganic materials 0.000 description 2
- 150000004706 metal oxides Chemical class 0.000 description 2
- 230000005540 biological transmission Effects 0.000 description 1
- 229960000074 biopharmaceutical Drugs 0.000 description 1
- 230000015572 biosynthetic process Effects 0.000 description 1
- 230000006835 compression Effects 0.000 description 1
- 238000007906 compression Methods 0.000 description 1
- 238000013461 design Methods 0.000 description 1
- 238000001514 detection method Methods 0.000 description 1
- 238000004100 electronic packaging Methods 0.000 description 1
- 239000010408 film Substances 0.000 description 1
- 230000006872 improvement Effects 0.000 description 1
- 238000007689 inspection Methods 0.000 description 1
- 239000002648 laminated material Substances 0.000 description 1
- 230000006386 memory function Effects 0.000 description 1
- 239000002184 metal Substances 0.000 description 1
- 229910052751 metal Inorganic materials 0.000 description 1
- 239000002905 metal composite material Substances 0.000 description 1
- 239000007769 metal material Substances 0.000 description 1
- 150000002739 metals Chemical class 0.000 description 1
- 238000001000 micrograph Methods 0.000 description 1
- VIKNJXKGJWUCNN-XGXHKTLJSA-N norethisterone Chemical compound O=C1CC[C@@H]2[C@H]3CC[C@](C)([C@](CC4)(O)C#C)[C@@H]4[C@@H]3CCC2=C1 VIKNJXKGJWUCNN-XGXHKTLJSA-N 0.000 description 1
- 230000003287 optical effect Effects 0.000 description 1
- 230000000737 periodic effect Effects 0.000 description 1
- 230000010363 phase shift Effects 0.000 description 1
- 238000013001 point bending Methods 0.000 description 1
- 229920000642 polymer Polymers 0.000 description 1
- 238000007781 pre-processing Methods 0.000 description 1
- 239000002990 reinforced plastic Substances 0.000 description 1
- 230000003252 repetitive effect Effects 0.000 description 1
- 230000003068 static effect Effects 0.000 description 1
- 239000000758 substrate Substances 0.000 description 1
- 238000009864 tensile test Methods 0.000 description 1
- 230000036962 time dependent Effects 0.000 description 1
- 238000013519 translation Methods 0.000 description 1
Images


Description
本発明は、モアレ法による高速かつ高精度で構造材料の二次元変位ひずみ分布を測定に関し、主に実験力学や非破壊検査の光学測定技術の分野に属する。 The present invention relates to measuring the two-dimensional displacement strain distribution of a structural material at high speed and with high accuracy by the moire method, and mainly belongs to the fields of experimental mechanics and optical measurement technology for non-destructive inspection.
構造材料の変位ひずみ分布を測定する技術は、ナノマイクロ材料の機械的特性評価から大型インフラ構造物の健全性評価まで幅広く利用されている。 Techniques for measuring displacement strain distribution of structural materials are widely used from evaluation of mechanical properties of nanomicro materials to evaluation of soundness of large infrastructure structures.
これまでに走査モアレ縞を利用したマイクロ/ナノスケールでの変位ひずみ計測では、レーザ走査顕微鏡(Laser Scanning Microscope: LSM)(非特許文献1)、走査電子顕微鏡(Scanning Electron Microscope: SEM)(特許文献1)、原子間力顕微鏡(Atomic Force Microscope: AFM)、透過型電子顕微鏡(Transmission Electron Microscope: TEM)などが用いられてきた。 So far, in micro / nanoscale displacement strain measurement using scanning moire fringes, Laser Scanning Microscope (LSM) (Non-Patent Document 1), Scanning Electron Microscope (SEM) (Patent Document) 1), Atomic Force Microscope (AFM), Transmission Electron Microscope (TEM), etc. have been used.
またミリ/メートリスケールでの変位ひずみ計測では、電荷結合素子(Charge-couple Device: CCD)、相補性金属酸化膜半導体(Complementary Metal Oxide Semiconductor: CMOS)などのイメージセンサを利用したサンプリングモアレ法が用いられている(特許文献2)。 For displacement strain measurement on the milli / metric scale, the sampling moiré method using image sensors such as charge-couple devices (CCDs) and complementary metal Oxide semiconductors (CMOS) is used. (Patent Document 2).
これらの手法では、構造材料表面に自然に存在するまたは人工的に付けた繰り返し模様を、各種走査型顕微鏡(例えば、LSM、SEM、AFM、TEM等)を用いた走査モアレ法では模様ピッチと近い間隔で走査(スキャニング)、または各種イメージセンサ(例えば、CCD、CMOS等)を用いたサンプリングモアレ法では画像処理で撮影画像上での模様ピッチと近い画素間隔で間引き処理(ダウンサンウリング)して得られるモアレ縞の変化から定量的に構造材料表面の変位ひずみ分布を評価できる。 In these methods, a repetitive pattern that naturally exists or is artificially attached to the surface of a structural material is close to the pattern pitch in the scanning moiré method using various scanning microscopes (for example, LSM, SEM, AFM, TEM, etc.). In the sampling moiré method using scanning at intervals or various image sensors (for example, CCD, CMOS, etc.), image processing is performed to thin out (down-sew ring) at pixel intervals close to the pattern pitch on the captured image. The displacement strain distribution on the surface of the structural material can be quantitatively evaluated from the changes in the obtained moire fringes.
従来の走査モアレ法やサンプリングモアレ法は静的な状態での変位ひずみ分布計測では多くの利点を有するが、動的な変位ひずみ分布計測の際に以下のようにいくつかの問題点が挙げられる。 The conventional scanning moiré method and sampling moiré method have many advantages in measuring the displacement strain distribution in a static state, but there are some problems in measuring the dynamic displacement strain distribution as follows. ..
1.走査モアレ法では、レーザ光源を走査して画像を取得するため、高分解能な画像を得るのに時間がかかる。
モアレ画像取得に時間がかかると、変位ひずみ分布評価に必要なモアレパターンが試料クリープの影響を受けやすく、測定誤差が発生しやすい。
1. 1. In the scanning moire method, since an image is acquired by scanning a laser light source, it takes time to obtain a high-resolution image.
If it takes time to acquire the moiré image, the moiré pattern required for the evaluation of the displacement strain distribution is easily affected by the sample creep, and a measurement error is likely to occur.
2.明確なモアレ縞が生成するためには、走査間隔に近いピッチがある試料格子のみを使用することができるので、使用可能な試料格子の範囲が狭い。
特に、一般的にレーザ走査型顕微鏡(LSM)装置で用いられる対物レンズの倍率は通常5×、10×、20×、50×、100×、150×といった具合に不連続であり、LSMモアレ法を様々なアプリケーションへ応用する際の障害となる。
2. 2. In order to generate clear moiré fringes, only a sample grid having a pitch close to the scanning interval can be used, so that the range of usable sample grids is narrow.
In particular, the magnification of the objective lens generally used in a laser scanning microscope (LSM) device is usually discontinuous, such as 5 × 10 ×, 20 ×, 50 ×, 100 ×, 150 ×, and the LSM moire method. Is an obstacle when applying to various applications.
3.材料性能評価のために不可欠であり、x方向及びy方向の両方の面内変形の測定には、従来の走査モアレ法で、試料ステージまたは顕微鏡の走査線を90°回転する必要がある。
回転前後のモアレ縞を得るために、顕微鏡は二回で走査する必要がある。
回転プロセスや二回走査が不便であり、試料の位置誤差をもたらすことになる。
この場合、時間依存現象を捉えるための動的変形測定を適用することは困難である。
3. 3. Indispensable for material performance evaluation, measurement of in-plane deformation in both the x and y directions requires 90 ° rotation of the sample stage or microscope scan lines by conventional scanning moiré methods.
The microscope needs to be scanned twice to obtain moiré fringes before and after rotation.
The rotation process and double scanning are inconvenient and result in sample misalignment.
In this case, it is difficult to apply dynamic deformation measurement to capture the time-dependent phenomenon.
上述の問題を踏まえて、迅速かつ正確に構造材料の二次元の変位ひずみ分布を測定する方法が求められる。
また、実用上では使用可能な試料格子ピッチの範囲を拡大できる手法が望まれている。
Based on the above problems, a method for quickly and accurately measuring the two-dimensional displacement strain distribution of the structural material is required.
Further, in practice, a method capable of expanding the range of usable sample lattice pitches is desired.
図1に、公知のモアレ法と、そのモアレ法を応用した、迅速かつ正確に構造材料の二次元変位ひずみ分布を実現するための本発明の三つの新変形測定方法を提案する。
第1の方法は、図1(b)右上に示す高速走査モアレ法であり、第2の方法は図1(c)左下に示す二次元走査モアレ法であり、第三の方法は図1(d)右下に示した高速二次元走査モアレ法である。
なお、ここでは、走査モアレは回転ミラーなどで機械的にレーザ光源等を走査して得られる各走査点での輝度情報を取得するのに対して、サンプリングモアレ法はCCD面に配置された二次元画素配列を飛び飛び(間引き)の画素での明るさ情報をサンプリング点として取り出しているという点では異なるものの、離散的にサンプリング点での輝度情報を取得している点は本質的に同じである。
よって本説明で走査モアレ法と言う時には、図面を含めて、走査モアレ法とサンプリングモアレ法に共通な特徴が含まれるものとする。
FIG. 1 proposes a known moire method and three new deformation measurement methods of the present invention for quickly and accurately realizing a two-dimensional displacement strain distribution of a structural material by applying the moire method.
The first method is the high-speed scanning moire method shown in the upper right of FIG. 1 (b), the second method is the two-dimensional scanning moire method shown in the lower left of FIG. 1 (c), and the third method is FIG. 1 ( d) This is the high-speed two-dimensional scanning moire method shown in the lower right.
Here, the scanning moiré method acquires the luminance information at each scanning point obtained by mechanically scanning the laser light source or the like with a rotating mirror or the like, whereas the sampling moiré method is arranged on the CCD surface. Although it differs in that the brightness information of the pixels in which the dimensional pixel array is skipped (thinned out) is taken out as a sampling point, it is essentially the same in that the brightness information at the sampling point is obtained discretely. ..
Therefore, when the scanning moiré method is referred to in this description, it is assumed that the features common to the scanning moiré method and the sampling moiré method are included, including the drawings.
これらの手法によって、変位ひずみ分布を評価するうえで必要となるモアレ画像の取得速度の向上と二次元の変形測定精度の向上が同時に達成することができる。 By these methods, it is possible to simultaneously improve the acquisition speed of the moire image and the improvement of the two-dimensional deformation measurement accuracy, which are necessary for evaluating the displacement strain distribution.
1.高速走査モアレ法
高速縞走査とは従前の変形計測の縞走査方法に要する時間よりも走査時間の短縮を意味する。
より詳しくは従前の半分以下の走査線数で同等の精度の変形計測ができる。
1. 1. High-speed scanning moiré method High-speed fringe scanning means that the scanning time is shorter than the time required for the fringe scanning method of the conventional deformation measurement.
More specifically, deformation measurement with the same accuracy can be performed with less than half the number of scanning lines as before.
最初に、試料表面上に規則格子を作製する。
その後、試料台上に設置した試料をレーザ走査型顕微鏡(LSM)や走査型電子顕微鏡(SEM)または原子間力顕微鏡(AFM)などの走査型顕微鏡より観察する。
First, a regular grid is created on the sample surface.
Then, the sample placed on the sample table is observed with a scanning microscope such as a laser scanning microscope (LSM), a scanning electron microscope (SEM), or an atomic force microscope (AFM).
次に、走査線の間隔を、試料格子ピッチの整数(≧2)倍に近くなるように調整する。
走査線(試料格子ピッチの整数倍)と試料格子間の干渉から、高速走査モアレパターンが生成することができる(図2)。
この場合、従来の走査モアレ法に比べて走査線数が少ないため、より高速でモアレ画像を取得できる。
Next, the spacing between the scanning lines is adjusted so as to be close to an integer (≧ 2) times the sample grid pitch.
A high-speed scanning moire pattern can be generated from the interference between the scanning line (an integral multiple of the sample grid pitch) and the sample grid (Fig. 2).
In this case, since the number of scanning lines is smaller than that of the conventional scanning moire method, a moire image can be acquired at a higher speed.
最後に、高速走査モアレ法より得られるモアレ縞画像から、全視野で試料の変位とひずみ分布を測定することができる。 Finally, the displacement and strain distribution of the sample can be measured in the entire field of view from the moire fringe image obtained by the high-speed scanning moire method.
1.1 高速走査モアレ縞の形成原理
初めに従前の走査モアレ縞の形成原理を紹介する。
従前のモアレ縞は試料の格子と走査線(参照格子)間の干渉から発生する。
試料格子のピッチと走査線の間隔がそれぞれy方向にpとT0として定義されている場合、試料格子と走査線の位相表現はそれぞれ2πy/p、2πy/T0と表せる。
y方向は走査線の方向に対して垂直である。
1.1 Principle of forming high-speed scanning moire fringes First, we will introduce the conventional principle of forming scanning moire fringes.
The conventional moire fringes are caused by the interference between the sample grid and the scanning line (reference grid).
When the pitch of the sample grid and the interval between the scanning lines are defined as p and T 0 in the y direction, respectively, the phase representation of the sample grid and the scanning lines can be expressed as 2πy / p and 2πy / T 0 , respectively.
The y direction is perpendicular to the direction of the scanning line.
従前の走査モアレ縞が発生する理由は、走査線と試料の格子間の小さな不一致またはずれであり、T0はpに近接している。
1次モアレ縞の位相は次式で表現できる。
The reason for the conventional scan moire fringes is a small mismatch or shift between the scan line and the sample grid, where T 0 is close to p.
The phase of the first-order moire fringes can be expressed by the following equation.

ただしφhは高次周波数の位相(2πy/p、2πy/T0、2πy(1/p+1/T0))としφ0はその初期位相とする。
場合によっては、走査線間隔が試料格子ピッチに近接している条件を満足するのは容易でない。
However, φ h is the phase of the higher frequency (2πy / p, 2πy / T 0 , 2πy (1 / p + 1 / T 0 )), and φ 0 is the initial phase.
In some cases, it is not easy to satisfy the condition that the scan line spacing is close to the sample grid pitch.
この条件では、図2に示したように、走査線間隔が試料格子ピッチの整数倍に近接していれば、すなわちT(n)がnp(nは正の整数で2以上)に近接していれば、高速走査モアレ縞が現われる。
高速走査は走査解像度を落として走査線間隔を大きく走査する事で実現される。
高速走査線間隔は次の式で定義される。
Under this condition, as shown in FIG. 2, if the scan line spacing is close to an integral multiple of the sample grid pitch, that is, T (n) is close to np (n is a positive integer and is 2 or more). Then, high-speed scanning moire fringes appear.
High-speed scanning is realized by lowering the scanning resolution and scanning a large scanning line interval.
The high-speed scan line spacing is defined by the following equation.
ただしT0は試料格子ピッチに近接した基本走査線間隔とする。
そうすると高速走査モアレ縞は次式で表される。
However, T 0 is the basic scan line spacing close to the sample grid pitch.
Then, the high-speed scanning moire fringe is expressed by the following equation.
ただしφh (n)は高次周波数の位相であって(2πy/p、2πy/T0、2πy(1/p+1/T0)、2πy(1/p−1/T0を含む)、φ0(n)はその初期位相とする。 However, φ h (n) is the phase of higher frequency (2πy / p, 2πy / T 0 , 2πy (1 / p + 1 / T 0 ), 2πy (including 1 / p-1 / T 0 ), φ 0 (n) is the initial phase.
1.2 高速走査モアレ法の変形計測原理
モアレ縞はおおよそ周期的分布状態であるので高速走査モアレ縞のモアレ間隔は次式で表される。
1.2 Deformation measurement principle of the high-speed scanning moire method Since the moire fringes are approximately in a periodic distribution state, the moire interval of the high-speed scanning moire fringes is expressed by the following equation.
ただし、d(n)はy方向のモアレ間隔であり、φh(n)とφ0(n)は高次周波数の位相と高速走査モアレ縞の初期位相とする。
数式(3)と(4)のモアレ位相の基本周波数要素を比較すれば、次式に示す試料格子ピッチと高速走査線間隔と高速走査モアレ間隔の相関を得ることができる。
However, d (n) is the moire interval in the y direction, and φ h (n) and φ 0 (n) are the phase of the higher frequency and the initial phase of the high-speed scanning moire fringe.
By comparing the fundamental frequency elements of the moire phase of the equations (3) and (4), the correlation between the sample lattice pitch, the high-speed scanning line interval, and the high-speed scanning moire interval shown in the following equation can be obtained.
数式(2)を数式(5)に代入するとモアレ間隔はnに依存せず一定であることがわかる。
よって次の2つの数式が得られる。
Substituting the mathematical formula (2) into the mathematical formula (5), it can be seen that the moire interval does not depend on n and is constant.
Therefore, the following two mathematical formulas can be obtained.
低走査線解像度のモアレ縞は基本走査線間隔の関数であり相対変位の等高線である。
モアレ縞次数をmとして、基本走査線に関してy方向におけるモアレ縞の変位は次式で表される。
Moire fringes with low scan line resolution are functions of the basic scan line spacing and are contour lines of relative displacement.
The displacement of the moiré fringes in the y direction with respect to the basic scanning line is expressed by the following equation, where m is the moiré fringe order.
T0間隔の基本走査線に相対的なピッチpの試料格子のひずみはy方向の相対変位の一次微分から得ることができる。 The strain of the sample grid with a pitch p relative to the basic scan line at T 0 intervals can be obtained from the first derivative of the relative displacement in the y direction.
ただし方向変数yの漸増の半分はひずみを計算する場合において半微分ステップと呼ぶ。
試料格子の実際のひずみは試料格子ピッチ(または基本走査間隔)の変形前後の幾何学的関係から得られる。
実際のひずみは次式によって与えられる。
However, half of the gradual increase of the directional variable y is called a semi-differentiable step when calculating the strain.
The actual strain of the sample grid is obtained from the geometrical relationship before and after the deformation of the sample grid pitch (or basic scan interval).
The actual strain is given by the following equation.
ただし、p0はy方向における変形前の試料格子ピッチとする。 However, p 0 is the sample lattice pitch before deformation in the y direction.
1.3 高速走査モアレ法による変形計測感度
高速走査モアレ法ではT0間隔の基本走査線に相対的なピッチpの試料格子のひずみは式、ε(n)=(p−T0)/T0で表される。
この数式と数式(7)とを比較すれば、T(n)<npの場合には式、ε(n)=T0/(d−T0)で得られ、T(n)>npの場合には式、ε(n)=−T0/(d+T0)で得られる。
モアレ間隔は通常y方向には基本走査線間隔よりはるかに大きいことから相対ひずみは式、|ε(n)|≒T0/d=T(n)/(nd)で簡素化される。
1.3 Deformation measurement sensitivity by the high-speed scanning moiré method In the high-speed scanning moiré method, the strain of the sample grid with a pitch p relative to the basic scanning line at T 0 intervals is expressed by the equation, ε (n) = (p−T 0 ) / T. It is represented by 0 .
Comparing this formula with the formula (7), it is obtained by the formula when T (n) <np, ε (n) = T 0 / (d−T 0 ), and T (n)> np . In the case, it is obtained by the formula, ε (n) = −T 0 / (d + T 0 ).
Since the moiré interval is usually much larger than the basic scan line interval in the y direction, the relative strain is simplified by the equation, | ε (n) | ≈ T 0 / d = T (n) / (nd).
次に提案法の変形計測精度について理論的に述べる。
数式(8)から提案法の変位感度は縞模様につきT(n)/nであり、従来の走査モアレ法の縞模様あたりの変位感度と同じである。
ひずみ感度は測定可能な最小のひずみ、すなわち全視野で2個のモアレ縞のみ観測される場合のひずみ、d=N(n)T(n)と定義される。ただしN(n)は走査線数とする。
Next, the deformation measurement accuracy of the proposed method will be described theoretically.
From the equation (8), the displacement sensitivity of the proposed method is T (n) / n per striped pattern, which is the same as the displacement sensitivity per striped pattern of the conventional scanning moire method.
Strain sensitivity is defined as the smallest measurable strain, that is, the strain when only two moire fringes are observed in the entire field of view, d = N (n) T (n). However, N (n) is the number of scanning lines.
簡素化された相対ひずみ式に代入すれば高速モアレ法のひずみ感度は式、T(n)/[n N(n)T(n)]=1/[n N(n)]となる。
T0がpに近接している場合の基本走査線数をN0とすれば全視野ではd=N0T0となるので、ひずみ感度は、T(n)/[nN0T0]=1/N0となって、結局従来のモアレ法の感度と同じになることがわかる。
Substituting into the simplified relative strain equation, the strain sensitivity of the high-speed moire method is the equation, T (n) / [n N (n) T (n)] = 1 / [n N (n)].
If the basic number of scanning lines when T 0 is close to p is N 0 , then d = N 0 T 0 in the entire field of view, so the strain sensitivity is T (n) / [nN 0 T 0 ] = It can be seen that the sensitivity becomes 1 / N 0 , which is the same as the sensitivity of the conventional moire method.
言い換えれば提案法の変位とひずみ計測感度は従来の走査モアレ法と同等である。
公知の位相シフト法と組み合わせることにより変形計測精度を改善する事ができる。
In other words, the displacement and strain measurement sensitivity of the proposed method is equivalent to that of the conventional scanning moire method.
Deformation measurement accuracy can be improved by combining with a known phase shift method.
本発明で得られる高速走査モアレ縞は、従来の走査モアレ縞と同じモアレ間隔を有している。
よって高速走査モアレ法は、変位とひずみの測定感度を低下させることなく、高い速度でモアレ画像を取得できることから、従来の走査モアレ法より、試料のクリープを受けにくい。
また変形計測のためにより多くのピッチの試料格子に適用することができる。
The high-speed scanning moire fringes obtained by the present invention have the same moire interval as the conventional scanning moire fringes.
Therefore, the high-speed scanning moiré method is less susceptible to sample creep than the conventional scanning moiré method because it can acquire a moiré image at a high speed without lowering the measurement sensitivity of displacement and strain.
It can also be applied to sample grids with more pitches for deformation measurement.
2.二次元走査モアレ法
二次元走査モアレ法は、単一の二次元走査モアレ画像から、二方向の変形が同時に測定できることを示している。
2. 2. Two-dimensional scanning moiré method The two-dimensional scanning moiré method shows that deformation in two directions can be measured simultaneously from a single two-dimensional scanning moiré image.
最初に、試料表面上に規則的な交差格子を作製する。その後で、試料を走査型顕微鏡の試料台上に載置する。 First, a regular cross grid is created on the sample surface. The sample is then placed on the sample table of the scanning microscope.
次に、走査顕微鏡の走査線は多くの走査点で構成しているので、垂直方向と水平方向共に走査点の間隔が等しく、かつ、試料格子ピッチに近接するように走査解像度を調整する。
走査点と交差格子間との干渉から、二次元走査モアレ縞が生成する(図3)。
Next, since the scanning line of the scanning microscope is composed of many scanning points, the scanning resolution is adjusted so that the intervals between the scanning points are equal in both the vertical direction and the horizontal direction and are close to the sample lattice pitch.
Two-dimensional scanning moire fringes are generated from the interference between the scanning points and the cross grids (Fig. 3).
最後に、二次元走査モアレ法により、全視野で試料の二方向の変位とひずみ分布を同時に測定することができる。 Finally, the two-dimensional scanning moiré method can simultaneously measure the displacement and strain distribution of the sample in two directions in the entire field of view.
2.1 二次元走査モアレ縞の生成原理
走査顕微鏡の走査プロセスでは並行走査線が知られている。
実際のところ、図3に示すように、走査型顕微鏡では走査線は多くの走査点から構成されている。
2.1 Principle of generation of two-dimensional scanning moire fringes Parallel scanning lines are known in the scanning process of scanning microscopes.
As a matter of fact, as shown in FIG. 3, in a scanning microscope, a scanning line is composed of many scanning points.
試料格子が交差格子である場合、交差格子と走査点との干渉により二次元走査モアレ縞が発生する。x方向の走査点間隔(Tx)とy方向の走査点間隔(Ty)は等しいからTx=Ty=T0となる。 When the sample grid is a cross grid, two-dimensional scanning moire fringes are generated due to the interference between the cross grid and the scanning point. Since the scanning point spacing (T x ) in the x direction and the scanning point spacing (T y ) in the y direction are equal, T x = T y = T 0 .
2.2 二次元走査モアレ法による変形計測原理
図4に示すように、二次元走査モアレ縞は2つの従来の一次元走査モアレ縞を二方向に合成したものと考えてよい。
フーリエ変換と逆フーリエ変換を用いて図4に示すように二次元走査モアレ縞をx方向とy方向の一次元走査モアレ縞に分離することができる。
交差格子の二方向における走査点に相対的な変位は次式で表すことができる。
2.2 Deformation measurement principle by the two-dimensional scanning moire method As shown in FIG. 4, the two-dimensional scanning moire fringes can be considered as a combination of two conventional one-dimensional scanning moire fringes in two directions.
As shown in FIG. 4, the two-dimensional scanning moire fringes can be separated into the one-dimensional scanning moire fringes in the x-direction and the y-direction by using the Fourier transform and the inverse Fourier transform.
The displacement relative to the scanning points in the two directions of the cross grid can be expressed by the following equation.
ただし、図4に示すように、モアレ縞次数をm、x方向とy方向における指数(図の左上を基点とする)を、走査点間隔をT 0 とする。
走査点に対する試料格子のひずみ、すなわち、二方向の相対ひずみは、それぞれ、二方向での相対変位の一次微分から得ることができる。
However, as shown in FIG. 4, the moiré fringe order is m, the exponents in the x and y directions (based on the upper left of the figure), and the scanning point interval is T 0 .
The strain of the sample grid with respect to the scanning point, i.e., the relative strain in two directions, can be obtained from the first derivative of the relative displacement in each of the two directions.
ただし、方向変数iの漸増の半分はひずみを計算する場合において半微分ステップと呼ぶ。
試料格子の実際のひずみは、変形前後の試料格子ピッチや走査点間隔との幾何学的関係(関数)から求めることができる。
試料格子の実際の二方向ひずみは次式による。
However, half of the gradual increase of the directional variable i is called a semi-differentiable step when calculating the strain.
The actual strain of the sample grid can be obtained from the geometric relationship (function) with the sample grid pitch and scanning point spacing before and after deformation.
The actual bidirectional strain of the sample grid is based on the following equation.
ただし変形前のx方向またはy方向の試料格子ピッチをpi_0とする。
相対ひずみが最初に計測されるのは試料格子を観測することなく走査モアレが低倍率で記録されるので全視野が顕著に拡大できることによる。
より小さな格子を用いれば、より高精細な変位・ひずみ分布が得られる。
However, the sample lattice pitch in the x-direction or y-direction before deformation is set to p i_0 .
The relative strain is measured first because the scanning moiré is recorded at low magnification without observing the sample grid, so the entire field of view can be significantly expanded.
If a smaller grid is used, a finer displacement / strain distribution can be obtained.
せん断ひずみは次式により求められるεxy=∂ux/∂y+∂uy/∂x。試料の実際のせん断ひずみは走査点に対する相対せん断ひずみとなる。
本発明は主にx方向とy方向の通常ひずみの測定に焦点をあてている。
The shear strain is calculated by the following equation: ε xy = ∂u x / ∂y + ∂u y / ∂x. The actual shear strain of the sample is the relative shear strain with respect to the scanning point.
The present invention mainly focuses on the measurement of normal strain in the x-direction and the y-direction.
二次元走査モアレ縞を用いて二方向での変形を測定するために、例えば、フーリエ変換または各種ローパスフィルタの画像処理を使用して、二方向に2つの一次元モアレ縞に分離することができる。 In order to measure deformation in two directions using two-dimensional scanning moiré fringes, it can be separated into two one-dimensional moiré fringes in two directions, for example, using Fourier transform or image processing of various low-pass filters. ..
二次元走査モアレ法は、試料や走査方向を回転させることなく、単一の二次元モアレ縞を使用して、二次元の変位とひずみ分布を測定することができる。
従って、この方法は、二次元変形計測のために、簡単な操作、節約の時間、および高精度の利点を有する。
The two-dimensional scanning moiré method can measure two-dimensional displacement and strain distribution using a single two-dimensional moiré fringe without rotating the sample or scanning direction.
Therefore, this method has the advantages of easy operation, time saving, and high accuracy for 2D deformation measurement.
3.高速二次元走査モアレ法
高速二次元走査モアレ法は、高速走査モアレ法と二次元走査モアレ法を融合する方法である。最初に、試料表面上に規則的な交差格子を作製する。
その後で、試料を走査型顕微鏡の試料台上に載置する。
3. 3. High-speed two-dimensional scanning moiré method The high-speed two-dimensional scanning moiré method is a method that combines the high-speed scanning moiré method and the two-dimensional scanning moiré method. First, a regular cross grid is created on the sample surface.
The sample is then placed on the sample table of the scanning microscope.
次に、走査解像度を垂直方向の走査点の間隔が試料格子ピッチの整数(≧2)倍数に近くに、水平方向の走査点の間隔が試料格子ピッチの整数(≧1)倍数に近くなるように調整する。
高速走査点と試料交差格子間の干渉は、高速二次元走査モアレ縞を生成する。
Next, the scanning resolution is set so that the intervals between the scanning points in the vertical direction are close to an integer (≧ 2) multiple of the sample lattice pitch, and the intervals between the scanning points in the horizontal direction are close to an integer (≧ 1) multiple of the sample lattice pitch. Adjust to.
Interference between the fast scan points and the sample cross grid produces fast two-dimensional scan moire fringes.
最後に、高速二次元走査モアレ法による、全視野で試料の二方向の変位とひずみ分布を同時に迅速に測定することができる。 Finally, the two-way displacement and strain distribution of the sample can be quickly measured simultaneously in the entire field of view by the high-speed two-dimensional scanning moire method.
図5は変形計測における高速二次元走査モアレ縞とモアレ像処理の生成原理を表している。
高速二次元走査モアレ縞は高速走査点と交差格子間の干渉で生成する。
y方向の走査点間隔は基本走査点間隔の2倍以上、かつ、x方向の間隔は基本走査点間隔と等しいまたはその倍数、Ti(ni)=ni T0、ny≧2, nx≧1,である。
ただしT0は試料格子ピッチに近接する基本走査点間隔とし、iはx方向またはy方向とする。
基本走査点に相対する二方向の試料格子変位は次式で表される。
FIG. 5 shows the generation principle of high-speed two-dimensional scanning moire fringes and moire image processing in deformation measurement.
High-speed two-dimensional scanning moire fringes are generated by interference between high-speed scanning points and cross grids.
y direction of the scanning point interval is more than twice the base running point interval, and the interval in the x direction is equal or multiples thereof as a basic scanning point interval, T i (n i) = n i T 0, n y ≧ 2, n x ≧ 1,.
However, T 0 is the basic scanning point interval close to the sample grid pitch, and i is the x direction or the y direction.
The displacement of the sample grid in two directions relative to the basic scanning point is expressed by the following equation.
ただし、図5に示すように、i方向におけるモアレ縞次数をmi、走査点間隔をT i (n i )とする。
走査点に対する試料格子のひずみ、すなわち、二方向の相対ひずみは、それぞれ、二方向での相対変位の一次微分から得ることができる。
However, as shown in FIG. 5, the moire fringe order in i direction m i, the scanning point interval and T i (n i).
The strain of the sample grid with respect to the scanning point, i.e., the relative strain in two directions, can be obtained from the first derivative of the relative displacement in each of the two directions.
試料格子の実際のひずみは、変形前後の試料格子ピッチや走査点間隔との幾何学的関係(関数)から求めることができる。
試料格子の実際の二方向ひずみは次式による。
The actual strain of the sample grid can be obtained from the geometric relationship (function) with the sample grid pitch and scanning point spacing before and after deformation.
The actual bidirectional strain of the sample grid is based on the following equation.
高速二次元走査モアレ縞が高速で記録され、二次元走査モアレ縞のような二方向において同じモアレ間隔を有する。 High-speed two-dimensional scanning moiré fringes are recorded at high speed and have the same moiré spacing in two directions, such as two-dimensional scanning moiré fringes.
高速二次元走査モアレ法は、高速走査モアレ法と二次元走査モアレ法の両方の利点を有している。 The high-speed two-dimensional scanning moiré method has the advantages of both the high-speed scanning moiré method and the two-dimensional scanning moiré method.
図6に、本発明で述べたこれらの走査モアレ法による変位ひずみ分布の解析フローチャートを示す。
解析手順は3つの走査モアレ法に共通であり、(ステップ1)まず試料表面に格子を作製し、(ステップ2)いずれかのモアレ画像を取得する。
FIG. 6 shows an analysis flowchart of the displacement strain distribution by these scanning moire methods described in the present invention.
The analysis procedure is common to the three scanning moire methods. (Step 1) First, a grid is formed on the sample surface, and (Step 2) any moire image is acquired.
(ステップ3)次に二次元のモアレ縞が含まれる場合は、(ステップ4)二次元走査モアレ縞をx方向とy方向の一次元走査モアレ縞に分離する前処理を行ってから、(ステップ5)適宜一次元または二次元の変位解析処理を行い、最後にひずみ解析処理を行う(ステップ6)。 (Step 3) Next, when two-dimensional moire fringes are included, (step 4) preprocessing for separating the two-dimensional scanning moire fringes into the x-direction and y-direction one-dimensional scanning moire fringes is performed, and then (step). 5) Perform one-dimensional or two-dimensional displacement analysis processing as appropriate, and finally perform strain analysis processing (step 6).
図7にレーザ顕微鏡を用いて金属材料の引張試験の実験装置の一例を示す。
これらの方法は、様々な材料や構造の広視野や全視野での非破壊ミクロン/ナノスケールの変形を測定することができる。
FIG. 7 shows an example of an experimental device for a tensile test of a metal material using a laser microscope.
These methods can measure wide-field and full-field deformation of various materials and structures on a non-destructive micron / nanoscale.
4.CCDカメラ又はCMOSカメラへの拡張
本発明で述べたこれらの走査モアレ法は、走査線または走査点から、デジタル格子または、電荷結合素子(CCD)カメラ又は相補型金属酸化膜半導体(CMOS)カメラの画素に変更することにより、ミリメートル/メートルスケールの変形を測定するために拡張することができる。
図8に示す提案した高速CCD又はCMOSカメラを使用して、高速サンプリングモアレ法よりミリメートル/メートルスケールの変形を迅速に測定することができる。
4. Extensions to CCD or CMOS Cameras These scanning moiré methods described in the present invention can be applied to digital lattices or charge-binding element (CCD) cameras or complementary metal oxide semiconductor (CMOS) cameras from scanning lines or scanning points. By changing to pixels, it can be extended to measure deformation on the millimeter / metric scale.
Using the proposed high-speed CCD or CMOS camera shown in FIG. 8, deformation on a millimeter / meter scale can be measured more quickly than the high-speed sampling moiré method.
本発明は迅速に正確に簡単に全視野での二次元変位ひずみ分布を測定でき、以下の効果を有する。
効果1:高速走査モアレ法と高速二次元走査モアレ法で、モアレ画像取得速度が高く、使用可能な試料格子ピッチの範囲が広い。
高速変形測定は、計測感度を低下させることなく、変位ひずみ分布を計測できる。
試料クリープの影響を受けにくく、動的測定に適している。
効果2:二次元走査モアレ法と高速二次元走査モアレ法で、二次元変形測定精度は高い。
試料または走査方向の回転動作および2回の走査を必要としないため、回転による誤差がなく、二方向の変形を同時に測定することができる。
また実験操作は簡単で、簡易に動的計測に利用できる。
効果3:開発したこれらの3つの走査モアレ法で、広視野での変位とひずみ分布を非破壊かつ定量的に測定することができる。
格子そのものを観察するではなく、拡大現象であるモアレ縞から変位ひずみ分布を評価しているため、試料格子ピッチの千倍以上の視野を観察できる。
The present invention can measure the two-dimensional displacement strain distribution in the entire field of view quickly, accurately and easily, and has the following effects.
Effect 1: In the high-speed scanning moire method and the high-speed two-dimensional scanning moire method, the moire image acquisition speed is high and the range of sample lattice pitches that can be used is wide.
The high-speed deformation measurement can measure the displacement strain distribution without lowering the measurement sensitivity.
It is not easily affected by sample creep and is suitable for dynamic measurement.
Effect 2: The two-dimensional deformation measurement accuracy is high in the two-dimensional scanning moire method and the high-speed two-dimensional scanning moire method.
Since the rotation operation in the sample or scanning direction and the two scannings are not required, there is no error due to rotation, and the deformation in two directions can be measured at the same time.
In addition, the experimental operation is simple and can be easily used for dynamic measurement.
Effect 3: With these three scanning moire methods developed, displacement and strain distribution in a wide field of view can be measured non-destructively and quantitatively.
Since the displacement strain distribution is evaluated from the moire fringes, which is an enlargement phenomenon, instead of observing the lattice itself, it is possible to observe a field of view that is 1000 times or more the sample lattice pitch.
以下に実施例を示す。 An example is shown below.
1.シミュレーションと実験から高速走査モアレ縞の生成
本実施例では、本発明による高速走査モアレ縞の生成方法、及び従来の走査モアレ縞との関係を示す。
1. 1. Generation of high-speed scanning moire fringes from simulations and experiments In this example, the method for generating high-speed scanning moire fringes according to the present invention and the relationship with the conventional scanning moire fringes are shown.
図9に走査モアレ法とサンプリングモアレ法に共通して、一次元のモアレ縞の生成に関するシミュレーション結果を示す。
図9は、異なる走査解像度または走査間隔でダウンサンプリングした場合に得られるモアレ縞を示している。
FIG. 9 shows the simulation results regarding the generation of one-dimensional moiré fringes, which are common to the scanning moiré method and the sampling moiré method.
FIG. 9 shows the moiré fringes obtained when downsampling at different scan resolutions or scan intervals.
図9(a)は試料格子に相当する13画素のピッチを有する余弦型平行格子である。
これに対して、図9(b)に示すように基本的な走査線間隔T0を12画素として、格子試料とT0=12画素を有する走査格子の重ね合わせから、従来の走査モアレ縞を生成できる。
FIG. 9A is a cosine-type parallel grid having a pitch of 13 pixels corresponding to the sample grid.
On the other hand, as shown in FIG. 9B, the basic scanning line spacing T 0 is set to 12 pixels, and the conventional scanning moire fringes are formed by superimposing the lattice sample and the scanning lattice having T 0 = 12 pixels. Can be generated.
次に、図9(c)にT(1)=T0=12画素のサンプリング間隔(走査間隔に該当する)でのダウンサンプリングと輝度補間より得られるサンプリングモアレ縞は図9(b)と同様に従来のモアレ縞を生成することができる。
従って、以降はサンプリングモアレを試料格子と走査線の干渉より得られる重畳モアレと走査モアレの代わりに、異なる走査解像度の場合の比較として使用した。
Next, in FIG. 9 (c), the sampling moire fringes obtained by downsampling and brightness interpolation at the sampling interval of T (1) = T 0 = 12 pixels (corresponding to the scanning interval) are the same as in FIG. 9 (b). It is possible to generate conventional moire fringes.
Therefore, hereafter, the sampling moiré is used as a comparison in the case of different scanning resolutions instead of the superimposed moiré and the scanning moiré obtained by the interference between the sample grid and the scanning line.
図9(c)と同様にT(2)=24画素, T(3)=36画素, T(4)=48画素の異なるサンプリング間隔でダウンサンプリング(縦方向の間引き処理)と輝度補間の画像処理より得られるモアレ縞を、それぞれ図9(d)、図9(e)、図9(f)に示す。 Image of downsampling (vertical thinning process) and luminance interpolation at different sampling intervals of T (2) = 24 pixels, T (3) = 36 pixels, T (4) = 48 pixels as in FIG. 9 (c). The moire fringes obtained by the treatment are shown in FIGS. 9 (d), 9 (e), and 9 (f), respectively.
この結果からnの値(n=1, 2, 3, 4)に依らず、生成されるモアレ縞のピッチ間隔は変わらないことを確認できる。
すなわち、走査線間隔T(n)は基本的な走査線間隔T0のn倍であれば、モアレ縞の間隔は変わらないことを意味する。
From this result, it can be confirmed that the pitch interval of the generated moire fringes does not change regardless of the value of n (n = 1, 2, 3, 4).
That is, if the scanning line spacing T (n) is n times the basic scanning line spacing T 0 , it means that the spacing of the moire fringes does not change.
ただし、図9(a)〜図9(f)中に示すモアレ縞画像のグレースケールの範囲は−1から1まで同じであり、得られるモアレ縞画像のコントラストはnの増加に伴ってわずかに減少する。
しかし、シミュレーション及び実際の実験では、画像のヒストグラムを調整することで、モアレ縞画像のコントラストを高くすることができる。
本シミュレーション結果から、従来の走査モアレ法で得られるモアレ縞の間隔と、高速走査モアレ法で得られるモアレ縞の間隔が変わらないことを確認できる。
However, the grayscale range of the moire fringe image shown in FIGS. 9 (a) to 9 (f) is the same from -1 to 1, and the contrast of the obtained moire fringe image is slightly increased as n increases. Decrease.
However, in simulations and actual experiments, the contrast of moire fringe images can be increased by adjusting the histogram of the image.
From the results of this simulation, it can be confirmed that the spacing of the moire fringes obtained by the conventional scanning moire method and the spacing of the moire fringes obtained by the high-speed scanning moire method do not change.
レーザ走査型顕微鏡での実験からも、高速走査モアレ縞と従来のモアレ縞の関係を示す観察結果が得られる。
図10にUVナノインプリントリソグラフィよりシリコンウェハ上に作製した0.79μmのピッチを有する交差格子を示す。
Experiments with a laser scanning microscope also provide observation results showing the relationship between high-speed scanning moire fringes and conventional moire fringes.
FIG. 10 shows a cross grid having a pitch of 0.79 μm prepared on a silicon wafer by UV nanoimprint lithography.
作製した試料格子を有するシリコンウェハを、次にレーザ走査型顕微鏡(レーザーテックハイブリッドL3-URW)の試料台上に載置した。
レーザ走査顕微鏡を用いた顕微鏡画像を撮影する際に、y方向に走査線数を1024、512及び256ラインに変更することができる。
The silicon wafer having the prepared sample grid was then placed on the sample table of a laser scanning microscope (Lasertec Hybrid L3-URW).
When taking a microscope image using a laser scanning microscope, the number of scanning lines can be changed to 1024, 512 and 256 lines in the y direction.
20倍の倍率の対物レンズで、y方向に走査線数を512に設定した場合、走査線間隔は試料格子ピッチ(p=0.79μm)に近いT(1)=T0=0.726μmに相当する。
従って、試料格子ピッチ0.79μmと走査線間隔0.726μmの干渉から、図9(a)に示すように従来の走査モアレ縞画像を生成できる。
When the number of scanning lines is set to 512 in the y direction with a 20x magnification objective lens, the scanning line spacing corresponds to T (1) = T 0 = 0.726 μm, which is close to the sample grid pitch (p = 0.79 μm). ..
Therefore, a conventional scanning moire fringe image can be generated as shown in FIG. 9A from the interference between the sample lattice pitch of 0.79 μm and the scanning line spacing of 0.726 μm.
同じ対物レンズを用いて、走査線数を256ラインに設定したときに、走査線間隔はT(2)=2T0=1.452μmに該当する。
この場合、試料格子ピッチ0.79μmの倍である1.58μmと走査線間隔1.452μmの干渉から、図11(b)に示すように低解像度走査モアレ縞画像が得られる。
When the number of scanning lines is set to 256 using the same objective lens, the scanning line spacing corresponds to T (2) = 2T 0 = 1.452 μm.
In this case, a low-resolution scanning moire fringe image can be obtained as shown in FIG. 11B from the interference between 1.58 μm, which is twice the sample lattice pitch of 0.79 μm, and the scanning line spacing of 1.452 μm.
ここで図11(c)と図11(d)に正方形で囲んだ同じ領域での走査モアレ縞の拡大画像を示す。
図11(c)と図11(d)から、高速走査モアレ縞と従来の走査モアレ縞のピッチ間隔は同じであり、モアレ縞の輝度値分布もほぼ同じであることを確認できる。
Here, FIGS. 11 (c) and 11 (d) show enlarged images of scanning moire fringes in the same area surrounded by a square.
From FIGS. 11 (c) and 11 (d), it can be confirmed that the pitch intervals of the high-speed scanning moire fringes and the conventional scanning moire fringes are the same, and the luminance value distribution of the moire fringes is also substantially the same.
このことから、高速走査モアレ縞を用いて従来の走査モアレ法と同様に材料の変位ひずみ分布を算出できることを示唆している。 This suggests that the displacement strain distribution of the material can be calculated by using the high-speed scanning moiré fringes in the same manner as the conventional scanning moiré method.
2.高速走査モアレ法の変形測定と検証
この実施例では、従来の走査モアレ法と比較することで、本発明である第1手法の高速走査モアレ法の変形測定精度を確認する。
2. 2. Deformation measurement and verification of the high-speed scanning moire method In this embodiment, the deformation measurement accuracy of the high-speed scanning moire method of the first method of the present invention is confirmed by comparing with the conventional scanning moire method.
式(8)及び式(9)による、図11(c)と図11(d)にレーザ走査モアレ縞から、基本的な走査線(T0=0.726μm)に対して、格子試料の変形分布を算出した。 Deformation distribution of the lattice sample from the laser scanning moire fringes in FIGS. 11 (c) and 11 (d) according to the equations (8) and (9) with respect to the basic scanning line (T 0 = 0.726 μm). Was calculated.
ここでは2つのモアレ縞の間の変位を、1方向の放物線補間(2次補間)法から得た。
半微分ステップの値が10である場合、図11(c)に示すT(1)=0.726 μmで得られたモアレ縞画像から算出した変位分布とひずみ分布をそれぞれ図12(a)と図12(b)にプロットした。
Here, the displacement between the two moire fringes was obtained from a one-way parabolic interpolation (secondary interpolation) method.
When the value of the semi-differentiability step is 10, the displacement distribution and the strain distribution calculated from the moire fringe image obtained at T (1) = 0.726 μm shown in FIG. 11 (c) are shown in FIGS. 12 (a) and 12 respectively. Plotted in (b).
また図11(d)に示すT(2)=1.452μmで得られたモアレ縞画像から算出した変位分布とひずみ分布をそれぞれ図12(c)と図12(d)にプロットした。
基本的な走査線(T0=0.726μm)に対して、異なる半微分ステップにおける、図13(a)に示すT(1)=0.726μmから得られた平均ひずみ値は0.08992であり、T(2)=1.452μmから得られた平均ひずみ値は0.08981である。
Further, the displacement distribution and the strain distribution calculated from the moire fringe image obtained at T (2) = 1.452 μm shown in FIG. 11 (d) are plotted in FIGS. 12 (c) and 12 (d), respectively.
For a basic scan line (T 0 = 0.726 μm), the average strain value obtained from T (1) = 0.726 μm shown in FIG. 13 (a) in different semi-differentiability steps is 0.08992, and T ( 2) The average strain value obtained from 1.452 μm is 0.08981.
従来の走査モアレ法(T(1)=T0=0.726 μm)の結果と比較すると、T(2)=1.452 μmのときの高速走査モアレ法からのひずみの相対差はわずか0.12%である。
これらの変位分布とひずみ分布間のわずかな差異は、主に画像撮影時に発生した振動と外部ノイズに起因するものと考えられる。
Compared with the result of the conventional scanning moiré method (T (1) = T 0 = 0.726 μm), the relative difference in strain from the high-speed scanning moiré method when T (2) = 1.452 μm is only 0.12%.
It is considered that these slight differences between the displacement distribution and the strain distribution are mainly due to the vibration and external noise generated during image capture.
図13(b)に示すように、高速走査モアレ法と従来の走査モアレ法を用いて得られたひずみから算出した試料格子ピッチの差は0.2nm以下である。 As shown in FIG. 13 (b), the difference in sample lattice pitch calculated from the strain obtained by using the high-speed scanning moire method and the conventional scanning moire method is 0.2 nm or less.
これらの結果から、本発明である第1手法の高速走査モアレ法は高速でありながら、従来の走査モアレ法と同程度の計測精度で変位ひずみ分布を算出できることを実証し、本手法の有効性を示した。 From these results, it was demonstrated that the high-speed scanning moiré method of the first method of the present invention can calculate the displacement strain distribution with the same measurement accuracy as the conventional scanning moiré method while being high-speed, and the effectiveness of this method is demonstrated. showed that.
3.二次元(以下、2Dとも言う)走査モアレ縞と高速2D走査モアレ縞の生成
この実施例では、レーザ走査型顕微鏡で二次元走査モアレ縞と高速二次元走査モアレ縞の生成結果を示している。
3. 3. Generation of two-dimensional (hereinafter also referred to as 2D) scanning moire fringes and high-
二次元走査モアレ縞を観察するためには、交差格子は試料格子になることが不可欠である。
先に実施例1と同様に、UVナノインプリントリソグラフィによって、シリコンウェハ上に0.79μmのピッチを有する交差格子(図10と同じ)を作製した。
このとき使用したナノインプリントのレジストはPAK01であった。
In order to observe two-dimensional scanning moire fringes, it is essential that the cross grid becomes a sample grid.
Previously, as in Example 1, a cross grid (same as FIG. 10) having a pitch of 0.79 μm was prepared on a silicon wafer by UV nanoimprint lithography.
The nanoimprint resist used at this time was PAK01.
次に交差試料格子をレーザ走査型顕微鏡で観察した。
y方向の走査点数を512に設定した。
対物レンズの倍率は20倍であるときに、y方向の走査点間隔は試料格子ピッチ(T 0 <P)より少し小さい0.726μmであった。
x方向の走査点間隔は、y方向の走査点の間隔に等しい。
Next, the crossed sample lattice was observed with a laser scanning microscope.
The number of scanning points in the y direction was set to 512.
When the magnification of the objective lens was 20 times, the scanning point spacing in the y direction was 0.726 μm, which was slightly smaller than the sample lattice pitch (T 0 <P) .
The scan point spacing in the x direction is equal to the scan point spacing in the y direction.
試料格子の主方向の一方が水平方向とほぼ平行であったとき、試料格子とレーザ走査点の間の干渉から、図14(a)に示すような二次元レーザ走査モアレ縞を生成できる。 When one of the main directions of the sample grid is substantially parallel to the horizontal direction, the two-dimensional laser scanning moire fringes as shown in FIG. 14A can be generated from the interference between the sample grid and the laser scanning point.
ここで同じく20倍率の対物レンズを用いて走査点数をy方向に256ラインに設定した場合、y方向の走査点間隔は試料格子ピッチの2倍に近い1.452μmであった。
x方向の走査点間隔はまだ0.726μmのままである。
この場合、走査速度は、従来の走査速度より2倍高い。
Here, when the number of scanning points was set to 256 lines in the y direction using the same 20-magnification objective lens, the scanning point interval in the y direction was 1.452 μm, which was close to twice the sample grid pitch.
The scan point spacing in the x direction is still 0.726 μm.
In this case, the scanning speed is twice as high as the conventional scanning speed.
試料格子の主方向の一方が水平方向とほぼ平行であるとき、試料格子とレーザ高速走査点の間の干渉から、図14(b)に示すような高速二次元レーザ走査モアレ縞を得ることができる。
そのモアレ縞のピッチ間隔は従来の走査モアレ法と変わらない。
When one of the main directions of the sample grid is substantially parallel to the horizontal direction, high-speed two-dimensional laser scanning moire fringes as shown in FIG. 14B can be obtained from the interference between the sample grid and the laser high-speed scanning point. it can.
The pitch interval of the moire fringes is the same as that of the conventional scanning moire method.
3.2D走査モアレ法と高速2D走査モアレ法の変形測定と検証
この実施例では、従来の走査モアレ法と比較して、本発明である第2手法の二次元走査モアレ法と、本発明である第3手法の高速二次元走査モアレ法の変形測定精度を確認する。
二次元走査モアレ法による相対変形を測定するため、図14(a)中の正方形領域を評価した。
3.2 Deformation measurement and verification of the 2D scanning moiré method and the high-
The square region in FIG. 14A was evaluated in order to measure the relative deformation by the two-dimensional scanning moire method.
図14(a)に示すように、二次元走査モアレ縞の評価領域の面積は217.7×217.7 μm2であった。
フーリエ変換と逆フーリエ変換の画像処理を用いて適切な周波数分離処理を施すことで、図15(a)の二次元モアレパターンをそれぞれ、x方向の一次元モアレ縞画像(図15(b))とy方向の一次元モアレ縞画像(図15(c))に分離することができる。
As shown in FIG. 14A, the area of the evaluation region of the two-dimensional scanning moire fringes was 217.7 × 217.7 μm 2 .
By performing appropriate frequency separation processing using the image processing of the Fourier transform and the inverse Fourier transform, the two-dimensional moire patterns of FIG. 15 (a) are converted into the one-dimensional moire fringe images in the x direction (FIG. 15 (b)). It can be separated into a one-dimensional moire fringe image (FIG. 15 (c)) in the y direction.
また図16(a)に、高速二次元走査モアレ法による相対変形を測定するため、図14(b)中の正方形領域を示す。
なお、図15(a)と図16(a)の領域は同じである。
フーリエ変換と逆フーリエ変換の画像処理を用いて適切な周波数分離処理を施すことで、図16(a)の二次元モアレパターンをそれぞれ、x方向の一次元モアレ縞画像(図16(b))とy方向の一次元モアレ縞画像(図16(c))に分離することができる。
Further, FIG. 16A shows a square region in FIG. 14B in order to measure the relative deformation by the high-speed two-dimensional scanning moire method.
The areas of FIGS. 15 (a) and 16 (a) are the same.
By performing appropriate frequency separation processing using the image processing of the Fourier transform and the inverse Fourier transform, the two-dimensional moire patterns of FIG. 16 (a) are converted into the one-dimensional moire fringe images in the x direction (FIG. 16 (b)). It can be separated into a one-dimensional moire fringe image (FIG. 16 (c)) in the y direction.
式(11)によれば、x方向及びy方向の走査点に対して試料格子の変位が得られる。
式(12)を用いて、これら2つの方向の走査点に対して試料格子のひずみを算出できる。
図17に二次元走査モアレ法と高速二次元走査モアレ法より算出した相対ひずみの平均値を示す。
According to the equation (11), the displacement of the sample grid can be obtained with respect to the scanning points in the x-direction and the y-direction.
Equation (12) can be used to calculate the strain of the sample grid for the scanning points in these two directions.
FIG. 17 shows the average value of the relative strain calculated by the two-dimensional scanning moire method and the high-speed two-dimensional scanning moire method.
この2つのモアレ法から測定したx方向又はy方向の相対ひずみはほぼ同じであることがわかる。
x方向の相対ひずみは0.091であり、y方向の相対ひずみは0.090である。
両方が従来の走査モアレ法から得られたひずみ値である0.090とよく一致している。
It can be seen that the relative strains in the x-direction or the y-direction measured from these two moire methods are almost the same.
The relative strain in the x direction is 0.091, and the relative strain in the y direction is 0.090.
Both are in good agreement with the strain value of 0.090 obtained from the conventional scanning moiré method.
二次元走査モアレ法と高速二次元走査モアレ法の変形測定精度も、算出した試料格子ピッチから検証することができる。 The deformation measurement accuracy of the two-dimensional scanning moire method and the high-speed two-dimensional scanning moire method can also be verified from the calculated sample lattice pitch.
図17(b)に示すように、二次元走査モアレ法と高速二次元走査モアレ法から算出した試料格子ピッチがほぼ同じである。
ここで測定した試料格子ピッチは、x方向では0.792μmであり、y方向では0.791μmである。
x方向とy方向にピッチの差はわずか1nmのみであることから高精度な測定が実現できているといえる。
As shown in FIG. 17B, the sample lattice pitches calculated from the two-dimensional scanning moire method and the high-speed two-dimensional scanning moire method are substantially the same.
The sample lattice pitch measured here is 0.792 μm in the x direction and 0.791 μm in the y direction.
Since the difference in pitch between the x-direction and the y-direction is only 1 nm, it can be said that highly accurate measurement can be realized.
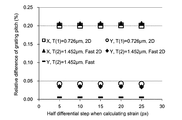
図18に、従来の走査モアレ法より測定した試料格子ピッチ0.7904μmに対して、二次元走査モアレ法と高速二次元走査モアレ法より測定した試料格子ピッチの相対差をプロットした。
図18に示すとおり、算出した試料格子ピッチの相対差はx方向では0.2%であり、y方向では0.05%である。
In FIG. 18, the relative difference between the sample lattice pitch measured by the two-dimensional scanning moire method and the high-speed two-dimensional scanning moire method is plotted against the sample lattice pitch of 0.7904 μm measured by the conventional scanning moire method.
As shown in FIG. 18, the calculated relative difference of the sample lattice pitch is 0.2% in the x direction and 0.05% in the y direction.
これらの結果から本発明である第2手法の二次元走査モアレ法、と本発明である第3手法の高速二次元走査モアレ法は、従来の走査モアレ法と同程度の計測精度で変位・ひずみ分布を算出できることを実証し、本手法の有効性を示した。 From these results, the two-dimensional scanning moiré method of the second method of the present invention and the high-speed two-dimensional scanning moiré method of the third method of the present invention displace and distort with the same measurement accuracy as the conventional scanning moiré method. We demonstrated that the distribution can be calculated and demonstrated the effectiveness of this method.
さらに、二次元走査モアレ法は、試料や走査方向を回転させることなく、単一の二次元モアレ縞を使用して、二次元の変位とひずみ分布を測定することができる。
高速二次元走査モアレ法は、高速と簡便な二次元変形測定の両方の利点を有する。
In addition, the two-dimensional scanning moiré method can measure two-dimensional displacement and strain distribution using a single two-dimensional moiré fringe without rotating the sample or scanning direction.
The high-speed two-dimensional scanning moiré method has the advantages of both high-speed and simple two-dimensional deformation measurement.
4.高速CCD又はCMOSカメラへの拡張
図8は提案した高速CCD又はCMOSカメラ装置の概略図である
4. Extension to High Speed CCD or CMOS Camera FIG. 8 is a schematic diagram of the proposed high speed CCD or CMOS camera device.
図8右上は高速一次元モアレ縞画像記録モード、図8右下は高速二次元モアレ縞画像記録モードを表す図である。
CCD/CMOS検出装置(イメージセンサ)を用い、縦横に整列した基本撮像素子間隔の縦または横、または縦横の各整数倍の撮像素子列に記録し、記録された輝度情報を取り出して、実施例1乃至実施例4に示したように、モアレ縞画像処理すればよい。
The upper right of FIG. 8 shows the high-speed one-dimensional moire fringe image recording mode, and the lower right of FIG. 8 shows the high-speed two-dimensional moire fringe image recording mode.
Using a CCD / CMOS detection device (image sensor), recording is performed in an image sensor sequence that is vertically or horizontally aligned with the basic image sensor spacing, or an integral multiple of each of the vertical and horizontal directions, and the recorded luminance information is taken out to obtain an embodiment. As shown in 1 to 4, the moire fringe image processing may be performed.
また、全撮像素子に記録する公知の記録モードでは、測定物の表面に生成されたピッチPの規則格子または規則交差格子のイメージセンサにおけるピッチpに従って、実施例1乃至実施例4に示したように、基本撮像素子間隔の縦または横、または縦横の各整数倍の撮像素子列に記録し、記録された輝度情報を取り出してアレ縞画像処理すればよい。
こうすると、画像処理の高速化を図る事ができる。
Further, in the known recording mode of recording on all the image pickup devices, as shown in Examples 1 to 4, according to the pitch p in the image sensor of the regular grid or the regular cross grid of the pitch P generated on the surface of the object to be measured. In addition, it may be recorded in an image sensor array that is an integral multiple of the vertical or horizontal or vertical and horizontal intervals of the basic image sensor, and the recorded luminance information may be taken out and processed as a grid image.
By doing so, it is possible to speed up the image processing.
また以上の実施例の画像処理は、パーソナルコンピュータにおいてプログラムを作成しておよび画像処理ツールを用いて行ったが、当該処理手段を備える走査型顕微鏡装置上で行ってもよいし、また、そのプログラム等を分割して走査型顕微鏡装置とパーソナルコンピュータで協同して行ってもよい。 Further, although the image processing of the above examples is performed by creating a program in a personal computer and using an image processing tool, it may be performed on a scanning microscope device provided with the processing means, or the program thereof. Etc. may be divided and performed in cooperation with a scanning microscope device and a personal computer.
本発明の画像の演算処理は、パーソナルコンピュータ上のC/C++プログラムにより実行して計測結果を求めたが、プログラムの種類は本発明を実施する計測実行環境により適宜変更することができる。 The image arithmetic processing of the present invention is executed by a C / C ++ program on a personal computer to obtain the measurement result, but the type of the program can be appropriately changed depending on the measurement execution environment in which the present invention is carried out.
またプログラムは内蔵式、組み込み式(Imbedded)、読み込み式、あるいはダウンロード方式を問わない。 The program can be embedded, embedded, read, or downloadable.
本発明である高速二次元走査モアレ法は、航空宇宙、自動車、電子パッケージ、バイオ医薬などの産業分野における材料の全視野変位ひずみ測定に有用である。
好適には、強化プラスチック、金属複合材料、セラミック複合材料、積層材料、フィルム/基板構造、パッケージ構造、などの金属、ポリマー、セラミック、半導体、複合材料及び構造を含む各種材料の変形を解析するのに適している。
特に以下の3つの材料評価に有効である。
1.亀裂発生、亀裂伝播および損傷挙動の評価
2.界面最適設計のための界面接合性能の評価
3.機械特性、残留応力および構造物の健全性評価
The high-speed two-dimensional scanning moire method of the present invention is useful for measuring the full-field displacement strain of a material in industrial fields such as aerospace, automobiles, electronic packaging, and biopharmaceuticals.
Preferably, it analyzes deformations of various materials including metals, polymers, ceramics, semiconductors, composites and structures such as reinforced plastics, metal composites, ceramic composites, laminated materials, film / substrate structures, package structures, etc. Suitable for.
It is particularly effective for the following three material evaluations.
1. 1. Evaluation of crack generation, crack propagation and
1 試料表面の格子
2,3,4,5 参照格子
6 走査線・サンプリング列
7 公知の走査モアレ縞・公知のサンプリングモアレ縞
8 高速走査線・高速サンプリング列
9 高速走査モアレ縞・高速サンプリングモアレ縞
10 走査点・サンプリング点
11 主方向がx方向の走査線・サンプリング列
12 主方向がy方向の走査線・サンプリング列
13 顕微鏡(走査型レーザ顕微鏡、走査型電子顕微鏡、走査型プローブ顕微鏡など)
14 機械荷重(引張、圧縮、3点曲げ)
15 並進・回転荷重
16 熱負荷
17 電気負荷
18 CCD/CMOS検出装置(イメージセンサ)
19 対物レンズ
20 公知の記録モード
21 高速一次元モアレ縞記録モード
22 高速二次元モアレ縞記録モード
1
14 Mechanical load (tension, compression, 3-point bending)
15 Translation /
19
Claims (11)
試料台に載置されその表面に一方向にピッチp(pはT0に近接する)の規則格子が生成された試料の表面を前記走査型顕微鏡の走査線により走査して前記試料の表面のモアレ縞画像を取得し、
取得した前記モアレ縞画像の走査点の輝度情報から前記試料の変位ひずみ量を計算し、
計算した前記試料の変位ひずみ量を表示する、
走査モアレ方法による変位ひずみ分布測定システムであって、
前記走査型顕微鏡の走査線間隔T(n)を前記ピッチpのn倍(nは2以上の整数)の近傍であるnT 0 とし前記規則格子と前記走査点が不一致またはずれが生じるようにしたことを特徴とする、変位ひずみ分布測定システム。 A scanning microscope having scanning lines consisting of vertical and horizontal scanning points and capable of scanning at intervals of integral multiples of the basic scanning line spacing T 0 ( integer is 1 or more) is provided.
The surface of the sample placed on the sample table and having a regular lattice with a pitch p (p is close to T 0 ) in one direction is scanned by the scanning line of the scanning microscope to scan the surface of the sample. Get a moiré striped image,
The displacement strain amount of the sample was calculated from the luminance information of the scanning points of the acquired moire fringe image.
Display the calculated displacement strain amount of the sample,
This is a displacement strain distribution measurement system using the scanning moire method.
The scanning line spacing T (n) of the scanning microscope was set to nT 0 , which is near n times the pitch p (n is an integer of 2 or more), so that the regular grid and the scanning points are inconsistent or displaced. A displacement strain distribution measurement system characterized by this.
The strain amount ε actual (n) is obtained from the geometrical relationship of the ordered lattice before and after the deformation (the following equation (10)).
試料台に載置されその表面に直交する二方向にピッチp(pはT0に近接する)の規則交差格子が生成された試料の表面を前記走査型顕微鏡の走査線により走査して前記試料の表面の2次元モアレ縞画像を取得し、
取得した前記2次元モアレ縞画像の走査点の輝度情報から前記試料の変位ひずみ量を計算し、
計算した前記試料の変位ひずみ量を表示する、
走査モアレ方法による変位ひずみ分布測定システムであって、
前記走査型顕微鏡の直交する二方向の走査線間隔Tx (n x )、Ty (n y )をそれぞれ前記ピッチpのn x 倍、n y 倍(n x とn y の一方は1以上の整数であり、他方は2以上の整数)の近傍であるn x T 0 、n y T 0 とし、
前記規則交差格子と前記走査線間隔Tx (n x )、Ty (n y )の走査点とを近接して配置し前記規則交差格子と前記走査点が不一致またはずれが生じるようにしたことを特徴とする、変位ひずみ分布測定システム。 A scanning microscope having scanning lines consisting of scanning points capable of scanning at intervals ( an integer of 1 or more) that is an integral multiple of the basic scanning line spacing T 0 in the vertical and horizontal directions is provided.
The sample is placed on a sample table and the surface of a sample in which a regular crossing lattice having a pitch p (p is close to T 0 ) is generated in two directions orthogonal to the surface of the sample is scanned by a scanning line of the scanning microscope. Obtain a two-dimensional moiré fringe image of the surface of the
The displacement strain amount of the sample was calculated from the luminance information of the scanning points of the acquired two-dimensional moire fringe image.
Display the calculated displacement strain amount of the sample,
This is a displacement strain distribution measurement system using the scanning moire method.
The scanning line spacings T x (n x ) and T y ( ny ) in two orthogonal directions of the scanning microscope are set to n x times and n y times of the pitch p, respectively (one of n x and n y is 1 or more). The other is an integer of 2 or more), and n x T 0 , n y T 0 .
The regular cross grid and the scanning points of the scanning line spacings T x (n x ) and T y ( ny ) are arranged close to each other so that the regular cross grid and the scanning points are inconsistent or displaced. Displacement strain distribution measurement system.
取得した前記2次元モアレ縞画像の撮像素子に記憶された輝度情報から前記測定物の変位ひずみ量を計算し、
計算した前記測定物の変位ひずみ量を表示する、
サンプリングモアレ方法による変位ひずみ分布測定システムであって、
前記イメージセンサにおける撮像素子列のピッチは、前記規則交差格子の前記ピッチPの整数倍(整数は1以上)またはその近傍であり、かつ、
前記二方向のうち少なくとも一方向の撮像素子列のピッチは、前記規則交差格子の前記ピッチPの2以上の整数倍またはその近傍であることを特徴とする、変位ひずみ分布測定システム。 Using an imaging device equipped with at least an objective lens and an image sensor composed of image sensors aligned in two directions, the surface of the object to be measured in which a regular cross grid of pitch P is generated in the two directions is photographed. Get a 2D moire fringe image
The displacement strain amount of the measured object is calculated from the luminance information stored in the image sensor of the acquired two-dimensional moire fringe image.
Display the calculated displacement strain amount of the measured object,
This is a displacement strain distribution measurement system using the sampling moiré method.
The pitch of the image sensor train in the image sensor is an integral multiple (an integer is 1 or more) of the pitch P of the regular cross grid or its vicinity, and is
A displacement strain distribution measurement system, characterized in that the pitch of the image sensor train in at least one of the two directions is an integral multiple of two or more of the pitch P of the regular cross grid or its vicinity .
前記走査型顕微鏡における試料台に載置された前記試料の表面を前記走査型顕微鏡の走査線により走査することで得られた前記試料の表面のモアレ縞画像を取得し、
取得した前記モアレ縞画像の走査点の輝度情報から前記試料の変位ひずみ量を計算し、
計算した前記試料の変位ひずみ量を表示する、
処理を実行させるためのプログラム。 A scanning microscope composed of vertical and horizontal scanning points and having scanning lines capable of scanning at intervals (integers are 1 or more) that are integral multiples of the basic scanning line spacing T 0 , wherein the scanning line spacing T (n) of the scanning microscope is used. Is nT 0 , which is near n times the pitch p (n is an integer of 2 or more) of the sample in which a regular lattice of pitch p (p is close to T 0 ) is generated on the surface thereof in one direction. To a computer in a variation strain distribution measurement system by the scanning moire method, which has a scanning microscope in which the ordered lattice and the scanning points are inconsistent or deviated.
A moire fringe image of the surface of the sample obtained by scanning the surface of the sample placed on the sample table of the scanning microscope with the scanning lines of the scanning microscope was acquired.
The displacement strain amount of the sample was calculated from the luminance information of the scanning points of the acquired moire fringe image.
Display the calculated displacement strain amount of the sample,
A program for executing processing.
前記走査型顕微鏡における試料台に載置された前記試料の表面を前記走査型顕微鏡の走査線により走査することで得られた前記試料の表面の2次元モアレ縞画像を取得し、
取得した前記2次元モアレ縞画像の走査点の輝度情報から前記試料の変位ひずみ量を計算し、
計算した前記試料の変位ひずみ量を表示する、
処理を実行させるためのプログラム。 (An integer of 1 or more) integer multiple of the spacing of the basic scanning line interval T 0 vertically and horizontally a scanning microscope having a scanning line consisting of the scanned points can scan in, two directions of scanning lines perpendicular of the scanning microscope The pitch p of the sample in which a regular crossed lattice of pitch p (p is close to T 0 ) is generated in two directions orthogonal to the surface of each of the intervals T x (n x ) and T y ( ny ). N x T 0 and n y T 0 , which are in the vicinity of n x times and n y times (one of n x and n y is an integer of 1 or more and the other is an integer of 2 or more), and the rule crossing lattice It has a scanning microscope in which the scanning line spacing T x (n x ) and the scanning points of T y ( ny ) are arranged close to each other so that the ordered intersecting lattice and the scanning points are inconsistent or deviated. , To the computer in the mutation strain distribution system by the scanning moire method,
A two-dimensional moire fringe image of the surface of the sample obtained by scanning the surface of the sample placed on the sample table of the scanning microscope with the scanning lines of the scanning microscope was acquired.
The displacement strain amount of the sample was calculated from the luminance information of the scanning points of the acquired two-dimensional moire fringe image.
Display the calculated displacement strain amount of the sample,
A program for executing processing.
取得した前記2次元モアレ縞画像の撮像素子に記憶された輝度情報から前記測定物の変位ひずみ量を計算し、
計算した前記測定物の変位ひずみ量を表示する、
処理をコンピュータに実行させるためのプログラム。 An imaging device including at least an objective lens and an image sensor composed of image sensors aligned in two directions, wherein the pitch of the image sensor array in the image sensor is a regular crossing lattice having a pitch P in the two directions on the surface thereof. Is an integral multiple of the pitch P of the measured object (an integer is 1 or more) or its vicinity, and the pitch of the image sensor train in at least one of the two directions is 2 or more of the pitch P. A two-dimensional moire fringe image obtained by photographing the surface of the measured object using an imaging device that is an integral multiple or its vicinity is acquired.
The displacement strain amount of the measured object is calculated from the luminance information stored in the image sensor of the acquired two-dimensional moire fringe image.
Display the calculated displacement strain amount of the measured object,
A program that lets a computer perform processing.
Priority Applications (1)
| Application Number | Priority Date | Filing Date | Title |
|---|---|---|---|
| JP2016028169A JP6813162B2 (en) | 2016-02-17 | 2016-02-17 | High-speed displacement / strain distribution measurement method and measuring device by moire method |
Applications Claiming Priority (1)
| Application Number | Priority Date | Filing Date | Title |
|---|---|---|---|
| JP2016028169A JP6813162B2 (en) | 2016-02-17 | 2016-02-17 | High-speed displacement / strain distribution measurement method and measuring device by moire method |
Publications (3)
| Publication Number | Publication Date |
|---|---|
| JP2017146202A JP2017146202A (en) | 2017-08-24 |
| JP2017146202A5 JP2017146202A5 (en) | 2019-03-07 |
| JP6813162B2 true JP6813162B2 (en) | 2021-01-13 |
Family
ID=59682935
Family Applications (1)
| Application Number | Title | Priority Date | Filing Date |
|---|---|---|---|
| JP2016028169A Active JP6813162B2 (en) | 2016-02-17 | 2016-02-17 | High-speed displacement / strain distribution measurement method and measuring device by moire method |
Country Status (1)
| Country | Link |
|---|---|
| JP (1) | JP6813162B2 (en) |
Families Citing this family (7)
| Publication number | Priority date | Publication date | Assignee | Title |
|---|---|---|---|---|
| US10655954B2 (en) | 2016-09-27 | 2020-05-19 | National Institute Of Advanced Industrial Science And Technology | Three-dimensional shape, displacement, and strain measurement device and method using periodic pattern, and program therefor |
| CN108196091B (en) * | 2018-03-30 | 2024-01-26 | 南京邮电大学 | Photoelectric acceleration sensor based on CMOS |
| CN108469443A (en) * | 2018-04-18 | 2018-08-31 | 北京航空航天大学 | X-ray grating differential phase contrast imaging method and device based on two dimension dislocation absorption grating |
| CN110068284B (en) * | 2019-05-20 | 2020-10-30 | 北京建筑大学 | Method for monitoring tower crane by using high-speed photogrammetry technology |
| CN110398201B (en) * | 2019-08-06 | 2021-08-06 | 湖南大学 | Displacement measuring method combining digital image correlation technique and Moire sampling method |
| CN111325718B (en) * | 2020-01-23 | 2023-07-25 | 深圳大学 | Strain modal analysis method and related device |
| CN113720268B (en) * | 2021-08-03 | 2022-10-25 | 西安交通大学 | Digital moire method, system, equipment and storage medium for measuring strain based on light intensity principle |
-
2016
- 2016-02-17 JP JP2016028169A patent/JP6813162B2/en active Active
Also Published As
| Publication number | Publication date |
|---|---|
| JP2017146202A (en) | 2017-08-24 |
Similar Documents
| Publication | Publication Date | Title |
|---|---|---|
| JP6813162B2 (en) | High-speed displacement / strain distribution measurement method and measuring device by moire method | |
| JP6583761B2 (en) | Three-dimensional shape / displacement / strain measuring device, method and program using periodic pattern | |
| JP5818218B2 (en) | Method, apparatus, and program for analyzing phase distribution of fringe image using high-dimensional luminance information | |
| JP4831703B2 (en) | Object displacement measurement method | |
| JP6983402B2 (en) | Strain distribution measurement method and its program that are not easily affected by dirt | |
| JP6753592B2 (en) | Deformation measuring method, deformation measuring device, and its program | |
| JP2017146202A5 (en) | ||
| JP5160520B2 (en) | Crystal lattice moire pattern acquisition method and scanning microscope | |
| KR20190121342A (en) | Residual Heat Strain Measurement Method, Residual Heat Strain Measurement Device, and Program thereof | |
| CN112697063B (en) | Chip strain measurement method based on microscopic vision | |
| JP2007240465A (en) | Method and instrument for measuring three-dimensional displacement and distortion | |
| JP6472675B2 (en) | Deformation measurement method not affected by microscope scanning distortion due to secondary moire fringes | |
| Bhushan et al. | Displacement and strain field measurements from SPM images | |
| JP6533914B2 (en) | Computer readable recording medium recording measurement method, measurement device, measurement program and measurement program | |
| CN101819217A (en) | Method for inverting micro-nano planar periodic structure | |
| JP2005121552A (en) | Lattice strain measuring device and measuring method | |
| JP2019152498A (en) | Out-of-plane displacement measuring method using two-dimensional grating pattern and device therefor | |
| JP2004077247A (en) | Method and apparatus for measuring grid distortion in local area using convergent beam electron diffraction method | |
| JP6755492B2 (en) | Visualization method of material defect distribution by moiré and its automatic detection method, program, equipment | |
| CN108921794B (en) | Dynamic image reconstruction method and device under scanning imaging mode | |
| JP4820998B2 (en) | Phase singularity detection method, phase singularity detection apparatus, and program | |
| JP3439405B2 (en) | Strain detection microscope image processing apparatus and method | |
| JP2008111726A (en) | Three-dimensional phase measurement method, and differential interference microscope used for same | |
| JP2022096690A (en) | Image processing method, apparatus, and program | |
| JP6942341B2 (en) | Wide measurement range deformation measurement method and its program |
Legal Events
| Date | Code | Title | Description |
|---|---|---|---|
| A80 | Written request to apply exceptions to lack of novelty of invention |
Free format text: JAPANESE INTERMEDIATE CODE: A80 Effective date: 20160226 |
|
| A521 | Request for written amendment filed |
Free format text: JAPANESE INTERMEDIATE CODE: A523 Effective date: 20180601 |
|
| A521 | Request for written amendment filed |
Free format text: JAPANESE INTERMEDIATE CODE: A523 Effective date: 20190123 |
|
| A621 | Written request for application examination |
Free format text: JAPANESE INTERMEDIATE CODE: A621 Effective date: 20190124 |
|
| A977 | Report on retrieval |
Free format text: JAPANESE INTERMEDIATE CODE: A971007 Effective date: 20191122 |
|
| A131 | Notification of reasons for refusal |
Free format text: JAPANESE INTERMEDIATE CODE: A131 Effective date: 20191204 |
|
| A601 | Written request for extension of time |
Free format text: JAPANESE INTERMEDIATE CODE: A601 Effective date: 20200115 |
|
| A131 | Notification of reasons for refusal |
Free format text: JAPANESE INTERMEDIATE CODE: A131 Effective date: 20201007 |
|
| A521 | Request for written amendment filed |
Free format text: JAPANESE INTERMEDIATE CODE: A523 Effective date: 20201126 |
|
| TRDD | Decision of grant or rejection written | ||
| A01 | Written decision to grant a patent or to grant a registration (utility model) |
Free format text: JAPANESE INTERMEDIATE CODE: A01 Effective date: 20201202 |
|
| A61 | First payment of annual fees (during grant procedure) |
Free format text: JAPANESE INTERMEDIATE CODE: A61 Effective date: 20201210 |
|
| R150 | Certificate of patent or registration of utility model |
Ref document number: 6813162 Country of ref document: JP Free format text: JAPANESE INTERMEDIATE CODE: R150 |
|
| R250 | Receipt of annual fees |
Free format text: JAPANESE INTERMEDIATE CODE: R250 |