JP5798526B2 - X-ray analyzer, X-ray analysis system, X-ray analysis method, and X-ray analysis program - Google Patents
X-ray analyzer, X-ray analysis system, X-ray analysis method, and X-ray analysis program Download PDFInfo
- Publication number
- JP5798526B2 JP5798526B2 JP2012159863A JP2012159863A JP5798526B2 JP 5798526 B2 JP5798526 B2 JP 5798526B2 JP 2012159863 A JP2012159863 A JP 2012159863A JP 2012159863 A JP2012159863 A JP 2012159863A JP 5798526 B2 JP5798526 B2 JP 5798526B2
- Authority
- JP
- Japan
- Prior art keywords
- ray
- pixel
- pixels
- distribution
- ray analysis
- Prior art date
- Legal status (The legal status is an assumption and is not a legal conclusion. Google has not performed a legal analysis and makes no representation as to the accuracy of the status listed.)
- Active
Links
Images


Classifications
-
- G—PHYSICS
- G01—MEASURING; TESTING
- G01T—MEASUREMENT OF NUCLEAR OR X-RADIATION
- G01T1/00—Measuring X-radiation, gamma radiation, corpuscular radiation, or cosmic radiation
- G01T1/16—Measuring radiation intensity
- G01T1/17—Circuit arrangements not adapted to a particular type of detector
Description
本発明は、画素ごとに決まる離散データのX線強度分布を分布既知の第1の面から分布未知の第2の面へ変換するX線分析装置、X線分析システム、X線分析方法およびX線分析プログラムに関する。 The present invention provides an X-ray analysis apparatus, an X-ray analysis system, an X-ray analysis method, and an X-ray analysis system for converting an X-ray intensity distribution of discrete data determined for each pixel from a first surface with a known distribution to a second surface with an unknown distribution. It relates to a line analysis program.
画像データは通常2次元であるが、観測・測定空間を考えた場合、3次元の直交座標系上のデータとみなすことができる。また、検出器によって測定されたデータは、画素ごとに不連続な値をとり、離散データとして空間的に離散的な情報として表現される。 The image data is usually two-dimensional, but when the observation / measurement space is considered, it can be regarded as data on a three-dimensional orthogonal coordinate system. The data measured by the detector takes discontinuous values for each pixel and is expressed as discrete data as discrete data.
このような直交座標系上の離散データを同一もしくはそれより低い次元へ写像する必要が生じる場合がある。特に、写像元および写像先が離散的なデータ表現となっている写像においては、正方画素かつπ/2の倍数の回転のような特別な変換では1対1の関係が成立しうる。しかし、通常は変換操作が平行移動や回転であっても、データ要素間には1対1の関係が成立しない。 It may be necessary to map such discrete data on the orthogonal coordinate system to the same or lower dimensions. In particular, in a mapping in which the mapping source and mapping destination are discrete data representations, a one-to-one relationship can be established by special transformation such as rotation of square pixels and multiples of π / 2. However, normally, even if the conversion operation is parallel movement or rotation, a one-to-one relationship is not established between data elements.
画像処理の分野において、この問題を近似的に解く手法は古くから存在し、最近傍法や双一次補間法、双三次補間法が広く用いられている。しかし、これらの手法は画素値やその積分値の保存が保証されず、画素値の位置と積分値が重要であるX線回折・散乱法への適用は必ずしも適当とは言えない。 In the field of image processing, methods for approximately solving this problem have existed for a long time, and the nearest neighbor method, bilinear interpolation method, and bicubic interpolation method are widely used. However, these methods do not guarantee the storage of pixel values and their integrated values, and are not necessarily suitable for application to X-ray diffraction / scattering methods where the position and integrated value of pixel values are important.
画素値の位置と積分値が保存される方法として、正方形の写像元の画素を写像先で長方形領域に変形する近似法が提案されている(非特許文献1〜4参照)。しかし、この方法では画素値が保存されるものの、空間周波数の高周波成分に歪みが生じる。また、計数型検出器による測定値が整数に限られ、観測座標系と理想的な観測座標系が一致しない場合がある。例えば、検出器が傾いている場合などには、データ表現を整数値のみで取り扱うことによって整数値への丸め誤差が蓄積されうる。
As a method for storing the position and integral value of the pixel value, an approximation method has been proposed in which a square mapping source pixel is transformed into a rectangular area at the mapping destination (see Non-Patent
このような問題の解決法として、微小要素に分割する方法が提案されている(非特許文献5参照)。しかし、この方法では精度を上げると計算爆発(O[N4])を起こしてしまう。また、三角形分割による方法も知られているが、(非特許文献6)、精度向上のために分割数を多くする必要が生じ計算量が膨大になってしまう。 As a solution to such a problem, a method of dividing into minute elements has been proposed (see Non-Patent Document 5). However, this method causes a computational explosion (O [N4]) when the accuracy is increased. Although a method using triangulation is also known (Non-Patent Document 6), it is necessary to increase the number of divisions for improving accuracy, and the amount of calculation becomes enormous.
本発明は、このような事情に鑑みてなされたものであり、X線強度の積分値を維持して可逆的に変換でき、計算量を低減しつつ高精度にX線強度分布を変換できるX線分析装置、X線分析システム、X線分析方法およびX線分析プログラムを提供することを目的とする。 The present invention has been made in view of such circumstances, and can be converted reversibly while maintaining the integrated value of the X-ray intensity, and the X-ray intensity distribution can be converted with high accuracy while reducing the amount of calculation. An object of the present invention is to provide a line analysis apparatus, an X-ray analysis system, an X-ray analysis method, and an X-ray analysis program.
(1)上記の目的を達成するため、本発明のX線分析装置は、画素ごとに決まる離散データのX線強度分布を分布既知の第1の面から分布未知の第2の面へ変換するX線分析装置であって、第1の面上において画素を特定する格子点および前記格子点間の中間点をノードとして、第2の面へ投影する投影部と、前記投影されたノードにより特定される投影画素を表わす多角形が前記第2の面上の各画素と重複する領域の面積を算出することで、前記投影画素を表わす多角形が前記第2の面上の各画素に対して占める占有率を算出する占有率算出部と、前記占有率に基づいて、前記第1の面上の画素内のX線強度を前記第2の面上の画素へ分配し、X線強度分布を変換する変換部と、を備えることを特徴としている。 (1) In order to achieve the above object, the X-ray analyzer of the present invention converts the X-ray intensity distribution of discrete data determined for each pixel from a first surface with a known distribution to a second surface with an unknown distribution. An X-ray analysis apparatus, comprising: a projection point that projects a second surface with a grid point that identifies a pixel on the first surface and an intermediate point between the grid points as a node; Calculating the area of the region where the polygon representing the projected pixel overlaps with each pixel on the second surface, so that the polygon representing the projected pixel corresponds to each pixel on the second surface An occupancy ratio calculation unit that calculates an occupancy ratio, and based on the occupancy ratio, distributes the X-ray intensity in the pixels on the first surface to the pixels on the second surface, and calculates an X-ray intensity distribution. And a conversion unit for conversion.
このように本発明のX線分析装置は、第1の面上の格子点間の中間点をノードとして投影画素を表わす多角形の第2の面の各画素への占有率を算出するため、投影画素の形状に近い多角形を用いて各占有率を計算でき、高精度にX線強度分布を変換できる。また、投影画素を表わす多角形の面積計算の計算量を低減できる。また、空間分解能を保存でき、測定した物理量を維持することで、強度値を可逆的に単射として変換できる。 As described above, the X-ray analysis apparatus of the present invention calculates the occupancy ratio of each pixel on the second surface of the polygon representing the projected pixel using the intermediate point between the lattice points on the first surface as a node. Each occupation rate can be calculated using a polygon close to the shape of the projection pixel, and the X-ray intensity distribution can be converted with high accuracy. In addition, the amount of calculation of the area of the polygon representing the projection pixel can be reduced. In addition, the spatial resolution can be preserved, and the intensity value can be reversibly converted as injection by maintaining the measured physical quantity.
(2)また、本発明のX線分析装置は、前記第1の面上の画素が、座標軸に平行な直線により区画されていることを特徴としている。これにより、効率的にX線強度分布を変換でき、計算量を低減するとともに精度を向上することができる。この場合、第1の面上の画素は、正方形または長方形である。 (2) Further, the X-ray analyzer of the present invention is characterized in that the pixels on the first surface are partitioned by straight lines parallel to the coordinate axis. Thereby, the X-ray intensity distribution can be efficiently converted, and the calculation amount can be reduced and the accuracy can be improved. In this case, the pixels on the first surface are square or rectangular.
(3)また、本発明のX線分析装置は、前記投影部、占有率算出部、テーブル作成部および変換部が、いずれも実数計算を行なうことを特徴としている。これにより、丸め誤差が生じないため計算の精度を向上できる。 (3) Further, the X-ray analyzer of the present invention is characterized in that the projection unit, the occupation rate calculation unit, the table creation unit, and the conversion unit all perform real number calculation. Thereby, since a rounding error does not arise, the accuracy of calculation can be improved.
(4)また、本発明のX線分析装置は、前記投影部が、前記格子点間を等間隔に1/n(n=整数)に分ける点をノードとして前記第2の面へ投影することを特徴としている。これにより、ノードを用いて表した投影画素の形状を実際の投影画素の形状に近づけることができ、計算の精度が向上する。 (4) Further, in the X-ray analysis apparatus of the present invention, the projection unit projects the points divided into 1 / n (n = integer) between the lattice points at equal intervals onto the second surface. It is characterized by. As a result, the shape of the projection pixel represented by using the node can be brought close to the shape of the actual projection pixel, and the calculation accuracy is improved.
(5)また、本発明のX線分析装置は、前記占有率に基づいて、前記第1の面上の画素内のX線強度を前記第2の面上の画素へ分配するためのテーブルを作成するテーブル作成部を更に備え、前記変換部は、前記作成されたテーブルを用いて、X線強度を前記第1の面上の分布から前記第2の面上の分布へ変換することを特徴としている。このようにテーブルを用いて変換することで、計算量を低減でき、リアルタイムなX線強度分布の変換が可能になる。 (5) Further, the X-ray analyzer of the present invention provides a table for distributing the X-ray intensity in the pixels on the first surface to the pixels on the second surface based on the occupation ratio. A table creating unit for creating, and the converting unit converts the X-ray intensity from the distribution on the first surface to the distribution on the second surface by using the created table. It is said. By converting using the table in this way, the amount of calculation can be reduced, and real-time X-ray intensity distribution conversion can be performed.
(6)また、本発明のX線分析装置は、前記占有率算出部が、並列処理で前記占有率を算出することを特徴としている。これにより、少ないパスでの計算が可能になり、計算効率を向上させることができる。また、その結果、リアルタイム性を向上できる。 (6) Moreover, the X-ray analyzer of the present invention is characterized in that the occupancy rate calculation unit calculates the occupancy rate by parallel processing. As a result, calculation with a small number of paths is possible, and calculation efficiency can be improved. As a result, real-time performance can be improved.
(7)また、本発明のX線分析装置は、前記第1の面をX線の検出器の実際の検出面とし、前記第1の面上の画素を前記実際の検出面の画素とし、前記第2の面をX線の検出器の理想の検出面とし、前記第2の面上の画素を前記理想の検出面の画素として、前記X線強度分布の変換によりデータの補正を行なうことを特徴としている。これにより、アライメントが十分でない場合でもX線検出データを補正できる。また、任意の場所に検出器を設定して測定し、補正したデータを利用することができる。 (7) In the X-ray analysis apparatus of the present invention, the first surface is an actual detection surface of an X-ray detector, and the pixels on the first surface are pixels of the actual detection surface. Using the second surface as an ideal detection surface of an X-ray detector and pixels on the second surface as pixels of the ideal detection surface, data correction is performed by converting the X-ray intensity distribution. It is characterized by. Thereby, X-ray detection data can be corrected even when alignment is not sufficient. In addition, it is possible to use data corrected by setting a detector at an arbitrary place and performing measurement.
(8)また、本発明のX線分析システムは、スキャン方向に並列に配置された複数の検出器と、(7)記載のX線分析装置とを備え、前記X線分析装置が、前記検出器により得られたデータに対して前記補正を行なうことを特徴としている。これにより、ゴニオ機構なしで一度にX線回折データを検出して補正したデータを利用することができる。 (8) Further, the X-ray analysis system of the present invention includes a plurality of detectors arranged in parallel in the scan direction, and the X-ray analyzer according to (7), wherein the X-ray analyzer is configured to detect the detection. The correction is performed on the data obtained by the measuring device. Thereby, it is possible to use data obtained by detecting and correcting X-ray diffraction data at a time without a gonio mechanism.
(9)また、本発明のX線分析システムは、半球面上に配置された複数の検出器と、(7)記載のX線分析装置と、を備え、前記X線分析装置が、前記検出器により得られたデータに対して前記補正を行なうことを特徴としている。これにより、ゴニオ機構なしで一度にX線回折データを検出して補正したデータを利用することができる。 (9) Moreover, the X-ray analysis system of this invention is equipped with the several detector arrange | positioned on a hemisphere, and the X-ray analyzer of (7) description, The said X-ray analyzer is the said detection The correction is performed on the data obtained by the measuring device. Thereby, it is possible to use data obtained by detecting and correcting X-ray diffraction data at a time without a gonio mechanism.
(10)また、本発明のX線分析方法は、画素ごとに決まる離散データのX線強度分布を分布既知の第1の面から分布未知の第2の面へ変換するX線分析方法であって、第1の面上において画素を特定する格子点および前記格子点間の中間点をノードとして、第2の面へ投影するステップと、前記投影されたノードにより特定される投影画素を表わす多角形が前記第2の面上の各画素と重複する領域の面積を算出することで、前記投影画素が表わす多角形が前記第2の面上の各画素に対して占める占有率を算出するステップと、前記占有率に基づいて、前記第1の面上の画素内のX線強度を前記第2の面上の画素へ分配し、X線強度分布を変換するステップと、を含むことを特徴としている。 (10) The X-ray analysis method of the present invention is an X-ray analysis method for converting an X-ray intensity distribution of discrete data determined for each pixel from a first surface with a known distribution to a second surface with an unknown distribution. Projecting to the second surface using a grid point for specifying a pixel on the first surface and an intermediate point between the grid points as nodes, and a projection pixel specified by the projected node. Calculating an occupancy ratio of the polygon represented by the projection pixel to each pixel on the second surface by calculating an area of a region where a square overlaps with each pixel on the second surface. And, based on the occupancy rate, distributing the X-ray intensity in the pixels on the first surface to the pixels on the second surface, and converting the X-ray intensity distribution. It is said.
これにより、投影画素の形状に近い多角形を用いて各占有率を計算でき、高精度にX線強度分布を変換できる。また、投影画素を表わす多角形の面積計算の計算量を低減できる。また、空間分解能を保存でき、測定した物理量を維持することで、強度値を可逆的に単射として変換できる。 Thereby, each occupation rate can be calculated using a polygon close to the shape of the projection pixel, and the X-ray intensity distribution can be converted with high accuracy. In addition, the amount of calculation of the area of the polygon representing the projection pixel can be reduced. In addition, the spatial resolution can be preserved, and the intensity value can be reversibly converted as injection by maintaining the measured physical quantity.
(11)また、本発明のX線分析プログラムは、画素ごとに決まる離散データのX線強度分布を分布既知の第1の面から分布未知の第2の面へ変換するX線分析プログラムであって、第1の面上において画素を特定する格子点および前記格子点間の中間点をノードとして、第2の面へ投影する処理と、前記投影されたノードにより特定される投影画素を表わす多角形が前記第2の面上の各画素と重複する領域の面積を算出することで、前記投影画素を表わす多角形が前記第2の面上の各画素に対して占める占有率を算出する処理と、前記占有率に基づいて、前記第1の面上の画素内のX線強度を前記第2の面上の画素へ分配し、X線強度分布を変換する処理と、をコンピュータに実行させることを特徴としている。 (11) The X-ray analysis program of the present invention is an X-ray analysis program for converting the X-ray intensity distribution of discrete data determined for each pixel from a first surface with a known distribution to a second surface with an unknown distribution. Then, a process of projecting onto the second surface using a grid point for specifying a pixel on the first surface and an intermediate point between the grid points as a node, and a projection pixel specified by the projected node. A process of calculating an occupancy ratio of a polygon representing the projection pixel with respect to each pixel on the second surface by calculating an area of a region where a square overlaps with each pixel on the second surface And a process of distributing the X-ray intensity distribution in the pixels on the first surface to the pixels on the second surface and converting the X-ray intensity distribution based on the occupation ratio. It is characterized by that.
これにより、投影画素の形状に近い多角形を用いて各占有率を計算でき、高精度にX線強度分布を変換できる。また、投影画素を表わす多角形の面積計算の計算量を低減できる。また、空間分解能を保存でき、測定した物理量を維持することで、強度値を可逆的に単射として変換できる。 Thereby, each occupation rate can be calculated using a polygon close to the shape of the projection pixel, and the X-ray intensity distribution can be converted with high accuracy. In addition, the amount of calculation of the area of the polygon representing the projection pixel can be reduced. In addition, the spatial resolution can be preserved, and the intensity value can be reversibly converted as injection by maintaining the measured physical quantity.
本発明によれば、投影画素の形状に近い多角形を用いて各占有率を計算でき、高精度にX線強度分布を変換できる。また、投影画素を表わす多角形の面積計算の計算量を低減できる。また、空間分解能を保存でき、測定した物理量を維持することで、強度値を可逆的に単射として変換できる。 According to the present invention, each occupation rate can be calculated using a polygon close to the shape of the projection pixel, and the X-ray intensity distribution can be converted with high accuracy. In addition, the amount of calculation of the area of the polygon representing the projection pixel can be reduced. In addition, the spatial resolution can be preserved, and the intensity value can be reversibly converted as injection by maintaining the measured physical quantity.
次に、本発明の実施の形態について、図面を参照しながら説明する。説明の理解を容易にするため、各図面において同一の構成要素に対しては同一の参照番号を付し、重複する説明は省略する。 Next, embodiments of the present invention will be described with reference to the drawings. In order to facilitate understanding of the description, the same reference numerals are given to the same components in the respective drawings, and duplicate descriptions are omitted.
(X線分析装置の構成)
図1は、X線分析装置100の構成を示すブロック図である。X線分析装置100は、たとえば補正値のような与えられた変換情報に基づいて、画素ごとに決まる離散データのX線強度分布を分布既知の第1の面から分布未知の第2の面へ変換する。画素は、変換元または変換先の座標系の単位要素である。X線分析装置100には、PCを用いることができるが専用機を用いてもよい。第1の面は、変換元の面、第2の面は変換先の面を表す。図1に示すように、X線分析装置100は、変換情報記憶部111、投影部112、占有率算出部113、テーブル作成部114、テーブル記憶部115、データ記憶部117、変換部118および出力部119を備えている。
(Configuration of X-ray analyzer)
FIG. 1 is a block diagram showing the configuration of the
変換情報記憶部111は、第1の面および画素と第2の面および画素の関係を特定する変換情報を記憶する。たとえば、変換情報には、実際の検出面の配置を特定する傾きや回転を表す値、理想的な検出面の配置を特定する値が挙げられる。
The conversion
投影部112は、第1の面上で画素を特定する格子点および格子点間の中間点をノードとして第2の面へ投影する。第1または第2の面上の画素は、座標軸に平行な直線により区画されていることが好ましい。これにより、画素ごとに決まる離散データのX線強度分布を効率的に変換でき、計算量を低減するとともに精度を向上することができる。
The
投影部112は、画素の格子点だけでなく格子点間にある画素の辺上の点も中間点として第2の面へ投影する。これにより、投影されたノードを用いて表した多角形を理想的な投影画素に近づけることができ、計算の精度が向上する。特に、中間点は、格子点間を等間隔に1/n(n=整数)に分ける点であることが好ましい。
The
占有率算出部113は、投影されたノードにより特定される多角形が第2の面上の画素の各辺で切り分けられた形状の面積を算出することで、投影画素を表わす多角形が第2の面上の各画素に対して占める占有率を算出する。これにより、空間分解能を保存でき、測定した物理量を維持することで可逆的に単射として変換できる。
The occupancy
テーブル作成部114は、占有率に基づいて、第1の面上の画素内のX線強度を第2の面上の画素へ分配するためのテーブルを作成する。テーブル作成は並列処理で行なうことが好ましく、これにより高速な処理が可能になる。このようにテーブルを用いることで、X線強度分布の変換が容易になる。一度、テーブルを作成しておけば、変換に要する計算量を低減でき、リアルタイムな変換が可能になる。テーブル記憶部115は、作成されたテーブルを記憶する。データ記憶部117は、測定データやその後の変換データを記憶する。
The
変換部118は、占有率に基づいて、第1の面上の画素内のX線強度を第2の面上の画素へ分配し、X線強度分布を変換する。変換部118は、データ記憶部117から変換対象のデータを取得し、読み出したテーブルを用いて、X線強度を第1の面上の分布から第2の面上の分布へ変換する。変換された強度分布は、データ記憶部117に記憶させる。出力部119は、変換後のデータを表示画面等に出力する。
The
なお、投影部112、占有率算出部113、テーブル作成部114および変換部118は、いずれも実数計算を行なう。これにより、丸め誤差が生じないため計算の精度を向上できる。また、内部データ表現を整数ではなく実数とすることで低線量領域においても丸め誤差の影響を受けない小モジュール間境界処理も可能となる。変換の処理は、並列処理により1パスで行なってもよい。その場合には、共有メモリにすべての計算情報を蓄積すればよい。
Note that the
(X線分析装置の動作)
上記のように構成されたX線分析装置100の動作を説明する。図2は、X線分析装置100の動作を示すフローチャートである。まず、補正値等の変換情報の入力を受け付ける(ステップS1)。次に、第1の面の画素のノードを第2の面に投影する(ステップS2)。投影されたノードで形成された多角形を第2の面の各画素により切り分けた領域の多角形の面積を算出する(ステップS3)。
(Operation of X-ray analyzer)
The operation of the
このようにして、投影されたノードで形成された多角形の第2の面の各画素に対する占有率を算出する(ステップS4)。そして、得られた占有率から、第1の面から第2の面へのデータの変更を表すテーブルを作成し(ステップS5)、保存しておく。なお、占有率の計算方法(Overlap計算法)については、後述する。次に、第1の面上のX線強度分布のデータを準備し、保存されたテーブルを読み出し、このテーブルを用いてX線強度分布のデータを第2の面上のデータに変換して終了する(ステップS6)。上記の動作は、コンピュータにプログラムを実行させることで可能となる。 In this way, the occupancy ratio for each pixel on the second surface of the polygon formed by the projected nodes is calculated (step S4). Then, a table representing data change from the first surface to the second surface is created from the obtained occupation ratio (step S5) and stored. The occupancy rate calculation method (Overlap calculation method) will be described later. Next, X-ray intensity distribution data on the first surface is prepared, the stored table is read, and the X-ray intensity distribution data is converted into data on the second surface using this table. (Step S6). The above operation can be performed by causing a computer to execute a program.
(Overlap計算法の概要)
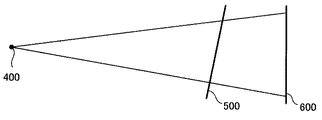
次に、占有率の算出方法としてOverlap計算法の概要を説明する。図3は、第1の面と第2の面とを示す模式図である。図3に示す例では、試料位置400に対してX線強度分布が既知の面500(第1の面)、とX線強度分布が未知の面600(第2の面)がある。
(Overlap calculation method overview)
Next, an overview of the overlap calculation method as a method for calculating the occupation ratio will be described. FIG. 3 is a schematic diagram showing the first surface and the second surface. In the example shown in FIG. 3, there are a surface 500 (first surface) whose X-ray intensity distribution is known with respect to the
図4は、画素の投影を示す模式図である。図4に示すように、面500は、正方形の画素510で区画されており、面600は、正方形の画素610で区画されている。試料位置400に対して、画素510が面600に投影され、歪んだ四辺形として投影画素520が現れている。
FIG. 4 is a schematic diagram showing projection of pixels. As shown in FIG. 4, the
図5は、ノードの投影を示す模式図である。以下の説明では、変換元の各画素をQa〜Qiで表し、変換先の各画素をRA〜RIで表す。図5の例では、面500上の画素Qeの格子点511および中間点512が面600上に投影されている。格子点511は、投影点521に投影され、中間点512は、投影点522に投影されている。このように、画素のノードを投影することができる。なお、図5では、面500上の画素Qa〜Qiを簡略化してa〜iで表している。各a〜iは、後述の(iq,jq)に対応する。また、図6では、面600上の画素RA〜RIを簡略化してA〜Iで表している。各A〜Iは、後述の(ir,jr)に対応する。
FIG. 5 is a schematic diagram showing the projection of a node. In the following description, the conversion source pixels are represented by Qa to Qi, and the conversion destination pixels are represented by RA to RI. In the example of FIG. 5, the
図6は、投影画素の多角形を示す模式図である。上記の通り得られた投影点521、522により、面600上の投影画素520を近似した多角形530が得られる。多角形530の各辺は、面600上の画素610を区画する辺と交わっており、交点523の座標および交線631同士が交わる画素の格子点621の座標も算出することができる。
FIG. 6 is a schematic diagram illustrating a polygon of a projection pixel. From the projection points 521 and 522 obtained as described above, a
図7は、投影画素の多角形が投影先の画素と重複する領域を示す模式図である。さらに多角形530に含まれる画素を特定しておく。上記のように求められた投影点521、522、交点523および格子点621の座標により特定される多角形の面積SA〜SI(後述のS(ir,jr))を計算することが可能になる。そして、投影画素の多角形が投影先の画素と重複する領域の多角形全体に対する面積の割合(占有率)を算出できる。
FIG. 7 is a schematic diagram illustrating a region where a polygon of a projection pixel overlaps with a projection destination pixel. Further, pixels included in the
なお、計算を単純化するには画素は正方画素であることが好ましいが、画素は、長方形、平行四辺形、六角形等に形成されていてもよい。また、画素値の分布を平面から曲面へ変換することも可能であるが、曲面においても少なくとも各画素は平面であると仮定して計算すれば面積を算出できる。 In order to simplify the calculation, the pixel is preferably a square pixel, but the pixel may be formed in a rectangle, a parallelogram, a hexagon, or the like. Further, the distribution of pixel values can be converted from a flat surface to a curved surface, but the area can also be calculated by calculating on the assumption that at least each pixel is a flat surface even on a curved surface.
(Overlap計算法の詳細)
次に、データ変換のアルゴリズムとして用いるOverlap計算法の詳細を、座標を用いて説明する。この計算法では、平面にて格子点およびn分点の変換点の実数座標を与え、画素が変換されて形成された多角形の頂点、内包される変換先画素の格子点、格子との交点をすべて計算する。そして、変換先の画素と重複する多角形の面積をそれぞれ求める。なお、与えられる実数座標はすべて異なる。
(Details of Overlap calculation method)
Next, details of the overlap calculation method used as a data conversion algorithm will be described using coordinates. In this calculation method, the real coordinates of the grid point and the n-point conversion point are given on the plane, the vertex of the polygon formed by converting the pixel, the grid point of the included conversion destination pixel, and the intersection with the grid Calculate all of. Then, the areas of the polygons that overlap with the conversion destination pixel are obtained. The given real number coordinates are all different.
まず、各画素を原画像の座標系から変換画像の座標系に座標変換する。たとえば、変換元の画素Q(iq,jq)の4つの頂点をそれぞれ以下のように定義する(iq、jqは自然数)。
Q0:(iq,jq)
Q1:(iq+1,jq)
Q2:(iq+1,jq+1)
Q3:(iq,jq+1)
First, each pixel is coordinate-transformed from the coordinate system of the original image to the coordinate system of the converted image. For example, the four vertices of the conversion source pixel Q (iq, jq) are respectively defined as follows (iq and jq are natural numbers).
Q0: (iq, jq)
Q1: (iq + 1, jq)
Q2: (iq + 1, jq + 1)
Q3: (iq, jq + 1)
変換元の座標(x,y)における変換G(x,y)により、画素Q(iq,jq)が画素R(ir,jr)に変換されるとすると(ir、jrは自然数)、変換画像上で4つの頂点は以下のように表せる。
R0:(iq,jq)+G(iq,jq)
R1:(iq+1,jq)+G(iq+1,jq)
R2:(iq+1,jq+1)+G(iq+1,jq+1)
R3:(iq,jq+1)+G(iq,jq+1)
If the pixel Q (iq, jq) is converted to the pixel R (ir, jr) by the conversion G (x, y) at the conversion source coordinates (x, y) (ir and jr are natural numbers), the converted image The four vertices can be expressed as follows.
R0: (iq, jq) + G (iq, jq)
R1: (iq + 1, jq) + G (iq + 1, jq)
R2: (iq + 1, jq + 1) + G (iq + 1, jq + 1)
R3: (iq, jq + 1) + G (iq, jq + 1)
さらに各辺Q0Q1、Q1Q2、Q2Q3、Q3Q0をそれぞれ分割する中間点も含めて変換する(サブピクセル化)。このように、サブピクセル化して計算することで高精度化が可能となり滑らかな画像変換が可能となる。一方で、計算量の増加は小さく抑えることができる。なお、分割は等分が好ましい。また、分割数は、計算量との兼ね合いで決めることができ、回折角の低角側では細かく、高角側では粗くすることが可能である。 Further, conversion is performed including sub-pixels including intermediate points for dividing each side Q0Q1, Q1Q2, Q2Q3, and Q3Q0. As described above, calculation with subpixels enables high accuracy and smooth image conversion. On the other hand, the increase in calculation amount can be suppressed to a small level. The division is preferably equally divided. The number of divisions can be determined in consideration of the amount of calculation, and can be fine on the low angle side of the diffraction angle and coarse on the high angle side.
次に、変換先の座標系において、R0の各座標数値の小数点を切り捨てた最小座標Rmin(irmin,jrmin)およびR2の各座標数値の小数点を切り上げた最大座標Rmax(irmax,jrmax)を求める。各座標と変換先の頂点とは以下の関係を有する。
Rmin=floor(R0)
Rmax=ceil(R2)
1画素の変換先の面積の計算については、上記の2つの座標Rmin,Rmaxによって決まる領域内に限定することができる。
Next, in the coordinate system of the conversion destination, a minimum coordinate Rmin (irmin, jrmin) obtained by rounding down the decimal point of each coordinate value of R0 and a maximum coordinate Rmax (irmax, jrmax) obtained by rounding up the decimal point of each coordinate value of R2 are obtained. Each coordinate and the vertex of the conversion destination have the following relationship.
Rmin = floor (R0)
Rmax = ceil (R2)
The calculation of the conversion destination area of one pixel can be limited to an area determined by the two coordinates Rmin and Rmax.
次に、変換された画素を表わす多角形のノードおよび交点を抽出する。サブピクセル分割数を4として2分点(中点)のみを変換する場合には、辺Q0Q1上の点QsをQs:(iq+0.5,jq)とすると、変換画像上では、Rs:(iq+0.5,jq)+G(iq+0.5,jq)と表せる。線分R0Rsと変換画像上の座標格子との交点をRcと表す。また、投影画素を表わす多角形の内部にある格子点をRIと表す。 Next, polygon nodes and intersection points representing the converted pixels are extracted. In the case of converting only the bisector (middle point) with the subpixel division number being 4 , if the point Qs on the side Q0Q1 is Qs: (iq + 0.5, jq), Rs: (iq + 0) on the converted image. .5, jq) + G (iq + 0.5, jq). The intersection of the line segment R0Rs and the coordinate grid on the converted image is represented as Rc. A lattice point inside the polygon representing the projection pixel is represented as RI.
交点は以下のようにして求める。まず、変換された画素を表わす多角形において時計回りに順序付けされた頂点Ri(i=0,・・・,n−1、R0=Rn)から各辺が得られる。そして、Rmin、Rmaxを対角の頂点とし変換先の画素の集合により形成される領域内で画素R(ir,jr)の各辺が上記のn角形の各辺と交差するか否かを判定する。このとき、以下の関係を満たす座標(ir,jr)を中心に(ir,jr)と(ir±1,jr±1)とを結ぶ線分がn多角形の各辺Siと交点を持つかどうかを判定する。
irmin+1≦ir≦irmax−1
jrmin+1=≦jr≦jrmax−1。
The intersection is obtained as follows. First, each side is obtained from vertices Ri (i = 0,..., N−1, R0 = Rn) ordered clockwise in the polygon representing the transformed pixel. Then, it is determined whether or not each side of the pixel R (ir, jr) intersects each side of the n-gon in the region formed by the set of conversion destination pixels with Rmin and Rmax as diagonal vertices. To do. At this time, whether the line connecting (ir, jr) and (ir ± 1, jr ± 1) centering on the coordinates (ir, jr) satisfying the following relationship has an intersection with each side Si of the n polygon Determine if.
irmin + 1 ≦ ir ≦ irmax−1
jrmin + 1 = ≦ jr ≦ jrmax−1.
そして、交点を持つ場合には、交点を持つ線分(交線)にどの領域に属しているかという情報を付与する。交点を持たない場合にはその線分を省く。なお、省かれた線分は、たとえばn多角形に内包されている線分である。 And when it has an intersection, the information which belongs to which area | region belongs to the line segment (intersection line) which has an intersection is provided. If there is no intersection, the line is omitted. The omitted line segments are, for example, line segments included in an n polygon.
次に、変換された画素を表わす多角形を上記の交線および画素の辺で分割し、上記の多角形に囲われた領域が、変換画像上の画素とそれぞれ重なる領域を抽出(Clipping)する。分割により形成された多角形が、変換された画素を表わす多角形が変換先の画素に重複する領域となる。そして、分割により形成された多角形の頂点順のソートを行なう。 Next, the polygon representing the converted pixel is divided by the intersection line and the side of the pixel, and an area surrounded by the polygon is extracted (Clipping) where each area overlaps the pixel on the converted image. . The polygon formed by the division becomes a region where the polygon representing the converted pixel overlaps with the conversion destination pixel. Then, the polygons formed by the division are sorted in the vertex order.
次に、変換された画素を表わす多角形が変換先の画素に重複する閉領域の面積Sq(ir,jr)を計算する。重複する閉領域(m角形)の面積Sqは、m角形の一方回りの順に頂点を(xk,yk)(k=1〜mの自然数)としたとき以下の公式で求められる。

このような計算方法により、従来法と比較して、モンテカルロ計算よりも計算量が少なく、既製の三角形分割よりも高精度な結果を得ることができる。
Next, the area Sq (ir, jr) of the closed region where the polygon representing the converted pixel overlaps the conversion destination pixel is calculated. The area Sq of the overlapped closed region (m square) is obtained by the following formula when the vertex is (xk, yk) (k = 1 to m natural number) in the order of one turn of the m square.
By such a calculation method, compared with the conventional method, the calculation amount is less than that of the Monte Carlo calculation, and a result with higher accuracy than that of the ready-made triangulation can be obtained.
次に、得られた重なり合う閉領域の面積に応じて、原画像上の画素Q(iq,jq)の画素値I(iq,jq)の変換先画素R(ir,jr)の画素値I(ir,jr)への分配(Re−distribution)を算出する。算出は、次の式により行なうことができる。
これにより、周りから補間処理(interpolation)することなく画素値を変換でき、当初の情報量を減少させずに原画像がもっている空間分解能を適切に保存できる。そして、局所的にも大域的にも画素値が正確に保存される。この計算をすべてのQ(iq,jq)について行なうことで変換G(x,y)による変換画像が得られる。デジカメの写真処理技術等とは異なり、物理量の測定の場面では、画素値の正確な保存に対する要請がある。 Thereby, the pixel value can be converted without performing interpolation processing from the surroundings, and the spatial resolution of the original image can be appropriately stored without reducing the initial amount of information. The pixel values are stored accurately both locally and globally. By performing this calculation for all Q (iq, jq), a converted image by the conversion G (x, y) can be obtained. Unlike digital camera photo processing technology, there is a demand for accurate storage of pixel values in the measurement of physical quantities.
(テーブルを用いたリアルタイム変換)
画像変換の処理は、テーブルを準備して効率化することができる。図8は、一連の処理を示すデータフロー図である。まず、予め用意された歪み計測マスクデータと試験的な測定により得られた座標変換情報を用いて、歪み・座標変換計算303を実行する。そして、計算により得られた座標変換の情報に基づいてOverlap計算305を実行し、得られた画像変換テーブル231を保存する。なお、マスクデータとは、板状のマスクで検出面を覆って測定したときのマスクのグリッドの投影を検出したデータを指す。
(Real-time conversion using a table)
The image conversion process can be streamlined by preparing a table. FIG. 8 is a data flow diagram showing a series of processes. First, the distortion / coordinate
一方で、散乱X線を測定し、座標と座標に対する強度のデータを取得する。そして、保存されている画像変換テーブルを読み出し、これを用いて取得されたデータに対して画像変換処理230を実行する。これにより、測定時にリアルタイムで2次元回折像を補正したり、2次元回折像を1次元データに変換したりすることができる。さらに得られたデータを、別の画像変換テーブルでさらに異なる座標系に変換することも可能である。テーブルを予め用意することで、並列処理が可能になり精度の高い計算を高速に実行できる。本発明では、ノードを用いるというロジック上の特徴だけでなく並列処理を用いたアルゴリズム上の特徴によっても処理を高速化することができる。
On the other hand, scattered X-rays are measured, and coordinates and intensity data with respect to the coordinates are acquired. Then, the stored image conversion table is read, and the
一回テーブルを作ってしまえば、そこを通して変換するのは1パスであり計算量を低減できる。なお、測定のコンフィグレーションを変えたときには、コンフィグレーションに合わせてテーブルを変えればよい。積分強度を保存した離散データ間の座標変換(または幾何補正)を高速に計算することによって、複数のモジュールによって構成されるX線検出器のデータ合成や平面座標、円筒座標、球座標の座標間の変換や平面データの球面への投影などの計算を高精度かつ高速に行なうことができる。 Once a table is created, it is possible to reduce the amount of calculation by converting only one pass through the table. When the measurement configuration is changed, the table may be changed according to the configuration. By calculating the coordinate transformation (or geometric correction) between discrete data that preserves the integrated intensity at high speed, the data composition of X-ray detectors composed of multiple modules and the coordinates between plane coordinates, cylindrical coordinates, and spherical coordinates Can be calculated with high precision and at high speed.
(X線検出の補正)
図9は、X線分析システム50を示すブロック図である。図9に示すように、X線分析システム50は、検出器70、検出器制御装置80、計測装置90およびデータ解析装置100を備えている。
(Correction of X-ray detection)
FIG. 9 is a block diagram showing the
検出器70は、たとえば半導体検出器であり、外部からのトリガ信号により機能し、X線強度を検出する。検出器制御装置80は、検出器70を制御する装置である。計測装置90は、ユーザにより操作され、計測のための外部制御機器を制御する。データ解析装置100は、実質的にはX線分析装置100を構成する。各装置は、特別な計算機を用意しなくても、通常のPCで十分であるが、専用機を用いればさらに処理速度を上げることもできる。
The
X線分析システム50で検出データを適正に補正するためには、検出器70が理想的な位置からどの程度傾いているか等の補正値(変換情報の一種)を予め把握しておく必要がある。このような補正値は、装置の設計を規定のものとし、出荷時に決めた値を用いることとしてもよいし、使用者が調整したコンフィグレーションの補正値を用いてもよい。
In order to properly correct the detection data by the
補正値には、検出器70の試料からの距離、試料に対する傾きと検出器周りの回転を表す数値が挙げられる。なお、レンズの場合には、板状のマスクの細かいグリッド(穴)の投影のレンズの有無による変化でレンズの収差等を把握することができる。また、正常な位置であればX線はコーン状に散乱されるため、X線回折像の投影が真円から楕円に歪んでいる程度で傾斜を測定できる。なお、ある座標系のデータを他の座標系に移すことをデータの変換といい、何らかの物理情報について理想値からのずれを取り除く変換を補正という。
Examples of the correction value include a value representing the distance of the
上記の例では、測定前のアライメントを前提としているが、アライメント無しでX線を測定することもできる。測定時の誤差や取り付けによる精度誤差という人間では調整できない部分を補正値で調整することを前提にし、使用者がラフにコンフィグレーションを設定した状態でも、補正値を把握していれば適正な強度補正を行なうことができる。 In the above example, the pre-measurement alignment is assumed, but X-rays can also be measured without alignment. Assuming that adjustments can be made with parts that cannot be adjusted by humans, such as measurement errors and accuracy errors due to installation, even if the user has roughly set the configuration, the correct strength can be obtained if the user knows the correction values. Correction can be performed.
図10は、検出面の補正を示す模式図である。面500(第1の面)を検出器70の検出面とし、面600(第2の面)をX線の検出器の理想の検出面とする。そして、上記のX線強度分布の変換によりデータの補正を行なう。これにより、アライメントが十分でない場合でもX線検出データを補正できる。また、任意の場所に検出器を設定して測定し、補正したデータを利用することができる。
FIG. 10 is a schematic diagram illustrating correction of the detection surface. The surface 500 (first surface) is the detection surface of the
(モジュール間の位置補正)
上記の補正処理は、モジュール間の位置補正にも用いることができる。図11は、モジュールにより得られたデータの補正を示す図である。検出器が、複数のモジュールにより形成されている場合、各モジュールは所定の配置となるように設置されているが、実際のモジュール550は少しずつ位置の誤差を有する。たとえば、図11の例では、モジュール550の長手方向と短手方向がそれぞれが一致すべきベクトルΔxijとΔyijから回転している。この回転角度のように、理想的なモジュール650の位置に対する実際のモジュール550の位置を予め把握しておき、上記の測定データの変換処理により実際の位置で検出されたデータを理想位置のものに補正することが可能である。
(Position correction between modules)
The above correction processing can also be used for position correction between modules. FIG. 11 is a diagram illustrating correction of data obtained by the module. When the detector is formed by a plurality of modules, each module is installed in a predetermined arrangement, but the
また、X線の散乱データからモジュールを再配置することもできる。図12は、モジュール550(α〜δ)の再配置を示す模式図である。既知のX線の光学系に対して得られた測定データから理想的なX線強度分布になる配置とのずれを把握し、物理的配置に対してモジュールの再配置を行なうことができる。このように多モジュール構成された検出器の効率的かつ高精度な再配置が可能である。 It is also possible to rearrange the modules from the X-ray scattering data. FIG. 12 is a schematic diagram showing the rearrangement of the modules 550 (α to δ). It is possible to grasp a deviation from an arrangement where an ideal X-ray intensity distribution is obtained from measurement data obtained for a known X-ray optical system, and to rearrange the modules with respect to the physical arrangement. Thus, it is possible to efficiently and highly accurately rearrange detectors configured in a multi-module configuration.
(平板から円筒面、球面、またその逆)
上記のように画素値の変換処理は、測定データの補正に応用できるが、さらに補正により得られたデータを必要に応じて異なる面間で変換することができる。図13は、平面500上のデータの円筒面600上への変換を示す図である。さらに円筒面上のデータを球面上のデータに変換することも可能である。なお、曲面上のデータの変換を扱う場合であっても、各画素は平面であると近似して計算すれば、上記のOverlap計算法を適用できる。
(From flat plate to cylindrical surface, spherical surface, and vice versa)
As described above, the pixel value conversion process can be applied to the correction of the measurement data, but the data obtained by the correction can be converted between different planes as necessary. FIG. 13 is a diagram illustrating conversion of data on the
(2次元データから1次元データ)
上記のように異なる平面間のデータの変換だけでなく、2次元データを1次元データに変換することもできる。図14は、2次元データの1次元データへの変換を示す図である。図14に示す2次元データを円環平均処理によって1次元化する場合のように観測座標系が入射・散乱X線の座標系に対して傾いている場合でも、空間分解能を損なうことなく変換処理を行なうことが可能である。この場合には、2次元上の画素560の画素値を所定の円環領域660内の画素値に変換することで1次元化できる。図15は、変換された1次元データを示す図である。
(2D data to 1D data)
In addition to the conversion of data between different planes as described above, two-dimensional data can also be converted to one-dimensional data. FIG. 14 is a diagram illustrating conversion of two-dimensional data into one-dimensional data. Even when the observation coordinate system is inclined with respect to the incident / scattered X-ray coordinate system as in the case where the two-dimensional data shown in FIG. Can be performed. In this case, it can be made one-dimensional by converting the pixel value of the two-
(複数の検出器の配置例)
複数の検出器をスキャン方向に並列に配置した構成でデバイリング等の測定を行ない、検出器により得られたデータに対して補正を行なってもよい。これにより、ゴニオ機構なしで一度にX線回折データを検出して補正したデータを利用することができる。このように測定光学系として、フリー配置で測定し、データを補正して用いることができる。なお、複数の検出器をスキャニング方向に直交する方向に並べて測定を行なうこともできる。また、複数の検出器を半球面上に並べて測定してもよい。
(Example of multiple detectors)
Measurement such as debyling may be performed with a configuration in which a plurality of detectors are arranged in parallel in the scan direction, and correction may be performed on data obtained by the detectors. Thereby, it is possible to use data obtained by detecting and correcting X-ray diffraction data at a time without a gonio mechanism. As described above, the measurement optical system can be used by measuring in a free arrangement and correcting the data. Note that it is also possible to perform measurement by arranging a plurality of detectors in a direction orthogonal to the scanning direction. Alternatively, a plurality of detectors may be measured side by side on the hemisphere.
50 X線分析システム
70 検出器
80 検出器制御装置
90 計測装置
100 X線分析装置(X線データ解析装置)
111 変換情報記憶部
112 投影部
113 占有率算出部
114 テーブル作成部
115 テーブル記憶部
117 データ記憶部
118 変換部
119 出力部
230 画像変換処理
231 画像変換テーブル
303 歪み・座標変換計算
305 Overlap計算
400 試料位置
500 変換元の面(第1の面)
510 画素
511 格子点
512 中間点
520 投影画素
521、522 投影点
523 交点
530 多角形
550 モジュール
560 画素
600 変換先の面(第2の面)
610 画素
621 格子点
631 交線
650 モジュール
660 円環領域
50
111 Conversion
510
610
Claims (11)
第1の面上において画素を特定する格子点および前記格子点間の中間点をノードとして、第2の面へ投影する投影部と、
前記投影されたノードにより特定される投影画素を表わす多角形が前記第2の面上の各画素と重複する領域の面積を算出することで、前記投影画素を表わす多角形が前記第2の面上の各画素に対して占める占有率を算出する占有率算出部と、
前記占有率に基づいて、前記第1の面上の画素内のX線強度を前記第2の面上の画素へ分配し、X線強度分布を変換する変換部と、を備えることを特徴とするX線分析装置。 An X-ray analyzer that converts an X-ray intensity distribution of discrete data determined for each pixel from a first surface with a known distribution to a second surface with an unknown distribution,
A projection unit that projects onto a second surface using a grid point that identifies a pixel on the first surface and an intermediate point between the grid points as a node;
The polygon representing the projected pixel specified by the projected node is calculated by calculating the area of the area where each polygon on the second surface overlaps, so that the polygon representing the projected pixel becomes the second surface. An occupancy ratio calculation unit for calculating an occupancy ratio for each of the pixels above;
A conversion unit that distributes the X-ray intensity in the pixels on the first surface to the pixels on the second surface based on the occupation ratio, and converts the X-ray intensity distribution; X-ray analyzer.
前記変換部は、前記作成されたテーブルを用いて、X線強度を前記第1の面上の分布から前記第2の面上の分布へ変換することを特徴とする請求項1から請求項4のいずれかに記載のX線分析装置。 A table creation unit for creating a table for distributing the X-ray intensity in the pixels on the first surface to the pixels on the second surface based on the occupancy;
The conversion unit converts the X-ray intensity from the distribution on the first surface to the distribution on the second surface using the created table. The X-ray analyzer according to any one of the above.
前記第2の面をX線の検出器の理想の検出面とし、前記第2の面上の画素を前記理想の検出面の画素として、前記X線強度分布の変換によりデータの補正を行なうことを特徴とする請求項1から請求項6のいずれかに記載のX線分析装置。 The first surface is the actual detection surface of the X-ray detector, the pixels on the first surface are the pixels of the actual detection surface,
Using the second surface as an ideal detection surface of an X-ray detector and pixels on the second surface as pixels of the ideal detection surface, data correction is performed by converting the X-ray intensity distribution. The X-ray analyzer according to any one of claims 1 to 6, wherein:
請求項7記載のX線分析装置と、を備え、
前記X線分析装置は、前記検出器により得られたデータに対して前記補正を行なうことを特徴とするX線分析システム。 A plurality of detectors arranged in parallel in the scan direction;
An X-ray analyzer according to claim 7,
The X-ray analysis system, wherein the X-ray analysis apparatus performs the correction on the data obtained by the detector.
請求項7記載のX線分析装置と、を備え、
前記X線分析装置は、前記検出器により得られたデータに対して前記補正を行なうことを特徴とするX線分析システム。 A plurality of detectors arranged on a hemisphere;
An X-ray analyzer according to claim 7,
The X-ray analysis system, wherein the X-ray analysis apparatus performs the correction on the data obtained by the detector.
第1の面上において画素を特定する格子点および前記格子点間の中間点をノードとして、第2の面へ投影するステップと、
前記投影されたノードにより特定される投影画素を表わす多角形が前記第2の面上の各画素と重複する領域の面積を算出することで、前記投影画素が表わす多角形が前記第2の面上の各画素に対して占める占有率を算出するステップと、
前記占有率に基づいて、前記第1の面上の画素内のX線強度を前記第2の面上の画素へ分配し、X線強度分布を変換するステップと、を含むことを特徴とするX線分析方法。 An X-ray analysis method for converting an X-ray intensity distribution of discrete data determined for each pixel from a first surface with a known distribution to a second surface with an unknown distribution,
Projecting onto the second surface using a grid point that identifies a pixel on the first surface and an intermediate point between the grid points as a node;
By calculating the area of a region where the polygon representing the projection pixel specified by the projected node overlaps each pixel on the second surface, the polygon represented by the projection pixel becomes the second surface. Calculating the occupancy for each pixel above;
Distributing the X-ray intensity in the pixels on the first surface to the pixels on the second surface based on the occupancy rate, and converting the X-ray intensity distribution. X-ray analysis method.
第1の面上において画素を特定する格子点および前記格子点間の中間点をノードとして、第2の面へ投影する処理と、
前記投影されたノードにより特定される投影画素を表わす多角形が前記第2の面上の各画素と重複する領域の面積を算出することで、前記投影画素を表わす多角形が前記第2の面上の各画素に対して占める占有率を算出する処理と、
前記占有率に基づいて、前記第1の面上の画素内のX線強度を前記第2の面上の画素へ分配し、X線強度分布を変換する処理と、をコンピュータに実行させることを特徴とするX線分析プログラム。 An X-ray analysis program for converting an X-ray intensity distribution of discrete data determined for each pixel from a first surface with a known distribution to a second surface with an unknown distribution,
A process of projecting onto a second surface using a grid point that identifies a pixel on the first surface and an intermediate point between the grid points as a node;
The polygon representing the projected pixel specified by the projected node is calculated by calculating the area of the area where each polygon on the second surface overlaps, so that the polygon representing the projected pixel becomes the second surface. A process of calculating the occupation ratio for each of the above pixels;
Causing the computer to execute processing for distributing the X-ray intensity distribution in the pixels on the first surface to the pixels on the second surface by converting the X-ray intensity distribution based on the occupation ratio. A featured X-ray analysis program.
Priority Applications (4)
| Application Number | Priority Date | Filing Date | Title |
|---|---|---|---|
| JP2012159863A JP5798526B2 (en) | 2012-07-18 | 2012-07-18 | X-ray analyzer, X-ray analysis system, X-ray analysis method, and X-ray analysis program |
| US13/905,559 US9006673B2 (en) | 2012-07-18 | 2013-05-30 | X-ray analysis apparatus, X-ray analysis system, X-ray analysis method, and X-ray analysis program |
| GB1312610.7A GB2505998B (en) | 2012-07-18 | 2013-07-15 | X-ray analysis apparatus, x-ray analysis system, x-ray analysis method, and x-ray analysis program |
| DE201310214015 DE102013214015A1 (en) | 2012-07-18 | 2013-07-17 | X-ray analysis device, X-ray analysis system, X-ray analysis method and X-ray analysis program |
Applications Claiming Priority (1)
| Application Number | Priority Date | Filing Date | Title |
|---|---|---|---|
| JP2012159863A JP5798526B2 (en) | 2012-07-18 | 2012-07-18 | X-ray analyzer, X-ray analysis system, X-ray analysis method, and X-ray analysis program |
Publications (3)
| Publication Number | Publication Date |
|---|---|
| JP2014020925A JP2014020925A (en) | 2014-02-03 |
| JP2014020925A5 JP2014020925A5 (en) | 2014-09-11 |
| JP5798526B2 true JP5798526B2 (en) | 2015-10-21 |
Family
ID=49081268
Family Applications (1)
| Application Number | Title | Priority Date | Filing Date |
|---|---|---|---|
| JP2012159863A Active JP5798526B2 (en) | 2012-07-18 | 2012-07-18 | X-ray analyzer, X-ray analysis system, X-ray analysis method, and X-ray analysis program |
Country Status (4)
| Country | Link |
|---|---|
| US (1) | US9006673B2 (en) |
| JP (1) | JP5798526B2 (en) |
| DE (1) | DE102013214015A1 (en) |
| GB (1) | GB2505998B (en) |
Families Citing this family (4)
| Publication number | Priority date | Publication date | Assignee | Title |
|---|---|---|---|---|
| US9897559B2 (en) * | 2015-12-22 | 2018-02-20 | Bruker Axs, Inc. | Method for collecting accurate X-ray diffraction data with a scanning two-dimensional detector |
| US10478133B2 (en) * | 2016-10-20 | 2019-11-19 | General Electric Company | Systems and methods for calibrating a nuclear medicine imaging system |
| JP6873414B2 (en) * | 2017-10-17 | 2021-05-19 | 株式会社リガク | Processing equipment, methods and programs |
| CN117372502A (en) * | 2023-11-15 | 2024-01-09 | 北京理工大学 | Group target projection area calculation method and system for target vulnerability analysis |
Family Cites Families (8)
| Publication number | Priority date | Publication date | Assignee | Title |
|---|---|---|---|---|
| US5204944A (en) | 1989-07-28 | 1993-04-20 | The Trustees Of Columbia University In The City Of New York | Separable image warping methods and systems using spatial lookup tables |
| US5204994A (en) | 1992-03-30 | 1993-04-27 | Herzberg Richard P | Skull-cap/clip-retainer combination |
| US6242743B1 (en) | 1998-08-11 | 2001-06-05 | Mosaic Imaging Technology, Inc. | Non-orbiting tomographic imaging system |
| JP4700930B2 (en) * | 2004-05-28 | 2011-06-15 | ジーイー・メディカル・システムズ・グローバル・テクノロジー・カンパニー・エルエルシー | Radiation tomography apparatus and detector element positional deviation measuring apparatus |
| JP2008110020A (en) * | 2006-10-30 | 2008-05-15 | Uni-Hite System Corp | X-ray ct image reconstruction effective for broad range of curved trajectory |
| JP2008257333A (en) * | 2007-04-02 | 2008-10-23 | Shimadzu Corp | Three-dimensional imaging method and tomograph |
| JP5497304B2 (en) * | 2009-02-13 | 2014-05-21 | 住友重機械工業株式会社 | Tomography equipment |
| JP6073616B2 (en) * | 2011-09-28 | 2017-02-01 | 東芝メディカルシステムズ株式会社 | X-ray CT apparatus, image processing apparatus, and program |
-
2012
- 2012-07-18 JP JP2012159863A patent/JP5798526B2/en active Active
-
2013
- 2013-05-30 US US13/905,559 patent/US9006673B2/en active Active
- 2013-07-15 GB GB1312610.7A patent/GB2505998B/en active Active
- 2013-07-17 DE DE201310214015 patent/DE102013214015A1/en not_active Ceased
Also Published As
| Publication number | Publication date |
|---|---|
| DE102013214015A1 (en) | 2014-01-23 |
| JP2014020925A (en) | 2014-02-03 |
| GB2505998A (en) | 2014-03-19 |
| GB2505998B (en) | 2018-05-02 |
| GB201312610D0 (en) | 2013-08-28 |
| US9006673B2 (en) | 2015-04-14 |
| US20140021364A1 (en) | 2014-01-23 |
Similar Documents
| Publication | Publication Date | Title |
|---|---|---|
| CN107564069B (en) | Method and device for determining calibration parameters and computer readable storage medium | |
| US9218536B2 (en) | Methods and apparatus for one-dimensional signal extraction | |
| JP5798526B2 (en) | X-ray analyzer, X-ray analysis system, X-ray analysis method, and X-ray analysis program | |
| JP2018055679A (en) | Selection of balanced probe sites for 3d alignment algorithms | |
| CN103729841B (en) | A kind of based on side's target model and the camera distortion bearing calibration of perspective projection | |
| CN103038861A (en) | Multi-layer overlay metrology target and complimentary overlay metrology measurement systems | |
| US10276075B1 (en) | Device, system and method for automatic calibration of image devices | |
| CN104406770B (en) | The distortion measurement device and distortion correction method of wave aberration measurement module | |
| CN109544642B (en) | N-type target-based TDI-CCD camera parameter calibration method | |
| CN109089093A (en) | Image processing method, device and equipment | |
| US20140341461A1 (en) | Image processing apparatus, distortion-corrected map creation apparatus, and semiconductor measurement apparatus | |
| Niu et al. | Calibration method for the relative orientation between the rotation axis and a camera using constrained global optimization | |
| JP2011155412A (en) | Projection system and distortion correction method in the same | |
| Jiang et al. | An accurate and flexible technique for camera calibration | |
| CN103376644A (en) | Mask pattern correction method | |
| CN104166985A (en) | Star sensor demarcation method based on region division | |
| JP2011047739A (en) | Calibration device for camera parameter and program | |
| JP2009146150A (en) | Method and device for detecting feature position | |
| Apolinar Muñoz Rodríguez | Calibration modeling for mobile vision based laser imaging and approximation networks | |
| CN110458951A (en) | A kind of the modeling data acquisition methods and relevant apparatus of power grid shaft tower | |
| Zhang et al. | Design of high precision star image locating method used in star sensor technology | |
| US20080212830A1 (en) | Efficient Calculation of Ensquared Energy in an Imaging System | |
| CN115375576A (en) | Image correction method for biological characteristic photoelectric scanning device | |
| Korolev et al. | New concept of angular measurement. Model and experimental studies | |
| CN110310312B (en) | Image registration method, image registration device and terminal |
Legal Events
| Date | Code | Title | Description |
|---|---|---|---|
| A521 | Request for written amendment filed |
Free format text: JAPANESE INTERMEDIATE CODE: A523 Effective date: 20140724 |
|
| A621 | Written request for application examination |
Free format text: JAPANESE INTERMEDIATE CODE: A621 Effective date: 20140724 |
|
| A977 | Report on retrieval |
Free format text: JAPANESE INTERMEDIATE CODE: A971007 Effective date: 20150319 |
|
| A131 | Notification of reasons for refusal |
Free format text: JAPANESE INTERMEDIATE CODE: A131 Effective date: 20150414 |
|
| A521 | Request for written amendment filed |
Free format text: JAPANESE INTERMEDIATE CODE: A523 Effective date: 20150525 |
|
| TRDD | Decision of grant or rejection written | ||
| A01 | Written decision to grant a patent or to grant a registration (utility model) |
Free format text: JAPANESE INTERMEDIATE CODE: A01 Effective date: 20150818 |
|
| A61 | First payment of annual fees (during grant procedure) |
Free format text: JAPANESE INTERMEDIATE CODE: A61 Effective date: 20150821 |
|
| R150 | Certificate of patent or registration of utility model |
Ref document number: 5798526 Country of ref document: JP Free format text: JAPANESE INTERMEDIATE CODE: R150 |
|
| R250 | Receipt of annual fees |
Free format text: JAPANESE INTERMEDIATE CODE: R250 |
|
| R250 | Receipt of annual fees |
Free format text: JAPANESE INTERMEDIATE CODE: R250 |
|
| R250 | Receipt of annual fees |
Free format text: JAPANESE INTERMEDIATE CODE: R250 |
|
| SG99 | Written request for registration of restore |
Free format text: JAPANESE INTERMEDIATE CODE: R316G99 |
|
| R350 | Written notification of registration of transfer |
Free format text: JAPANESE INTERMEDIATE CODE: R350 |
|
| S803 | Written request for registration of cancellation of provisional registration |
Free format text: JAPANESE INTERMEDIATE CODE: R316805 |
|
| R350 | Written notification of registration of transfer |
Free format text: JAPANESE INTERMEDIATE CODE: R350 |
|
| R250 | Receipt of annual fees |
Free format text: JAPANESE INTERMEDIATE CODE: R250 |
|
| S803 | Written request for registration of cancellation of provisional registration |
Free format text: JAPANESE INTERMEDIATE CODE: R316805 |
|
| R350 | Written notification of registration of transfer |
Free format text: JAPANESE INTERMEDIATE CODE: R350 |
|
| R250 | Receipt of annual fees |
Free format text: JAPANESE INTERMEDIATE CODE: R250 |