JP4477403B2 - Biological light measurement device - Google Patents
Biological light measurement device Download PDFInfo
- Publication number
- JP4477403B2 JP4477403B2 JP2004115474A JP2004115474A JP4477403B2 JP 4477403 B2 JP4477403 B2 JP 4477403B2 JP 2004115474 A JP2004115474 A JP 2004115474A JP 2004115474 A JP2004115474 A JP 2004115474A JP 4477403 B2 JP4477403 B2 JP 4477403B2
- Authority
- JP
- Japan
- Prior art keywords
- measurement
- dementia
- waveform
- light
- point
- Prior art date
- Legal status (The legal status is an assumption and is not a legal conclusion. Google has not performed a legal analysis and makes no representation as to the accuracy of the status listed.)
- Expired - Fee Related
Links
Images


Classifications
-
- A—HUMAN NECESSITIES
- A61—MEDICAL OR VETERINARY SCIENCE; HYGIENE
- A61B—DIAGNOSIS; SURGERY; IDENTIFICATION
- A61B5/00—Measuring for diagnostic purposes; Identification of persons
- A61B5/0059—Measuring for diagnostic purposes; Identification of persons using light, e.g. diagnosis by transillumination, diascopy, fluorescence
-
- A—HUMAN NECESSITIES
- A61—MEDICAL OR VETERINARY SCIENCE; HYGIENE
- A61B—DIAGNOSIS; SURGERY; IDENTIFICATION
- A61B5/00—Measuring for diagnostic purposes; Identification of persons
- A61B5/40—Detecting, measuring or recording for evaluating the nervous system
- A61B5/4076—Diagnosing or monitoring particular conditions of the nervous system
- A61B5/4088—Diagnosing of monitoring cognitive diseases, e.g. Alzheimer, prion diseases or dementia
Description
本発明は、人の頭部表面に光を照射し、表面近傍で反射した光及び表面近傍を透過した光(以下、まとめて透過光という)を検出し、人の脳の機能や疾患を計測・診断する生体光計測装置に関し、特にアルツハイマー病などの痴呆症の判定に有用な生体光計測装置に関する。 The present invention irradiates light on the surface of a person's head, detects light reflected near the surface and light transmitted near the surface (hereinafter collectively referred to as transmitted light), and measures human brain functions and diseases The present invention relates to a biological light measurement device for diagnosis, and more particularly to a biological light measurement device useful for determining dementia such as Alzheimer's disease.
生体光計測装置は、ヒトや動物などの生体からの透過光を利用して、生体の血液動態を観察する装置であり、特に頭部の複数の点におけるヘモグロビン量の変化を検出することにより、脳の機能の計測や疾患の診断を非侵襲的に行なうことができる。脳機能の計測や診断のために、複数の計測点のヘモグロビン変化信号として計測されたデータを解析する手法が種々開発されている。 A biological light measurement device is a device that observes the blood dynamics of a living body using transmitted light from a living body such as a human or an animal, and in particular, by detecting changes in the amount of hemoglobin at a plurality of points on the head, Brain function measurement and disease diagnosis can be performed non-invasively. Various methods for analyzing data measured as hemoglobin change signals at a plurality of measurement points have been developed for the measurement and diagnosis of brain functions.
具体的には特許文献1、特許文献2に、被検体にタスクを与え、タスク負荷・非負荷時におけるヘモグロビン変化信号を計測することにより脳機能活動を計測する手法が提案され、さらに特許文献3には、計測されたヘモグロビン信号の精度を高めるための処理、例えばフィッティング処理、加算平均処理、ノイズ除去など手法が提案されている。また特許文献4には、ヘモグロビンの変化パターンの特徴と基準テンプレートとの相関を算出し、これにより疾患の判定を行なうことが記載され、特徴としてヘモグロビン変化パターン曲線や変化量の微分値、積分値などを用いることが記載されている。
Specifically,
一方、痴呆症には、軽度認知障害、アルツハイマー病、血管性痴呆症など種々のものが含まれ、その原因も治療方法も異なっているが、症状の観察のみでは正確な診断を行なうことが困難であり、計測機器を利用した他の診断方法も併用されている。例えばアルツハイマー病の診断を目的とした診断ではPETや脳血流SPECTを用いた計測方法が用いられている。しかし、これらの計測方法では、頭頂・側頭葉の連合野皮質の代謝低下を検出するために、放射性同位元素でラベルした物質を被検者に投薬する必要があり、患者の負担が非常に重くなっている。
従って、投薬が不要であり非侵襲的に生体を計測することができる生体光計測を痴呆症の診断に適用することは非常に有用である。しかし、従来の生体光計測装置では計測データについて精度を高めたり、変化パターンの特徴を構成する個々の要素(変化量の微分値や積分値など)を定量化する試みはあるが、特定の疾患、特に痴呆症の診断に有効な計測データ(ヘモグロビン変化パターン)の特徴については不明であり、また特徴を自動的に算出する手法が開発されていないため、生体光計測装置の機能として痴呆症の診断を実現することができなかった。また生体光計測装置を用いた痴呆症の診断では、一つの部位のみならず側頭部や頭頂部を含む複数の部位を計測することが考えられる。その場合、計測部位によって計測点の数が異なることがあるが、従来の生体光計測装置ではこのような計測部位やその計測点数の相違に対応することができなかった。 Therefore, it is very useful to apply biological light measurement that does not require medication and can measure a living body non-invasively to the diagnosis of dementia. However, there are attempts to increase the accuracy of measurement data and quantify individual elements (such as differential values and integral values of changes) in conventional biological optical measurement devices, but for specific diseases In particular, the characteristics of measurement data (hemoglobin change pattern) that are particularly effective in diagnosing dementia are unknown, and no method for automatically calculating the characteristics has been developed. The diagnosis could not be realized. Further, in the diagnosis of dementia using a biological light measuring device, it is conceivable to measure not only one part but also a plurality of parts including the temporal region and the parietal region. In this case, the number of measurement points may differ depending on the measurement site, but the conventional biological light measurement device cannot cope with such a difference in the measurement site and the number of measurement points.
そこで本発明は、アルツハイマー病を含む痴呆症の診断において重要なパラメータを提供することができる生体光計測装置を提供することを目的とする。また本発明は、異なる計測部位の計測結果を用いて、痴呆症の判定を行なうことが可能な生体光計測装置を提供することを目的とする。 Therefore, an object of the present invention is to provide a biological optical measurement device that can provide important parameters in the diagnosis of dementia including Alzheimer's disease. It is another object of the present invention to provide a living body light measurement device capable of determining dementia using measurement results of different measurement sites.
本発明の生体光計測装置は、被検体に装着されるプローブと、前記プローブを介して得られる複数の計測点からの光信号を受信し、ヘモグロビン変化信号に変換する手段、前記複数の計測点のヘモグロビン変化信号を解析し、痴呆症特有の特徴量を抽出する特徴量抽出手段、痴呆症の種類毎の特徴量をデータベースとして格納する記憶手段と、前記特徴量抽出手段によって抽出された特徴量とデータベースとして蓄積された痴呆症の特徴量とを比較し、特定痴呆症の判定を行なう判定手段とを備え、前記特徴量抽出手段は、前記ヘモグロビン変化信号の信号波形をモデル化し、モデル化した計測信号波形から自動的に特徴量を算出することを特徴とする。具体的には、特徴量抽出手段が行なうモデル化は、前記信号波形上の所定の点の既知座標値をモデルの対応する点の座標に代入しモデル波形とし、前記モデル波形と前記信号波形との二乗誤差を表す評価関数を定め、未知座標値の複数種の組み合わせを表す点を用いてシンプレックスを構成し、前記評価関数を最小とする組み合わせを見出す手順を繰り返すことを含んでいる。 The biological optical measurement apparatus of the present invention includes a probe attached to a subject, means for receiving optical signals from a plurality of measurement points obtained via the probe, and converting them into hemoglobin change signals, the plurality of measurement points Analyzing the hemoglobin change signal and extracting feature quantities specific to dementia, storage means storing feature quantities for each type of dementia as a database, and feature quantities extracted by the feature extraction means And a determination means for determining a specific dementia by comparing the characteristic amount of dementia accumulated as a database and the characteristic amount extraction means modeled and modeled the signal waveform of the hemoglobin change signal A feature amount is automatically calculated from a measurement signal waveform. Specifically, the modeling performed by the feature amount extraction unit substitutes a known coordinate value of a predetermined point on the signal waveform into the coordinate of the corresponding point of the model to form a model waveform, and the model waveform and the signal waveform The evaluation function representing the square error of the above, defining a simplex using points representing a plurality of combinations of unknown coordinate values, and repeating a procedure for finding a combination that minimizes the evaluation function.
信号波形のモデルとして台形モデルを用いることができ、またモデル化の手法としては最適化手法を採用できる。
本発明の生体光計測装置は、痴呆症、特にアルツハイマー病の診断に好適である。
A trapezoidal model can be used as a signal waveform model, and an optimization method can be adopted as a modeling method.
The living body optical measurement device of the present invention is suitable for diagnosis of dementia, particularly Alzheimer's disease.
本発明の生体光計測装置によれば、複数の計測点のヘモグロビン変化信号を解析し、痴呆症特有の特徴量を抽出する特徴量抽出手段を備え、特徴量抽出手段は信号波形をモデル化することによって特徴量を自動的に算出し、データベースと比較・判定することができる。これにより、計測から診断までを生体光計測装置で実現することができる。
また信号波形のモデル化手法として最適化手法、特にSimplex法を用いた方法を採用することによりモデル化の精度を高め、信頼性の高い診断結果を得ることができる。
According to the biological optical measurement device of the present invention, the apparatus includes a feature amount extraction unit that analyzes hemoglobin change signals at a plurality of measurement points and extracts a feature amount peculiar to dementia, and the feature amount extraction unit models a signal waveform. Thus, the feature amount can be automatically calculated and compared with the database. Thereby, from measurement to diagnosis can be realized by the living body light measurement device.
Further, by adopting an optimization method, particularly a method using the Simplex method, as a signal waveform modeling method, the modeling accuracy can be improved and a highly reliable diagnosis result can be obtained.
以下、本発明の生体光計測装置の実施の形態を、図面を参照して説明する。
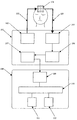
図1は本発明が適用される生体光計測装置の全体概要を示す図である。図示するようにこの生体光計測装置は、主として、生体に光を照射するとともに生体を透過した光を検出する光計測部101と、光計測部101からの信号を用いて血中ヘモグロビン量など生体内情報を計算し、表示するための信号処理部108とからなる。
Embodiments of the biological light measurement device of the present invention will be described below with reference to the drawings.
FIG. 1 is a diagram showing an overall outline of a biological light measurement apparatus to which the present invention is applied. As shown in the figure, this living body light measuring device mainly includes a
光計測部101は、所定の波長の光を被検体の検査部位に照射するための光源部102と、被検体の検査部位を透過した光或いは検査部位で反射、散乱した光(以下、まとめて透過光という)を検出する受光素子を備えた光検出部105〜107と、光源部102からの光を被検体の所定の部位に伝送する光ファイバ103と被検体からの透過光を光検出部に伝送する光ファイバ103の各先端を固定し、被検体に装着させる装着具(プローブ)104とからなる。
The
光源部101は、複数の光モジュールからなり、各光モジュールは、可視光から赤外の波長領域内の所定の波長、例えば780nmや830nmの二波長の光を放射する二個の半導体レーザを備えている。また光源部は、発振周波数の異なる複数の発振器で構成される発振部を備えており、各半導体レーザに、それぞれ異なる変調を与える。
The
半導体レーザからの、例えば二波長の光は、光モジュール毎に混合されて1本の照射用光ファイバ103に導入される。図では1本の光ファイバ103のみを示したが、実際には、照射用の光ファイバ103は、光モジュールの数と同数設けられる。これにより光モジュール毎に異なる変調を与えられた光が、それぞれ複数の光ファイバ先端から被検体表面に照射される。
For example, two-wavelength light from the semiconductor laser is mixed for each optical module and introduced into one irradiation
照射用及び受光用の光ファイバ103の先端は、互いに交互になるように、例えば3×3、4×4などの正方格子の交点に位置するように、プローブ104に固定される。照射用光ファイバ先端と受光用光ファイバ先端との間の領域が、光計測によって計測される計測点となる。
The tips of the irradiating and receiving
光検出部は、各受光用光ファイバ103に接続され、受光用光ファイバ103が誘導する光を光量に対応する電気信号に変換するフォトダイオード等の光電変換素子105と、光電変換素子105からの電気信号を入力し、照射位置(照射用光ファイバ先端の位置)及び波長に対応した変調信号を選択的に検出するための変調信号検出回路、例えばロックインアンプ106と、連続可変アンプ107とを備えている。
The light detection unit is connected to each light receiving
光電変換素子105としては光電子増倍管を用いても良い。またフォトダイオードを用いる場合には、高感度な光計測が実現できるアバランシェフォトダイオードが好適である。変調信号検出回路106は、照射位置と波長に対応した変調信号を選択的に検出するもので、アナログ変調の場合にはロックインアンプ106を使用する。デジタル変調の場合にはデジタルフィルターやデジタルシグナルプロセッサを用いる。またこの実施形態では照射光として二波長の光を用いているので、計測する信号数(チャンネル数)は[計測点]×[2]であり、これと同数のロックインアンプを備える。計測チャンネル毎に検出された信号は連続可変アンプ107で増幅され、図示しないA/D変換器でデジタル信号に変換され、信号処理部108に送られる。
As the
信号処理部108は、光検出部105〜107からの信号を記録するメモリ109と、光検出部からの信号を処理し、血中ヘモグロビンの変化量の計算、血中ヘモグロビン変化量の特徴の抽出、抽出された特徴に基く疾患判定などを行なう演算部110と、演算部110の演算結果や演算に必要なデータ、各痴呆症毎のヘモグロビン変化の特徴を蓄積したデータベースなどを記憶するハードディスク等の記憶部111と、計測信号のタイムコースや演算結果であるトポグラフィ画像を表示する表示部(モニタ)112とを備えている。また図示しないが、光計測における条件や患者情報などを入力するための入力部が備えられており、モニタ112には入力のためのGUIが表示される。このような構成の信号処理部108は、汎用のパーソナルコンピュータ上に構築することができ、生体光計測装置と直接ケーブルによって接続してもよいし、通信ネットワーク、可搬媒体等によりデータの送受を行なうものであってもよい。
The
次にこのような構成における本発明の生体光計測装置における動作を説明する。
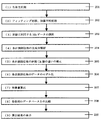
図2は、本発明の生体光計測装置における動作の流れの一実施形態を示す図であり、基本動作は(1)生体光計測(201)、(2)計測データの前処理(202)、(3)痴呆症診断に用いるデータ選択(203)、(4)主成分解析(204)、(5)計測チャンネル数補正(205)、(6)計測データのモデル化(206)、(7)特徴量算出(207)、(8)各症例のデータベースとの比較(208)、(9)結果の表示(209)からなる。以下、各ステップについて詳述する。
Next, the operation of the biological light measurement device of the present invention having such a configuration will be described.
FIG. 2 is a diagram showing an embodiment of an operation flow in the biological light measurement device of the present invention. The basic operation is (1) biological light measurement (201), (2) preprocessing (202) of measurement data, (3) Data selection for dementia diagnosis (203), (4) Principal component analysis (204), (5) Measurement channel number correction (205), (6) Modeling of measurement data (206), (7) Feature quantity calculation (207), (8) Comparison with each case database (208), (9) Result display (209). Hereinafter, each step will be described in detail.
(1)生体光計測(ステップ201)
プローブ104を被検者に装着した状態で、光の照射と受光を行いながら、発語能力(Word Fluency)テスト等のタスクを与え、その際のヘモグロビン変化量を測定する。計測部位は、前頭部、左側頭部、右側頭部とし、プローブの種類により、同時にあるいは4箇所を別々に計測する。プローブの計測点毎に計測されたヘモグロビン変化信号は、横軸を時間、縦軸をヘモグロビン変化量とするタイムコースのグラフで与えられ、酸素化ヘモグロビン量、脱酸素化ヘモグロビン量、ヘモグロビン総量のそれぞれについて得られる。所定のタスクを一定の繰り返し時間で繰り返すことにより、繰り返しの間隔毎のヘモグロビン変化量が得られる。
(1) Measurement of biological light (step 201)
With the
(2)前処理(ステップ202)
前処理は、主としてタスク前後における変化量を算出するためのフィッティング処理と、計測結果のSNを向上させるための加算処理とからなる。フィッティング処理では、照射光の波長をλとしたとき、照射光量R0(λ)、タスクを実行する前(非実行時)の検出光量RS(λ)、タスク実行時の検出光量R(λ)、波長λにおける酸素化及び脱酸素化ヘモグロビンの分子吸光係数を用いて、酸素化及び脱酸素化ヘモグロビンの濃度変化を算出する。算出方法の詳細は、例えば特許文献5に記載されている。加算処理は、複数回の結果を加算平均する処理である。
The preprocessing mainly includes a fitting process for calculating the amount of change before and after the task and an addition process for improving the SN of the measurement result. In the fitting process, when the wavelength of the irradiation light is λ, the irradiation light amount R 0 (λ), the detected light amount R S (λ) before executing the task (when not executing), the detected light amount R (λ ) Using the molecular extinction coefficient of oxygenated and deoxygenated hemoglobin at the wavelength λ, the concentration change of oxygenated and deoxygenated hemoglobin is calculated. The details of the calculation method are described in
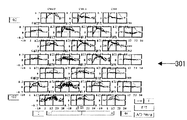
以上の前処理を行った後のデータ301を図3に示す。図3はチャンネル数24の場合の計測結果の表示例301を示す図で、各チャンネル毎に、横軸を時間、縦軸をヘモグロビン変化量を示すグラフが表示される。ヘモグロビン変化量は、酸素化ヘモグロビン量、脱酸素化ヘモグロビン量、ヘモグロビン総量のそれぞれが表示されている。またグラフには、タスクの開始時と終了時を示す2本の縦線が表示される。その前後はタスク開始前の待機時間とタスク終了後のレスト時間である。
(3)痴呆症診断に用いるデータ選択(ステップ203)
前処理後の酸素化ヘモグロビン量データ、脱酸素化ヘモグロビン量データ及びヘモグロビン総量データのうち、臨床上必要なデータを選択する。これは、ユーザーがモニタ112に表示されたグラフから判断してもよいし、診断対象が痴呆症である場合には、自動的に例えば酸素化ヘモグロビン量を選択するようにしてもよい。
(3) Data selection for dementia diagnosis (step 203)
Of the oxygenated hemoglobin amount data, the deoxygenated hemoglobin amount data, and the total hemoglobin amount data after pretreatment, clinically necessary data is selected. This may be determined from the graph displayed on the
(4)主成分解析(ステップ204)
一つの解析対象データが選択されたならば、計測部位毎に主成分解析を行ない、各計測部位における典型的反応を抽出する。具体的には、次の手順を行なう。
(a)各チャンネルで得られたヘモグロビン変化信号fm(n)(mは計測したチャンネル番号でチャンネル数をMとするとき1≦m≦M、nは計測された経時データ番号で、データ数をNとするとき1≦n≦N)の集合F(行列)に対しその転置行列FTを重畳し、正方行列W(=FFT)を作成する。
(b)この正方行列Wについて、固有値λ(固有値行列Λ)及び固有ベクトルWを次式(1)及び(2)により求める。
Λ=W-1XW (1)
(X−Λ)W=0 (2)
(c)固有ベクトルWは、第1主成分から第M主成分までの固有ベクトルv1を列とするM列の行列であり、この固有ベクトルの転置行列v1 Tをヘモグロビン変化信号f1(n)にかけることにより、各チャンネル毎に、第1主成分波形G(m)(=√(λ)・v1)を得る。
(d)各チャンネルについて、それぞれ得られた第1主成分波形G(m)を重畳させることにより、その計測部位についての代表波形を得る。
以上のような主成分分析により得られた代表波形401を図4に示す。図4において縦軸はヘモグロビン変化量、横軸は時間でタスク開始時点を0として示している。
(4) Principal component analysis (step 204)
If one piece of analysis target data is selected, a principal component analysis is performed for each measurement site, and a typical reaction at each measurement site is extracted. Specifically, the following procedure is performed.
(A) hemoglobin change signal fm (n) obtained in each channel (where m is the measured channel number and the number of channels is M, 1 ≦ m ≦ M, n is the measured data number over time, and the number of data When N is set, a transposed matrix F T is superimposed on a set F (matrix) of 1 ≦ n ≦ N) to create a square matrix W (= FF T ).
(B) For this square matrix W, eigenvalue λ (eigenvalue matrix Λ) and eigenvector W are obtained by the following equations (1) and (2).
Λ = W −1 XW (1)
(X−Λ) W = 0 (2)
(C) The eigenvector W is an M-column matrix having eigenvectors v 1 from the first principal component to the M-th principal component as columns, and the transposed matrix v 1 T of this eigenvector is used as the hemoglobin change signal f 1 (n). By applying, the first principal component waveform G (m) (= √ (λ) · v 1 ) is obtained for each channel.
(D) For each channel, the obtained first principal component waveform G (m) is superimposed to obtain a representative waveform for the measurement site.
A
(5)計測チャンネル数補正(ステップ205)
上記ステップ204において、各計測部位(前頭部、左側頭部、右側頭部)ごとに代表波形が算出されるが、計測部位によって計測チャンネル数が異なるので、まず計測チャンネル数の違いを補正する。このため、各計測部位について得られた第1主成分波形について、固有値λをチャンネル数kで除したものを固定値として各計測部位における代表波形(G’=√(λ/k)・v1)とする。チャンネル数を補正した後の波形501を図5に示す。図5においても縦軸はヘモグロビン、横軸は時間であり、タスク開始時点とタスク終了時点をそれぞれ2本の線503、505で示している。2本の線の間隔がタスク持続時間504に相当する。また以下説明するパラメータ(特徴量)算出に必要な波形501上の点、計測開始時点506、タスク開始時点507、タスク終了時点508及び計測終了時点509を示している。これらの点の座標は、次のモデル化における自動計算に用いられる。
(5) Correction of number of measurement channels (step 205)
In
(6)計測データのモデル化(206)
各計測部位について求められた代表波形に対し、痴呆症の診断上重要なパラメータを求める目的で、モデル化を行なう。モデル化には生体信号に対応していると考えられる多角形等のいくつかのモデルを用いることもできるが、本実施形態では台形モデルによるモデル化を図6を参照して説明する。
(6) Modeling measurement data (206)
Modeling is performed on the representative waveform obtained for each measurement site for the purpose of obtaining parameters important for the diagnosis of dementia. For modeling, several models such as polygons that are considered to correspond to biological signals can be used. In the present embodiment, modeling by a trapezoidal model will be described with reference to FIG.
図6(a)は台形モデルを示す波形601であり、タスク開始時点603、タスク終了時点605及びタスク持続時間604も図中に示されている。この台形モデル波形601は、6つの点A〜Fの座標で定義することができ。これらA〜Fの座標をそれぞれ(tA yA)、(tB yA)、(tC yC)、(tD yC)、(tE yE)、(tF yE)とすると、下記の関係が成り立つ。

このような台形モデルを用いたモデル化は、図6(b)に示すように、代表波形501に最も適合する台形波形611を見出す処理であり、公知の最適化法を用いて自動計算により行なうことができる。ここではSimplex法を用いて二乗誤差を最小化するモデル化手法を説明する。図7に最適化の手順を示す。なお、Simplex法の詳細に関しては例えば非特許文献に紹介されている。
(a)初期値の設定(ステップ701)
点A〜Fの6点の座標の初期値を、モデル化の対象としている代表波形(図5、501)の以下の点の座標値から算出する。
The initial values of the coordinates of the six points A to F are calculated from the coordinate values of the following points of the representative waveform (FIG. 5, 501) to be modeled.
代表波形上の点X1、X2、X4、X6の座標値から次のように、点A〜Fの初期値を定める。
この時点で、点A〜Fの6点の座標を(tA yA)、(tB yA)、(tC yC)、(tD yC)、(tE yE)、(tF yE)のうち、以下のように一部の値を初期値から求めた値を用いて算出結果として、決定する。
tA*=tX1 (3)
tF*=tX6 (4)
At this time, the coordinates of the six points A to F are changed to (t A y A ), (t B y A ), (t C y C ), (t D y C ), (t E y E ), ( Among t F y E ), some values are determined as calculation results using values obtained from initial values as follows.
t A * = t X1 (3)
t F * = t X6 (4)
(b)モデル化の対象としている代表波形の設定(ステップ702)
モデル化の対象としている代表波形を構成するN点の各点の座標値を次のように表す。
![]()
The coordinate values of the N points constituting the representative waveform to be modeled are expressed as follows.
![]()
(c)評価関数の設定(図7:ステップ703)
まだ推定値の定まっていない変数tB,tC,tD,tE,yA,yC,yEの値を定める目的で、変数tB,tC,tD,tE,yA,yC,yE及び定数tA*,tF*により構成される台形モデル波形と、モデル化の対象としている代表波形との二乗誤差を表す評価関数を、次式のように定める。
Variable t B that not determined yet the estimate, t C, t D, t E, y A, y C, for the purpose of determining the value of y E, variable t B, t C, t D , t E, y A , y C , y E and constants t A *, t F * and an evaluation function representing a square error between a representative waveform to be modeled and a representative waveform to be modeled are defined as follows:
(d)初期Simplexの設定(ステップ704)
変数がtB,tC,tD,tE,yA,yC,yEの7個あるので、8種類の変数の組み合わせを表す点P1〜P8を用いて、1つのSimplexを構成する。
まず、初期値の設定(ステップ701)で設定した点A〜Fの初期値を用いて、下記のように初期Simplexの初期値を表す点P1,start〜P8,startを設定する。
Since there are seven variables, t B , t C , t D , t E , y A , y C , y E , one simplex is created using points P 1 to P 8 representing combinations of eight types of variables. Constitute.
First, using the initial values of the points A to F set in the initial value setting (step 701), the points P 1, start to P 8, start representing the initial value of the initial Simplex are set as follows.
(e)繰り返し計算による最適化計算の実行(ステップ705)
上記の初期Simplexの設定(ステップ704)で設定した初期Simplexを用いて、以下のアルゴリズムの実行を開始する。図8に最適化計算のフローを示す。
(e−1)
まず評価関数fを用いて1つのSimplexを構成する点P1〜P8の各々の点における評価関数値fP1〜fP8を求める(ステップ801)。点P1〜P8はそれぞれ7の変数を持つベクトルで表される。
(E) Execution of optimization calculation by repeated calculation (step 705)
Using the initial Simplex set in the initial Simplex setting (step 704), execution of the following algorithm is started. FIG. 8 shows the flow of optimization calculation.
(E-1)
First, evaluation function values f P1 to f P8 at each point P 1 to P 8 constituting one Simplex are obtained using the evaluation function f (step 801). Points P 1 to P 8 are each represented by a vector having seven variables.
(e−2)
点P1〜P8のうちその点における評価関数値fP1〜fP8が、最小の値を持つ点を点S、最大の値を持つ点を点Hとする(ステップ802)。そして、点Sを表すベクトルをSV(ここでSVは文字「S」の上に右矢印が付いた文字と同義である、以下同じ)、評価関数値fP1〜fP8のうち最小値となる点Sにおける評価関数値をf(SV)、点Hを表すベクトルをHV(ここでHVは文字「H」の上に右矢印が付いた文字と同義である、以下同じ)、評価関数値fP1〜fP8のうち最大値となる点Hにおける評価関数値をf(HV)とする。
(E-2)
Of the points P 1 to P 8 , the evaluation function values f P1 to f P8 at that point are defined as a point S having a minimum value and a point H having a maximum value as a point H (step 802). The vector representing the point S is SV (herein, SV is synonymous with the letter with the right arrow on the letter “S”, the same applies hereinafter), and is the minimum value among the evaluation function values f P1 to f P8. The evaluation function value at the point S is f (SV), the vector representing the point H is HV (where HV is the same as the letter with the right arrow on the letter “H”, and so on), the evaluation function value f the evaluation function value in the H point at which the maximum value among P1 ~f P8 and f (HV).
(e−3)
点P1〜P8から点Hを除いた7点の重心位置を表す点Oを求める(ステップ803)。重心点Oを表すベクトルは次式で表すことができる。
評価関数値をより小さくする可能性のある改善値の探索を行なう(ステップ804)。
このため、まず、鏡像パラメータα(αは0より大きい任意の値。ここではα=0.1とする)を用いて、鏡像点Rを表すベクトルを次式のように求める。
A point O representing the barycentric positions of the seven points excluding the point H from the points P 1 to P 8 is obtained (step 803). A vector representing the center of gravity point O can be expressed by the following equation.
A search is made for an improved value that may make the evaluation function value smaller (step 804).
For this reason, first, using the mirror image parameter α (α is an arbitrary value greater than 0, where α = 0.1), a vector representing the mirror image point R is obtained as follows.
次に、拡張のパラメータγ(γはγ≧1またはγ=0を満たす値。ここではγ=1.5とする)を用いて、拡張点Eを表すベクトルを次式のように求める。
鏡像点Rにおける評価関数値と点Hの評価関数値及び点Sの評価関数値との関係が、
![]()
![]()
![]()
![]()
![]()
![]()
![]()
![]()
(e−5)
収束条件のチェックを行なう(ステップ805)。
まず更新された新しいシンプレックスを構成する8点のうち、評価関数値が最小となる点S2を求める。そしてこの点S2を表すベクトルと、点S2における評価関数値を求める。
A convergence condition is checked (step 805).
First, a point S 2 having a minimum evaluation function value is obtained from the eight points constituting the updated new simplex. And a vector representing the point S 2, obtaining the evaluation function value at point S 2.
次に収束条件として、下記2条件のチェックを行なう。
条件1:ステップ801〜804までの計算処理の繰り返し回数が一定の回数(例えば2000回)を超えている。
条件2:点S2における評価関数値が一定の値(例えば0.05)以下となっている。
条件1及び条件2を満たしていない場合には、ステップ804で更新された新しいシンプレックスを用いてステップ801の計算処理に戻る。条件1もしくは条件2を満たしている場合は、繰り返し計算を終了し、点S2を最適なパラメータを表す組み合わせとして採用する。
最後に採用された点S2の値(式(5))及びステップ701で決定された値(式(3)、(4))により、tA *,tB *tC *,tD *tE *,tF *yA *,yC *yE *の値が定まり、図6(b)に示す台形波形701の点A*〜F*の座標が求められる。即ち、これら6点の座標は
Condition 1: The number of repetitions of the calculation processing in
Condition 2: evaluation function value at the point S 2 becomes a constant value (e.g., 0.05) or less.
If the
Based on the value of the last point S 2 (Equation (5)) and the values determined in Step 701 (Equations (3) and (4)), t A * , t B * t C * , t D * t E *, t F * y a *, Sadamari is y C * y E * value, the point a * to F * coordinates of the
(7)特徴量算出(ステップ207)
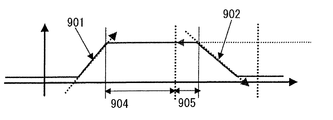
こうして各計測部位についてモデル化がなされたならば、痴呆症の診断に用いる特徴量を算出する。痴呆症の診断に用いることが可能な特徴量を図9に例示する。図示するように、モデル化波形のタスク中の傾き901、モデル化波形のタスク終了後の傾き902、モデル化波形の最大平坦部分の高さ903、モデル化波形の最大平坦部分のタスク中の継続時間904、モデル化波形の最大平坦部分のタスク終了後の継続時間905などが特徴量として用いることができ、さらに代表波形の大きさ(√(λ/n))も用いることができる。特にアルツハイマー病の診断には、モデル化波形の最大平坦部分の高さ903が有効である。
(7) Feature amount calculation (step 207)
If modeling is performed for each measurement site in this way, a feature value used for diagnosis of dementia is calculated. FIG. 9 illustrates feature quantities that can be used for diagnosis of dementia. As shown, the
代表波形をモデル化することによって上記特徴量は自動的に算出されるので、ユーザーが診断しようとする痴呆症の種類に応じて任意の種類、数の特徴量を選択してもよい。 Since the feature amount is automatically calculated by modeling the representative waveform, an arbitrary type and number of feature amounts may be selected according to the type of dementia to be diagnosed by the user.
(8)各症例のデータベースとの比較(ステップ208)
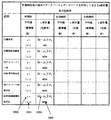
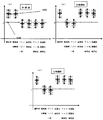
本実施の形態の生体光計測装置は、各症例の特徴量がデータベースとして蓄積されており、このデータベースとの比較から被検者の症例を診断する。データベースは、予め別の診断方法によって診断が確定された痴呆症の患者及び健常者について、光計測を行い、その結果を以上述べた手順で処理することによって得ることができる。図10に「モデル化波形の最大平坦部の高さ」の例を示す。図示するように、健常者、軽度認知障害、アルツハイマー病、血管性痴呆症、アルコール性痴呆症、前頭葉側頭葉性痴呆症の各々について、各計測部位の平均値μ1002及び分散σ1003が格納されている。図11は、これをグラフィカルに示したものであり、(a)は前頭部、(b)は左側頭部、(c)は右側頭部を示している。図中、縦軸は波形の最大平坦部の高さで、平均値1102とその上下に分散1103が棒状に示されている。横軸は健常者を含む6種類の症例に対応する。
(8) Comparison with each case database (step 208)
In the living body light measurement apparatus according to the present embodiment, feature amounts of each case are accumulated as a database, and a case of a subject is diagnosed by comparison with this database. The database can be obtained by performing optical measurement on a patient with dementia and a healthy person whose diagnosis has been confirmed by another diagnostic method in advance and processing the result according to the procedure described above. FIG. 10 shows an example of “the height of the maximum flat portion of the modeled waveform”. As shown in the figure, for each of healthy subjects, mild cognitive impairment, Alzheimer's disease, vascular dementia, alcoholic dementia, frontotemporal temporal dementia, the average value μ1002 and variance σ1003 of each measurement site are stored. Yes. FIG. 11 shows this graphically, where (a) shows the frontal head, (b) shows the left head, and (c) shows the right head. In the figure, the vertical axis represents the height of the maximum flat portion of the waveform, and the
このような各症例におけるデータベースと、ステップ208で算出された計測部位毎の特徴量、ここではモデル化波形の最大平坦部の高さα、β、γを比較する。図11に示したように本発明者らの検討によれば、3つの計測部位における健常者の範囲(平均値及び分散)を正常としたとき、症例によって異常となる計測部位が異なることがわかっている(表1)。そこで被検者の特徴量α、β、γ及びデータベースの値(平均値及び分散)を用いて、z判定等の公知の統計的手法によりアルツハイマー病か否かの判定を行なうことができる。具体的には、z=(α−μ)/σよりz統計量1004を算出し、z統計量から正規分布表を用いて危険率1005を求める。そして危険率が全ての部位について高い値(例えば50%以上)を示したものをアルツハイマー病と判定する。
The database in each case is compared with the feature amount for each measurement site calculated in
(9)結果の表示(209)
最終的な結果は、被検者の名前、年令、性別、計測年月日等の被検者情報とともにモニタ112に表示される。図12に表示例1201を示す。図示する例では、被検者情報表示部1202と、計測部位毎の計測結果表示部1208、1209・・・があり、計測結果表示部には、計測部位1203、各チャンネルの計測結果1204、主成分解析処理結果1205、モデル化波形1206、特徴量1206が表示される。特徴量表示部1206は、算出した特徴量のほかにデータベースの平均値及び分散や、それに基づく危険率や判定結果などを合わせて表示する。
(9) Display of results (209)
The final result is displayed on the
以上、本発明の実施の形態を説明したが、本発明の生体光計測装置はこれら実施の形態に限定されることなく種々の変更が可能である。例えば特徴量は症例に応じて「平坦部の高さ」以外のものを用いることができるし、ここではz統計量を用いて症例の判定を行なうことを説明したが、例えば図11に示すような結果を表示し、ユーザー(医師)が判定するようにしてもよい。また計測の精度を高めるために、ステップ202の加算平均処理やステップ205の補正は必要であるが、これらステップを省いたものも本発明の範囲に含まれる。
As mentioned above, although embodiment of this invention was described, the biological-light measuring device of this invention can be variously changed without being limited to these embodiment. For example, features other than “the height of the flat portion” can be used according to the case. In this example, the case determination using the z statistic has been described. For example, as shown in FIG. May be displayed by the user (doctor). Further, in order to increase the accuracy of measurement, the averaging process in
本発明の生体光計測装置は、計測されたヘモグロビン変化波形をモデル化し、症例の判断に適するパラメータ(特徴)を自動的に算出する手段を備えているので、診断に重要なパラメータを提供することができる。特に痴呆症の正確な診断に資することができる。 The biological optical measurement apparatus of the present invention is provided with means for modeling a measured hemoglobin change waveform and automatically calculating parameters (features) suitable for case determination, and therefore provides important parameters for diagnosis. Can do. In particular, it can contribute to an accurate diagnosis of dementia.
101・・・光計測部、104・・・プローブ、105・・・光電変換素子、106・・・ロックインアンプ、107・・・連続可変アンプ、108・・・信号処理部、109・・・メモリ、110・・・演算部、111・・・記憶部、112・・・モニタ
DESCRIPTION OF
Claims (4)
前記特徴量抽出手段は、前記ヘモグロビン変化信号の信号波形をモデル化し、モデル化した計測信号波形から自動的に特徴量を算出することを特徴とする生体光計測装置。 A probe mounted on a subject, means for receiving optical signals from a plurality of measurement points obtained via the probes and converting them into hemoglobin change signals, analyzing hemoglobin change signals at the plurality of measurement points, and dementia Feature quantity extracting means for extracting feature quantities peculiar to dementia, storage means for storing feature quantities for each type of dementia as a database, feature quantities extracted by the feature quantity extracting means and dementia accumulated as a database A determination means for comparing the feature amount and determining the specific dementia,
The biological light measurement device, wherein the feature amount extraction unit models a signal waveform of the hemoglobin change signal and automatically calculates a feature amount from the modeled measurement signal waveform.
The living body light measuring apparatus according to claim 1, wherein the specific dementia determined by the determining unit is Alzheimer's disease.
Priority Applications (2)
| Application Number | Priority Date | Filing Date | Title |
|---|---|---|---|
| JP2004115474A JP4477403B2 (en) | 2004-04-09 | 2004-04-09 | Biological light measurement device |
| PCT/JP2005/005709 WO2005096951A1 (en) | 2004-04-09 | 2005-03-28 | Biophotonic measuring apparatus |
Applications Claiming Priority (1)
| Application Number | Priority Date | Filing Date | Title |
|---|---|---|---|
| JP2004115474A JP4477403B2 (en) | 2004-04-09 | 2004-04-09 | Biological light measurement device |
Publications (3)
| Publication Number | Publication Date |
|---|---|
| JP2005296231A JP2005296231A (en) | 2005-10-27 |
| JP2005296231A5 JP2005296231A5 (en) | 2007-05-31 |
| JP4477403B2 true JP4477403B2 (en) | 2010-06-09 |
Family
ID=35124790
Family Applications (1)
| Application Number | Title | Priority Date | Filing Date |
|---|---|---|---|
| JP2004115474A Expired - Fee Related JP4477403B2 (en) | 2004-04-09 | 2004-04-09 | Biological light measurement device |
Country Status (2)
| Country | Link |
|---|---|
| JP (1) | JP4477403B2 (en) |
| WO (1) | WO2005096951A1 (en) |
Cited By (2)
| Publication number | Priority date | Publication date | Assignee | Title |
|---|---|---|---|---|
| TWI638641B (en) | 2017-07-26 | 2018-10-21 | 鼎博康生物科學有限公司 | System for sensing physiological characteristics |
| KR20220096272A (en) * | 2020-12-30 | 2022-07-07 | 광주과학기술원 | Apparatus for Diagnosing Dementia Using Near Infrared and EEG signals |
Families Citing this family (14)
| Publication number | Priority date | Publication date | Assignee | Title |
|---|---|---|---|---|
| JP4517111B2 (en) * | 2004-06-07 | 2010-08-04 | 独立行政法人情報通信研究機構 | Brain function measuring device, brain function measuring method, and brain function measuring program |
| JPWO2007144977A1 (en) * | 2006-06-15 | 2009-10-29 | 株式会社日立メディコ | Biological light measurement device |
| JP5248758B2 (en) * | 2006-09-08 | 2013-07-31 | 株式会社島津製作所 | Optical measuring device |
| JP5319058B2 (en) * | 2006-09-29 | 2013-10-16 | 山本 勝美 | Diagnosis method of disease |
| US20100256468A1 (en) * | 2007-05-21 | 2010-10-07 | Hitachi Medical Corporation | Apparatus for measuring biological light |
| JPWO2010029832A1 (en) * | 2008-09-10 | 2012-02-02 | 株式会社日立メディコ | Biological light measurement device |
| JP5959016B2 (en) * | 2011-05-31 | 2016-08-02 | 国立大学法人 名古屋工業大学 | Cognitive impairment determination apparatus, cognitive impairment determination system, and program |
| JP6008099B2 (en) * | 2012-07-30 | 2016-10-19 | 学校法人日本大学 | Brain activity state analysis device, brain activity state analysis method, and brain activity state analysis program |
| JP6477280B2 (en) * | 2015-06-16 | 2019-03-06 | 株式会社島津製作所 | Cognitive brain activity measurement system and cognitive brain activity measurement method |
| JP6702836B2 (en) * | 2016-09-28 | 2020-06-03 | ハルメク・ベンチャーズ株式会社 | Dementia evaluation score calculation device and program thereof |
| US11399765B2 (en) | 2017-02-16 | 2022-08-02 | Panasonic Intellectual Property Management Co., Ltd. | Dementia information output system and recording medium |
| KR102305828B1 (en) * | 2019-09-27 | 2021-09-30 | 주식회사 엔서 | Apparatus and System for Diagnosing Dementia |
| KR102319336B1 (en) * | 2020-02-12 | 2021-10-29 | 주식회사 엔서 | Apparatus and System for Diagnosing Dementia Including the Same |
| JP7109499B2 (en) * | 2020-05-07 | 2022-07-29 | 一般社団法人脳と心の健康科学研究所 | Dementia judgment score calculation device and its program |
Family Cites Families (1)
| Publication number | Priority date | Publication date | Assignee | Title |
|---|---|---|---|---|
| JP3916985B2 (en) * | 2002-03-26 | 2007-05-23 | 株式会社日立メディコ | Biological light measurement device |
-
2004
- 2004-04-09 JP JP2004115474A patent/JP4477403B2/en not_active Expired - Fee Related
-
2005
- 2005-03-28 WO PCT/JP2005/005709 patent/WO2005096951A1/en active Application Filing
Cited By (3)
| Publication number | Priority date | Publication date | Assignee | Title |
|---|---|---|---|---|
| TWI638641B (en) | 2017-07-26 | 2018-10-21 | 鼎博康生物科學有限公司 | System for sensing physiological characteristics |
| KR20220096272A (en) * | 2020-12-30 | 2022-07-07 | 광주과학기술원 | Apparatus for Diagnosing Dementia Using Near Infrared and EEG signals |
| KR102507788B1 (en) * | 2020-12-30 | 2023-03-08 | 광주과학기술원 | Apparatus for Diagnosing Dementia Using Near Infrared and EEG signals |
Also Published As
| Publication number | Publication date |
|---|---|
| JP2005296231A (en) | 2005-10-27 |
| WO2005096951A1 (en) | 2005-10-20 |
Similar Documents
| Publication | Publication Date | Title |
|---|---|---|
| JP4477403B2 (en) | Biological light measurement device | |
| Pinti et al. | A review on the use of wearable functional near‐infrared spectroscopy in naturalistic environments | |
| US20200375465A1 (en) | Super-pixel detection for wearable diffuse optical tomography | |
| JP3916985B2 (en) | Biological light measurement device | |
| JP4555230B2 (en) | Biological light measurement device | |
| JP5982483B2 (en) | Biological condition evaluation apparatus and program therefor | |
| JP4474145B2 (en) | Optical measuring device | |
| KR102099214B1 (en) | Artificial intelligence diseases diagnostic system through biological information and video information cooperation | |
| KR102487983B1 (en) | Apparatus and Method for construction of disease prediction model, and Apparatus for disease prediction. | |
| US20120215114A1 (en) | Non-Invasive Optical Imaging for Measuring Pulse and Arterial Elasticity in the Brain | |
| US20140107439A1 (en) | Biological optical measurement device, stimulus presentation method, and stimulus presentation program | |
| JP2007289224A (en) | Living body measurement system and method | |
| US7890270B2 (en) | Optical system for measuring metabolism in a body, method and program | |
| JP6404162B2 (en) | Brain function index calculation device and brain function index calculation method | |
| EP2642910B1 (en) | Device and method for determining a disease activity | |
| AU2021350834A1 (en) | Systems, devices, and methods for developing a fetal oximetry model for use to determine a fetal oximetry value | |
| US20080273174A1 (en) | Method for evaluating longitudinal optic disc-retinal health | |
| JP3952275B2 (en) | Biological light measurement device | |
| JP7444003B2 (en) | Mood disorder measuring device and mood disorder measuring method | |
| US20240055091A1 (en) | Method for calculating a degree of fatigue | |
| WO2010029832A1 (en) | Biological light measuring apparatus | |
| JP2023020340A (en) | Learning device and estimation device | |
| CN115708678A (en) | Brain-computer interface experimental method based on functional near infrared | |
| JP4946847B2 (en) | Optical brain functional imaging system |
Legal Events
| Date | Code | Title | Description |
|---|---|---|---|
| A521 | Request for written amendment filed |
Free format text: JAPANESE INTERMEDIATE CODE: A523 Effective date: 20070406 |
|
| A621 | Written request for application examination |
Free format text: JAPANESE INTERMEDIATE CODE: A621 Effective date: 20070406 |
|
| TRDD | Decision of grant or rejection written | ||
| A01 | Written decision to grant a patent or to grant a registration (utility model) |
Free format text: JAPANESE INTERMEDIATE CODE: A01 Effective date: 20100302 |
|
| A01 | Written decision to grant a patent or to grant a registration (utility model) |
Free format text: JAPANESE INTERMEDIATE CODE: A01 |
|
| A61 | First payment of annual fees (during grant procedure) |
Free format text: JAPANESE INTERMEDIATE CODE: A61 Effective date: 20100311 |
|
| R150 | Certificate of patent or registration of utility model |
Free format text: JAPANESE INTERMEDIATE CODE: R150 |
|
| FPAY | Renewal fee payment (event date is renewal date of database) |
Free format text: PAYMENT UNTIL: 20130319 Year of fee payment: 3 |
|
| FPAY | Renewal fee payment (event date is renewal date of database) |
Free format text: PAYMENT UNTIL: 20140319 Year of fee payment: 4 |
|
| LAPS | Cancellation because of no payment of annual fees |