JP4006826B2 - Biological light measurement device - Google Patents
Biological light measurement device Download PDFInfo
- Publication number
- JP4006826B2 JP4006826B2 JP13464998A JP13464998A JP4006826B2 JP 4006826 B2 JP4006826 B2 JP 4006826B2 JP 13464998 A JP13464998 A JP 13464998A JP 13464998 A JP13464998 A JP 13464998A JP 4006826 B2 JP4006826 B2 JP 4006826B2
- Authority
- JP
- Japan
- Prior art keywords
- measurement
- light
- display
- screen
- displayed
- Prior art date
- Legal status (The legal status is an assumption and is not a legal conclusion. Google has not performed a legal analysis and makes no representation as to the accuracy of the status listed.)
- Expired - Lifetime
Links
Images


Classifications
-
- G—PHYSICS
- G01—MEASURING; TESTING
- G01N—INVESTIGATING OR ANALYSING MATERIALS BY DETERMINING THEIR CHEMICAL OR PHYSICAL PROPERTIES
- G01N21/00—Investigating or analysing materials by the use of optical means, i.e. using sub-millimetre waves, infrared, visible or ultraviolet light
- G01N21/17—Systems in which incident light is modified in accordance with the properties of the material investigated
- G01N21/47—Scattering, i.e. diffuse reflection
- G01N21/49—Scattering, i.e. diffuse reflection within a body or fluid
-
- A—HUMAN NECESSITIES
- A61—MEDICAL OR VETERINARY SCIENCE; HYGIENE
- A61B—DIAGNOSIS; SURGERY; IDENTIFICATION
- A61B5/00—Measuring for diagnostic purposes; Identification of persons
- A61B5/145—Measuring characteristics of blood in vivo, e.g. gas concentration, pH value; Measuring characteristics of body fluids or tissues, e.g. interstitial fluid, cerebral tissue
- A61B5/1455—Measuring characteristics of blood in vivo, e.g. gas concentration, pH value; Measuring characteristics of body fluids or tissues, e.g. interstitial fluid, cerebral tissue using optical sensors, e.g. spectral photometrical oximeters
- A61B5/14551—Measuring characteristics of blood in vivo, e.g. gas concentration, pH value; Measuring characteristics of body fluids or tissues, e.g. interstitial fluid, cerebral tissue using optical sensors, e.g. spectral photometrical oximeters for measuring blood gases
- A61B5/14553—Measuring characteristics of blood in vivo, e.g. gas concentration, pH value; Measuring characteristics of body fluids or tissues, e.g. interstitial fluid, cerebral tissue using optical sensors, e.g. spectral photometrical oximeters for measuring blood gases specially adapted for cerebral tissue
-
- A—HUMAN NECESSITIES
- A61—MEDICAL OR VETERINARY SCIENCE; HYGIENE
- A61B—DIAGNOSIS; SURGERY; IDENTIFICATION
- A61B5/00—Measuring for diagnostic purposes; Identification of persons
- A61B5/74—Details of notification to user or communication with user or patient ; user input means
- A61B5/742—Details of notification to user or communication with user or patient ; user input means using visual displays
- A61B5/7435—Displaying user selection data, e.g. icons in a graphical user interface
-
- A—HUMAN NECESSITIES
- A61—MEDICAL OR VETERINARY SCIENCE; HYGIENE
- A61B—DIAGNOSIS; SURGERY; IDENTIFICATION
- A61B5/00—Measuring for diagnostic purposes; Identification of persons
- A61B5/0033—Features or image-related aspects of imaging apparatus classified in A61B5/00, e.g. for MRI, optical tomography or impedance tomography apparatus; arrangements of imaging apparatus in a room
- A61B5/004—Features or image-related aspects of imaging apparatus classified in A61B5/00, e.g. for MRI, optical tomography or impedance tomography apparatus; arrangements of imaging apparatus in a room adapted for image acquisition of a particular organ or body part
- A61B5/0042—Features or image-related aspects of imaging apparatus classified in A61B5/00, e.g. for MRI, optical tomography or impedance tomography apparatus; arrangements of imaging apparatus in a room adapted for image acquisition of a particular organ or body part for the brain
Description
【0001】
【発明の属する技術分野】
本発明は生体光計測装置、特に生体内部を光学的に測定し、それによって得られる情報信号にもとづいて生体内部を画像化するために用いられるのに適した生体光計測装置に関する。
【0002】
【従来の技術】
生体内部を簡便でかつ生体に害を与えずに測定する技術が臨床医療の分野で望まれている。この要望に対し、光を用いた計測は非常に有効である。その第1の理由は、生体内部の酸素代謝機能は生体中の特定色素(ヘモグロビン、チトクロームa a3、ミオグロビン等)、すなわち、光吸収体の濃度に対応し、この特定色素濃度は光(可視から近赤外領域の波長)吸収量から求められ得るからである。第2の理由は、光は光ファイバによる扱いが簡便であるからである。第3の理由は、光計測は、安全基準(ANSIZ 136-1973, JISC6802規格:2mW/mm2)の範囲内での使用により生体に害を与えないからである。
【0003】
このような、光を用いた生体計測の利点を利用して、可視から近赤外の波長の光を生体に照射し、照射位置から10ー50mm程度離れた位置での反射光から生体内部を測定する装置が、例えば、特開平63ー277038号公報、特開平5300887号公報等に記載されている。また、厚さ100ー200mm程度の生体を透過した光から酸素代謝機能のCT画像を計測する装置、すなわち光CT装置が例えば特開昭60ー72542号公報、特開昭62ー231625号公報に記載されている。
【0004】
【発明が解決しようとする課題】
生体光計測による臨床応用としては、例えば頭部を計測対象とする場合、脳の酸素代謝の活性化状態及び局所的な脳内出血の計測等が挙げられる。また、脳内の酸素代謝に関連して、運動、感覚さらには思考に及ぶ高次脳機能等を計測することも可能である。このような計測においては、非画像よりも画像として計測し表示することにより、その効果は飛躍的に増大する。例えば、局所的な酸素代謝の変化部位の検出等では、画像として計測及び表示することが不可欠である。
【0005】
多チャンネルの光計測装置において、実際の計測位置と計測信号を対応づけて、操作者オペレ−タに提示しなければ、不具合のあるチャンネルの迅速な発見が困難である。
【0006】
また、計測の開始前にオペレ−タが多くの計測条件を入力しなければ臨床医療の現場では深刻な事態を招く問題があった。
【0007】
本発明の目的は、被検体を光計測し、その計測によって得られた情報にもとづく所定の項目の画像を容易に得るのに適した生体光計測装置を提供することにある。
【0008】
【課題を解決するための手段】
本発明にもとづく生体計測装置は、被検体頭部に光を照射する複数の光照射手段と、該光照射手段から前記被検体に照射され、前記被検体頭部内部を通過した光を検出する複数の光検出手段と、該光検出手段で検出された信号から前記被検体頭部の血流状態を演算する演算部と、該演算部により演算された結果を表示する表示部とを有し、前記表示部は、前記複数の光照射手段の複数の光照射位置と、前記複数の光検出手段の、前記光照射位置の上下及び/又は左右に配置された複数の光検出位置と、前記光照射手段の光照射位置と前記光検出手段の光検出位置の中点に位置する複数の計測位置とを表示するとともに、前記複数の計測位置ごとに計測状態を表示し、前記計測位置のゲイン調整が成功しなかった場合に、その計測位置からみて左右又は上下の計測位置に問題がある可能性があることを示す警告表示を行うことを特徴とする。
【0009】
【発明の実施の形態】
図1は、本発明が適用される光計測装置のー実施例の主要部の構成を示す。本実施例では、例えば頭部の皮膚に光を照射し、それによって体内を通過した散乱光を皮膚から検出することにより大脳内部を画像化する実施形態を、計測チャンネルの個数すなわち計測位置の数が12の場合で示す。もちろん本発明は、計測対象として頭部に限らず他の部位、さらには生体以外にも実施可能である。
【0010】
光源部1は4個の光モジュール2から構成されている。各光モジュールは、可視から赤外の波長領域内での複数の波長、例えば780nm及び830nmの2波長の光をそれぞれ放射する2個の半導体レーザから構成されている。これらの2波長の値は、780nmと830nmに限定されるものではなく、また、波長数も2波長に限定されるものではない。この光源部1については、半導体レーザの代わりに発光ダイオードを用いてもよい。この光源部1に含まれる全ての半導体レーザ8個からの光は、発振周波数の異なる8個の発振器で構成されている発振部3によりそれぞれ変調される。
【0011】
図23は光モジュール2内の構成を、光モジュール2(1)を例にして示す。光モジュール2(1)内には、半導体レーザ3(1-a)、3(1-b)、及びこれらの半導体レーザの駆動回路4(1-a)、4(1-b)、が含まれている。ここで、括弧内の文字については、数字は含まれる光モジュール番号を、a、bはそれぞれ波長780nm、830nmを表す記号を示している。これらの半導体レーザ駆動回路4(1-a)、4(1-b)では、半導体レーザ3(1-a)、3(1-b)に対して直流バイアス電流を印加すると共に、発振器3によりそれぞれ異なる周波数f(1-a)、f(1-b)をも印加することで、半導体レーザ3(1-a)、3(1-b)から放射される光に変調を与える。この変調として、本実施例では正弦波によるアナログ変調の場合を示すが、もちろん、それぞれ異なる時間間隔の矩形波によるデジタル変調を用いてもよい。このようにして変調された光ビ−ムはそれぞれの半導体レーザごとに集光レンズ5により光ファイバ6に個々に導入される。個々の光ファイバに導入された2波長の光は光モジュールごとに光ファイバ結合器7により1本の光ファイバ、たとえば照射用光ファイバ8−1内に導入される。光モジュールごとに、2波長の光ビ−ムが照射用光ファイバ8−1〜8−4内に導入され、これらの照射用光ファイバの他端から被検体9の表面上の異なる4個所の照射位置から光が照射される。被検体から反射された光は、被検体表面上の5個所の検出位置に配置されている検出用光ファイバ10−1〜10−5で検出される。これらの光ファイバの端面は被検体9表面上に軽く接触しており、例えば特開平9―149903号公報に記載されているプローブにより光ファイバは被検体9に装着される。
【0012】
図24は、被検体9表面上における、照射位置1〜4及び検出位置1〜5の幾何学的配置例を示す。本実施例では、照射及び検出位置を交互に正方格子状に配置する。隣接する照射及び検出位置の中点を計測位置とすると、この場合、隣接する照射・検出位置の組合せが12通り存在するため、計測位置数すなわち計測チャンネル数は12個となる。この光照射及び検出位置の配置は、例えば特開平9−149903号及びユウイチ・ヤマシタ(Yuichi Yamashita)他による「近赤外光トポグラフィ計測システム:散乱媒体中に局在する吸収体の画像化(Near-infrared topographic measurement system: Imaging of absorbers localized in a scattering medium)」、1996年、レヴュー・オブ・サイエンティフィック・インスツルメント、第67巻、第730〜732頁(Rev. Sci. Instrum.,67,730(1996))に記載されている。隣接する照射及び検出位置間隔を3cmに設定すると、各検出位置で検出された光は、皮膚、頭蓋骨を通過して大脳の情報を有していることが、例えばピィー・ダブル・マコーミック(P.W.McCormic)他による「赤外光の大脳内部の浸透(Intracerebral penetration of infrared light)」,1992年,ジャーナル・オブ・ニューロサージェリ,第76巻,第315〜318頁(J.Neurosurg.,33,315(1992))により報告されている。
【0013】
以上のことから、この照射・検出位置の配置で12計測チャンネルを設定すれば、全体として6cm×6cmの領域にける大脳の計測が可能となる。この実施例では、簡単のために計測チャンネル数が12の場合を示しているが、格子状に配置する光照射位置及び光検出位置の数をさらに増加させることにより、計測チャンネルをさらに増加させて計測領域を拡大することも容易に可能である。
【0014】
図1において、それぞれの検出用光ファイバ10−1〜10−5で検出された反射光は、検出位置ごとに、すなわち各検出位置に対応した検出用光ファイバごとに独立に5個の光検出器たとえばフォトダイオード11−1〜11−5で検出する。このフォトダイオードとしては、高感度な光計測が実現できるアバランシェフォトダイオードであることが望ましい。また、光検出器としては光電子増倍管を用いてもよい。これらのフォトダイオードで光信号が電気信号に変換された後、変調信号の選択的な検出回路、例えば複数のロックインアンプから構成されるロックイン増幅器モジュール12で、照射位置かつ波長に対応した変調信号を選択的に検出する。この実施例では、アナログ変調の場合に対応する変調信号検出回路としてのロックイン増幅器を示しているが、デジタル変調を用いた場合、変調信号検出のためにデジタルフィルタもしくはデジタルシグナルプロセッサを用いる。
【0015】
図25は、図1のロックイン増幅器モジュ−ル12の構成を示す。まず、図24の検出位置1においてフォトダイオ−ド11−1によって検出される検出信号について、その変調信号分離の説明を行う。「検出位置1」では、隣接した「光照射位置1」、「光照射位置2」、「光照射位置3」及び「光照射位置4」から照射された光を検出することができ、したがって図24における「計測位置4」、「計測位置6」、「計測位置7」及び「計測位置9」が計測対象位置となる。ここで、「検出位置1」においてフォトダイオード11−1で検出された光は、「照射位置1」、「照射位置2」、「照射位置3」及び「照射位置4」で照射された各2波長の光に対応する、変調周波数がf(1-a)、f(1-b)、f(2-a)、f(2-b)、f(3-a)、f(3-b)、f(4-a)及びf(4-b)である8個の信号成分を含んでいる。これらの8個の信号成分を含む光信号は8個の増幅器14−1〜14−8を介して8個のロックイン増幅器13−1〜13−8に導入される。8個のロックイン増幅器13−1〜13−8には、それぞれf(1-a)、f(1-b)、f(2-a)、f(2-b)、f(3-a)、f(3-b)、f(4-a)及びf(4-b)の変調周波数信号が参照信号として与えられている。したがって、「照射位置1」で照射された780nm及び830nmの光信号成分はロックイン増幅器13−1及び13−2によって、「照射位置2」で照射された780nm及び830nmの光信号成分はロックイン増幅器13−3及び13−4によって、「照射位置3」で照射された780nm及び830nmの光信号成分はロックイン増幅器13−5及び13−6によって、そして「照射位置4」で照射された780nm及び830nmの光信号成分はロックイン増幅器13−7及び13−8によってそれぞれ選択的に分離してロックイン検出される。
【0016】
「検出位置2」、「検出位置3」、「検出位置4」及び「検出位置5」においてそれぞれフォトダイオ−ド11−2〜11−5によって検出される検出信号についても同様にして所望の光信号成分が選択的に分離してロックイン検出される。すなわち、「検出位置2」においてフォトダイオ−ド11−2によって検出された光信号は4個の増幅器14−9〜14−12を介して4個のロックイン増幅器13−9〜13−12に導入されて「照射位置1」で照射された780nm及び830nmの光信号成分と「照射位置2」で照射された780nm及び830nmの光信号成分がそれぞれ選択的に分離してロックイン検出され、「検出位置3」においてフォトダイオ−ド11−3によって検出された光信号は4個の増幅器14−13〜4−16を介して4個のロックイン増幅器13−13〜13−16に導入されて「照射位置1」で照射された780nm及び830nmの光信号成分と「照射位置3」で照射された780nm及び830nmの光信号がそれぞれ選択的にロックイン検出され、「検出位置4」においてフォトダイオ−ド11−4によって検出された光信号は4個の増幅器14−17〜4−20を介して4個のロックイン増幅器13−14〜13−20に導入されて「照射位置3」で照射された780nm及び830nmの光信号成分と「照射位置4」で照射された780nm及び830nmの光信号成分がそれぞれ選択的にロックイン検出され、そして「検出位置5」においてフォトダイオ−ド11−5によって検出された光信号は4個の増幅器14−21〜4−24を介して4個のロックイン増幅器13−21〜13−24に導入されて「照射位置2」で照射された780nm及び830nmの光信号成分と「照射位置4」で照射された780nm及び830nmの光成分がそれぞれ選択的にロックイン検出される。
【0017】
なお、図24からわかるように、検出位置が「検出位置2」、「検出位置3」、「検出位置4」及び「検出位置5」である場合の計測対象位置は「計測位置1」及び「計測位置3」、「計測位置2」及び「計測位置5」、「計測位置10」及び「計測位置12」並びに「計測位置8」及び「計測位置11」である。
【0018】
以上のように、波長の数が2で、計測位置の数が12の場合は、計測する信号数は24となるため、ロックイン増幅器モジュール12では合計で24個のロックイン増幅器13−1〜13−24が用いられる。これらのロックイン増幅器13−1〜13−24(チャンネル1〜24)から出力されるアナログ出力信号はサンプルホ−ルド回路モジュ−ル16の対応するチャンネルのサンプルホ−ルド回路によってそれぞれ所定時間積算される。その積算終了後スイッチ(マルチプレクサ)17を順次切り替え、それぞれのサンプルホ−ルド回路に蓄積された信号は例えば12ビットのアナログ/ディジタル変換器(A/D変換器)18によってディジタル信号に変換され、その変換された全チャンネルの信号は計算機19の外部にある記憶装置に記憶される。もちろん、この記憶は計算機9の内部にある記憶装置になされてもよい。
【0019】
サンプルホ−ルド回路モジュ−ル16を用いない場合は、スイッチ16を高速で繰り返し切り替える。その切り替えごとに各チャンネルのアナログ信号をアナログ/ディジタル変換器18によってディジタル信号に変換して、記憶装置20に蓄積し、チャンネルごとに所定の回数取得されたディジタル信号を計算機19によって平均化して、記憶装置20に記憶する。この方式によっても、高周波成分の雑音を低減することができる。
【0020】
計算機19は記憶されているデ−タをもとにして、脳活動に伴う酸素化ヘモグロビン濃度変化及び脱酸素化ヘモグロビン濃度変化、さらにはこれらヘモグロビン濃度総量としての全ヘモグロビン濃度変化を、例えば、特開平9―19408号公報及び前述アツシ・マキ(Atsushi Maki)他による「無侵襲近赤外光トポグラフィによるヒト脳活動の時空間解析(Spatial and temporal analysis of human moter activity using noninvasive NIR topography)」、1995年、メディカルフィジックス、第22巻、第1997〜2005頁(Medical physics,22,1997(1995))に記載されている方法で計算し、表示部20にトポグラフィ画像等を表示する。
【0021】
図1において、計算機19はパ−ソナルコンピュ−タであってよい。計算機19には操作部22が接続され、該操作部は種々の情報のインプットやアウトプットを行ったり、デ−タの追加や削除をしたりするキ−ボ−ドやマウス等を含む。
【0022】
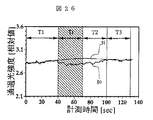
図26は、ある検出位置における計測信号30と該計測信号から求められる予測無負荷信号31の経時変化を表すグラフである。このグラフは表示部21に表示されるもので、その横軸は計測時間を表わし、縦軸はヘモグロビン濃度の相対変化量すなわち生体の特定機能(例えば指等、身体の一部を動かすこと等)が働くことによる脳の特定部位のヘモグロビン濃度変化に対応する。予測無負荷信号31は、計測信号30から、負荷を与えた時間(負荷時間)Ttと負荷印加後信号が元に戻るまでの時間(緩和時間)T2における信号を除き、負荷前時間T1と負荷印加後時間T3における計測信号31に対して任意関数を最小二乗法を用いてフィッティングし、求たものである。本実施例では、任意関数を2次の線形多項式を用い、T1=40秒、T2=30秒、T3=30秒として処理している。
【0023】
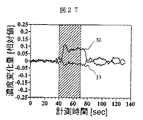
図27は、ある計測位置における酸化及び還元ヘモグロビンの濃度の相対変化量の時間変化を表す、表示部21に表示されるグラフである。横軸は計測時間を表し、縦軸は相対濃度変化量を表す。また、斜線で示した時間が負荷印加時間(右手指の運動期間)である。図26の相対変化量については、無負荷信号31と予測無負荷信号32にもとづき、酸化及び還元ヘモグロビ(HbO2,Hb)の濃度の負荷印加による相対変化量は所定の演算処理により求められる。
【0024】
図28及び図29は、それぞれ被検者の左手指及び右手指の運動を負荷として、各計測点の酸化ヘモグロビン濃度の相対変化量の時間変化から作成した、表示部21に表示される等高線画像(トポグラフィ画像)を示す。トポグラフィ画像は、負荷印加時間(図27の斜線期間)中の相対変化量信号32の時間積分値(時間平均値でもよい)を処理部19で計算し、各計測位置間の値はX軸方向及びY軸方向に線形に補間して作成したものである。トポグラフィ画像としては、図28及び図29に示すような等高線の他に、白黒濃淡画像、色彩による識別表示像であってもよい。図28及び図29の画像の比較から、明らかに右手運動時に特定の位置において酸化ヘモグロビン濃度が増加していることがわかる。
【0025】
このような空間的分布の情報を画像として表示することにより計測結果の認識を迅速かつ容易にする。また、図28及び図29に示した画像は、負荷印加時間中の濃度相対変化量の時間積分値で作成したが、同一計測時間ごとの各計測位置の酸化ヘモグロビン濃度の相対変化量によって同様にトボグラフィ画像を作成することも可能である。作成した複数のトポグラフィ画像を、計測時間の順に従って表示あるいは動画として表示すれば、酸化ヘモグロビン濃度の相対変化量の時間変化を捉らえることができる。
【0026】
さらに、任意の1計測位置の酸化ヘモグロビン濃度の相対変化量の時間変化と自他計測位置の酸化ヘモグロビン濃度の相対変化量の時間変化の自己及び相互相関関数を計算し、各計測位置における相関関数よりトポグラフィ画像を作成することもできる。各計測位置における相関関数は、時間ずれτで定義される関数であるから、同一時間ずれτにおける相関関数の値よりトポグラフィ画像を作成し、τの順序に従って表示あるいは動画として表示すれば、血液動態変化が伝播していく様子を可視化することができる。ここでは、酸化ヘモグロビン濃度の相対変化量を代表的に用いて説明しているが、還元ヘモグロビン濃度の相対変化量あるいは酸化及び還元ヘモグロビン濃度の相対変化量の和で計算される総ヘモグロビン濃度相対変化量も同様にトポグラフィ画像を作成することができる。
【0027】
図30は、上記記載の方法で作成されたトポグラフィ画像34を、被検者の脳表面画像35と重ねあわせた表示例を示す。トポグラフィ画像34は、生体の機能に関連して変化した脳の血液動態の変化であるため、脳表面画像と重ねあわせて表示することが望ましい。脳表面画像35は3次元MRIあるいは3次元X線CTで計測し表示する。トポグラフィ画像34は、各計測位置の座標を脳表面に位置するように座標変換し、座標変換した後の各計測位置間の値を補間してトポグラフィ画像を作成する。作成したトポグラフィ画像34と脳表面画像35を重ねあわせて表示するとき、重ねたトポグラフィ画像34の色を半透明として、下に位置する脳表面画像が透けて見えるようにする。
【0028】
図2は、図1に示される光計測装置を用いて被検体の計測を行う、本発明にもとづく一例としてのフロ−を示す。操作は、オペレ−タが、図3〜22に示される、表示部21の画面表示面に表示される画面を見ながら順次進めて行くことができるようになっている。
【0029】
装置のオペレ−ティングシステムが立ち上げられると、まず図3に示されるメインメニュ−選択用の初期画面が表示される(S1)。図3において、ボタン301を選択すると計測処理に進み、ボタン302を選択するとデ−タ解析に進み、ボタン303を選択すると、プログラムを終了する。
【0030】
今、ボタン301が選択されたとすると、図3に示される初期画面は消去されて、計測処理に進み、はじめに、図4に示される条件入力画面が表示部21の表示面中央に表示される(S2)。図4において、各部の意味や機能は次の通りである。
401:タイトルを入力するバ−である。具体的には、行われる検査の名称を入力する。
402:日付及び時間を表示する部分で、デフォルト(自動的に表示される数字や文字)で画面表示時の日付及び時間が表示される。
403:刺激の種類(例えば指運動、書字、発語、薬剤投与等)を入力する部分である。リスト表示ボタン(逆三角ボタン)を押してリストボックス内から既に登録してある種類を選択する。選択した種類は背景色を変えたり、反転して表示される。デ−タは追加、削除ができる。
404:刺激入力部で選択された種類項目を削除することができる。
405:計測モ−ドを選択する部分である。計測モ−ドは計測チャンネルの数と計測する面の数によって決まものである。例えば計測チャンネル数が12で、計測する面の数が2の場合を計測モ−ド1とする、が如きである。
406:自由なメモ書き部分である。
407:被検者名を入力する部分である。
408:被検者の年齢を入力する部分である。
409:被検者の性別を入力する部分である。
410:被検者の種類すなわち患者か健常者かを入力する部分である。
411:設定終了ボタンである。
412:初期画面に戻るためのボタンである。
【0031】
以上のような条件を入力し、設定した後、ボタン412を押すと図4に示される条件入力画面は消去され、フロ−は初期画面表示に戻るが、ボタン411を押すと、図4に示される条件入力画面は消去され、図5に示されるゲイン調整中表示画面が表示面中央に表示される(S3)。これは計測系が自動ゲイン調整中であることを表し、調整が終了すると、図5に示されるゲイン調整画面は消去され、図6に示される計測位置表示画面が表示面中央に表示される(S4)。この画面はこの後表示部21の表示面の所定位置に基本的に常時表示される。この計測位置表示画面を常時表示することで、多数ある計測信号と実際の計測位置との対応を容易かつ迅速に把握することが可能となる。ここで、通常、図1の照射用光ファイバ8−1〜8−4及び検出用光ファイバ10−1〜10−5は、被検者がかぶるヘルメットに固定される。従って、計測チャンネル番号をヘルメット上に明示し、図6中の602の番号との位置関係を、予め明確にさせておけば、さらにオペレ−タの認知を助ける。
【0032】
図6において、601は選択された計測モ−ドを表示する部分であり、表示される計測位置表示画面は選択された計測モ−ドに対応したものとなる。602は計測面の計測チャンネルの数を表示する部分である。603は照射用及び検出用光ファイバの設定位置、すなわち光照射位置及び検出位置を表す。604は計測チャンネルの番号を表し、自動ゲイン調整がうまくいった場合は、計測チャンネルが緑色で表示される。
【0033】
ゲイン調整がうまくいかなかった計測チャンネルが1つでもある場合は、その計測チャンネルは赤色で表示される。この場合はまた、図7に示される異常表示画面が図6に示される計測位置表示画面の近傍に表示される(S5)。ゲイン調整がうまくいかない場合は、赤色表示の左右又は上下の計測位置に問題がある可能性があることを意味する。赤色表示の場合は、光ファイバの設定が悪いためと考えられるので、光ファイバの設定のし直しが必要である。そこで、光ファイバの再設定後、図7において、701が図3あるいは図4の画面に戻って計測を中止するときに用いられる。図7のボタン702を押すと、図7に示される異常表示画面が消去され、図5に示されるゲイン調整中表示画面が表示されて、再度自動ゲイン調整が行われる。ゲイン調整後、再度異常がある場合には、図5に示されるゲイン調整中表示画面を消去し、再度図6に示される計測位置表示画面の異常計測チャンネルを赤色表示し、図7に示される異常表示画面を図6に示される計測位置表示画面の近傍に表意する。異常が生じない場合には、図5に示されるゲイン調整中表示画面を消去し、図6に示される計測位置表示画面中の全計測チャンネルを緑色表示に変え、図8に示されるファイル作成画面が表示される。
【0034】
図7において、703は異常を無視する場合に押すボタンで、このボタンを押すと、図6に示される計測位置表示画面中の異常計測チャンネルを無視し(赤色表示のまま)、図8に示されるファイル作成画面が表示される(S6)。異常の有無にかかわらず、図8に示されるファイル作成画面は表示面内中央に表示され、図6に示される計測位置表示画面は、図8に示されるファイル作成画面の表示に伴い、表示面内の左下に位置が移動する。この表示方法により、オペレ−タは常に入力すべき条件に注目することが可能となる。
【0035】
図8において、各部の意味や機能は次の通りである。
801:ファイル名を入力する部分である。
802:ボタン804で選択されている階層に存在する、全てのファイルのリストを表示するための部分で、例えばここには以前に計測したデ−タ名を表示する。803:現在のパスを表示する部分である。
804:ディレクトリリスト(階層リスト)を表示する部分である。
805:計測処理に進むことの許可を与えるボタンである。
806:キャンセルして図4の条件入力画面に戻るために押すボタンである。このボタンを押すと、図8に示されるファイル作成画面及び図6に示される計測位置表示画面は消去され、図4に示される条件入力画面が表示される。
807:図9に示されるディレクトリ作成画面を表示して、新しいディレクトリを作成するときに用いるボタンである。このボタンを押すと、ディレクトリ作成画面は若干ずれた状態で図8に示されるファイル作成画面上に重なって表示される。このとき、図9に示されるディレクトリ作成画面は操作できない。
808:ドライブの指定を行うためのボタンである。
ボタン807を押すと、図9に示されるディレクトリ作成画面が表示される(S7)。図9において、901は作成するディレクトリ名を入力する部分、902はディレクトリ作成終了のボタン、903はキャンセルボタンで、いずれのボタンを押した場合でも、図9に示されるディレクトリ作成画面は消去され、図8に示されるファイル作成画面に戻る。
【0036】
図8において、ボタン805を押すと、図8に示されるファイル作成画面は消去され、図10に示される計測画面が表示面内左上に表示され(S8)、図14に示される計測デ−タ時系列表示画面が表示面内右大部分に単数又は複数表示される(S11)。図8は、計測の実行をコントロ−ルするのに用いられる。図10において、各部の意味や機能は次の通りである。
1001:Infoを選択するボタンで、Infoを選択すると、図11に示されるよう
に、サブメニュ−としてCondition又はTuneupを選択する画面が表示
される。図11のサブメニュ−内のConditionを選択すると、図4と
同じ条件入力画面が表示される(S9)。これは、現状確認あるいは
追加の条件入力が目的である。図11のサブメニュ−内のTuneupを
選択すると、図12に示される計測条件及び表示条件の入力画面が表
示される(S10)。ステップ9又はステップ10において、キャン
セルボタンを押すと、図4に示される条件入力画面又は図12に示さ
れる計測条件及び表示条件入力画面が消去され、図10の計測画面に
戻る。
1002:Optionを選択するボタンで、Optionを選択すると、図13に示され
るようにサブメニュ−画面が表示される。ここでは、後述する計測中
のグラフ表示条件、デ−タのバックアップ間隔及び他計測機器から出
力される信号等の条件を入力するが、自動的に前回の計測時に設定し
た値が反映されるという学習機能の故に毎回設定する必要はない。
1003:デ−タ取得時間間隔を指定して表示する部分である。
1004:デ−タ取得回数(サンプリング回数)を表示する部分である。
1005:計測経過時間を表示する部分である。
1006:次の計測状態を表示する部分である。
Run :計測中
Completion :計測正常終了
Overrun :A/D変換器のオ−バ−フロ−による計測
異常終了
Stop :その他の計測異常終了
File error :計測ファイル書き込みエラ−
Back up file error :バックアップファイル書き込みエラ−
1007:計測開始用のボタンである。このボタンを押すと、計測が行われ、
図14中の各軸に計測デ−タ時系列信号グラフが表示される(S
11)。表示されるグラフは変化率を表す。
1008:デ−タ取得終了用のボタンである。
1009:計測及び検査終了用のボタンである。
1010:マ−クボタン1011押下後の経過時間を表示する部分である。これ
により、いちいちストップウオッチで刺激時間を管理しなくともよく
なるという便利さが与えられる。
1011:マ−クボタンである。計測中に図14のグラフに縦線からなるマ−ク
を入れるためのものである。普通は、このマ−クはデ−タ解析時の参
照用として刺激開始終了時に入力するが、計測中に時刻を記録して
おきたい事象が発生した場合に任意に入力してもかまわない。
【0037】
図12に示される計測条件及び表示条件の入力画面においては、選択された計測モ−ドに応じた計測条件が表示される。計測条件は、計測チャンネル(計測位置)、A/D変換器のチャンネル、波長、信号増幅率等の対応を表す。また、ここで、計測するチャンネルの指定及びグラフ表示するチャンネルの指定をすることもできる。さらに、空いているチャンネルに別の信号を入力することを指示することもできる。図12の画面において各部の意味や機能は次の通りである。
1201:選択された計測モ−ドで使用している波長ごとに計測条件及び表示条
件を示す表があり、提示したい波長に関する表をこのタブを用いて選
択する。
1202:グラフ表示の要否を指定し、表示する部分である。Trueはグラフ表示
を意味し、falseはグラフ非表示を意味する。予め、グラフ非表示にし
たい計測チャンネルごとに選択しておき(Visible列の中でクリックす
ると選択されて背景色が変わるか又は反転表示される)、1212のFa
lseボタンを指定することで、選択した計測チャンネルがTrueからFals
eに変わる。
1203:ロックインアンプのゲインを表示する部分である。
1204:A/D変換器のダイナミックレンジを表示する部分である。1203
及び1204には自動ゲイン調整で決定された値が表示される。
1205:波長を表示する部分である。
1206:信号の種類を表示する部分である。Opticalは光計測を意味する。例
えば、脳波信号を追加チャンネルで同時に計測する(1208で追加
を指定できる)場合には、EEGとオペレ−タが入力する。デ−タ解
析時に、Optical以外の信号を区別して処理ができる。
1207:計測チャンネルの番号を表示する部分である。
1208:A/D変換器のチャンネル番号の有効(True)・無効(False)を指
定し表示する部分である。指定方法は1202の場合と同じである。
Falseにした場合は、指定したチャンネルでの計測は行われない。
1209:1202〜1208の選択した位置に文字列、数字等を入力するも
のである。
1210:A/D変換器のダイナミックレンジを変更する部分である。
1204選択時に有効となる。
1211:ロックインアンプのゲインを変更する部分である。1203選択時
に有効となる。
1212:1202及び1208列内のTrue及びFalseの切り替えを行う部分
である。
1213:表示される計測モ−ドを選択する部分である。Eachは表示する表
を波長別に複数の表で表示し、Allは全計測チャンネルを1枚の表で
表示する。
1214:設定を終了するためのボタンである。
1215:設定をキャンセルするためのボタンである。
【0038】
図12の画面によれば、計測条件(1203〜1208)のモニタとグラフ表示(1202)条件を1画面で表し、確認と設定変更が簡便に行える。また、他計測機器(装置)の信号をこの画面を用いて取り込むこともできる。さらに、図12の画面は、入力信号の計測要否をオペレ−タが選択して使用する条件を入力する唯一の画面である。
【0039】
図13に示される、図10の計測画面中のOptionのサブメニュ−画面では、何を選択するかによって次のような画面がそれぞれ表示される。ただし、図13においては、選択されるべきTrigger Pulse及びExternal Triggerの表示は省略されている。
・Graph :図14のグラフの表示条件入力画面(図15)
・Backup :ファイルバックアップ条件入力画面(図16)
・Other CH :他計測機器出力信号の入力設定画面(図17)
・Trigger Pulse :矩形波出力信号設定画面(図18)
・External Trigger:外部入力トリガ−同期計測条件設定画面(図20)
・Measurement
Parameter:計測デ−タ取得条件設定画面(図21)
・Prescan :計測信号確認画面(図22)
・Position :計測位置表示画面(図6)(ステップS6への戻り)
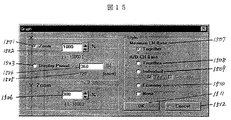
図15〜18、20〜22の画面について、その各部の意味や機能を以下に説明する。
【0040】
図15(図14のグラフの表示条件入力画面)(S12)
1).X軸のレンジを入力する。レンジの入力には、1501で行う倍率での入力と、1503で行う、表示する時間での入力との2種類の入力方法がある。
1501:グラフのX軸の表示倍率入力を選択するボタンである。
1502:グラフのX軸の表示倍率をパーセント入力する部分である。例えば100%のとき時3600秒の期間を表示する場合に、1000%に変更すると360秒の範囲となる。この場合360秒を越えると、画面が左にスクロールする。具体的には、362秒のデータが取得されると、図14のグラフのX軸の範囲は2秒から362秒の信号を表示する。
1503:グラフのX軸の表示時間入力を選択するボタンである。このボタンが選択されると自動的に1501は非選択となる。1501と1503のボタンは互いに排他的なものである。
1504:グラフのX軸の表示時間を入力する部分である。
1505:1504で指定された表示時間内に取得されるデータ数を表示する部分である。
2).Y軸のレンジを入力する。
1506:グラフのY軸の表示倍率を入力する部分である。X軸の倍率入力の場合と考え方は同じである。
3).図14のグラフ表示の形式を選択する。
【0041】
1507:計測チャンネル順に全チャンネル(図12で表示選択したすべてのチ
ャンネル)を表示することを選択するボタンである。こボタンが選択
されると、各計測チャンネルの計測に用いられる波長数(実施例では
2波長)と同数の図14の画面が重ならないで表示される。このとき
、第1画面は第1波長の、計測チャンネル順の信号を表示し、第2画
面は第2波長の、計測チャンネル順の信号を表示する。特に設定しな
ければ、Togetherが選択される。
1508:全チャンネルを一つのウィンドウ内に表示するボタンである。
1509:各チャンネルごと個別のウィンドウ内にグラフを表示するためのボタ
ンである。さらに表示方法の種類として以下の2種類がある。
Title :グラフをタイル状に並べて表示する。
Cascade :グラフを重ねて表示する。
1510:指定した1チャンネルだけのグラフを表示する(図12で表示するチ
ャンネルが選択できる)。
1511:グラフの表示をしないことを強いるための部分である。
1512:設定を終了するための部分である。設定終了により画面表示は図10
の画面表示に戻る。
1513:キャンセルをするための部分である。キャンセルの場合も画面表示は
図10の画面表示に戻る。
【0042】
図16(ファイルバックアップ条件入力画面)(S13)
これは、計測中の停電や、図8のファイル作成画面で指定したファイルが何らかの原因で壊れた場合を予想して、計測中に随時デ−タをバックアップする機能の条件を設定するものである。
1601:バックかプの要否を指定する部分である。
1602:バックアップ間隔時間を入力する部分である。
1603:バツクァツプファイル名をフルパスで入力する部分である。
1604:ディレクトリ、ファイルを参照する部分である。図8のファイル作成画面が表示され、指定ファイル名が1603のBackup File Nameエリアに入る。
1605:設定終了用ボタンである。設定終了により画面表示は図10の画面表示の戻る。
1606:キャンセル用ボタンである。キャンセルの場合も画面表示は図10の画面表示の戻る。
【0043】
図17(他計測機器出力信号の入力設定画面)(S14)
この画面を使って他計測機器から出力される信号を、空いているA/D変換器チャンネルを通して取得する。取得する際のA/D変換器のチャンネル番号、信号の種類名(EEG等)、A/D変換器のダイナミックレンジを選択する。
【0044】
1701:空いている入力用のA/D変換器のチャンネル番号を表示する部分で
ある。空いているA/D変換器のチャンネルの一番若い番号が自動的
に割り当てられる。
1702:信号の種類名を入力する部分である。
1703:その他の入力のA/D変換器のダイナミックレンジを選択する部分で
ある。
1704:設定終了用ボタンである。設定終了により画面表示は図10の画面表
示に戻る。
1705:キャンセル用ボタンである。キャンセルの場合も画面表示は図10の
画面表示に戻る。
【0045】
図18(矩形波出力信号設定画面)(S15)
本光計測装置から定期的に矩形電圧信号を出力する。この信号を他の計測機器(脳波計等)に入力することで、計測時刻を機器間で厳密にあわせることが可能となる。矩形波信号は例えばパソコンのシルアルポ−トから出力する。
【0046】
出力する矩形波信号には、図19に示されるように、3種類ある。1種類目は開始時のみ出力する矩形波信号である。2種類目は計測終了まで定期的に出力する矩形波信号である。3種類目は図10のマ−クボタン1011を押すことと同期して出力する矩形波信号である。図18の画面でこれらの3種類の矩形波信号の条件を設定することができる。
1801:矩形波出力の要否を選択する部分である。
1802:矩形波出力する端子を選択する部分である。
1803:1種類目の矩形波の時間幅を入力する部分である(図19のA参照)。
1804:1種類目の矩形波の繰り返し回数を入力する部分である(図19のB参照)。
1805:2種類目の矩形波の繰り返し回数を入力する部分である(図19のC参照)。
1806:2種類目の矩形波の時間幅を入力する部分である(図19のD参照)。
1807:3種類目の矩形波の時間幅を入力する部分である(図19のE参照)。
1808:設定終了用ボタンである。設定終了により画面表示は図10の画面表示の戻る。
1809:キャンセル用ボタンである。キャンセルの場合も画面表示は図10の画面表示の戻る。
【0047】
図20(外部入力トリガ−同期計測条件設定画面)(S16)
この画面は、外部からのトリガ−信号に同期して計測する場合に使用する画面である。同期計測することで、他計測機器や刺激装置などと完全に時間の同期が取れる。
2001:外部入力トリガー同期計測の要否を指定する部分である。
2002:外部入力トリガ−信号に用いるA/D変換器のチャンネル番号を入力する部分である。
2003:1回のトリガ−信号に対する計測時間を入力する部分である。
2004:トリガ−信号と認識される電圧値の閾値を入力する部分である。
【0048】
2005:設定終了用ボタンである。設定終了により画面表示は図10の画面表示に戻る。
2006:キャンセル用ボタンである。キャンセルの場合も画面表示は図10の画面表示の戻る。
【0049】
図21(計測デ−タ取得条件設定画面)(S17)
ここでは、A/D変換器のチャンネルの操作周波数(Burst Rate)、A/D変換器の1チャンネル当たりのサンプリング周波数(Coversion Rate)、取得デ−タの加算平均回数(Number of Samples)、取得デ−タの加算時間(Acquisition Time)、デ−タ取得時間間隔(Sampling Period:図10の1003と同じ)及び前計測時間を設定せることができる。
2101:Burst Rateを表示、入力する部分である。
2102:Convewrsion Rateを表示、入力する部分である。
2103:1回のサンプリングで取得するサンプル数を表示、入力する部分である。
2104:データ取得時間を表示する部分である。
2105:データ取得時間間隔を表示、入力する部分である。
2106:計測時間を表示、入力する部分である。
2107:設定終了用ボタンである。設定終了により画面表示は図10の画面表示の戻る。
2108:キャンセル用ボタンである。キャンセルの場合も画面表示は図10の画面表示に戻る。
【0050】
図22(計測信号確認画面)(S18)
本画面は、必要に応じて本計測に入る前に予備計測を行い、オペレ−タが信号状態を確認するのに用いられる。グラフ表示される信号の値は電圧値を表す。
【0051】
2201:デ−タ取得間隔を表示する部分である。
2202:デ−タ取得回数(サンプリング数)を表示する部分である。
2203:計測経過時間を表示する部分である。
2204:計測状態を表示する部部である(図10参照)。
2205:グラフのX方向の倍率を指定する部分である(図15参照)。
2206:予備計測結果を書くチャンネルごとに数値で表示する部部である。
2207:出力信号確認開始用ボタンである。このボタンを押すと、図15に示される画面で設定されたグラフのスタイルに応じて、単数あるいは複数の、図14に示される画面内に計測信号を表示する。
2208:計測中断用ボタンである。
2209:予備計測終了用ボタンである。このボタンを押すと、表示画面は図10の画面に戻る。
【0052】
以上説明した実施例により、習熟していないオペレ−タによっても、迅速に間違いのない入力が可能となる。また、オペラ−タにとっては、詳細な設定が可能なオプション機能も備えられている。
【0053】
【発明の効果】
本発明によれば、被検体を光計測し、その計測によって得られた情報にもとづく所定の項目の画像を容易に得るのに適した生体光計測装置が提供される。
【0054】
本発明によればまた、習熟していないオペレ−タによっても、迅速に間違いのない入力が可能となり、したがってまた、操作マニュアルを熟知することなく光による計測操作が可能となる。
【0055】
さらに、本発明によれば、被検体の変化の状況例えば脳の酸素代謝の活性化状態を高精度に把握することが可能となる。
【図面の簡単な説明】
【図1】本発明が適用される光計測装置のー実施例の主要部の構成を示すブロック図。
【図2】図1に示される光計測装置を用いて被検体の計測を行う、本発明にもとづく一例としてのフロ−図。
【図3】表示部に表示される初期画面を示す図。
【図4】表示部に表示される条件入力画面を示す図。
【図5】表示部に表示されるゲイン調整中表示画面を示す図。
【図6】表示部に示される計測位置表示画面を示す図。
【図7】表示部に表示される異常表示画面を示す図。
【図8】表示部に表示されるファイル作成画面を示す図。
【図9】表示部に表示されるディレクトリ作成画面を示す図。
【図10】表示部に示される計測画面を示す図。
【図11】表示部に表示される、図10のInfoのサブメニュ−画面を示す図。
【図12】表示に表示される計測条件及び表示条件の入力画面を示す図。
【図13】表示部に表示される、図10のOptionのサブメニュ−画面を示す図。
【図14】表示部に表示される計測デ−タ時系列表示画面を示す図。
【図15】表示部に表示される、図14のグラフの表示条件入力画面を示す図。
【図16】表示部に表示されるファイルバックアップ条件入力画面を示す図。
【図17】表示部に表示される他計測機器出力信号の入力設定画面を示す図。
【図18】表示部に表示される矩形波出力信号設定画面を示す図。
【図19】図18で条件設定される矩形波出力信号波形を示す図。
【図20】表示部に表示される外部入力トリガ−同期計測条件設定画面を示す図。
【図21】表示部に表示される計測デ−タ取得条件設定画面を示す図。
【図22】表示部に表示される計測信号確認画面を示す図。
【図23】図1の光モジュール内の構成を示すブロック図。
【図24】被検体表面上における、照射位置及び検出位置の幾何学的配置例を示す図。
【図25】図1のロックイン増幅器モジュ−ルの構成を示すブロック図。
【図26】ある検出位置における計測信号と該計測信号から求められる予測無負荷信号の経時変化を表す一例としてのグラフ。
【図27】ある計測位置における酸化及び還元ヘモグロビンの濃度の相対変化量の時間変化を表す一例としてのグラフ。
【図28】被検者の左手指の運動を負荷として、各計測点の酸化ヘモグロビン濃度の相対変化量の時間変化から作成した等高線画像(トポグラフィ画像)を示す図。
【図29】被検者の右手指の運動を負荷として、各計測点の酸化ヘモグロビン濃度の相対変化量の時間変化から作成した等高線画像(トポグラフィ画像)を示す図。
【図30】トポグラフィ画像を被検者の脳表面画像と重ねあわせた表示例を示す図。
【符号の説明】
1:光源部、2:光モジュ−ル、3:発振部、8−1〜8−4:照射用光ファイバ、9:被検体、10−1〜105:検出用光ファイバ、11−1〜11−5:フォトダイオ−ド、12:ロックイン増幅器モジュ−ル、16:サンプルホ−ルド回路モジュ−ル、17:スイッチ(マルチプレクサ)、18:アナログ/ディジタル変換器、19:計算機、20:記憶装置、21:表示部、22:操作部。[0001]
BACKGROUND OF THE INVENTION
The present invention Living body Optical instrumentation Place , Especially suitable for being used to optically measure the inside of a living body and to image the inside of the living body based on the information signal obtained thereby Living body The present invention relates to an optical measurement device.
[0002]
[Prior art]
A technique for measuring the inside of a living body simply and without causing harm to the living body is desired in the field of clinical medicine. In response to this demand, measurement using light is very effective. The first reason is that the oxygen metabolism function in the living body corresponds to the concentration of a specific pigment (hemoglobin, cytochrome a3, myoglobin, etc.) in the living body, that is, the concentration of the light absorber. This is because it can be obtained from the amount of absorption in the near-infrared region. The second reason is that light is easy to handle with an optical fiber. The third reason is that optical measurement is a safety standard (ANSIZ 136-1973, JISC6802 standard: 2mW / mm 2 This is because the use within the range of) does not harm the living body.
[0003]
Utilizing the advantages of living body measurement using light, the living body is irradiated with light having a wavelength from visible to near infrared, and the inside of the living body is reflected from the reflected light at a position about 10-50 mm away from the irradiation position. Apparatuses for measuring are described in, for example, Japanese Patent Application Laid-Open Nos. 63-277038 and 5300887. Further, an apparatus for measuring a CT image of an oxygen metabolism function from light transmitted through a living body having a thickness of about 100 to 200 mm, that is, an optical CT apparatus is disclosed in, for example, Japanese Patent Laid-Open Nos. 60-72542 and 62-231625. Are listed.
[0004]
[Problems to be solved by the invention]
Examples of clinical applications based on biological light measurement include measurement of the activation state of brain oxygen metabolism and local intracerebral hemorrhage when the head is a measurement target. In addition, in relation to oxygen metabolism in the brain, it is also possible to measure higher brain functions, such as movement, sensation, and thought. In such measurement, the effect is greatly increased by measuring and displaying an image rather than a non-image. For example, it is indispensable to measure and display as an image in the detection of a local site of oxygen metabolism change.
[0005]
In a multi-channel optical measuring device, it is difficult to quickly find a defective channel unless the actual measurement position and the measurement signal are associated with each other and presented to the operator operator.
[0006]
In addition, there has been a problem of causing a serious situation in clinical practice unless the operator inputs many measurement conditions before the start of measurement.
[0007]
An object of the present invention is suitable for optically measuring a subject and easily obtaining an image of a predetermined item based on information obtained by the measurement. Living body Optical instrumentation Place Is to provide.
[0008]
[Means for Solving the Problems]
A biological measurement apparatus according to the present invention includes a plurality of light irradiation means for irradiating light to a subject's head, The A plurality of light detecting means for detecting light irradiated from the light irradiation means to the subject and passed through the inside of the subject head; The A calculation unit for calculating a blood flow state of the subject's head from a signal detected by the light detection means; The A display unit that displays a result calculated by the calculation unit, and the display unit includes a plurality of light irradiation means. Multiple light irradiation A position of the plurality of light detection means , A plurality of light detections arranged above and / or left and right of the light irradiation position Position and said light irradiation means Light irradiation position And the light detection means Located at the midpoint of the light detection position Display multiple measurement positions As well as , Display the measurement status for each of the multiple measurement positions If the gain adjustment of the measurement position is not successful, a warning display is displayed to indicate that there is a possibility that there is a problem with the measurement position on the left and right or the top and bottom of the measurement position. It is characterized by that.
[0009]
DETAILED DESCRIPTION OF THE INVENTION
FIG. 1 shows a configuration of a main part of an embodiment of an optical measuring device to which the present invention is applied. In this embodiment, for example, an embodiment in which the inside of the cerebrum is imaged by irradiating the skin of the head with light and detecting scattered light passing through the body from the skin is described as the number of measurement channels, that is, the number of measurement positions. Is shown in the case of 12. Of course, the present invention is not limited to the head as a measurement target, and can be implemented for other parts, and other than a living body.
[0010]
The
[0011]
FIG. 23 shows the configuration of the
[0012]
FIG. 24 shows a geometric arrangement example of the
[0013]
From the above, if 12 measurement channels are set with this arrangement of irradiation / detection positions, the cerebrum can be measured in a 6 cm × 6 cm region as a whole. In this embodiment, the number of measurement channels is 12 for simplicity, but the number of measurement channels can be further increased by further increasing the number of light irradiation positions and light detection positions arranged in a grid pattern. It is also possible to easily enlarge the measurement area.
[0014]
In FIG. 1, the reflected light detected by each of the detection optical fibers 10-1 to 10-5 is detected independently for each detection position, that is, for each detection optical fiber corresponding to each detection position. Detectors such as photodiodes 11-1 to 11-5 are used for detection. The photodiode is preferably an avalanche photodiode capable of realizing highly sensitive optical measurement. A photomultiplier tube may be used as the photodetector. After the optical signal is converted into an electrical signal by these photodiodes, the modulation signal is selectively detected by, for example, a lock-in
[0015]
FIG. 25 shows the configuration of the lock-in
[0016]
Similarly, the desired light is detected for the detection signals detected by the photodiodes 11-2 to 11-5 at the "
[0017]
As can be seen from FIG. 24, the measurement target positions when the detection positions are “
[0018]
As described above, when the number of wavelengths is 2 and the number of measurement positions is 12, the number of signals to be measured is 24. Therefore, the lock-in
[0019]
When the sample
[0020]
Based on the stored data, the
[0021]
In FIG. 1, the
[0022]
FIG. 26 is a graph showing changes over time of the
[0023]
FIG. 27 is a graph displayed on the
[0024]
FIG. 28 and FIG. 29 are contour images displayed on the
[0025]
By displaying such spatial distribution information as an image, the measurement result can be recognized quickly and easily. The images shown in FIG. 28 and FIG. 29 were created with the time integral value of the concentration relative change amount during the load application time, but similarly, depending on the relative change amount of oxyhemoglobin concentration at each measurement position for the same measurement time. It is also possible to create a topographic image. If the created topographic images are displayed or displayed as a moving image in the order of the measurement time, it is possible to capture temporal changes in the amount of relative change in oxyhemoglobin concentration.
[0026]
Furthermore, the self-correlation function of the time change of the relative change amount of the oxyhemoglobin concentration at any one measurement position and the time change of the relative change amount of the oxyhemoglobin concentration at the other measurement position is calculated, and the correlation function at each measurement position is calculated. A topographic image can also be created. Since the correlation function at each measurement position is a function defined by the time lag τ, if a topography image is created from the value of the correlation function at the same time lag τ and displayed according to the order of τ or displayed as a moving image, the hemodynamics You can visualize how changes are propagated. Here, the relative change amount of oxyhemoglobin concentration is described as a representative, but the relative change of total hemoglobin concentration calculated by the sum of the relative change amount of reduced hemoglobin concentration or the relative change amount of oxidized and reduced hemoglobin concentration. A topographic image can be created in the same way for the amount.
[0027]
FIG. 30 shows a display example in which the
[0028]
FIG. 2 shows an example of a flow according to the present invention, in which a subject is measured using the optical measuring device shown in FIG. The operation can be sequentially advanced while the operator sees the screen displayed on the screen display surface of the
[0029]
When the operating system of the apparatus is started up, first, an initial screen for main menu selection shown in FIG. 3 is displayed (S1). In FIG. 3, when the
[0030]
If the
401: A bar for inputting a title. Specifically, the name of the examination to be performed is input.
402: Date and time are displayed, and the date and time when the screen is displayed are displayed by default (numbers and characters displayed automatically).
403: A part for inputting the type of stimulus (for example, finger movement, writing, speech, drug administration, etc.). Press the list display button (inverted triangle button) and select the registered type from the list box. The selected type is displayed with the background color changed or reversed. Data can be added and deleted.
404: The type item selected by the stimulus input unit can be deleted.
405: A part for selecting a measurement mode. The measurement mode is determined by the number of measurement channels and the number of surfaces to be measured. For example, when the number of measurement channels is 12 and the number of surfaces to be measured is 2, the
406: A free memo writing portion.
407: A part for inputting a subject name.
408: A part for inputting the age of the subject.
409: A part for inputting the gender of the subject.
410: A part for inputting the type of the subject, that is, a patient or a healthy person.
411: A setting end button.
412: A button for returning to the initial screen.
[0031]
When the above conditions are input and set, when the button 412 is pressed, the condition input screen shown in FIG. 4 is deleted and the flow returns to the initial screen display. However, when the
[0032]
In FIG. 6,
[0033]
If there is even one measurement channel for which gain adjustment has failed, the measurement channel is displayed in red. In this case, the abnormality display screen shown in FIG. 7 is also displayed in the vicinity of the measurement position display screen shown in FIG. 6 (S5). If the gain adjustment is not successful, it means that there may be a problem with the measurement positions on the left and right or top and bottom of the red display. In the case of red display, it is considered that the setting of the optical fiber is bad, so it is necessary to reset the setting of the optical fiber. Therefore, after resetting the optical fiber, 701 in FIG. 7 is used when returning to the screen of FIG. 3 or 4 to stop the measurement. When the
[0034]
In FIG. 7,
[0035]
In FIG. 8, the meaning and function of each part are as follows.
801: A part for inputting a file name.
802: A part for displaying a list of all files existing in the hierarchy selected by the button 804. For example, a data name measured before is displayed here. 803: A part for displaying the current path.
804: A part for displaying a directory list (hierarchical list).
805: A button for giving permission to proceed to the measurement process.
806: A button that is pressed to cancel and return to the condition input screen of FIG. When this button is pressed, the file creation screen shown in FIG. 8 and the measurement position display screen shown in FIG. 6 are deleted, and the condition input screen shown in FIG. 4 is displayed.
807: A button used when the directory creation screen shown in FIG. 9 is displayed to create a new directory. When this button is pressed, the directory creation screen is displayed with a slight shift on the file creation screen shown in FIG. At this time, the directory creation screen shown in FIG. 9 cannot be operated.
808: A button for specifying a drive.
When the button 807 is pressed, the directory creation screen shown in FIG. 9 is displayed (S7). In FIG. 9, 901 is a part for inputting a directory name to be created, 902 is a directory creation end button, 903 is a cancel button, and the directory creation screen shown in FIG. Returning to the file creation screen shown in FIG.
[0036]
In FIG. 8, when the button 805 is pressed, the file creation screen shown in FIG. 8 is deleted, the measurement screen shown in FIG. 10 is displayed on the upper left of the display surface (S8), and the measurement data shown in FIG. Time series display screen is displayed Indication One or more are displayed in the right most part of the plane (S11). FIG. 8 is used to control the execution of the measurement. In FIG. 10, the meaning and function of each part are as follows.
1001: When Info is selected with the button for selecting Info, as shown in FIG.
Displays a screen for selecting Condition or Tuneup as a submenu.
Is done. Con in the submenu of FIG. di If selection is selected,
The same condition input screen is displayed (S9). This is a confirmation of the current situation or
The purpose is to enter additional conditions. Tuneup in the submenu of Figure 11
When selected, the measurement condition and display condition input screen shown in FIG. 12 is displayed.
It is shown (S10). In
When the cell button is pressed, the condition input screen shown in FIG. 4 or shown in FIG.
Measurement condition and display condition input screen is deleted, and the measurement screen shown in FIG.
Return.
1002: A button for selecting Option. When Option is selected, it is shown in FIG.
A sub-menu screen is displayed as shown. Here, during measurement to be described later
Graph display conditions, data backup interval, and other measurement equipment.
Input the conditions such as the signal to be input, but it is automatically set at the previous measurement.
It is not necessary to set every time because of the learning function that the reflected value is reflected.
1003: A part for designating and displaying a data acquisition time interval.
1004: A part for displaying the number of times of data acquisition (the number of times of sampling).
1005: A part for displaying the elapsed measurement time.
1006: A part for displaying the next measurement state.
Run: Measuring
Completion: Measurement ends normally
Overrun: Measurement by A / D converter overflow
Abnormal termination
Stop: Other measurement abnormal termination
File error: Measurement file write error
Back up file error: Backup file write error
1007: A button for starting measurement. When this button is pressed, measurement is performed,
A measurement data time series signal graph is displayed on each axis in FIG. 14 (S
11). The displayed graph represents the rate of change.
1008: A button for ending data acquisition.
1009: A button for finishing measurement and inspection.
1010: A part for displaying an elapsed time after the
Therefore, you do not have to manage the stimulation time with a stopwatch
The convenience of becoming.
1011: A mark button. Marks consisting of vertical lines in the graph of FIG. 14 during measurement
It is for putting. Normally, this mark is used for data analysis.
Enter at the end of stimulation for reference, but record the time during measurement.
It can be entered arbitrarily when a desired event occurs.
[0037]
In the measurement condition and display condition input screen shown in FIG. 12, measurement conditions corresponding to the selected measurement mode are displayed. The measurement conditions represent correspondences of measurement channels (measurement positions), A / D converter channels, wavelengths, signal amplification factors, and the like. Here, it is also possible to specify a channel to be measured and a channel to be displayed in a graph. Further, it is possible to instruct to input another signal to a vacant channel. The meaning and function of each part in the screen of FIG. 12 are as follows.
1201: Measurement conditions and display conditions for each wavelength used in the selected measurement mode
Use this tab to select the table for the wavelength you want to present.
Select.
1202: A part for specifying and displaying the necessity of graph display. True is graph display
And false means no graph display. In advance, hide the graph.
Select each measurement channel you want to select (click in the Visible column.
And the background color changes or is highlighted) 1212 Fa
By specifying the lse button, the selected measurement channel is changed to T r ue to Fals
Change to e.
1203: A part for displaying the gain of the lock-in amplifier.
1204: A part for displaying the dynamic range of the A / D converter. 1203
And 1204 display values determined by automatic gain adjustment.
1205: A part for displaying the wavelength.
1206: A part for displaying the type of signal. Optical means optical measurement. Example
For example, EEG signals are measured simultaneously on additional channels (added in 1208)
EEG and the operator input. Data solution
During analysis, signals other than Optical can be distinguished and processed.
1207: A part for displaying a measurement channel number.
1208: Indicates whether the A / D converter channel number is valid (True) or invalid (False).
This is the part to be displayed. The designation method is the same as in the case of 1202.
When set to False, measurement is not performed on the specified channel.
1209: Enter a character string, number, etc. at the selected position in 1202-1208.
It is.
1210: A part for changing the dynamic range of the A / D converter.
Effective when 1204 is selected.
1211: A part for changing the gain of the lock-in amplifier. When 1203 is selected
Effective.
1212: The part which switches True and False in the 1202 and 1208 columns
It is.
1213: A part for selecting a measurement mode to be displayed. Each is the table to display
Are displayed in multiple tables for each wavelength, and All is a single table for all measurement channels.
indicate.
1214: A button for ending the setting.
1215: A button for canceling the setting.
[0038]
According to the screen of FIG. 12, the monitor of the measurement conditions (1203 to 1208) and the graph display (1202) conditions are displayed on one screen, and confirmation and setting change can be easily performed. In addition, signals from other measuring devices (devices) can be captured using this screen. Furthermore, the screen of FIG. 12 is the only screen for inputting conditions for the operator to select whether or not to measure the input signal.
[0039]
In the Option sub-menu screen in the measurement screen of FIG. 10 shown in FIG. 13, the following screens are displayed depending on what is selected. However, in FIG. 13, the display of Trigger Pulse and External Trigger to be selected is omitted.
Graph: Display condition input screen for the graph of FIG. 14 (FIG. 15)
・ Backup: File backup condition input screen (Fig. 16)
・ Other CH: Input setting screen for other measurement device output signal (Fig. 17)
・ Trigger Pulse: Rectangular wave output signal setting screen (Fig. 18)
・ External Trigger: External input trigger-synchronous measurement condition setting screen (Figure 20)
・ Measurement
Parameter: Measurement data acquisition condition setting screen (Fig. 21)
・ Prescan: Measurement signal confirmation screen (Fig. 22)
• Position: Measurement position display screen (FIG. 6) (return to step S6)
The meaning and function of each part of the screens of FIGS. 15 to 18 and 20 to 22 will be described below.
[0040]
FIG. 15 (graph display condition input screen of FIG. 14) (S12)
1). Enter the X-axis range. There are two types of input methods for inputting the range: input at a magnification performed at 1501 and input at a display time performed at 1503.
1501: A button for selecting display magnification input for the X-axis of the graph.
1502: A portion for inputting the display magnification of the X-axis of the graph as a percentage. For example, when displaying a period of 3600 seconds at 100%, changing to 1000% results in a range of 360 seconds. In this case, when 360 seconds are exceeded, the screen scrolls to the left. Specifically, when data for 362 seconds is acquired, the X-axis range in the graph of FIG. 14 displays a signal from 2 seconds to 362 seconds.
1503: A button for selecting display time input for the X-axis of the graph. When this button is selected, 1501 is automatically deselected. The
1504: A part for inputting the display time of the X-axis of the graph.
1505: A portion for displaying the number of data acquired within the display time designated by 1504.
2). Enter the Y-axis range.
1506: A part for inputting the display magnification of the Y-axis of the graph. The idea is the same as in the case of X-axis magnification input.
3). The graph display format of FIG. 14 is selected.
[0041]
1507: All channels in order of measurement channel (all channels selected and displayed in FIG. 12)
This button is used to select display of a channel. This button is selected
The number of wavelengths used to measure each measurement channel (in the example,
2 wavelengths ) 14 are displayed without overlapping. At this time
The first screen displays the signals of the first wavelength in the order of measurement channels, and the second screen
The surface displays a signal in the order of measurement channels of the second wavelength. Do not set
If so, Together is selected.
1508: A button for displaying all channels in one window.
1509: Button for displaying a graph in a separate window for each channel
It is Furthermore, there are the following two types of display methods.
Title: Graphs are displayed in tiles.
Cascade: Graphs are displayed in an overlapping manner.
1510: A graph of only one designated channel is displayed (the channel displayed in FIG. 12).
Channel can be selected).
1511: A part for forcing not to display the graph.
1512: A part for finishing the setting. When the setting is completed, the screen display is shown in
Return to the screen display.
1513: A part for canceling. Even if you cancel, the screen display
Returning to the screen display of FIG.
[0042]
FIG. 16 (file backup condition input screen) (S13)
This is to set a condition for the function to back up data at any time during measurement in anticipation of a power failure during measurement or a case where the file specified on the file creation screen in FIG. .
1601: A part for designating whether or not back-up is necessary.
1602: A part for inputting a backup interval time.
1603: A part for inputting a backup file name with a full path.
1604: A part for referring to a directory and a file. The file creation screen of FIG. 8 is displayed, and the designated file name enters the Backup
1605: A button for finishing setting. When the setting is completed, the screen display returns to the screen display of FIG.
1606: A cancel button. Even in the case of cancellation, the screen display returns to the screen display of FIG.
[0043]
FIG. 17 (input setting screen for other measuring device output signal) (S14)
Using this screen, signals output from other measuring devices can be used to convert available A / D converter channels. Through get. The channel number of the A / D converter at the time of acquisition, the signal type name (EEG etc.), and the dynamic range of the A / D converter are selected.
[0044]
1701: A part for displaying the channel number of an available A / D converter for input.
is there. Youngest A / D converter channel available No Number automatically
Split It is guessed.
1702: A part for inputting a signal type name.
1703: For selecting the dynamic range of the A / D converter for other inputs
is there.
1704: A button for ending setting. When the setting is completed, the screen display is as shown in the screen chart of FIG.
Indication In Return.
1705: A cancel button. In the case of cancellation, the screen display is as shown in FIG.
Screen display In Return.
[0045]
FIG. 18 (rectangular wave output signal setting screen) (S15)
A rectangular voltage signal is periodically output from the optical measuring device. By inputting this signal to another measuring device (such as an electroencephalograph), the measurement time can be strictly matched between the devices. The rectangular wave signal is output from a sill alport of a personal computer, for example.
[0046]
There are three types of rectangular wave signals to be output as shown in FIG. The first type is a rectangular wave signal output only at the start. The second type is a rectangular wave signal that is periodically output until the end of measurement. The third type is a rectangular wave signal output in synchronization with pressing the
1801: A part for selecting whether or not to output a rectangular wave.
1802: A part for selecting a terminal for outputting a rectangular wave.
1803: A part for inputting the time width of the first type of rectangular wave (see A in FIG. 19).
1804: A part for inputting the number of repetitions of the first type of rectangular wave (see B in FIG. 19).
1805: A part for inputting the number of repetitions of the second type of rectangular wave (see C in FIG. 19).
1806: A part for inputting the time width of the second type of rectangular wave (see D in FIG. 19).
1807: A part for inputting the time width of the third type of rectangular wave (see E in FIG. 19).
1808: A setting end button. When the setting is completed, the screen display returns to the screen display of FIG.
1809: A cancel button. Even in the case of cancellation, the screen display returns to the screen display of FIG.
[0047]
FIG. 20 (external input trigger-synchronous measurement condition setting screen) (S16)
This screen is used when measuring in synchronization with an external trigger signal. By synchronous measurement, time can be completely synchronized with other measuring devices and stimulators.
2001: A part for designating whether external input trigger synchronous measurement is necessary.
2002: A part for inputting the channel number of the A / D converter used for the external input trigger signal.
2003: A part for inputting a measurement time for one trigger signal.
2004: A part for inputting a threshold value of a voltage value recognized as a trigger signal.
[0048]
2005: A button for ending the setting. When the setting is completed, the screen display returns to the screen display of FIG.
2006: A cancel button. Even in the case of cancellation, the screen display returns to the screen display of FIG.
[0049]
FIG. 21 (Measurement data acquisition condition setting screen) (S17)
Here, the operation frequency (Burst Rate) of the channel of the A / D converter, the sampling frequency (Coversion Rate) per channel of the A / D converter, the average number of acquisition data (Number of Samples), the acquisition It is possible to set a data addition time (Acquisition Time), a data acquisition time interval (Sampling Period: the same as 1003 in FIG. 10), and a previous measurement time.
2101: A part for displaying and inputting a Burst Rate.
2102: A part for displaying and inputting the Convewrsion Rate.
2103: A part for displaying and inputting the number of samples acquired by one sampling.
2104: A part for displaying the data acquisition time.
2105: A part for displaying and inputting a data acquisition time interval.
2106: A part for displaying and inputting the measurement time.
2107: A button for finishing setting. When the setting is completed, the screen display returns to the screen display of FIG.
2108: A cancel button. Even in the case of cancellation, the screen display returns to the screen display of FIG.
[0050]
FIG. 22 (Measurement signal confirmation screen) (S18)
This screen is used for the operator to perform preliminary measurement before entering the main measurement, if necessary, and for the operator to check the signal state. The value of the signal displayed in the graph represents the voltage value.
[0051]
2201: A part for displaying a data acquisition interval.
2202: A part for displaying the number of times of data acquisition (sampling number).
2203: A portion for displaying the measurement elapsed time.
2204: A unit for displaying the measurement state (see FIG. 10).
2205: A part for designating the magnification in the X direction of the graph (see FIG. 15).
2206: A unit for displaying numerical values for each channel for writing the preliminary measurement result.
2207: A button for starting output signal confirmation. When this button is pressed, one or a plurality of measurement signals are displayed in the screen shown in FIG. 14 according to the style of the graph set in the screen shown in FIG.
2208: A button for interrupting measurement.
2209: A button for ending preliminary measurement. When this button is pressed, the display screen returns to the screen of FIG.
[0052]
According to the embodiment described above, even an unskilled operator can quickly input without error. The operator is also provided with optional functions that allow detailed settings.
[0053]
【The invention's effect】
According to the present invention, it is suitable for optically measuring a subject and easily obtaining an image of a predetermined item based on information obtained by the measurement. Living body Optical instrumentation Place Is provided.
[0054]
According to the present invention, even an unskilled operator can quickly make an error-free input, and thus can perform measurement operation with light without being familiar with the operation manual.
[0055]
Furthermore, according to the present invention, it is possible to accurately grasp the state of change of the subject, for example, the activation state of cerebral oxygen metabolism.
[Brief description of the drawings]
FIG. 1 is a block diagram showing a configuration of a main part of an embodiment of an optical measuring device to which the present invention is applied.
2 is a flow diagram as an example based on the present invention, in which a subject is measured using the optical measurement apparatus shown in FIG. 1; FIG.
FIG. 3 is a diagram showing an initial screen displayed on the display unit.
FIG. 4 is a diagram showing a condition input screen displayed on the display unit.
FIG. 5 is a diagram showing a display screen during gain adjustment displayed on the display unit.
FIG. 6 is a diagram showing a measurement position display screen shown on the display unit.
FIG. 7 is a diagram showing an abnormality display screen displayed on the display unit.
FIG. 8 is a diagram showing a file creation screen displayed on the display unit.
FIG. 9 is a diagram showing a directory creation screen displayed on the display unit.
FIG. 10 is a diagram showing a measurement screen displayed on the display unit.
FIG. 11 is a diagram showing a sub-menu screen of Info shown in FIG. 10 displayed on the display unit.
FIG. 12 is a diagram showing an input screen for measurement conditions and display conditions displayed on the display.
13 is a diagram showing a sub-menu screen of Option in FIG. 10 displayed on the display unit.
FIG. 14 is a diagram showing a measurement data time series display screen displayed on the display unit;
15 is a diagram showing a display condition input screen for the graph of FIG. 14 displayed on the display unit.
FIG. 16 is a diagram showing a file backup condition input screen displayed on the display unit.
FIG. 17 is a diagram showing an input setting screen for other measuring device output signals displayed on the display unit;
FIG. 18 is a diagram showing a rectangular wave output signal setting screen displayed on the display unit.
19 is a diagram showing a rectangular wave output signal waveform whose conditions are set in FIG.
FIG. 20 is a diagram showing an external input trigger-synchronous measurement condition setting screen displayed on the display unit.
FIG. 21 is a diagram showing a measurement data acquisition condition setting screen displayed on the display unit.
FIG. 22 is a diagram showing a measurement signal confirmation screen displayed on the display unit.
FIG. 23 is a block diagram showing a configuration in the optical module of FIG. 1;
FIG. 24 is a diagram showing an example of a geometric arrangement of irradiation positions and detection positions on the surface of a subject.
25 is a block diagram showing a configuration of the lock-in amplifier module of FIG. 1. FIG.
FIG. 26 is a graph as an example showing a change over time of a measurement signal at a certain detection position and a predicted no-load signal obtained from the measurement signal.
FIG. 27 is a graph as an example showing a temporal change in the relative change amount of the oxidized and reduced hemoglobin concentration at a certain measurement position;
FIG. 28 is a diagram showing a contour image (topography image) created from a temporal change in the relative change amount of oxyhemoglobin concentration at each measurement point with the exercise of the left finger of a subject as a load.
FIG. 29 is a diagram showing a contour image (topography image) created from the change over time of the relative change amount of oxyhemoglobin concentration at each measurement point with the exercise of the subject's right finger as a load.
FIG. 30 is a diagram showing a display example in which a topography image is superimposed on a brain surface image of a subject.
[Explanation of symbols]
DESCRIPTION OF SYMBOLS 1: Light source part, 2: Optical module, 3: Oscillating part, 8-1 to 8-4: Optical fiber for irradiation, 9: Subject, 10-1 to 105: Optical fiber for detection, 11-1 11-5: Photo diode, 12: Lock-in amplifier module, 16: Sample hold circuit module, 17: Switch (multiplexer), 18: Analog / digital converter, 19: Computer, 20: Storage device, 21: display unit, 22: operation unit.
Claims (3)
Priority Applications (6)
| Application Number | Priority Date | Filing Date | Title |
|---|---|---|---|
| JP13464998A JP4006826B2 (en) | 1998-04-28 | 1998-04-28 | Biological light measurement device |
| DE1999635214 DE69935214T2 (en) | 1998-04-28 | 1999-04-26 | Optical measuring instrument and optical measuring method |
| US09/674,008 US7047149B1 (en) | 1998-04-28 | 1999-04-26 | Optical measurement instrument and optical measurement method |
| EP19990917155 EP1076236B1 (en) | 1998-04-28 | 1999-04-26 | Optical measurement instrument |
| PCT/JP1999/002207 WO1999056108A1 (en) | 1998-04-28 | 1999-04-26 | Optical measurement instrument and optical measurement method |
| US11/378,448 US7359825B2 (en) | 1998-04-28 | 2006-03-20 | Optical measurement instrument and optical measurement method |
Applications Claiming Priority (1)
| Application Number | Priority Date | Filing Date | Title |
|---|---|---|---|
| JP13464998A JP4006826B2 (en) | 1998-04-28 | 1998-04-28 | Biological light measurement device |
Related Child Applications (1)
| Application Number | Title | Priority Date | Filing Date |
|---|---|---|---|
| JP2006065409A Division JP4332534B2 (en) | 2006-03-10 | 2006-03-10 | Biological light measurement device |
Publications (2)
| Publication Number | Publication Date |
|---|---|
| JPH11311599A JPH11311599A (en) | 1999-11-09 |
| JP4006826B2 true JP4006826B2 (en) | 2007-11-14 |
Family
ID=15133317
Family Applications (1)
| Application Number | Title | Priority Date | Filing Date |
|---|---|---|---|
| JP13464998A Expired - Lifetime JP4006826B2 (en) | 1998-04-28 | 1998-04-28 | Biological light measurement device |
Country Status (5)
| Country | Link |
|---|---|
| US (2) | US7047149B1 (en) |
| EP (1) | EP1076236B1 (en) |
| JP (1) | JP4006826B2 (en) |
| DE (1) | DE69935214T2 (en) |
| WO (1) | WO1999056108A1 (en) |
Families Citing this family (25)
| Publication number | Priority date | Publication date | Assignee | Title |
|---|---|---|---|---|
| JP4411208B2 (en) * | 2002-09-05 | 2010-02-10 | 株式会社日立メディコ | Biological light measurement device |
| JP4517613B2 (en) * | 2003-09-19 | 2010-08-04 | 株式会社日立メディコ | Biological signal processing device |
| JP4393461B2 (en) * | 2003-11-26 | 2010-01-06 | 株式会社日立メディコ | Biological light measurement apparatus and method |
| JP4590555B2 (en) | 2004-09-02 | 2010-12-01 | 国立大学法人長岡技術科学大学 | Sensitive state discrimination method and apparatus |
| JP4839171B2 (en) * | 2006-09-29 | 2011-12-21 | 株式会社日立メディコ | Biological light measurement device |
| US8457705B2 (en) * | 2006-10-25 | 2013-06-04 | University Of Denver | Brain imaging system and methods for direct prosthesis control |
| FR2914743B1 (en) | 2007-04-06 | 2009-05-15 | Michelin Soc Tech | METHOD FOR DETECTING AND ESTIMATING A HYDROPLANING PHENOMENON OF A PNEUMATIC ON A WETTED ROAD |
| US9717896B2 (en) | 2007-12-18 | 2017-08-01 | Gearbox, Llc | Treatment indications informed by a priori implant information |
| US8636670B2 (en) | 2008-05-13 | 2014-01-28 | The Invention Science Fund I, Llc | Circulatory monitoring systems and methods |
| US20090287120A1 (en) | 2007-12-18 | 2009-11-19 | Searete Llc, A Limited Liability Corporation Of The State Of Delaware | Circulatory monitoring systems and methods |
| JP5281805B2 (en) * | 2008-02-20 | 2013-09-04 | 株式会社日立メディコ | Phantom device for inspection of biological light measurement device |
| JP5159893B2 (en) * | 2008-10-01 | 2013-03-13 | 株式会社日立メディコ | Biological light measurement device and light irradiation position and light detection position or measurement channel position display method |
| JP4961442B2 (en) * | 2009-02-02 | 2012-06-27 | 株式会社日立製作所 | Biological measurement probe and biological optical measurement device |
| JP5536678B2 (en) * | 2009-02-13 | 2014-07-02 | 株式会社日立メディコ | MEDICAL IMAGE DISPLAY METHOD, MEDICAL IMAGE DIAGNOSIS DEVICE, AND MEDICAL IMAGE DISPLAY DEVICE |
| EP2417909B1 (en) * | 2009-04-08 | 2016-05-04 | Hitachi Medical Corporation | Biophotometer and method for determining disconnection of optical fiber |
| KR101148769B1 (en) * | 2009-06-02 | 2012-05-24 | 주식회사 인포피아 | appratus, method and test strip for multi-testing |
| CN102469993B (en) * | 2009-07-21 | 2014-07-16 | 株式会社岛津制作所 | Organism optical measurement device |
| US8583565B2 (en) * | 2009-08-03 | 2013-11-12 | Colorado Seminary, Which Owns And Operates The University Of Denver | Brain imaging system and methods for direct prosthesis control |
| WO2012136271A1 (en) * | 2011-04-08 | 2012-10-11 | Abb Research Ltd | Analyzer instrument and methods for operating same |
| CN103528989B (en) * | 2013-10-30 | 2018-10-02 | 合肥汇众知识产权管理有限公司 | Near infrared moisture measuring instrument |
| CN104614070B (en) * | 2015-01-06 | 2017-01-04 | 国家电网公司 | The light resources monitoring method of a kind of multispectral survey and system |
| CN104833348B (en) * | 2015-04-30 | 2017-07-14 | 长安大学 | A kind of gradually multiposition based on locked rotor torque pattern gyroscope total station seeks northern measuring method |
| JP2017041159A (en) * | 2015-08-21 | 2017-02-23 | 株式会社日立製作所 | Device diagnostic system |
| JP6609738B2 (en) * | 2016-02-10 | 2019-11-27 | 株式会社NeU | Biological light measurement device and biological light measurement method |
| USD840426S1 (en) * | 2017-09-13 | 2019-02-12 | Inspire Medical Systems, Inc. | Display screen or portion thereof with animated graphical user interface |
Family Cites Families (23)
| Publication number | Priority date | Publication date | Assignee | Title |
|---|---|---|---|---|
| JPS6072542A (en) | 1983-09-28 | 1985-04-24 | 株式会社島津製作所 | Light ray ct apparatus |
| JPS62231625A (en) | 1986-03-31 | 1987-10-12 | 住友電気工業株式会社 | Optical ct scanner |
| JPH0752040B2 (en) | 1986-07-03 | 1995-06-05 | 三洋電機株式会社 | Absorption refrigerator |
| JPS6315005A (en) | 1986-07-04 | 1988-01-22 | Soichi Arakawa | Cremation truck |
| JPS63277038A (en) | 1987-05-08 | 1988-11-15 | Hamamatsu Photonics Kk | Diagnostic apparatus |
| JPH01202384A (en) * | 1988-02-04 | 1989-08-15 | Fanuc Ltd | Method for adjusting laser power source |
| US4975636A (en) * | 1989-05-01 | 1990-12-04 | Hewlett-Packard Company | Method and apparatus for selecting and displaying a high resolution window from a main display |
| US5039937A (en) * | 1990-05-11 | 1991-08-13 | Nicolet Instrument Corporation | Method and apparatus for providing compressed and expanded displays on a digital oscilloscope |
| US5161535A (en) * | 1991-06-24 | 1992-11-10 | Hewlett-Packard Company | Medical ultrasound imaging system having a partitioned menu |
| JPH05300887A (en) * | 1992-04-27 | 1993-11-16 | Shimadzu Corp | Apparatus for measuring amount of cerebral blood |
| US5853370A (en) * | 1996-09-13 | 1998-12-29 | Non-Invasive Technology, Inc. | Optical system and method for non-invasive imaging of biological tissue |
| WO1994005209A1 (en) * | 1992-08-31 | 1994-03-17 | Hitachi, Ltd. | Optical ct apparatus |
| JPH06154227A (en) | 1992-11-20 | 1994-06-03 | Terumo Corp | Ultrasonic diagnosing apparatus |
| JP3239553B2 (en) | 1993-09-20 | 2001-12-17 | 株式会社島津製作所 | Brain function analyzer |
| JP3465327B2 (en) | 1993-11-12 | 2003-11-10 | カシオ計算機株式会社 | Heart radio wave detection device, heart radio wave detection system, and pulse calculation device |
| US5517105A (en) * | 1994-10-25 | 1996-05-14 | Tektronix, Inc. | Dual linked zoom boxes for instrument display |
| WO1996020638A1 (en) | 1995-01-03 | 1996-07-11 | Non-Invasive Technology, Inc. | Optical coupler for in vivo examination of biological tissue |
| JP3629583B2 (en) | 1995-05-18 | 2005-03-16 | 株式会社キーエンス | Data collection device, monitoring device and recording medium |
| US6240309B1 (en) | 1995-10-06 | 2001-05-29 | Hitachi, Ltd. | Optical measurement instrument for living body |
| JP3682793B2 (en) | 1995-11-30 | 2005-08-10 | 株式会社日立製作所 | Light scattering device internal imaging device |
| JPH0998972A (en) * | 1995-10-06 | 1997-04-15 | Hitachi Ltd | Measurement equipment of light from living body and image generation method |
| JPH09262217A (en) * | 1996-03-28 | 1997-10-07 | Matsushita Electric Works Ltd | Mobile electrocardiographic recording apparatus |
| JP3728019B2 (en) * | 1996-07-02 | 2005-12-21 | 株式会社日立メディコ | Medical diagnostic imaging equipment |
-
1998
- 1998-04-28 JP JP13464998A patent/JP4006826B2/en not_active Expired - Lifetime
-
1999
- 1999-04-26 US US09/674,008 patent/US7047149B1/en not_active Expired - Fee Related
- 1999-04-26 DE DE1999635214 patent/DE69935214T2/en not_active Expired - Lifetime
- 1999-04-26 WO PCT/JP1999/002207 patent/WO1999056108A1/en active IP Right Grant
- 1999-04-26 EP EP19990917155 patent/EP1076236B1/en not_active Expired - Lifetime
-
2006
- 2006-03-20 US US11/378,448 patent/US7359825B2/en not_active Expired - Fee Related
Also Published As
| Publication number | Publication date |
|---|---|
| WO1999056108A1 (en) | 1999-11-04 |
| DE69935214T2 (en) | 2007-12-20 |
| JPH11311599A (en) | 1999-11-09 |
| DE69935214D1 (en) | 2007-04-05 |
| EP1076236A4 (en) | 2001-10-17 |
| EP1076236A1 (en) | 2001-02-14 |
| US7047149B1 (en) | 2006-05-16 |
| US20060178839A1 (en) | 2006-08-10 |
| US7359825B2 (en) | 2008-04-15 |
| EP1076236B1 (en) | 2007-02-21 |
Similar Documents
| Publication | Publication Date | Title |
|---|---|---|
| JP4006826B2 (en) | Biological light measurement device | |
| JP4076003B2 (en) | Biological light measurement device | |
| JP4055266B2 (en) | Optical measuring device | |
| US6542763B1 (en) | Optical measurement equipment and recording medium and optical measurement method | |
| US6282438B1 (en) | Optical system for measuring metabolism in a body and imaging method | |
| JP4097522B2 (en) | Biological light measurement device | |
| JP4332534B2 (en) | Biological light measurement device | |
| JP5347448B2 (en) | Biometric device | |
| US7725145B2 (en) | Biological photometric device | |
| JP3977947B2 (en) | Optical measurement method and apparatus | |
| JP4559417B2 (en) | Biological light measuring device and program | |
| JP4478724B2 (en) | Optical measuring device | |
| JP5790877B2 (en) | Photobiological measurement system and method of using the same | |
| JP4156585B2 (en) | Optical measuring device | |
| JP4517613B2 (en) | Biological signal processing device | |
| Ishikawa et al. | Development of double density whole brain fNIRS with EEG system for brain machine interface | |
| JP2005111283A (en) | Optical measuring apparatus | |
| JP4230729B2 (en) | Biological light measurement device | |
| JP5484786B2 (en) | Biological light measurement device | |
| JP2005095465A (en) | Biological optical measuring device | |
| JP6069885B2 (en) | Optical measurement system and method of using the same |
Legal Events
| Date | Code | Title | Description |
|---|---|---|---|
| A521 | Request for written amendment filed |
Free format text: JAPANESE INTERMEDIATE CODE: A523 Effective date: 20041020 |
|
| A621 | Written request for application examination |
Free format text: JAPANESE INTERMEDIATE CODE: A621 Effective date: 20041020 |
|
| A131 | Notification of reasons for refusal |
Free format text: JAPANESE INTERMEDIATE CODE: A131 Effective date: 20060711 |
|
| A521 | Request for written amendment filed |
Free format text: JAPANESE INTERMEDIATE CODE: A523 Effective date: 20060911 |
|
| A131 | Notification of reasons for refusal |
Free format text: JAPANESE INTERMEDIATE CODE: A131 Effective date: 20061121 |
|
| A521 | Request for written amendment filed |
Free format text: JAPANESE INTERMEDIATE CODE: A523 Effective date: 20070122 |
|
| A02 | Decision of refusal |
Free format text: JAPANESE INTERMEDIATE CODE: A02 Effective date: 20070424 |
|
| A521 | Request for written amendment filed |
Free format text: JAPANESE INTERMEDIATE CODE: A523 Effective date: 20070622 |
|
| A911 | Transfer to examiner for re-examination before appeal (zenchi) |
Free format text: JAPANESE INTERMEDIATE CODE: A911 Effective date: 20070703 |
|
| TRDD | Decision of grant or rejection written | ||
| A01 | Written decision to grant a patent or to grant a registration (utility model) |
Free format text: JAPANESE INTERMEDIATE CODE: A01 Effective date: 20070807 |
|
| A61 | First payment of annual fees (during grant procedure) |
Free format text: JAPANESE INTERMEDIATE CODE: A61 Effective date: 20070820 |
|
| FPAY | Renewal fee payment (event date is renewal date of database) |
Free format text: PAYMENT UNTIL: 20100907 Year of fee payment: 3 |
|
| R150 | Certificate of patent or registration of utility model |
Free format text: JAPANESE INTERMEDIATE CODE: R150 |
|
| FPAY | Renewal fee payment (event date is renewal date of database) |
Free format text: PAYMENT UNTIL: 20100907 Year of fee payment: 3 |
|
| FPAY | Renewal fee payment (event date is renewal date of database) |
Free format text: PAYMENT UNTIL: 20110907 Year of fee payment: 4 |
|
| FPAY | Renewal fee payment (event date is renewal date of database) |
Free format text: PAYMENT UNTIL: 20120907 Year of fee payment: 5 |
|
| FPAY | Renewal fee payment (event date is renewal date of database) |
Free format text: PAYMENT UNTIL: 20120907 Year of fee payment: 5 |
|
| FPAY | Renewal fee payment (event date is renewal date of database) |
Free format text: PAYMENT UNTIL: 20130907 Year of fee payment: 6 |
|
| S111 | Request for change of ownership or part of ownership |
Free format text: JAPANESE INTERMEDIATE CODE: R313115 |
|
| S533 | Written request for registration of change of name |
Free format text: JAPANESE INTERMEDIATE CODE: R313533 |
|
| R350 | Written notification of registration of transfer |
Free format text: JAPANESE INTERMEDIATE CODE: R350 |
|
| EXPY | Cancellation because of completion of term |