JP3977947B2 - Optical measurement method and apparatus - Google Patents
Optical measurement method and apparatus Download PDFInfo
- Publication number
- JP3977947B2 JP3977947B2 JP34729998A JP34729998A JP3977947B2 JP 3977947 B2 JP3977947 B2 JP 3977947B2 JP 34729998 A JP34729998 A JP 34729998A JP 34729998 A JP34729998 A JP 34729998A JP 3977947 B2 JP3977947 B2 JP 3977947B2
- Authority
- JP
- Japan
- Prior art keywords
- measurement
- window
- target substance
- amount
- change
- Prior art date
- Legal status (The legal status is an assumption and is not a legal conclusion. Google has not performed a legal analysis and makes no representation as to the accuracy of the status listed.)
- Expired - Fee Related
Links
Images


Classifications
-
- A—HUMAN NECESSITIES
- A61—MEDICAL OR VETERINARY SCIENCE; HYGIENE
- A61B—DIAGNOSIS; SURGERY; IDENTIFICATION
- A61B5/00—Measuring for diagnostic purposes; Identification of persons
- A61B5/74—Details of notification to user or communication with user or patient ; user input means
- A61B5/7475—User input or interface means, e.g. keyboard, pointing device, joystick
-
- A—HUMAN NECESSITIES
- A61—MEDICAL OR VETERINARY SCIENCE; HYGIENE
- A61B—DIAGNOSIS; SURGERY; IDENTIFICATION
- A61B5/00—Measuring for diagnostic purposes; Identification of persons
- A61B5/145—Measuring characteristics of blood in vivo, e.g. gas concentration, pH value; Measuring characteristics of body fluids or tissues, e.g. interstitial fluid, cerebral tissue
- A61B5/1455—Measuring characteristics of blood in vivo, e.g. gas concentration, pH value; Measuring characteristics of body fluids or tissues, e.g. interstitial fluid, cerebral tissue using optical sensors, e.g. spectral photometrical oximeters
Description
【0001】
【発明の属する技術分野】
本発明は光計測方法及び装置、特に生体内部の代謝物質情報を得るのに適した光計測方法及び装置に関する。
【0002】
【従来の技術】
光を用いた生体計測法として、脳機能計測に用いる光トポグラフィが知られている(たとえば特願平7−259796号公報及び特開平5−115485号公報参照)が知られている。そのような光トポグラフィにおいては、計測対象(被検体)である生体に光を照射し、その照射位置から数mmから数cm離れた位置で生体組織の透過散乱光を集光して検出する。生体に光を照射し、生体からの光を検出する際の光導波手段としては光ファイバを用いるのが一般的である。計測された生体組織の透過散乱光の強度より、生体内部の光吸収物質の濃度を求めることができる。光吸収物質の具体的例としては、生体内代謝物質である酸化ヘモグロビン及び還元ヘモグロビンが挙げられる。光吸収物質の濃度を求める際には、照射した光の波長に対応した光吸収物質の光吸収特性を用いる。一般的に、生体深部を計測する場合には、生体透過性の高い650nmから1300nmの範囲内にある波長の光を用いる。
【0003】
図13は生体光計測装置の表示部に表示される従来のトポグラフ画像を示す。計測領域内の生体内代謝物質の物理量を示すトポグラフ画像1がウィンドウ2内に示されている。この画像は、生体組織にある波長のレーザ光を照射し、生体内組織の透過散乱光強度及び使用しているレーザ光の波長における代謝物質の吸光度を用いて得られた、生体内代謝物質の計測量又はその変化の分布を表す。生体組織の散乱特性により、レーザの照射点と生体組織透過光強度の検出点の間隔、したがって計測点桓の間隔は数cm程度である。このため、計測点間での生体内代謝物質の計測量又はその変化は統計学的処理、たとえば補間、により推定される。
【0004】
【発明が解決しようとする課題】
生体組織の詳細情報を得るには高い空間分解能が必要である。しかし、現状では、生体光計測装置の分解能は低く、数cmである。すなわち、生体内代謝物質の物理量を画像化する場合、線形補間という統計学的処理により画像処理を行っているが、計測点間の値は表示されず、その数値的情報(定量的情報)を得ることは不可能である。このため、生体組織の詳細情報を得ることが困難である。
【0005】
本発明の目的は計測位置及び該計測位置以外の位置を含めて被検体の計測領域内の任意の位置における計測対象物質の計測量又はその変化の評価を可能にすることにより空間分解能の向上を図るのに適した光計測方法及び装置を提供することにある。
【0006】
【課題を解決するための手段】
本発明においては、被検体の計測領域内の計測対象物質が光学的に計測される。また、計測領域内の任意の位置を指定すると、その指定された位置における前記計測対象物の計測量、その計測量の変化、もしくはそのいずれかの時間依存情報、又は前記指定された位置の情報が提示される。
【0007】
【発明の実施の形態】
図9は、本発明が適用される光計測装置のー実施例の主要部の構成を示す。本実施例では、計測対象である被検体、例えば頭部の皮膚に光を照射し、それによって被検体内で散乱され該被検体を通過した光を検出することにより大脳内部又は大脳皮質を画像化する実施形態を、計測チャンネルの個数すなわち計測位置の数が12、計測すべき信号の数(アナログ/ディジタル変換チャンネルの数)が24の場合で示す。もちろん本発明は、計測対象として頭部に限らず他の部位、さらには生体以外にも実施可能である。
【0008】
光源部91は4個の光モジュール92から構成されている。各光モジュールは、可視から赤外の波長領域内での複数の波長、例えば780nm及び830nmの2波長の光をそれぞれ放射する2個の半導体レーザから構成されている。これらの2波長の値は、780nmと830nmに限定されるものではなく、また、波長数も2波長に限定されるものではない。この光源部91については、半導体レーザの代わりに発光ダイオードを用いてもよい。この光源部91に含まれる全ての半導体レーザ8個からの光は、発振周波数の異なる8個の発振器で構成されている発振部93によりそれぞれ変調される。
【0009】
図10は光モジュール92内の構成を、光モジュール92(1)を例にして示す。光モジュール92(1)内には、半導体レーザ93(1-a)、93(1-b)、及びこれらの半導体レーザの駆動回路94(1-a)、94(1-b)が含まれている。ここで、括弧内の文字については、数字は含まれる光モジュール番号を、a、bはそれぞれ波長780nm、830nmを表す記号を示している。これらの半導体レーザ駆動回路94(1-a)、94(1-b)では、半導体レーザ93(1-a)、93(1-b)に対して直流バイアス電流を供給すると共に、発振器93によりそれぞれ異なる周波数f(1-a)、f(1-b)の信号をも印加することで、半導体レーザ93(1-a)、93(1-b)から放射される光に変調を与える。この変調として、本実施例では正弦波によるアナログ変調の場合を示すが、もちろん、それぞれ異なる時間間隔の矩形波によるデジタル変調、つまり異なる時間間隔で光を点滅させるディジタル変調を用いてもよい。このようにして変調された光ビ−ムはそれぞれの半導体レーザ毎に集光レンズ5により光ファイバ96に個々に導入される。個々の光ファイバに導入された2波長の光は光モジュール毎に光ファイバ結合器97により1本の光ファイバ、たとえば照射用光ファイバ98−1内に導入される。光モジュール毎に、2波長の光ビ−ムが照射用光ファイバ98−1〜98−4内に導入され、これらの照射用光ファイバの他端から被検体99の表面上の異なる4個所の照射位置に光が照射される。被検体内で散乱され該被検体内を通過した光は、被検体表面上の5個所の検出位置から該検出位置に配置されている検出用光ファイバ100−1〜100−5を通してフォトダイオ−ド101−1〜101−5によって検出される。これらの光ファイバの端面は被検体99表面上に軽く接触しており、たとえば特開平9―149903号公報に記載されているプローブにより光ファイバは被検体99に装着される。
【0010】
図11は、被検体99表面上における、照射位置1〜4及び検出位置1〜5の幾何学的配置例を示す。本実施例では、照射及び検出位置を交互に正方格子上に配置する。隣接する照射及び検出位置の中点を計測位置とすると、この場合、隣接する照射及び検出位置の組合せが12通り存在するため、計測位置数すなわち計測チャンネル数は12個となる。この照射及び検出位置の配置は、たとえば特開平9―149903号公報及びユウイチ・ヤマシタ(Yuichi Yamashita)他による「近赤外光トポグラフィ計測システム:散乱媒体中に局在する吸収体の画像化(Near-infrared topographic measurement system: Imaging of absorbers localized in a scattering medium)」、1996年、レヴュー・オブ・サイエンティフィック・インスツルメント、第67巻、第730〜732頁(Rev. Sci. Instrum.,67,730(1996))に記載されている。隣接する照射及び検出位置間隔を3cmに設定すると、各検出位置から検出された光は、皮膚、頭蓋骨を通過して大脳の情報を有していることが、例えばピィー・ダブル・マコーミック(P.W.McCormic)他による「赤外光の大脳内部の浸透(Intracerebral penetration of infrared light)」,1992年,ジャーナル・オブ・ニューロサージェリ,第76巻,第315〜318頁(J.Neurosurg.,33,315(1992))により報告されている。
【0011】
以上のことから、図11に示す照射及び検出位置の配置で12計測チャンネルを設定すれば、全体として6cm×6cmの領域における大脳の計測が可能となる。この実施例では、簡単のために計測チャンネル数が12の場合を示しているが、格子状に配置する照射位置及び検出位置の数をさらに増加させることにより、計測チャンネルをさらに増加させて計測領域を拡大することも可能である。
【0012】
図9において、それぞれの検出用光ファイバ100−1〜100−5によって検出された光は、検出位置毎に、すなわち各検出位置に対応した検出用光ファイバ毎に独立に5個の光検出器たとえばフォトダイオード11−1〜11−5によって検出される。このフォトダイオードは、高感度な光計測が実現できるアバランシェフォトダイオードであることが望ましい。また、光検出器としては光電子増倍管を用いてもよい。これらのフォトダイオードで光信号が電気信号に変換された後、変調信号の選択的な検出回路、たとえば複数のロックイン増幅器から構成されるロックイン増幅器モジュール12で、照射位置及び波長に対応した変調信号を選択的に検出する。この実施例では、アナログ変調の場合に対応する変調信号検出回路としてのロックイン増幅器を示しているが、デジタル変調を用いた場合、変調信号検出のためにデジタルフィルタもしくはデジタルシグナルプロセッサを用いる。
【0013】
図12は、図9のロックイン増幅器モジュ−ル102の構成を示す。まず、図11においてフォトダイオ−ド11−1によって検出される検出信号について、その変調信号分離の説明を行う。「検出位置1」からは、隣接した「照射位置1」、「照射位置2」、「照射位置3」及び「照射位置4」に照射された光を検出することができ、したがって図24における「計測位置4」、「計測位置6」、「計測位置7」及び「計測位置9」が計測対象位置となる。ここで、「光検出位置1」からフォトダイオード11−1によって検出された光は、「照射位置1」、「照射位置2」、「照射位置3」及び「照射位置4」に照射された各2波長の光に対応する、変調周波数がf(1-a)、f(1-b)、f(2-a)、f(2-b)、f(3-a)、f(3-b)、f(4-a)及びf(4-b)である8個の信号成分を含んでいる。これらの8個の信号成分を含む光信号は8個の増幅器104−1〜104−8を介して8個のロックイン増幅器103−1〜103−8に導入される。8個のロックイン増幅器103−1〜103−8には、それぞれf(1-a)、f(1-b)、f(2-a)、f(2-b)、f(3-a)、f(3-b)、f(4-a)及びf(4-b)の変調周波数信号が参照信号として与えられている。したがって、「照射位置1」に照射された780nm及び830nmの光信号成分はロックイン増幅器103−1及び103−2によって、「照射位置2」に照射された780nm及び830nmの光信号成分はロックイン増幅器103−3及び103−4によって、「照射位置3」に照射された780nm及び830nmの光信号成分はロックイン増幅器103−5及び103−6によって、そして「照射位置4」に照射された780nm及び830nmの光信号成分はロックイン増幅器103−7及び103−8によってそれぞれ選択的に分離してロックイン検出される。
【0014】
「検出位置2」、「検出位置3」、「検出位置4」及び「検出位置5」からそれぞれフォトダイオ−ド101−2〜101−5によって検出される検出信号についても同様にして所望の光信号成分が選択的に分離してロックイン検出される。すなわち、「検出位置2」からフォトダイオ−ド101−2によって検出された光信号は4個の増幅器104−9〜104−12を介して4個のロックイン増幅器103−9〜103−12に導入されて「照射位置1」に照射された780nm及び830nmの光信号成分と「照射位置2」に照射された780nm及び830nmの光信号成分がそれぞれ選択的に分離してロックイン検出され、「検出位置3」からフォトダイオ−ド101−3によって検出された光信号は4個の増幅器104−13〜104−16を介して4個のロックイン増幅器103−13〜103−16に導入されて「照射位置1」に照射された780nm及び830nmの光信号成分と「照射位置3」に照射された780nm及び830nmの光信号がそれぞれ選択的にロックイン検出され、「検出位置4」からフォトダイオ−ド101−4によって検出された光信号は4個の増幅器104−17〜104−20を介して4個のロックイン増幅器103−14〜103−20に導入されて「照射位置3」に照射された780nm及び830nmの光信号成分と「照射位置4」に照射された780nm及び830nmの光信号成分がそれぞれ選択的にロックイン検出され、そして「検出位置5」からフォトダイオ−ド101−5によって検出された光信号は4個の増幅器104−21〜104−24を介して4個のロックイン増幅器103−21〜103−24に導入されて「照射位置2」に照射された780nm及び830nmの光信号成分と「照射位置4」に照射された780nm及び830nmの光成分がそれぞれ選択的にロックイン検出される。
【0015】
なお、図11からわかるように、検出位置が「検出位置2」、「検出位置3」、「検出位置4」及び「検出位置5」である場合の計測対象位置は「計測位置1」及び「計測位置3」、「計測位置2」及び「計測位置5」、「計測位置10」及び「計測位置12」並びに「計測位置8」及び「計測位置11」である。
【0016】
以上のように、波長の数が2で、計測位置の数が12の場合は、計測する信号数は24となるため、ロックイン増幅器モジュール102では合計で24個のロックイン増幅器103−1〜103−24が用いられる。これらのロックイン増幅器103−1〜103−24(チャンネル1〜24)から出力されるアナログ出力信号はサンプルホ−ルド回路モジュ−ル106の対応するチャンネルのサンプルホ−ルド回路によってそれぞれ所定時間積算される。その積算終了後スイッチ(マルチプレクサ)107を順次切り替え、それぞれのサンプルホ−ルド回路に蓄積された信号は例えば12ビットのアナログ/ディジタル変換器(A/D変換器)108によってディジタル信号に変換され、その変換された全チャンネルの信号は計算機109の外部にある記憶装置に記憶される。もちろん、この記憶は計算機109の内部にある記憶装置になされてもよい。
【0017】
サンプルホ−ルド回路モジュ−ル106を用いない場合は、スイッチ107を高速で繰り返し切り替える。その切り替え毎に各チャンネルのアナログ信号をアナログ/ディジタル変換器108によってディジタル信号に変換して、記憶装置110に蓄積し、チャンネルごとに所定の回数取得されたディジタル信号を計算機109によって平均化して、記憶装置110に記憶する。この方式によっても、高周波成分の雑音を低減することができる。
【0018】
計算機109は記憶されているデ−タをもとにして、生体内代謝物質(計測対象物質)である酸化ヘモグロビン及び還元ヘモグロビンの濃度、さらにはこれらのヘモグロビン濃度総量としての全ヘモグロビン濃度を、たとえば特開平9―19408号公報及び前述アツシ・マキ(Atsushi Maki)他による「無侵襲近赤外光トポグラフィによるヒト脳活動の時空間解析(Spatial and temporal analysis of human moter activity using noninvasive NIR topography)」、1995年、メディカルフィジックス、第22巻、第1997〜2005頁(Medical physics,22,1997(1995))に記載されている方法で計算し、情報提示部111においてその計測量又はその変化を示すトポグラフ画像やその時間依存変化を表すグラフを表示することができる。この場合、計測位置間の任意の位置における計測対象物質の計測量又はその変化は、検出位置において得られる信号にもとづいて統計学的処理、具体的にはたとえばスプライン処理と呼ばれる線形補間処理、を計算機109で行うことにより推定される。情報提示部111は被検体の計測領域のトポグラフ画像やその計測領域内の任意の位置における計測対象物質の計測量又はその変化やその位置情報等を表示する表示装置を含む。情報提示部111は更に、計測領域内の任意の位置における計測対象物質の計測量又はその変化やその位置情報を、表示装置以外の装置、具体的にはたとえば音声出力装置、によりオペレ−タであるデ−タ解析者に提示する手段を含んでいてもよい。
【0019】
図9において、計算機109には操作部112が接続され、該操作部は光計測装置外からその装置内にデ−タを入力するための入力手段を含み、該入力手段はキ−を押すことで記号や数値のような文字情報を入力することができるキ−ボ−ド及びポインティングディバイスを含む。ポインティングデバイスは情報提示部111の表示装置に表示される表示画面内の任意の位置を指定する矢印のようなポインタを表示し、かつその指示された位置をクリックという操作により選択することができるマウスを含む。ポインティングデバイスはマウス以外に、触れるとその触れた部分の選択ができるタッチパネル(タッチスクリ−ン)であってもよい。
【0020】
図1は図9の情報提示部111の表示装置に表示される表示画面の一つの例を示す。同図中の1−1は被検体中の計測対象物質の計測量もしくは計測量の変化を示すトポグラフィ画像1−2を含むウィンドウを示し、1−3はその計測量もしくは計測量の変化を表示するウィンドウを示す。
【0021】
ウィンドウ1−1に表示されるトポグラフ画像1−2は計測領域内において計測対象物質の計測量もしくは計測量変化が等しい点(位置)を結んで作られるマップ状のもので、計測位置間の任意の位置における計測対象物質の計測量又はその変化は、検出位置から得られる信号にもとづいて統計学的処理、具体的にはたとえばスプライン処理と呼ばれる線形補間処理、を計算機109で行うことにより推定して求められる。1−4は、矢印状のマウスポインタであり、該マウスポインタで示される位置はマウスをクリックすることで選択される。個の選択される位置は計測位置に限らず、計測領域内のどこの位置であってもよい。1−5はマウスポインタで示される位置の水平方向及び垂直方向の座標情報を補助的に視覚的に明示する線で、これらの線はポインタ1−4と連動して移動する。これらの線の種類は、実線、点線、又は破線のように任意であってよい。計測量、計測量の変化又はその時間情報、位置情報を表示するウィンドウ1−3は、常に表示されていてもよいし、マウスポインタ1−4をクリックしたときのみ表示されてもかまわない。また、マウスポインタ1−4は、他のペン状の形状をしたポインティング素子であってもかまわない。
【0022】
計測量、計測量の変化又はその時間情報、位置情報を表示するウィンドウ1−3の中には表示させたいデータの種類を示す文字列1−6及び各計測量又は計測量変化を表示する数値1−7が表示される。図1には、酸化ヘモグロビン及び還元ヘモグロビンという2種類の計測量を表示することが可能で、図1はそれぞれの値が10及び20である場合を示している。mM・mmとは血液量に関する単位である。
【0023】
図1に示した例では、評価したい場所において、酸化ヘモグロビンと還元ヘモグロビンに代表される2種類の計測対象物質の計測量又は計測量変化を表示するようにしているが、この代わりに、1種類又は3種類以上の計測対象物質の計測量又は計測量変化を表示させるようにしてもよい。
【0024】
図1に示した2枚のウィンドウ1−1と1−3は、お互いに重なり合わない様に上下もしくは左右に表示することで、デ−タ処理者が視覚的に容易に情報を得ることが可能になる。また、これらの2枚のウィンドウを1枚に集約してもよい。すなわち、2枚のウィンドウの一方は、他方を兼ね備えるようにしてもよい。また、広い計測領域を高分解能で表示させる場合など、図1のウィンドウ2が大きくならざるを得ない場合は、データ処理者の指示により、ウィンドウ1−1と1−3を切り替えて表示させるようにしてもい。更に、ウィンドウ1−3は、ポインタ1−4の指示位置、又はその脇に表示するようにしてもよい。
【0025】
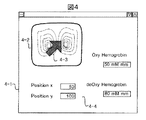
図2は図9の情報提示部111の表示装置に表示される表示画面のもう一つの例を示す。ウィンドウ2−1の表示画面上に、水平方向及び垂直方向の線2−2の交点(交差位置:ポインタ)の水平方向位置と垂直方向位置を読み取る定規2−3が設けられている。二つの線2−2の移動制御(2つの線2−2の交点の移動制御)は、計測量、計測量の変化又はその位置情報を表示するウィンドウ2−4に示される表示画面上で、その確認をウィンドウ2−1で確認しながら行うことができる。2−5は2つの線2−2の水平方向及び垂直方向への移動の制御に使用する4つのボタンであり、これらの4つのボタン2−5のうちの任意のボタンを押すべく、該ボタンをポインタ2−6で指示し、マウスをクリックすることで、2つの線2−2、したがってその交点の移動が任意に制御される。2−7は2つの線2−2の交点の水平方向(X)及び垂直方向(Y)の座標情報メッセージ表示領域で、ボタン2−5の押下によって定まる。2つの線2−2の交点の座標情報は座標情報表示領域2−8に表示される。
【0026】
ボタン2−5を押すことにより、2つの線2−2がそれに対応してそれぞれあらたな位置へ移動するのに同期して、表示領域2−8に表示される2つの線2−2の交点の座標位置の値も変わる。2つの線2−2の交点がデータ解析者の所望している座標へ到達したとき、データ解析者は処理開始の意志確認ボタン2−9を入力手段(例えば、ポインティングデバイス、キーボード)により押下する。これにより、処理が開始され、計測量又は計測量の変化の表示領域2−9に表示したい計測対象物質の計測量又は計測量変化が表示される。
【0027】
2つの線を移動するために、ボタン2−5を押下する代わりに、キーボード上にあるボタン2−5と同様の表示がされているキーを押下することによって、2つの線2−2の移動制御を行うようにしてもよい。また、2つのウィンドウ2−1と2−4は図2中では互いに分離しているが、これらが重なるように配置してもよい。
【0028】
図3は計測領域の位置指定の方法に関わる別の実施例を示す。この実施例では、被検体上でのその計測領域中の位置を指定し選択するものである。図3の実施例は、簡略化したモデルで示されている。光導波手段としての光ファイバ3−1は圧電素子で作られたセンサー3−2を貫通し、被検体3−3に接触している。光ファイバ3−1は図3中では2本示されているが、そのうちのの1本は図9の照射用光ファイバ98−1〜4のうちの任意のものに対応し、残りの一つは図9の検出用光ファイバ100−1〜5のうちの任意のものに対応している。また、被検体3−3は図9の被検体99に対応している。センサー3−2は被検体3−3の上部に接触又は非接触の状態で存在し、図9の計算機109に接続されている。指示手段3−4により、被検体3−3の計測領域内の任意の位置を指定すると、その位置信号はセンサー3−2によって受信され、計算機109に電送される。指示手段3−4はペンであってもよいし、あるいは指であってもかまわない。
【0029】
図4は図9の情報表示部111の表示装置に表示される表示画面の更にもう一つの例を示す。所望のデータを表示し、サイズを任意に変化させることが可能なウィンドウ4−1の中に、被検体の計測領域に関わるトポグラフ画像4−2が表示されている。4−3はポインティング手段である。このポインティング手段4−3は、図3に示した実施例のポインティングデバイスと連動していてもよい。このポインタで指示された位置の水平方向及び垂直方向の値が表示領域4−4に表示され、この位置における、計測対象物質の計測量又は計測量変化(具体的には、酸化ヘモグロビン、還元ヘモグロビン、総ヘモグロビン)が表示領域4−4に示される。
【0030】
図5は図9の情報表示部111の表示装置に表示される表示画面の別の例を示す。ウィンドウ5−1にはトポグラフ画像5−2が表示される。これは、ある計測時間における計測量の平均値を表示した静的なトポグラフ画像であってもよいし、計測対象物質の計測量又は計測量変化の時間依存性を示す動画であってもよい。このトポグラフ画像5−2の任意の位置をマウスポインタを用いて指定すると、その指定された位置における計測対象物質の計測量又は計測量変化の時間依存性を示すグラフ、具体的には酸化ヘモグロビン、還元ヘモグロビンの時間依存性を示すグラフ5−3がウィンドウ5−4に表示される。5−5は時刻表示バーであり、トポグラフ画像が動画である場合、その動画の再生時刻と同期して時間軸方向へ移動する。各時間位置での計測対象物質の計測量又は計測量変化は、その変化量として縦軸の目盛りから定量的に把握することが出来る。5−6は表示領域であり、時刻表示バー5−5が示す時刻が数値として示される。
【0031】
また、マウスポインタで時刻表示バー5−5を指定し、そのバーを任意の時刻へ移動させることで、動画を再生する時間軸方向を正及び負の双方とすることも可能である。
【0032】
以上により、計測対象物質の計測量又は計測量変化の時間依存性を定量的に詳細に評価することが可能となる。
【0033】
計測領域内の1つの位置における計測対象物質の計測量又は計測量変化の時間依存性をグラフ表示する代わりに、マウスポインタを用いて複数の位置を選択し、その複数位置における計測対象物質の計測量又は計測量変化の時間依存性をグラフ表示してもよい。これによれば、計測対象物質の計測量又は計測量変化を示す動画とその中の特定の複数位置における計測対象物質の計測量又は計測量変化の時間依存性を同時に観測することが可能となり、被検体から得られる豊富な物理情報データを解析者が明確に把握することが可能となる。
【0034】
図6は図9の情報提示部111の表示装置に表示される表示画面の更に別の例を示す。これは、ポインタ6−1で選択した位置における計測対象物質の計測量又は計測量変化の提示形式を選択することを可能としたものである。すなわち、ウィンドウ6−2の提示形式選択ボタン6−3を選択的に押すことにより、計測量又は計測量変化を画面に表示させたり、ファイルに収納したり、あるいは音声でオペレータに知らせたりすることができる。もちろん、インターネットで代表される通信回線を通して他の計測制御装置や計算機へ出力し得るように、印字手段としてのプリンタにより出力するようにしてもよい。計測量又は計測量変化を画面上に表示したい場合は、それを表示領域へ表示する(図1、2、4参照)。計測量又は計測量変化を音声形式で出力する場合は、音量調節部6−4のカーソルを移動させるか又は両端にあるボタンを押すことにより、出力される音声の音量を調節することができる。計測量又は計測量変化をファイル形式で出力する場合は、ファイル名をファイル名表示領域6−5にて指定する。また、その出力形式については、出力形式選択部6−6においてボタン操作によりテキスト形式やバイナリ形式を選択することも可能である。また、この他の出力形式として圧縮ファイル形式が挙げられる。
【0035】
図7は図9の情報提示部111の表示装置に表示される表示画面の更に他の例を示す。これは、計測領域内の一次元領域における計測対象物質の計測量又は計測量変化を表示するものである。計測対象物質の計測量又は計測量変化を示すトポグラフ画像7−1上に、マウスに代表されるポインティングデバイス7−2を用いて一次元状の線7−3を描く。図中では直線であるが曲線であってもかまわない。この直線上の位置における計測対象物質の計測量又は計測量変化を別のウィンドウ7−4上にグラフ7−5として表示する。縦軸は計測対象物質の計測量又は計測量変化(一例として、ヘモグロビン濃度変化)を、横軸は一次元状の線7−3の位置情報を示している。本方法により、一次元状の線7−3の各位置における計測量又は計測量変化量を別の視点から視覚的にとらえることが可能となる。
【0036】
図8は図9の情報表示部111の表示装置に表示される表示画面の他のもう一つの例を示す。これは、ポインタ8−1で指定され選択された位置における計測対象物質の計測量又は計測量変化が最大値や最小値、ゼロ点に代表される特異値に相当する場合に、その情報をウィンドウ8−2の画面に表示するようにしたものである。すなわち、ポインタ8−1で指定され、選択された位置における計測対象物質の計測量又は計測量変化が最大値、最小値、極大値、極小値、ゼロ点又は解析者が指定した所望の値である場合には、ウィンドウ8−2の画面に配置された表示領域8−3の対応するボタンが自動的に押下され、したがってそのボタンの押下状態により、ポインタ8−1で選択された位置における計測対象物質の計測量又は計測量変化が如何なる値の種類であるかを知ることができる。
【0037】
選択された位置での計測量又は計測量変化が如何なる特異値であるかを画面に表示する代わりに、音声のような画面表示以外の方法によりデータ解析者へ伝達してもよい。また、ウィンドウを2枚に分割する代わりに、2枚のウィンドウの情報を1枚のウィンドウ上に表示してもよい。
【0038】
【発明の効果】
本発明によれば、被検体の任意の点における計測対象物質の物理量の評価を可能にすることにより空間分解能の向上を図り、それによって被検体の詳細情報を得ることのできる光計測方法及び装置が提供される。
【図面の簡単な説明】
【図1】図9の情報提示部の表示装置に表示される表示画面の一つの例を示す図。
【図2】図9の情報提示部の表示装置に表示される表示画面のもう一つの例を示す図。
【図3】計測領域の位置指定の別の実施例を示す図。
【図4】図9の情報提示部の表示装置に表示される表示画面の更にもう一つの例を示す図。
【図5】図9の情報提示部の表示装置に表示される表示画面の別の例を示す図。
【図6】図9の情報提示部の表示装置に表示される表示画面の更に別の例を示す図。
【図7】図9の情報提示部の表示装置に表示される表示画面の更に他の例を示す図。
【図8】図9の情報提示部の表示装置に表示される表示画面の他のもう一つの例を示す図。
【図9】本発明が適用される光計測装置のー実施例の主要部の構成を示すブロック図。
【図10】図9の光モジュール内の構成を示すブロック図。
【図11】被検体表面上における、照射位置及び検出位置の幾何学的配置例を示す図。
【図12】図9のロックイン増幅器モジュ−ルの構成を示すブロック図。
【図13】光計測装置の表示部に表示される従来のトポグラフ画像を示す図。
【符号の説明】
1−1:トポグラフ画像を含むウィンドウ、1−2:トポグラフ画像、1−3:計測量又は計測量の変化を表示するウィンドウ、1−4:マウスポインタ、1−5:マウスポインタで示される位置の水平方向及び垂直方向の座標情報を補助的に視覚的に明示する線、1−6:表示させたいデータの種類を示す文字列、1−7:計測量又は計測量変化を表示する数値、2−1:トポグラフ画像を含むウィンドウ、2−2:水平方向及び垂直方向の線、2−3:水平方向位置と垂直方向位置を読み取る定規、2−4:計測量又は計測量の変化及びこの位置情報を表示するウィンドウ、2−5:2つの線2−2の水平方向及び垂直方向への移動の制御に使用する4つのボタン、2−6:ポインタ、2−7:2つの線2−2の交点の水平方向(X)及び垂直方向(Y)の座標情報メッセージ表示領域、2−8:2つの線2−2の交点の座標情報表示領域、2−9:計測量又は計測量の変化の表示領域、3−1:光ファイバ、3−2:圧電素子製センサー、3−3:被検体、3−4:指示手段、4−1:サイズを任意に変化させることが可能なウィンドウ、4−2:トポグラフ画像、4−3:ポインティング手段、4−4:表示領域、5−1:ウィンドウ、5−2:トポグラフ画像、5−3:計測量変化の時間依存性を示すグラフ、5−4:計測量変化の時間依存性を示すグラフを表示するウィンドウ、5−5:時刻表示バー、5−6:表示領域、6−1:ポインタ、6−2:ウィンドウ、6−3:提示形式選択ボタン、6−4:音調調節部、6−5:ファイル名表示領域、6−6:出力形式選択部、7−1:トポグラフィ画像、7−2:ポインティングデバイス、7−3:一次元状の線、7−4:ウィンドウ、7−5:グラフ、8−1:ポインタ、8−2:ウィンドウ、8−3:表示領域、91:光源部、99:被検体、98−1〜4、照射用光ファイバ、100−1〜5:検出用光ファイバ、101−1〜5:フォトダイオ−ド、102:ロックイン増幅モジュ−ル、106:サンプルホ−ルド回路モジュ−ル、107:スイッチ、108:A/D変換器、109:計算機、110:記憶装置、111:情報提示部、112:操作部。[0001]
BACKGROUND OF THE INVENTION
The present invention relates to an optical measurement method and apparatus, and more particularly to an optical measurement method and apparatus suitable for obtaining metabolite information inside a living body.
[0002]
[Prior art]
As a biological measurement method using light, optical topography used for brain function measurement is known (for example, see Japanese Patent Application No. 7-259796 and Japanese Patent Application Laid-Open No. 5-115485). In such optical topography, a living body that is a measurement target (subject) is irradiated with light, and transmitted and scattered light of the living tissue is collected and detected at a position several mm to several cm away from the irradiation position. In general, an optical fiber is used as an optical waveguide means for irradiating a living body with light and detecting light from the living body. The concentration of the light-absorbing substance inside the living body can be obtained from the measured intensity of transmitted and scattered light of the living tissue. Specific examples of the light-absorbing substance include oxygenated hemoglobin and reduced hemoglobin which are metabolites in the living body. When obtaining the concentration of the light absorbing material, the light absorption characteristics of the light absorbing material corresponding to the wavelength of the irradiated light are used. Generally, when measuring a deep part of a living body, light having a wavelength within a range of 650 nm to 1300 nm having high biological permeability is used.
[0003]
FIG. 13 shows a conventional topographic image displayed on the display unit of the biological light measurement device. A
[0004]
[Problems to be solved by the invention]
High spatial resolution is required to obtain detailed information on living tissue. However, at present, the resolution of the biological light measurement device is low, which is several centimeters. That is, when imaging physical quantities of metabolites in the body, image processing is performed by statistical processing called linear interpolation, but values between measurement points are not displayed, and numerical information (quantitative information) is displayed. It is impossible to get. For this reason, it is difficult to obtain detailed information on living tissue.
[0005]
The object of the present invention is to improve the spatial resolution by enabling the measurement amount of the measurement target substance or the change thereof at any position within the measurement region of the subject including the measurement position and the position other than the measurement position. An object of the present invention is to provide an optical measurement method and apparatus suitable for achieving the above.
[0006]
[Means for Solving the Problems]
In the present invention, the measurement target substance in the measurement region of the subject is optically measured. When an arbitrary position in the measurement area is specified, the measurement amount of the measurement object at the specified position, a change in the measurement amount, or any time-dependent information thereof, or information on the specified position Is presented.
[0007]
DETAILED DESCRIPTION OF THE INVENTION
FIG. 9 shows the configuration of the main part of an embodiment of the optical measuring device to which the present invention is applied. In this embodiment, an image of the inside of the cerebrum or the cerebral cortex is obtained by irradiating the subject to be measured, for example, the skin of the head, with light, and detecting the light scattered in the subject and passed through the subject. In the embodiment, the number of measurement channels, that is, the number of measurement positions is 12, and the number of signals to be measured (the number of analog / digital conversion channels) is 24. Of course, the present invention is not limited to the head as a measurement target, and can be implemented for other parts, and other than a living body.
[0008]
The
[0009]
FIG. 10 shows the configuration of the
[0010]
FIG. 11 shows an example of the geometric arrangement of the
[0011]
From the above, if 12 measurement channels are set with the arrangement of the irradiation and detection positions shown in FIG. 11, it is possible to measure the cerebrum in a 6 cm × 6 cm region as a whole. In this embodiment, the case where the number of measurement channels is 12 is shown for the sake of simplicity, but the number of measurement channels is further increased by further increasing the number of irradiation positions and detection positions arranged in a grid pattern. It is also possible to enlarge.
[0012]
In FIG. 9, the light detected by each of the detection optical fibers 100-1 to 100-5 is detected independently for each detection position, that is, for each detection optical fiber corresponding to each detection position. For example, it is detected by the photodiodes 11-1 to 11-5. This photodiode is preferably an avalanche photodiode capable of realizing highly sensitive optical measurement. A photomultiplier tube may be used as the photodetector. After the optical signal is converted into an electrical signal by these photodiodes, the modulation signal is selectively detected by, for example, a lock-in amplifier module 12 composed of a plurality of lock-in amplifiers, and modulated according to the irradiation position and wavelength. Selectively detect signals. In this embodiment, a lock-in amplifier as a modulation signal detection circuit corresponding to the case of analog modulation is shown, but when digital modulation is used, a digital filter or a digital signal processor is used for detection of the modulation signal.
[0013]
FIG. 12 shows the configuration of the lock-in
[0014]
Similarly, the desired light is detected for the detection signals detected by the photodiodes 101-2 to 101-5 from the "detection position 2", "detection position 3", "
[0015]
As can be seen from FIG. 11, the measurement target positions when the detection positions are “detection position 2”, “detection position 3”, “
[0016]
As described above, when the number of wavelengths is 2 and the number of measurement positions is 12, the number of signals to be measured is 24. Therefore, the lock-in
[0017]
When the sample
[0018]
Based on the stored data, the
[0019]
In FIG. 9, an
[0020]
FIG. 1 shows an example of a display screen displayed on the display device of the
[0021]
The topographic image 1-2 displayed in the window 1-1 is a map formed by connecting points (positions) in which the measurement amount or the measurement amount change of the measurement target substance is equal in the measurement region. The amount of measurement of the measurement target substance at the position or its change is estimated by the
[0022]
In the window 1-3 for displaying the measurement amount, change in measurement amount or its time information, and position information, a character string 1-6 indicating the type of data to be displayed and a numerical value for displaying each measurement amount or change in measurement amount 1-7 is displayed. In FIG. 1, two types of measurement quantities, oxyhemoglobin and reduced hemoglobin, can be displayed. FIG. 1 shows a case where the respective values are 10 and 20. mm · mm is a unit related to blood volume.
[0023]
In the example shown in FIG. 1, the measurement amount or the change in the measurement amount of two types of measurement target substances represented by oxyhemoglobin and reduced hemoglobin is displayed at the place to be evaluated. Or you may make it display the measurement amount or measurement amount change of three or more types of measurement object substances.
[0024]
The two windows 1-1 and 1-3 shown in FIG. 1 are displayed vertically or horizontally so as not to overlap each other, so that the data processor can easily obtain information visually. It becomes possible. Further, these two windows may be integrated into one. That is, one of the two windows may have the other. Further, when the window 2 in FIG. 1 must be enlarged, such as when displaying a wide measurement area with high resolution, the windows 1-1 and 1-3 are switched and displayed according to the instruction of the data processor. Anyway. Further, the window 1-3 may be displayed at or next to the position indicated by the pointer 1-4.
[0025]
FIG. 2 shows another example of a display screen displayed on the display device of the
[0026]
By pressing the button 2-5, the intersection of the two lines 2-2 displayed in the display area 2-8 in synchronization with the movement of the two lines 2-2 to the new positions. The value of the coordinate position also changes. When the intersection of the two lines 2-2 reaches the coordinates desired by the data analyst, the data analyst presses the processing confirmation check button 2-9 with an input means (for example, a pointing device or a keyboard). . Thereby, the process is started, and the measurement amount or the measurement amount change of the measurement target substance to be displayed is displayed in the display area 2-9 of the measurement amount or the measurement amount change.
[0027]
Instead of pressing the button 2-5 to move the two lines, the two lines 2-2 are moved by pressing a key displayed on the keyboard similar to the button 2-5. Control may be performed. Further, although the two windows 2-1 and 2-4 are separated from each other in FIG. 2, they may be arranged so as to overlap each other.
[0028]
FIG. 3 shows another embodiment relating to the method of specifying the position of the measurement region. In this embodiment, the position in the measurement area on the subject is designated and selected. The embodiment of FIG. 3 is shown in a simplified model. An optical fiber 3-1 as an optical waveguide means passes through a sensor 3-2 made of a piezoelectric element and is in contact with the subject 3-3. Although two optical fibers 3-1 are shown in FIG. 3, one of them corresponds to any one of the irradiation optical fibers 98-1 to 98-4 in FIG. Corresponds to any of the detection optical fibers 100-1 to 100-5 in FIG. In addition, the subject 3-3 corresponds to the subject 99 in FIG. The sensor 3-2 is in contact with or not in contact with the upper portion of the subject 3-3, and is connected to the
[0029]
FIG. 4 shows still another example of the display screen displayed on the display device of the
[0030]
FIG. 5 shows another example of a display screen displayed on the display device of the
[0031]
In addition, by specifying the time display bar 5-5 with the mouse pointer and moving the bar to an arbitrary time, the time axis direction for reproducing the moving image can be both positive and negative.
[0032]
As described above, it is possible to quantitatively evaluate the measurement amount of the measurement target substance or the time dependency of the measurement amount change quantitatively.
[0033]
Instead of displaying the measurement amount of the measurement target substance at one position in the measurement area or the time dependency of the change in measurement quantity in a graph, multiple positions are selected using the mouse pointer and measurement of the measurement target substance at the multiple positions is performed. The time dependency of the amount or the change in the measured amount may be displayed in a graph. According to this, it is possible to simultaneously observe the measurement amount of the measurement target substance or the time dependency of the measurement quantity of the measurement target substance or the change in the measurement quantity at a plurality of specific positions in the video showing the measurement quantity or the measurement quantity change. The analyst can clearly grasp the abundant physical information data obtained from the subject.
[0034]
FIG. 6 shows still another example of the display screen displayed on the display device of the
[0035]
FIG. 7 shows still another example of the display screen displayed on the display device of the
[0036]
FIG. 8 shows another example of the display screen displayed on the display device of the
[0037]
Instead of displaying the singular value of the measured amount or the measured amount change at the selected position, it may be transmitted to the data analyst by a method other than the screen display such as voice. Further, instead of dividing the window into two sheets, the information of the two windows may be displayed on one window.
[0038]
【The invention's effect】
According to the present invention, an optical measurement method and apparatus capable of improving spatial resolution by enabling evaluation of a physical quantity of a measurement target substance at an arbitrary point of a subject, thereby obtaining detailed information of the subject. Is provided.
[Brief description of the drawings]
FIG. 1 is a diagram showing an example of a display screen displayed on a display device of an information presentation unit in FIG.
FIG. 2 is a diagram showing another example of a display screen displayed on the display device of the information presentation unit in FIG. 9;
FIG. 3 is a diagram showing another example of specifying the position of a measurement region.
4 is a diagram showing still another example of a display screen displayed on the display device of the information presentation unit in FIG. 9;
FIG. 5 is a diagram showing another example of a display screen displayed on the display device of the information presentation unit in FIG. 9;
6 is a diagram showing still another example of a display screen displayed on the display device of the information presentation unit in FIG. 9;
7 is a diagram showing still another example of a display screen displayed on the display device of the information presentation unit in FIG. 9;
8 is a diagram showing another example of a display screen displayed on the display device of the information presentation unit in FIG. 9;
FIG. 9 is a block diagram showing a configuration of a main part of an embodiment of an optical measuring device to which the present invention is applied.
10 is a block diagram showing a configuration in the optical module of FIG. 9;
FIG. 11 is a diagram showing an example of a geometric arrangement of irradiation positions and detection positions on the subject surface.
12 is a block diagram showing a configuration of the lock-in amplifier module of FIG. 9;
FIG. 13 is a diagram showing a conventional topographic image displayed on the display unit of the optical measurement device.
[Explanation of symbols]
1-1: a window including a topographic image, 1-2: a topographic image, 1-3: a window for displaying a measurement amount or a change in the measurement amount, 1-4: a mouse pointer, 1-5: a position indicated by the mouse pointer A line for visually and visually indicating coordinate information in the horizontal and vertical directions, 1-6: a character string indicating the type of data to be displayed, 1-7: a numerical value for displaying a measurement amount or a measurement amount change, 2-1: Window containing topographic image, 2-2: Horizontal and vertical lines, 2-3: Ruler for reading horizontal position and vertical position, 2-4: Measurement amount or change in measurement amount and this Window for displaying position information, 2-5: four buttons used to control movement of the two lines 2-2 in the horizontal direction and the vertical direction, 2-6: pointer, 2-7: two lines 2- Horizontal direction (X) of the intersection of 2 and Coordinate information message display area in the vertical direction (Y), 2-8: Coordinate information display area at the intersection of two lines 2-2, 2-9: Display area of measurement amount or change in measurement quantity, 3-1: Light Fiber, 3-2: Sensor made of piezoelectric element, 3-3: Subject, 3-4: Instruction means, 4-1: Window whose size can be arbitrarily changed, 4-2: Topographic image, 4- 3: Pointing means, 4-4: Display area, 5-1: Window, 5-2: Topograph image, 5-3: Graph showing time dependency of change in measurement amount, 5-4: Time dependency of change in measurement amount 5-5: time display bar, 5-6: display area, 6-1: pointer, 6-2: window, 6-3: presentation format selection button, 6-4: tone Adjustment unit, 6-5: file name display area, 6-6: output format Selection unit, 7-1: topography image, 7-2: pointing device, 7-3: one-dimensional line, 7-4: window, 7-5: graph, 8-1: pointer, 8-2: window 8-3: Display area, 91: Light source unit, 99: Subject, 98-1 to 4, Irradiation optical fiber, 100-1 to 5: Detection optical fiber, 101-1 to 5: Photodiode 102: Lock-in amplification module 106: Sample hold circuit module 107: Switch 108: A / D converter 109: Computer 110: Storage device 111: Information presentation unit 112 Operation part.
Claims (2)
前記計測領域内の照射位置から照射した光を検出位置で検出し、計測位置における計測対象物質の計測量を求める計測部と、
該計測量もしくは該計測量の変化が等しい点(位置)を結んだマップ状の画像を表示する第1のウィンドウと、
該第1のウィンドウ上の任意の位置を指示するポインティングデバイスと、
指示した場所における計測対象物質の計測量若しくは計測変化が、最大値、最小値、極大値、極小値、のいずれかであればその旨を指示する第2のウィンドウを有することを特徴とする光計測装置。An optical measurement device that optically measures a measurement target substance in a measurement region of a subject,
A measurement unit for detecting light emitted from an irradiation position in the measurement region at a detection position and obtaining a measurement amount of a measurement target substance at the measurement position;
A first window for displaying a map-like image connecting the measurement amounts or points (positions) at which changes in the measurement amounts are equal;
A pointing device for indicating an arbitrary position on the first window;
A light having a second window for instructing if the measurement amount or measurement change of the measurement target substance at the instructed location is one of a maximum value, a minimum value, a maximum value, and a minimum value Measuring device.
前記計測領域内の照射位置から照射した光を検出位置で検出し、計測位置における計測対象物質の計測量を求める計測部と、
該計測量もしくは該計測量の変化が等しい点(位置)を結んだマップ状の画像を表示するウィンドウと、
該ウィンドウ上の任意の位置を指示するポインティングデバイスと、
指示した場所における計測対象物質の計測量若しくは計測量変化が、最大値、最小値、極大値、極小値、のいずれかであればその旨を音声出力する音声出力部を有することを特徴とする光計測装置。An optical measurement device that optically measures a measurement target substance in a measurement region of a subject,
A measurement unit for detecting light emitted from an irradiation position in the measurement region at a detection position and obtaining a measurement amount of a measurement target substance at the measurement position;
A window for displaying a map-like image connecting the measurement amounts or points (positions) at which the changes in the measurement amounts are equal;
A pointing device for indicating an arbitrary position on the window;
If the measured amount or measured amount change of the measurement target substance at the designated location is one of the maximum value, the minimum value, the maximum value, and the minimum value, it has an audio output unit that outputs a sound to that effect Optical measuring device.
Priority Applications (5)
| Application Number | Priority Date | Filing Date | Title |
|---|---|---|---|
| JP34729998A JP3977947B2 (en) | 1998-12-07 | 1998-12-07 | Optical measurement method and apparatus |
| EP99973326A EP1154257B1 (en) | 1998-12-07 | 1999-12-01 | Optical measurement device |
| DE69934144T DE69934144T2 (en) | 1998-12-07 | 1999-12-01 | OPTICAL MEASURING DEVICE |
| PCT/JP1999/006749 WO2000034761A1 (en) | 1998-12-07 | 1999-12-01 | Optical measurement device |
| US09/873,206 US6947779B2 (en) | 1998-12-07 | 2001-06-05 | Optical measurement device |
Applications Claiming Priority (1)
| Application Number | Priority Date | Filing Date | Title |
|---|---|---|---|
| JP34729998A JP3977947B2 (en) | 1998-12-07 | 1998-12-07 | Optical measurement method and apparatus |
Publications (3)
| Publication Number | Publication Date |
|---|---|
| JP2000171390A JP2000171390A (en) | 2000-06-23 |
| JP2000171390A5 JP2000171390A5 (en) | 2005-07-14 |
| JP3977947B2 true JP3977947B2 (en) | 2007-09-19 |
Family
ID=35134339
Family Applications (1)
| Application Number | Title | Priority Date | Filing Date |
|---|---|---|---|
| JP34729998A Expired - Fee Related JP3977947B2 (en) | 1998-12-07 | 1998-12-07 | Optical measurement method and apparatus |
Country Status (5)
| Country | Link |
|---|---|
| US (1) | US6947779B2 (en) |
| EP (1) | EP1154257B1 (en) |
| JP (1) | JP3977947B2 (en) |
| DE (1) | DE69934144T2 (en) |
| WO (1) | WO2000034761A1 (en) |
Families Citing this family (14)
| Publication number | Priority date | Publication date | Assignee | Title |
|---|---|---|---|---|
| JP4076003B2 (en) * | 1999-02-19 | 2008-04-16 | 株式会社日立製作所 | Biological light measurement device |
| US20050216456A1 (en) * | 2001-08-10 | 2005-09-29 | T-Systemev, Ltd. | Method for entering, recording, distributing and reporting data |
| JP3999214B2 (en) * | 2004-03-31 | 2007-10-31 | ジーイー・メディカル・システムズ・グローバル・テクノロジー・カンパニー・エルエルシー | MEDICAL INFORMATION DISPLAY METHOD, DEVICE, AND PROGRAM |
| JP4541859B2 (en) * | 2004-12-08 | 2010-09-08 | サムスン・デジタル・イメージング・カンパニー・リミテッド | Camera and luminance distribution display method |
| JP4513620B2 (en) * | 2005-03-23 | 2010-07-28 | 富士ゼロックス株式会社 | Information processing apparatus and data presentation method in information processing apparatus |
| JP4817808B2 (en) * | 2005-11-08 | 2011-11-16 | 株式会社日立メディコ | Biological light measurement device |
| JPWO2007135993A1 (en) | 2006-05-23 | 2009-10-01 | 株式会社日立メディコ | Biological light measurement device |
| FR2902307B1 (en) * | 2006-06-14 | 2008-08-29 | Quidd Sas | OPTICAL IMAGING DEVICE |
| JP5019968B2 (en) * | 2007-06-20 | 2012-09-05 | 株式会社日立メディコ | Biological light measurement device |
| JP4618341B2 (en) * | 2008-06-26 | 2011-01-26 | ソニー株式会社 | A method for measuring the amount of substances in a living body using coherent anti-Stokes Raman scattering light |
| JP5379615B2 (en) * | 2009-09-09 | 2013-12-25 | パナソニック株式会社 | Lighting device |
| CN104768473A (en) * | 2012-11-08 | 2015-07-08 | 株式会社岛津制作所 | Photobiological measurement device |
| USD763939S1 (en) | 2014-04-02 | 2016-08-16 | Cephalogics, LLC | Optical sensor array liner with optical sensor array pad |
| USD763938S1 (en) | 2014-04-02 | 2016-08-16 | Cephalogics, LLC | Optical sensor array |
Family Cites Families (15)
| Publication number | Priority date | Publication date | Assignee | Title |
|---|---|---|---|---|
| JPS5975785A (en) * | 1982-10-25 | 1984-04-28 | Jeol Ltd | Thermography device |
| JP3112025B2 (en) * | 1990-10-26 | 2000-11-27 | 株式会社日立製作所 | Biological measurement device |
| JP3375977B2 (en) * | 1991-04-04 | 2003-02-10 | 三菱電機株式会社 | Numerical control unit |
| JPH05115485A (en) | 1991-10-25 | 1993-05-14 | Hitachi Ltd | Optical measuring instrument for living body |
| US5853370A (en) * | 1996-09-13 | 1998-12-29 | Non-Invasive Technology, Inc. | Optical system and method for non-invasive imaging of biological tissue |
| US6397099B1 (en) * | 1992-05-18 | 2002-05-28 | Non-Invasive Technology, Inc. | Non-invasive imaging of biological tissue |
| US5448992A (en) * | 1992-12-10 | 1995-09-12 | Sunshine Medical Instruments, Inc. | Method and apparatus for non-invasive phase sensitive measurement of blood glucose concentration |
| IL119767A (en) * | 1993-08-13 | 1998-02-08 | Sophis View Tech Ltd | System and method for diagnosis of living tissue diseases |
| US5803909A (en) * | 1994-10-06 | 1998-09-08 | Hitachi, Ltd. | Optical system for measuring metabolism in a body and imaging method |
| JP3325145B2 (en) * | 1995-02-20 | 2002-09-17 | 株式会社日立製作所 | Biological light measurement device |
| JP3599426B2 (en) * | 1995-07-05 | 2004-12-08 | 株式会社日立製作所 | Biological light measurement device |
| JPH08154924A (en) * | 1994-12-05 | 1996-06-18 | Konan:Kk | Retinal camera having measuring function |
| US6240309B1 (en) * | 1995-10-06 | 2001-05-29 | Hitachi, Ltd. | Optical measurement instrument for living body |
| JPH0998972A (en) | 1995-10-06 | 1997-04-15 | Hitachi Ltd | Measurement equipment of light from living body and image generation method |
| JP3682793B2 (en) * | 1995-11-30 | 2005-08-10 | 株式会社日立製作所 | Light scattering device internal imaging device |
-
1998
- 1998-12-07 JP JP34729998A patent/JP3977947B2/en not_active Expired - Fee Related
-
1999
- 1999-12-01 DE DE69934144T patent/DE69934144T2/en not_active Expired - Lifetime
- 1999-12-01 EP EP99973326A patent/EP1154257B1/en not_active Expired - Lifetime
- 1999-12-01 WO PCT/JP1999/006749 patent/WO2000034761A1/en active IP Right Grant
-
2001
- 2001-06-05 US US09/873,206 patent/US6947779B2/en not_active Expired - Fee Related
Also Published As
| Publication number | Publication date |
|---|---|
| DE69934144D1 (en) | 2007-01-04 |
| EP1154257B1 (en) | 2006-11-22 |
| US6947779B2 (en) | 2005-09-20 |
| JP2000171390A (en) | 2000-06-23 |
| EP1154257A1 (en) | 2001-11-14 |
| US20020183603A1 (en) | 2002-12-05 |
| EP1154257A4 (en) | 2003-07-09 |
| WO2000034761A1 (en) | 2000-06-15 |
| DE69934144T2 (en) | 2008-02-14 |
Similar Documents
| Publication | Publication Date | Title |
|---|---|---|
| JP4076003B2 (en) | Biological light measurement device | |
| JP3977947B2 (en) | Optical measurement method and apparatus | |
| JP4006826B2 (en) | Biological light measurement device | |
| JP3839202B2 (en) | Biological light measuring device and program for causing this device to function | |
| US9498158B2 (en) | Optical sensor path selection | |
| JP4097522B2 (en) | Biological light measurement device | |
| JP4295296B2 (en) | Biological light measurement device | |
| JP2000116625A (en) | Light measuring method and apparatus | |
| US7725145B2 (en) | Biological photometric device | |
| JP4332534B2 (en) | Biological light measurement device | |
| JP4478724B2 (en) | Optical measuring device | |
| JP4517613B2 (en) | Biological signal processing device | |
| JP2005118594A (en) | Light measuring device | |
| JP4817808B2 (en) | Biological light measurement device | |
| JP4266453B2 (en) | Biological light measurement device | |
| JP2001198112A (en) | Organismic light measuring device | |
| JP2001137217A (en) | Bioluminescence measuring apparatus | |
| JP4230729B2 (en) | Biological light measurement device | |
| JP5484786B2 (en) | Biological light measurement device | |
| JP4480831B2 (en) | Biological light measurement device | |
| JP2005095465A (en) | Biological optical measuring device | |
| JP2003254899A (en) | Biological light measuring apparatus |
Legal Events
| Date | Code | Title | Description |
|---|---|---|---|
| A521 | Request for written amendment filed |
Free format text: JAPANESE INTERMEDIATE CODE: A523 Effective date: 20041111 |
|
| A621 | Written request for application examination |
Free format text: JAPANESE INTERMEDIATE CODE: A621 Effective date: 20041111 |
|
| TRDD | Decision of grant or rejection written | ||
| A01 | Written decision to grant a patent or to grant a registration (utility model) |
Free format text: JAPANESE INTERMEDIATE CODE: A01 Effective date: 20070529 |
|
| A61 | First payment of annual fees (during grant procedure) |
Free format text: JAPANESE INTERMEDIATE CODE: A61 Effective date: 20070622 |
|
| FPAY | Renewal fee payment (event date is renewal date of database) |
Free format text: PAYMENT UNTIL: 20100629 Year of fee payment: 3 |
|
| R150 | Certificate of patent or registration of utility model |
Free format text: JAPANESE INTERMEDIATE CODE: R150 |
|
| FPAY | Renewal fee payment (event date is renewal date of database) |
Free format text: PAYMENT UNTIL: 20100629 Year of fee payment: 3 |
|
| FPAY | Renewal fee payment (event date is renewal date of database) |
Free format text: PAYMENT UNTIL: 20110629 Year of fee payment: 4 |
|
| FPAY | Renewal fee payment (event date is renewal date of database) |
Free format text: PAYMENT UNTIL: 20110629 Year of fee payment: 4 |
|
| FPAY | Renewal fee payment (event date is renewal date of database) |
Free format text: PAYMENT UNTIL: 20120629 Year of fee payment: 5 |
|
| FPAY | Renewal fee payment (event date is renewal date of database) |
Free format text: PAYMENT UNTIL: 20120629 Year of fee payment: 5 |
|
| FPAY | Renewal fee payment (event date is renewal date of database) |
Free format text: PAYMENT UNTIL: 20130629 Year of fee payment: 6 |
|
| LAPS | Cancellation because of no payment of annual fees |