JP3856476B2 - System and method for monitoring the physical condition of livestock - Google Patents
System and method for monitoring the physical condition of livestock Download PDFInfo
- Publication number
- JP3856476B2 JP3856476B2 JP50109098A JP50109098A JP3856476B2 JP 3856476 B2 JP3856476 B2 JP 3856476B2 JP 50109098 A JP50109098 A JP 50109098A JP 50109098 A JP50109098 A JP 50109098A JP 3856476 B2 JP3856476 B2 JP 3856476B2
- Authority
- JP
- Japan
- Prior art keywords
- value
- measured
- error
- conductivity
- animal
- Prior art date
- Legal status (The legal status is an assumption and is not a legal conclusion. Google has not performed a legal analysis and makes no representation as to the accuracy of the status listed.)
- Expired - Fee Related
Links
- 238000000034 method Methods 0.000 title claims description 30
- 238000012544 monitoring process Methods 0.000 title claims description 16
- 244000144972 livestock Species 0.000 title claims description 3
- 241001465754 Metazoa Species 0.000 claims description 81
- 239000008267 milk Substances 0.000 claims description 45
- 235000013336 milk Nutrition 0.000 claims description 45
- 210000004080 milk Anatomy 0.000 claims description 45
- 238000005259 measurement Methods 0.000 claims description 43
- 230000007246 mechanism Effects 0.000 claims description 25
- 238000012545 processing Methods 0.000 claims description 19
- 244000144980 herd Species 0.000 claims description 15
- 210000002445 nipple Anatomy 0.000 claims description 9
- 235000021050 feed intake Nutrition 0.000 claims description 4
- 230000004044 response Effects 0.000 claims description 4
- 230000005540 biological transmission Effects 0.000 claims description 2
- 230000003213 activating effect Effects 0.000 claims 1
- 241000283690 Bos taurus Species 0.000 description 47
- 230000000694 effects Effects 0.000 description 18
- 210000000481 breast Anatomy 0.000 description 15
- 235000021190 leftovers Nutrition 0.000 description 12
- 235000013365 dairy product Nutrition 0.000 description 11
- 230000006651 lactation Effects 0.000 description 10
- 239000011159 matrix material Substances 0.000 description 7
- 230000035945 sensitivity Effects 0.000 description 6
- 201000010099 disease Diseases 0.000 description 5
- 208000037265 diseases, disorders, signs and symptoms Diseases 0.000 description 5
- 206010037660 Pyrexia Diseases 0.000 description 4
- 238000004364 calculation method Methods 0.000 description 4
- 230000006399 behavior Effects 0.000 description 3
- 238000010586 diagram Methods 0.000 description 3
- 238000002474 experimental method Methods 0.000 description 3
- 208000004396 mastitis Diseases 0.000 description 3
- 230000002411 adverse Effects 0.000 description 2
- 230000008901 benefit Effects 0.000 description 2
- 239000012141 concentrate Substances 0.000 description 2
- 230000001419 dependent effect Effects 0.000 description 2
- 244000309465 heifer Species 0.000 description 2
- 238000010606 normalization Methods 0.000 description 2
- 241000283707 Capra Species 0.000 description 1
- 238000013459 approach Methods 0.000 description 1
- 238000009529 body temperature measurement Methods 0.000 description 1
- 238000004422 calculation algorithm Methods 0.000 description 1
- 230000008859 change Effects 0.000 description 1
- 230000012173 estrus Effects 0.000 description 1
- 230000006872 improvement Effects 0.000 description 1
- 238000011835 investigation Methods 0.000 description 1
- 230000001788 irregular Effects 0.000 description 1
- 230000007257 malfunction Effects 0.000 description 1
- YHXISWVBGDMDLQ-UHFFFAOYSA-N moclobemide Chemical compound C1=CC(Cl)=CC=C1C(=O)NCCN1CCOCC1 YHXISWVBGDMDLQ-UHFFFAOYSA-N 0.000 description 1
- 230000002093 peripheral effect Effects 0.000 description 1
- 230000000069 prophylactic effect Effects 0.000 description 1
- 238000011084 recovery Methods 0.000 description 1
- 230000028327 secretion Effects 0.000 description 1
- 238000004904 shortening Methods 0.000 description 1
- 238000004088 simulation Methods 0.000 description 1
- 238000012731 temporal analysis Methods 0.000 description 1
- 230000002123 temporal effect Effects 0.000 description 1
- 238000000700 time series analysis Methods 0.000 description 1
- 230000001052 transient effect Effects 0.000 description 1
- 238000011144 upstream manufacturing Methods 0.000 description 1
- 230000000007 visual effect Effects 0.000 description 1
Images
Classifications
-
- A—HUMAN NECESSITIES
- A01—AGRICULTURE; FORESTRY; ANIMAL HUSBANDRY; HUNTING; TRAPPING; FISHING
- A01K—ANIMAL HUSBANDRY; AVICULTURE; APICULTURE; PISCICULTURE; FISHING; REARING OR BREEDING ANIMALS, NOT OTHERWISE PROVIDED FOR; NEW BREEDS OF ANIMALS
- A01K29/00—Other apparatus for animal husbandry
Landscapes
- Life Sciences & Earth Sciences (AREA)
- Environmental Sciences (AREA)
- Animal Husbandry (AREA)
- Biodiversity & Conservation Biology (AREA)
- Management, Administration, Business Operations System, And Electronic Commerce (AREA)
- Investigating Or Analysing Biological Materials (AREA)
- Investigating Or Analyzing Materials By The Use Of Electric Means (AREA)
- Testing Or Calibration Of Command Recording Devices (AREA)
Description
技術分野
本発明は家畜群の身体的状態を自動的にモニターするためのシステムとその装置に関する。家畜群の身体的状態の自動的モニターは、発熱しているかまたは病気にかかっているらしい動物を適宜な時に識別することによって、生産性の増大に寄与する。特に酪農場においては、群れの大きさが益々増大しそして自動搾乳システムが普及した結果、酪農家が視覚的な観察によりこのような動物を識別するのは困難でありまた厄介でもあるからである。
背景技術
『酪農科学ジャーナル、73;539−54B号』におけるデライカー他著の『時系列分析を用いたホルスタイン牛の1日当たりの乳収量模擬実験』には、家畜群の身体的状態を自動的にモニターするための実験的方法が示されているが、それには、個々の識別された各動物より得られた1つの性質の値を一定の間隔で測定する段階と、この個々の識別された各動物における測定された性質の測定値にしたがって測定データを格納する段階と、この個々の識別された各動物に関する格納された測定データからこの個々の識別された各動物に関するこの性質の次回測定値の予測値を決定する段階と、測定された性質の値とこの値の予測値との誤差が予め定められたレベルを越えた場合に応じて注意信号を生成する段階とが含まれる。
この実験的方法において、測定される性質は乳の収量である。
こうした測定を実施するために、自動的乳牛識別・乳収量記録システムが用いられた。
観察期間の後に、それぞれが一般的に未経産雌牛または経産雌牛における泌乳期の特定期間に適用される幾つかのパラメータセットと共に各搾乳ごとの乳収量または連続する3回の搾乳を1セットする乳収量を予測するために、時系列モデルが定式化された。
上述の方法の欠点は、各乳牛ごとに適宜なパラメータセットを選択しなければならないという点がわずらわしいことである。これはまた、誤差を生む原因になりかねない。更に、こうして決定されたパラメータが、他の種類の雌牛の群れや、他の動物(例えば、山羊)の群れにさえも適用でき、また異なる気候や異なる種類の飼料で飼われている群れにも適用できるとは、とても思われない。
本発明の要約
本発明の目的は、デライカーその他によって提案されたモデルよりも普遍的に適用することができる、動物の群れの身体的状態を自動的にモニターするための信頼性の高いシステムとその方法とを供することである。
本発明にしたがえば、この目的は請求の範囲第1項に記載されているシステムと、第5項に記載されている方法を供することによって達成される。
本発明による方法そして、作動中では本発明によるシステムにおいては、牛乳の分泌(以下泌乳と称す)期間中、個々の識別された各動物に対する予測値とこれに対応する測定値とに応じて誤差データが格納され、そして誤差の分布の特徴を表すこの誤差データから、個々の識別された各動物に関しそしてこの同じ泌乳期における予測に関する信頼区間が決定され、この方法は自動的に、各泌乳期中に収集されたデータから個々に各動物に関する予測値と測定値との誤差の有意性を評価するからである。この信頼区間は個々の各測定および個々の各動物に対して自動的に決定することができ、したがって様々な泌乳期に対して、様々な動物の種類に対してそしてまた測定される様々な性質に対してそれぞれ異なる信頼値帯域を入力する必要はない。更に、このような信頼値帯域を得るために別の調査を行う必要もない。
誤差の有意性は個別的に各動物について評価されるので、時系列モデルのパラメータを選択する際に誤差による信頼できない予測値においては、たとえ適用されたとしても、その悪影響は小さくなる。個々の各動物およびモニターされた各変数について、信頼値帯域の幅は、時系列モデルの適合性の経験的に見出された正確度にオンラインで自動的に調整され、そしてこの予測値の信頼性を指示するために個別的にその信号を送ることができる。
測定される性質は例えば以下のような幾つかの性質、すなわち乳収量、乳温度、乳の伝導率、動物の活動性および少なくとも1種類の飼料の摂取量のいずれか1つとすることができる。
本発明による方法は予防的なものであり、したがって病気になっていそうな個々の動物をより容易にそしてより高い信頼度で識別することができるという点において生産性を向上させる効果がある。先ず、獣医の診断を受けるべき動物が早く識別できればできるほど、病気回復の機会が増し動物への悪影響を回避でき、そして伝染病が群れに蔓延することを妨げることが可能になる。次に、身体的状態が悪い動物はそのために病気になり易く、または既に病気であっても、より病状が悪化し易い。こうした動物が早く識別できればできるほど、その動物の身体的状態を改善しそしてこの識別された動物が病気になったりあるいは別の病気にかかったりするのを防止する措置を早急にこうじることが可能になる。
生産性の向上効果はまた、より早く発情期を検知し、その結果出産間隔を短縮することが可能になることによっても達成できる。
本発明によるこの方法の特定の1実施様態によれば、幾つかの異なる乳頭(動物が雌牛ならば乳房区)から得られた乳の伝導率の予測値における誤差間の相互依存性の特徴を示すめに誤差データが用いられる。したがって、この依存性に関するデータは、乳頭のいずれか1つから得られる乳の伝導率の予測値における誤差の有意性を評価するためにも用いられる。
本発明をもう1つの特定の1実施様態によれば、泌乳期中に収集された誤差データもまた、この同じ泌乳期中に個別的に測定される各動物についての測定値の予測値を予告する時系列モデルのパラメータを予想するために用いられる。このようにして、個々の各動物に対して時系列モデルは、泌乳期が進むにしたがってその個々の動物の各性質の時間的変化の諸特性に最適に適合するように、自動的に調整される。
本発明の特定の特徴および利点は、添付の請求の範囲と、以下の図面を参照しながら下記になされる詳細な説明とに示されている。
【図面の簡単な説明】
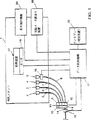
図1は、本発明の1実施例によるシステムの概略図であり、そして
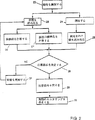
図2は、本発明による方法の1実施様態の流れ図である。
本発明の幾つかの実施様態
図1および2によって表されているシステムと方法とは、本発明の最も好ましい実施様態を示している。以後、この方法とこのシステムは雌牛の群れをモニターするという文脈で記述されるが、原則として本発明は、少なくとも個々の各動物の1つの性質が一定の間隔で測定されるという条件の下で、他の動物をモニターするためにも用いることが可能である。
図1に示されているシステムは、1頭ずつ個々の乳牛を搾乳するための搾乳スタンド1と一体になっている。この搾乳スタンドには更に、乳牛から乳を搾り取るために乳牛に連結される、4個の吸引カップ2〜5を備えた搾乳装置が含まれている。乳導管5〜8はその上流端において吸引カップ2〜5に連結されそしてその下流端において伝導率センサ9〜12に連結されている。この伝導率センサ9〜12は伝導率測定ユニット13の一部である。この伝導率測定ユニット13において、乳導管5〜8は伝導率センサ9〜12から下流では、乳収量を測定するための流量計15を通る1本の乳導管14に合流する。
吸引カップ5と伝導率測定ユニット13との間において、温度測定に対する周囲温度の影響を低くするために、乳導管の1本8が、吸引カップ5のすぐ隣に取り付けられている温度センサ16を通過している。
搾乳スタンドには更に、搾乳された各乳牛に1回分の濃厚飼料を供給するための給餌装置17が備えられている。その代わりに、給餌装置が搾乳エリアの外に位置する給餌ステーションに設置されていてもよい。給餌装置17は、飼料が予め定められた1回分だけ消費されるまで乳牛が食べるままに、飼料を供給するようになっている。この給餌装置17にはその外、各乳牛に供給される飼料の量をモニターするためのセンサ18が含まれている。1頭の乳牛が給餌装置を離れるとき、もし1回分の飼料が全て消費されていなければ、1回分の各飼料の食べ残し重量が計算される。
群れの各乳牛は、当該の乳牛の活動パターンに関連する値またはこのパターンに一致する値を記録する活動メータ(図示されていない)を設置される。この活動メータからの数値を読み取るために、搾乳スタンドは、搾乳されているか、または搾乳される予定であるか、または既に搾乳された各乳牛の活動メータより記録された数値を読み取るための活動メータ読取り装置19を備えている。
群れの各乳牛は更に、識別タッグ(図示されていない)を備えられている。搾乳スタンド1には、搾乳されているか、または搾乳される予定であるか、または既に搾乳された各乳牛の識別タッグを読み取るように設計されている乳牛識別機構20が備えられている。動物識別システムと動物の活動をモニターするためのシステムは市販されており、したがって当文書ではこれ以上の説明はされない。
伝導率測定ユニット13、流量計15、温度センサ16および乳牛識別機構20はそれぞれ、各乳牛に関する測定データを処理するための中央データ処理機構21に接続されている。このデータ処理機構21はディスプレー22に接続されている。ディスプレー22に加えてまたはこれの代わりに、音響警報を発する装置を設置することもできる。このような装置は、ネットワーク(例えば、電話回線)でデータ処理機構に専用接続されるか、または遠隔制御される。専門家は、このデータ処理機構に必要な周辺機器も装備されていることを評価するであろう。並列接続の形態でなされているが、センサおよび読取り装置15、16、18、19、20とデータ処理機構21との間の伝達機構もまた、有線または無線のバス構造の形態で実現されており、この構造では各ステーションは個別のアドレスを有する。
データ処理機構21は、個々の識別された各動物に関する測定された性質にしたがって測定データを格納するように、そしてこの個々の識別された各動物に関する格納されたデータからこの個々の識別された各動物の性質の次回測定値の予測値を決定するように、プログラムされている。
更にこのデータ処理機構21は、個々の識別された各動物に対する予測値と測定値とにしたがって誤差データを格納するように、個々の識別された各動物に関する予測誤差の分布の特徴を表すデータを決定するように、測定値の予測における誤差の分布の特徴を表すこのデータから個々の識別された各動物についての予測に関する信頼値帯域を決定するように、そして、測定された性質の値とこの値についての予測値との誤差が信頼値帯域外にあるならば、選択された注意信号を発する発信装置22を活動させるように、プログラムされている。
作動中において、本発明は図2に示されている流れ図のように、以下の説明にしたがって実施される。この流れ図にしたがったアルゴリズムは、それぞれの搾乳ごとに繰り返されることが好ましい。
個々の各乳牛の搾乳ごとに、段階23に示されているように、識別タッグが読み取られ、それぞれの乳牛を識別する。
次に、段階24に示されているように、乳収量の値、乳温度、各乳房区から得られた乳の伝導率、活動メータの記録された値(搾乳時または他の時に一定の間隔で読み取ることができる)、そして食べられたまたは食べ残された濃厚飼料の量が測定される。これらの測定は、各搾乳ごとにそして個々の識別された各動物に対して、すなわち一定の間隔で行われる。測定された値は、段階25に示されているように、データ処理機構21によって読み取られる。
測定される次回の各値に対する予測値を決定し、そして以前の予測値の誤差分布の特徴を表す状況データが、より早期の測定値および予測値に基づいて、または値およびパラメータの初期セットとして泌乳期の最初の搾乳時に、個々の識別された各動物にごとにデータ処理機構21の記憶装置に格納されている。段階25において、識別されたそれぞれの乳牛のこうした状況がデータ処理機構21により読み取られる。
段階26によって示されているように、読み取られた状況データより、段階24によって測定される値の予測がなされる。更に誤差データ−より早期の予測値と測定値の分散または共分散の形態で入手できる−に基づいて、段階27に示されているように、予測値と測定値との各セットについて分散−共分散行列が決定される。こうした誤差標準化データによって現行の予測値と測定値との誤差を標準化することができる。
飼料の摂取については異なるアプローチが好ましく、食べ残しはほとんどゼロに等しくそして時々より多くなる。実験によって得られたデータによれば、継続的な食べ残しは独立しており、そして個々の各動物における濃厚飼料の1回分の食べ残しの百分率に関してはそれぞれ独自の確率分布が存在することが、示唆されており、それは以下のように定義されることが好ましい。すなわち、
p0=P(食べ残し=0%)
p1=P(0%<食べ残し<10%)
p2=P(10%<食べ残し<30%)
p3=P(30%<食べ残し<50%)
p4=P(50%<食べ残し<100%)
この分布は濃縮飼料消費の様々な水準の確率pconcを計算するために用いることができる。確率pconcが低ければ、注意信号が発せられるか、または少なくとも特殊な状態が発見される助けになる。様々な範囲の食べ残し量の確率の乳牛依存分布は、下記に説明されるカルマンフィルタ計算法を用いて、各乳牛の食べ残しを測定するように適合されている。
異なる搾乳(例えば、朝方と夕方の搾乳)間の構造的な相違を除去する目的で、計算は毎日、2回以上の継続的搾乳の組み合わされた予測値と組み合わされた測定値に基づいてなされることが好ましい。
標準化データは全ての予測値の誤差に関して決定されているので、信頼値帯域の幅が感度と特定性との所望の平衡にしたがって正確に決定されることが可能である、単一の信頼値帯域内とそして組み合わされた幾つかの信頼値帯域内に、予測値と測定値との誤差が収まっているかどうかを決定することができる。もし少なくとも測定値の1つが信頼値帯域外にあれば、あるいは1頭の動物が特定の状態にある徴候を示す複数誤差の組合せが生じれば、段階28において注意信号が出されなければならないと決定される。
少なくとも1つの測定値が1つの信頼値帯域外にあれば、標準化の後には、−そして健康な状態にありかつ発熱していない動物に対する誤差は正規分布を示す見なして、−と予め定められた幾つかの信頼値帯域外にあれば、単一の誤差に基づき注意信号が発せられることが好ましい。少なくとも1つの測定値が信頼値帯域の95%の外にあれば、“*”マークを乳牛の識別コードに付けることができ、少なくとも1つの測定値が信頼値帯域の99%の外にあれば、“**”マークを乳牛の識別コードに付け、少なくとも1つの測定値が信頼値帯域の99.99%の外にあれば、“***”マークを乳牛の識別コードに付けることができる。それに基づいて注意信号が発せられる値と、そして予測された値に対する偏差とは表示されるか、および/またはプリントアウトされる。
活動がかなり激しくそして活動と収量とそして温度の組合せが、1つの信頼値帯域外になっていれば、発熱の可能性を(例えば、“h”,“hh”および“hhh”という形態で)示す、誤差の組合せに基づく注意信号が発せられることが好ましい。伝導率の誤差がかなり大きく、また伝導率と収量とそして温度の組合せが1つの信頼値帯域外になっていれば、乳腺炎の可能性を(例えば、“m”,“mm”または“mmm”という形態で)示す注意信号が発せられることが、好ましい。収量と温度とそして活動が組み合わされた誤差が信頼値帯域外になっておりかつ濃縮飼料の摂取量が正常な情況下で低い確率を有する水準にあれば、他の病気の可能性を(例えば、“i”,“ii”および“iii”という形態で)示す注意信号が発せられることが好ましい。
注意信号が発せられると決定されれば、段階29において、それぞれの乳牛の識別データに関連して選択された注意信号を表示するようにディスプレー22は制御される。
注意信号が発せられた後、それに基づいて予測がなされるモデルは当該の牛については、特にこの注意信号によってよりより広い複数の信頼値帯域の1つの外にある数値が測定されていることが示されている場合には、もはや信頼性が失われている。したがって、段階30においては、収集されたデータに基づく乳牛のモニタリングは原則として、当該の動物に関する注意信号に応じて、または当該の動物に関するある信頼水準を越えているという注意信号に応じて中止される。
注意信号または予め定められた信頼水準を越えたという注意信号を発しないと決定されれば、当該の個々の乳牛の状況データは、以下の3セットのデータ、すなわち、最新の測定値、最新の予測値、そして予測値とこれに対応する測定値との最新の誤差のうちのいずれか2つを用いて、更新される。流れ図においては、これは段階31に記載されている。
注意信号が発せられた後に、農場主または獣医によって、その注意信号が誤っていたことが明らかにされるならば、その測定値は予測値に置き換えられることが好ましく、そうして検査されたこの動物のモニタリングは、以前に収集されたデータと最新の測定値セットの代わりに入力されたデータとに基づいて、継続することができる。このようにして、段階30は、擬陽性信号として無効にすることができる。更に、例えば50℃以上の乳温度のようなあり得ない測定結果は自動的に無視され、そして予測値に置き換えられるが、ある測定値がとばされていることを示す警告信号が表示されるかまたはプリントアウトされる。したがって、測定機構の誤作動の可能性を示す警告信号もまた同時に得られる。予測値に基づく更新の代わりに、有効な測定結果が得られない性質に関する状況を更新する段階をとばすことも可能である。
搾乳スタンド1には、複数の吸引カップ2〜5と乳導管5〜8が含まれており、この管の各々は吸引カップ2〜5の1つと接続されそしてそれぞれの乳導管5〜8を通過する乳の伝導率を測定するための測定センサ9〜12が設置されているので、各乳房区から得られる乳の伝導率を個別に測定することができる。更に、データ処理機構21は、予測された伝導率の値と上記測定センサ2〜5の1つによって測定された伝導率の値との誤差がしきい値を越えている場合には、注意信号を発するように、プログラムされている。このようにして、一般的には乳腺炎の高い可能性を示し、通常は同時に1、2か所の乳房区に起こる伝導率の増大を非常に高い感度と特定性をもって指示することができる。
どの乳房区よりの乳の伝導率予測における誤差のしきい値も明確に、全ての乳房区の対応する予測の平均誤差に関連していることが好ましい。もし全ての乳房区より得られた乳の伝導率が予測よりも高ければ、乳腺炎は全ての乳房区で同時に発生することは稀であるので、この偏差はこの病気以外の因子によって引き起こされたと見なした方がいい。したがって、もしそれに対して注意信号が発せられるいずれか1つの乳房区に関するしきい値が、予測伝導率よりも高い他の乳房区から得られた乳の測定伝導率に応じてより高くなるならば、より高い感度と特定性が得られる。
どの程度まで、様々な乳房区から得られる乳の伝導率が個々の各動物について互いに依存しているかを考慮すれば、このモニタリング方法の感度と特定性は更に増大させることができる。異なる乳房区からの乳の伝導率の値どうしの依存性が、各動物に関して当該のそれぞれの動物の伝導率の測定値から個別的に決定され、そしてしきい値に対する平均誤差の影響が、個々の識別された各動物について決定された異なる乳房区からの乳の伝導率の値どうしの依存性に明確に関連していることによって、こうしたモニタリング方法の感度と特定性の増大が達成されることが好ましい。このようにして、異なる乳房区から得られた乳の伝導率の値の挙動が比較的に独立している個々の乳牛については、伝導率の予測値における平均誤差は、異なる乳房区から得られた乳の伝導率の値の変化が密接に関連性のある挙動を示す個々の乳牛に比較して、どの1つの伝導率の値に対してもしきい値の水準により小さな影響しか与えない。
正常な情況では、乳収量、伝導率、乳温度および活動性の測定値は、時間とともに徐々に変化する、すなのち各性質の継続的観察は互いに独立しているわけではない。したがって、予測は、発熱していない健康な乳牛に有効であると見なされている時系列モデルを用いてなされることが好ましく、過渡に大きな偏差は、この仮定がもはや有効でないことを示しており、その場合このモデルを利用しているモニタリングは上述のように原則として停止される。
様々な性質に関する適宜な時系列モデルは、実験データを図表にし、自己相関のコレログラムを調べ、適宜なARIMAを選択し、そして選択されたモデルを適合させることによって、確立することができる。
更に、時系列モデルのパラメータは、各泌乳期が進行するにしたがって個々の乳牛について推測された値とこれに対応する測定値との誤差より個別的に各乳牛に対して推定されることが好ましい。このようにして時系列モデルが得られ、このモデルは自動的にそれぞれの乳牛の諸特性(例えば、測定された性質における多かれ少なかれ不規則な変化)と、観測の時間的変化の諸特性に影響を与える他の情況とに適用される。したがって、例えば、搾乳日数、乳牛の種類、気候、飼料、搾乳習慣、様々な種類の乳牛(未経産雌牛または経産牛)などを考慮することのような様々な情況下で時系列モデルの最善のパラメータの設定を確立するのに、いかなる実験も必要としない。他の利点は、誤ったパラメータ値をうっかり設定する危険が設けられることと、この方法は一般的に扱い易いことと、そして個々の乳牛どうしの相違と各乳牛の継続的泌乳期の違いを考慮に入れていることである。時系列モデルのパラメータのオンライン推定もまた、もし信頼値帯域が個々の各動物に関して個別的に決定されていなければ、時系列モデルを個々の各動物に自動的に適合させるという点において、優れている。
時系列モデルのパラメータは、次回の測定に対する推測値を決定する状態ベクトルを含むカルマンフィルタ法を用いて推定されることが好ましいが、この状態ベクトルには時系列モデルのパラメータが含まれている。
カルマンフィルタは、オンラインであるシステムの状態を推定する方法である。状態とは、当該システムの将来の挙動を決定する数量である。推定は、新しい情報を用いることによって新たな観察がなされる度に改善される。最初に、一般的な説明がなされ、そして次に、本発明によるこの方法における2つのアプリケーションが説明される。すなわち、この状態には(1)時系列モデルにおけるパラメータと(2)計算された濃厚飼料の食べ残しの百分率の確率分布とが含まれる。
カルマンフィルタを適用するために、このシステムは以下の形態、すなわち
− 観察方程式:yt=ctxt+vt (1)とそして、
− システム方程式:xt+AtXt-1+wt(2)という状態空間方程式によって記述される。
これらの方程式において、xtは状態ベクトルであり、ytは観察ベクトル、ctとAtはシステム行列、vtはランダム観察誤差、そしてwtはランダムシステム誤差である。観察方程式は測定と状態との関係を記述するものであるが、この状態自体は一般的には直接的に測定できるものではない。システム方程式は継続的観察における状態どうしの関係を記述するものである。vtの分布はN(0,Vt)であり、そしてwtの分布はN(0,Wt)である。
観察tにおける状態xtの推定値は観察ytからyt-1までで得られた測定値を用いて得られる。カルマンフィルタは各セットの観察ごとに状態の新しい推定値と、そしてその外にこの推定値に関する分散−共分散行列とを提供する。
また特に、このカルマンフィルタは2段階推定手続きである。第1の段階では、状態の推定値と分散−共分散行列が以前の状態に基づいて計算される。第2の段階では、この推定値は、1セットの観察ytと(1セットの観察期間中に得られた値と推定値との差を表す)推定誤差etとにしたがって更新される。この更新推定値は、次のセットの観察と共に用いられる。
カルマンフィルタはxtの最小平均平方一次推定値を与える。更に、推定値誤差etの分散−共分散行列−この行列に基づき上述の標準化が実行される−も計算することができる。
時系列モデルと共にカルマンフィルタを従来通りに使用する際には、状態は測定変数からなることになろう。本発明の好ましい実施態様にしたがえば、乳牛の変数の時系列モデルのパラメータを推定するためにカルマンフィルタが用いられる。カルマンフィルタは各搾乳後ごとに状態の新しい推定値を与えるが、これは時系列モデルのパラメータの新たな推定値である。これらのパラメータの新たな推定値によって、新しい測定値が予測され、その結果、それぞれの情況に最も適合していると思われる時系列モデルのパラメータを予め選択する必要なしに、かつ高い信頼度をもって、基準から逸脱した測定値の信号を送ることができる。推定された状態の分散−共分散行列は更に、上述のように、推測値と測定値との誤差を互いに関係づけるために用いられる。
カルマンフィルタの計算方法はまた、予め定められた濃厚飼料消費水準の確率分布を濃厚飼料の消費水準に適合させるためにも用いられる。これを達成させるために、状態空間方程式(1)および(2)に関する説明が用いられる。この場合、以下のような定義が適用される。すなわち
〔式3〕

− 食べ残し=0%ならば、
r0=1、i=0ならば、ri=0
− 0%>食べ残し>10%ならば、
r1=1、i=0ならば、ri=0
− 10%>食べ残し>30%ならば、
r2=1、i=2ならば、ri=0
− 30%>食べ残し>50%ならば、
r3=1、i=3ならば、ri=0
− 50%>食べ残し>100%ならば、
r4=1、i=4ならば、ri=0
行列AtとCtは、識別行列I、vt=Iとwt=0.01Iに等しい。
これらの定義によって、推定誤差は以下の通りである。すなわち
〔式4〕
カルマンフィルタの計算技術に関する更なる詳細についていは、A.C.ラーベイ著の『推定構造の時系列モデルとカルマンフィルタ』ケンブリッジ大学出版、ケンブリッジUK、1989年と、P.J.バリソンおよびC.F.スティーブンズ著の『ベイスの予測』英国統計協会、38号、頁205〜247、1976年に言及されれている。
本発明の現在のところ最も好ましい実施様態にしたがったモニタリング方法とシステムとは、実験によって試験済みである。その結果によると、以下に示されている表に記載されているように(*の数は上述の信頼値帯域に対応する)、微同調なしに既に非常に良好な感度と良好な特定性が得られている。
1. 搾乳スタンド
17.給餌装置
18.センサ
19.活動メータ読取り装置
20.乳牛識別機構
21.データ処理機構
22.ディスプレー(発信装置)
23.動物を識別する
24.測定する
25.状態を読み取る、測定された値を読み取る
26.推測値を計算する
27.誤差の標準化を計算する
28.注意指示を決定する
29.注意信号を発する
30.動物のモニタリングを停止する
31.状態を更新するTechnical field
The present invention relates to a system and apparatus for automatically monitoring the physical condition of a herd. Automatic monitoring of the physical condition of the livestock population contributes to increased productivity by identifying animals that are feverish or likely to be sick at the appropriate time. Especially on dairy farms, as the size of the herds grows and the adoption of automated milking systems, it is difficult and cumbersome for dairymen to identify such animals by visual observation. .
Background art
The “Daily Milk Yield Simulation Experiment for Holstein Cows Using Time Series Analysis” by Dreiker et al. In the Dairy Science Journal, 73; 539-54B automatically monitors the physical condition of herds. An experimental method is shown for measuring the value of one property obtained from each individual identified animal at regular intervals, and for each individual identified animal. Storing the measurement data according to the measured value of the measured property, and the predicted value of the next measurement value of this property for each individual identified animal from the stored measurement data for each individual identified animal And a step of generating an attention signal in response to an error between a measured property value and a predicted value of the value exceeding a predetermined level.
In this experimental method, the property measured is milk yield.
An automatic cow identification and milk yield recording system was used to perform these measurements.
After the observation period, a set of milk yields for each milking or three consecutive milkings, each with a set of several parameters, each generally applied for a specific period of lactation in heifers or cows A time series model was formulated to predict milk yield.
The disadvantage of the above method is that it is cumbersome that an appropriate parameter set has to be selected for each cow. This can also cause errors. Furthermore, the parameters determined in this way can be applied to other types of cows, even to other animals (eg goats), and to groups kept in different climates and different types of feed. I don't think it's applicable.
Summary of the invention
The object of the present invention provides a reliable system and method for automatically monitoring the physical state of a herd of animals that can be applied more universally than the model proposed by Dereiker et al. That is.
According to the present invention, this object is achieved by providing the system described in claim 1 and the method described in
In the method according to the invention and in operation in the system according to the invention, during the period of milk secretion (hereinafter referred to as lactation), the error depends on the predicted value and the corresponding measured value for each individual animal identified. From this error data that is stored and characterizing the distribution of error, a confidence interval is determined for each individual identified animal and for this same lactation prediction, and the method automatically This is because the significance of the error between the predicted value and the measured value for each animal is individually evaluated from the data collected in (1). This confidence interval can be automatically determined for each individual measurement and for each individual animal, and thus for different lactations, for different animal types and also for different properties to be measured. There is no need to input different confidence band for each. Furthermore, it is not necessary to conduct another investigation to obtain such a confidence band.
Since the significance of the error is evaluated for each animal individually, the adverse effects of the unreliable predicted value due to the error, even when applied, are reduced when selecting the parameters of the time series model. For each individual animal and each monitored variable, the width of the confidence band is automatically adjusted online to the empirically found accuracy of the suitability of the time series model and the confidence of this predicted value The signal can be sent individually to indicate gender.
The property to be measured can be any one of several properties, for example: milk yield, milk temperature, milk conductivity, animal activity and at least one feed intake.
The method according to the invention is prophylactic and thus has the effect of improving productivity in that individual animals likely to be ill can be identified more easily and with a higher degree of confidence. First, the sooner an animal to be diagnosed by a veterinarian can be identified, the greater the chance of recovery from disease, avoiding adverse effects on the animal, and preventing the spread of contagious diseases to the herd. Secondly, animals with poor physical condition are therefore prone to illness or even worse, even if already ill. The sooner these animals can be identified, the sooner they can take measures to improve the physical condition of the animal and prevent it from becoming sick or having another disease. Become.
The productivity improvement effect can also be achieved by detecting the estrus period earlier and consequently shortening the delivery interval.
According to one particular embodiment of this method according to the invention, the interdependence characteristics between the errors in the predicted values of the conductance of milk obtained from several different teats (breasts if the animal is a cow) are Error data is used for illustration. Thus, this dependency data is also used to evaluate the significance of errors in the predicted value of milk conductivity obtained from any one of the nipples.
According to another particular embodiment of the present invention, the error data collected during the lactation period is also used to predict the predicted value of the measurement for each animal that is individually measured during this same lactation period. Used to predict series model parameters. In this way, the time series model for each individual animal is automatically adjusted to best fit the time-varying characteristics of that individual animal's properties as the lactation progresses. The
Specific features and advantages of the invention are set forth in the appended claims and the detailed description given below with reference to the following drawings.
[Brief description of the drawings]
FIG. 1 is a schematic diagram of a system according to one embodiment of the present invention, and
FIG. 2 is a flow diagram of one embodiment of the method according to the invention.
Several embodiments of the present invention
The system and method represented by FIGS. 1 and 2 represent the most preferred embodiment of the present invention. Hereinafter, the method and system will be described in the context of monitoring a herd of cows, but in principle the present invention is subject to at least one property of each individual animal being measured at regular intervals. It can also be used to monitor other animals.
The system shown in FIG. 1 is integrated with a milking stand 1 for milking individual cows one by one. The milking stand further includes a milking device with four suction cups 2-5 connected to the cow for milking the cow. Milk conduit 5-8 is connected at its upstream end to suction cups 2-5 and at its downstream end to conductivity sensors 9-12. The conductivity sensors 9 to 12 are a part of the conductivity measurement unit 13. In this conductivity measuring unit 13, the milk conduits 5-8 merge downstream from the conductivity sensors 9-12 into a
In order to reduce the influence of the ambient temperature on the temperature measurement between the
The milking stand is further provided with a
Each cow in the herd is equipped with an activity meter (not shown) that records a value associated with or corresponding to the activity pattern of that cow. In order to read the value from this activity meter, the milking stand is an activity meter for reading the value recorded from the activity meter of each cow that has been milked, will be milked or has already been milked. A
Each cow in the herd is further provided with an identification tag (not shown). The milking stand 1 is provided with a
The conductivity measurement unit 13, the
The
Further, the
In operation, the present invention is implemented according to the following description, as shown in the flow chart shown in FIG. The algorithm according to this flow chart is preferably repeated for each milking.
For each milking of each individual cow, the identification tag is read to identify each cow as shown in
Next, as shown in
Determine the predicted value for each next value to be measured, and situational data that characterizes the error distribution of the previous predicted value based on earlier measured and predicted values, or as an initial set of values and parameters At the time of the first milking in the lactation period, each identified animal is stored in the storage device of the
As indicated by
Different approaches are preferred for feed intake, with leftovers nearly equal to zero and sometimes more. According to the data obtained from the experiments, continuous leftovers are independent, and each has its own probability distribution with respect to the percentage of leftovers of concentrate in each individual animal, Has been suggested and is preferably defined as follows. That is,
p0 = P (leftover = 0%)
p1 = P (0% <leftover <10%)
p2 = P (10% <leftover <30%)
p3 = P (30% <leftover <50%)
p4 = P (50% <leftover <100%)
This distribution shows the probability p of various levels of concentrated feed consumption p conc Can be used to calculate Probability p conc Is low, an attention signal is issued, or at least a special condition is discovered. The cow-dependent distribution of the probability of leftovers in various ranges is adapted to measure the leftovers of each cow using the Kalman filter calculation method described below.
In order to eliminate structural differences between different milkings (for example, morning and evening milking), calculations are made on the basis of measurements combined with combined predictions of two or more continuous milkings daily. It is preferable.
Since standardized data is determined for all predicted value errors, a single confidence band where the width of the confidence band can be accurately determined according to the desired balance of sensitivity and specificity. It is possible to determine whether the error between the predicted value and the measured value falls within and within some confidence band combined. If at least one of the measured values is outside the confidence band, or if there are multiple error combinations that indicate signs that one animal is in a particular state, an attention signal must be issued in
If at least one measurement is outside one confidence band, then after normalization -and the error for animals that are in a healthy state and not fever is considered to be normally distributed -and predetermined If it is outside some confidence band, it is preferable that a caution signal is issued based on a single error. If at least one measurement is outside 95% of the confidence band, a “*” mark can be placed on the cow identification code, and if at least one measurement is outside 99% of the confidence band. , “***” mark can be attached to the cow identification code, and “***” mark can be attached to the cow identification code if at least one measured value is outside 99.99% of the confidence band. . The value at which an attention signal is issued and the deviation from the predicted value are displayed and / or printed out.
If the activity is quite intense and the combination of activity, yield and temperature is outside one confidence band, the possibility of fever (eg in the form of “h”, “hh” and “hhh”) An attention signal based on the error combination shown is preferably issued. If the conductivity error is quite large and the combination of conductivity, yield, and temperature is outside one confidence band, then the possibility of mastitis (eg, “m”, “mm” or “mmm”). It is preferred that the attention signal shown (in the form "") is issued. If the combined error in yield, temperature, and activity is outside the confidence band and the intake of concentrated feed is at a level that has a low probability under normal circumstances, the possibility of other diseases (eg, , “I”, “ii” and “iii”) are preferably issued.
If it is determined that a caution signal is to be issued, in
The model for which predictions are made after the attention signal is issued is that for the cow in question, a value that is outside one of the wider confidence band is measured, in particular by the attention signal. If indicated, it is no longer reliable. Therefore, in
If it is determined not to issue a warning signal or a warning signal that a predetermined confidence level has been exceeded, the status data for the individual cow is obtained from the following three sets of data: the latest measurement value, the latest measurement value, It is updated using any two of the predicted value and the latest error between the predicted value and the corresponding measured value. In the flow diagram, this is described in
If, after the attention signal is issued, the farmer or veterinarian reveals that the attention signal was incorrect, the measurement should preferably be replaced with a predicted value, and this Animal monitoring can continue based on previously collected data and data entered in place of the latest set of measurements. In this way,
The milking stand 1 includes a plurality of suction cups 2-5 and milk conduits 5-8, each of which is connected to one of the suction cups 2-5 and passes through the respective milk conduit 5-8. Since the measurement sensors 9 to 12 for measuring the milk conductivity are installed, the milk conductivity obtained from each breast section can be individually measured. In addition, the
The threshold of error in predicting milk conductivity from any breast section is preferably clearly related to the average error of the corresponding prediction of all breast sections. If the milk conductivity obtained from all breast sections is higher than expected, mastitis rarely occurs simultaneously in all breast sections, so this deviation was caused by factors other than this disease. Better to consider. Thus, if the threshold value for any one breast section to which attention is signaled is higher depending on the measured conductivity of milk obtained from other breast sections that are higher than the predicted conductivity Higher sensitivity and specificity can be obtained.
The sensitivity and specificity of this monitoring method can be further increased by considering to what extent the milk conductivity obtained from different breast plots is dependent on each other for each individual animal. The dependence of the conductivity values of milk from different breast plots is determined for each animal individually from the respective animal conductivity measurements, and the effect of the mean error on the threshold is individually Increased sensitivity and specificity of these monitoring methods is achieved by clearly relating to the dependence of the conductivity values of milk from different breast areas determined for each identified animal Is preferred. In this way, for individual dairy cows where the behavior of milk conductivity values from different breast plots is relatively independent, the average error in the predicted conductivity is obtained from the different breast plots. Compared to individual dairy cows, where changes in the conductance values of milk show closely related behaviors, any single conductance value has a smaller impact on the threshold level.
Under normal circumstances, milk yield, conductivity, milk temperature and activity measurements change gradually over time, that is, the continuous observation of each property is not independent of each other. Therefore, predictions are preferably made using a time series model that is considered valid for healthy dairy cows that do not have fever, and large transient deviations indicate that this assumption is no longer valid. In that case, the monitoring using this model is stopped in principle as described above.
Appropriate time series models for various properties can be established by charting experimental data, examining the autocorrelation correlogram, selecting the appropriate ARIMA, and fitting the selected model.
Furthermore, the parameters of the time series model are preferably estimated for each cow individually from the error between the value estimated for each cow and the corresponding measurement value as each lactation progresses. . In this way a time series model is obtained, which automatically affects the characteristics of each cow (eg more or less irregular changes in the measured properties) and the characteristics of the temporal changes in the observations. Applies to other situations that give you. Thus, for example, time series models under various circumstances such as considering milking days, dairy cow types, climate, feed, milking habits, various dairy cows (i.e. heifers or cows) No experimentation is required to establish the best parameter settings. Other benefits include the risk of inadvertently setting incorrect parameter values, the ease with which this method is generally handled, and the differences between individual cows and the continued lactation of each cow. It is to put in. Online estimation of time series model parameters is also excellent in that the time series model is automatically adapted to each individual animal if the confidence band is not individually determined for each individual animal. Yes.
The parameters of the time series model are preferably estimated using a Kalman filter method including a state vector that determines an estimated value for the next measurement, and the state vector includes the parameters of the time series model.
The Kalman filter is a method for estimating the state of a system that is online. A state is a quantity that determines the future behavior of the system. The estimation is improved each time a new observation is made by using new information. First a general description is given, and then two applications in this method according to the invention are described. That is, this state includes (1) the parameters in the time series model and (2) the probability distribution of the percentage of leftovers of the calculated concentrated feed.
To apply the Kalman filter, the system has the following form:
-Observation equation: y t = C t x t + V t (1) and
System equation: x t + A t X t-1 + W t It is described by the state space equation (2).
In these equations, x t Is the state vector, y t Is the observation vector, c t And A t Is the system matrix, v t Is random observation error, and w t Is a random system error. Although the observation equation describes the relationship between measurement and state, this state itself is generally not directly measurable. System equations describe the relationship between states in continuous observation. v t Distribution of N (0, V t ) And w t Distribution of N (0, W t ).
State x at observation t t The estimated value of t To y t-1 It is obtained using the measured values obtained up to. The Kalman filter provides a new estimate of the state for each set of observations, and additionally a variance-covariance matrix for this estimate.
In particular, the Kalman filter is a two-stage estimation procedure. In the first stage, state estimates and a variance-covariance matrix are calculated based on previous states. In the second stage, this estimate is a set of observations y t And an estimation error e (representing the difference between the value obtained during one set of observation periods and the estimated value) t It is updated according to. This updated estimate is used with the next set of observations.
Kalman filter is x t Gives the minimum mean square primary estimate of. Furthermore, the estimated value error e t Can also be calculated-the covariance matrix-on which the above normalization is performed.
When the Kalman filter is used conventionally with a time series model, the state will consist of measured variables. According to a preferred embodiment of the present invention, a Kalman filter is used to estimate the parameters of a time series model of dairy cow variables. The Kalman filter gives a new estimate of the state after each milking, which is a new estimate of the parameters of the time series model. With new estimates of these parameters, new measurements are predicted, so that there is no need to pre-select the parameters of the time series model that seems to best fit the situation and with high confidence. , Signals of measured values deviating from the reference can be sent. The estimated state variance-covariance matrix is further used to correlate the error between the estimated value and the measured value, as described above.
The Kalman filter calculation method is also used to adapt a predetermined probability distribution of concentrated feed consumption level to the concentrated feed consumption level. To achieve this, the explanations for state space equations (1) and (2) are used. In this case, the following definitions apply: Ie
[Formula 3]
-If left over = 0%,
r 0 = 1, i = 0, r i = 0
-If 0%> left over> 10%,
r 1 = 1, i = 0, r i = 0
-If 10%> left over> 30%,
r 2 = 1, i = 2 Then r i = 0
-If 30%> left over> 50%,
r Three = 1, i = 3, r i = 0
-If 50%>leftovers> 100%,
r Four = 1, i = 4, r i = 0
Matrix A t And C t Is the identification matrix I, v t = I and w t = Equal to 0.01I.
With these definitions, the estimation error is as follows: Ie
[Formula 4]
For more details on the Kalman filter calculation technique, see A. C. Labay's “Time Series Models and Kalman Filters for Estimated Structures”, Cambridge University Press, Cambridge UK, 1989; J. et al. Barison and C.I. F. Stevens'"BasisPrediction" is mentioned in the British Statistical Society, 38, pages 205-247, 1976.
The monitoring method and system according to the presently most preferred embodiment of the present invention has been experimentally tested. The results show that there is already very good sensitivity and good specificity without fine tuning, as described in the table shown below (the number of * corresponds to the above confidence band). Has been obtained.
1. Milking stand
17. Feeding device
18. Sensor
19. Activity meter reader
20. Cow identification mechanism
21. Data processing mechanism
22. Display (transmitter)
23. Identify animals
24. taking measurement
25. Read status, read measured value
26. Calculate the guess
27. Calculate error standardization
28. Determine attention instructions
29. Issue a caution signal
30. Stop animal monitoring
31. Update state
Claims (13)
前記群れの、個々の識別された動物に関連する少なくとも1つの特性の値を測定する測定装置(15,16,18,19,20)と、
前記群れの個々の動物を識別する識別機構(20)と、
前記測定装置(15,16,18,19,20)と前記識別機構(20)に接続されたデータ処理機構(21)と、
前記データ処理機構(21)に接続され、注意信号を発する報知装置(22)とを有し、
前記データ処理機構は、
個々の識別された各動物に関連する前記少なくとも1つの特性の、前もって測定された値と前もって予測した値にしたがって測定データと誤差データを収集し、
前記個々の識別された動物に関連する、前記格納された測定データおよび誤差データから、前記個々の識別された動物に関する前記少なくとも1つの特性の、次に測定される少なくとも1つの値について予測をし、
前記誤差データから、個々の識別された各動物についての予測に適した信頼区間を求め、
個々の識別された各動物から、一定の間隔で少なくとも1つの特性の値を測定し、
測定された値を、対応する予測値および信頼区間と比較し、
前記少なくとも1つの測定された特性の値と前記信頼区間から外れた前記予測値との間の誤差に応答して注意信号を発するために前記報知装置(22)を作動させるようにプログラムされている、群れの家畜の体調を監視するシステム。A system for monitoring the health of herds,
A measuring device (15, 16, 18, 19, 20) for measuring a value of at least one characteristic associated with each identified animal of the herd;
An identification mechanism (20) for identifying individual animals of the herd;
A data processing mechanism (21) connected to the measuring device (15, 16, 18, 19, 20) and the identification mechanism (20);
A notification device (22) connected to the data processing mechanism (21) and emitting a caution signal;
The data processing mechanism is:
Collecting measurement data and error data according to previously measured and previously predicted values of said at least one characteristic associated with each individual identified animal;
Associated with the individual identified animal, from the measurement data and the error data is the storage, the individual identified animal for the at least one characteristic, the prediction for at least one value to be subsequently measured And
From the error data, find a confidence interval suitable for prediction for each individually identified animal,
Measuring the value of at least one characteristic from each individual identified animal at regular intervals;
Compare the measured value with the corresponding predicted value and confidence interval,
Programmed to activate the alerting device (22) to emit an attention signal in response to an error between the value of the at least one measured characteristic and the predicted value outside the confidence interval. , A system to monitor the health of herds.
個々の識別された各動物に関する、少なくとも1つの測定された特性の、前もって測定された値と前もって予測された値にしたがって、測定データと誤差データを収集するステップ(ステップ31)と、
個々の識別された各動物から、前記少なくとも1つの特性の値を一定の間隔で測定するステップ(ステップ24)と、
前記個々の識別された動物に関する前記収集した測定データから、前記個々の識別された動物に関する前記少なくとも1つの特性の、次に測定される少なくとも1つの値について予測をするステップと(ステップ26)、
前記誤差データから、個々の識別された各動物についての前記予測に適した信頼区間を求めるステップ(ステップ27)と、
測定された値を、対応する予測値および信頼区間と比較するステップ(ステップ28)と、
前記少なくとも1つの測定された特性の値と、前記信頼区間によって求められた、予め決められた水準を越える前記予測値との間の誤差に応答して注意信号を発するステップ(ステップ29)とを含んでいる、群れの家畜の体調を自動的に監視する方法。A method of automatically monitoring the health of a herd of livestock,
Collecting measurement and error data according to previously measured and previously predicted values of at least one measured characteristic for each individual identified animal (step 31);
Measuring the value of said at least one characteristic at regular intervals from each individual identified animal (step 24);
Predicting from the collected measurement data for the individual identified animals for at least one next measured value of the at least one characteristic for the individual identified animals (step 26);
Determining a confidence interval suitable for the prediction for each individually identified animal from the error data (step 27);
Comparing the measured value with the corresponding predicted value and confidence interval (step 28);
Issuing an attention signal in response to an error between the value of the at least one measured characteristic and the predicted value determined by the confidence interval and exceeding a predetermined level (step 29); A method to automatically monitor the health of herds in a herd.
Applications Claiming Priority (1)
| Application Number | Priority Date | Filing Date | Title |
|---|---|---|---|
| PCT/EP1996/002604 WO1997047187A1 (en) | 1996-06-14 | 1996-06-14 | A system and a method for monitoring the physical condition of a herd of livestock |
Publications (3)
| Publication Number | Publication Date |
|---|---|
| JP2000511778A JP2000511778A (en) | 2000-09-12 |
| JP2000511778A5 JP2000511778A5 (en) | 2004-08-19 |
| JP3856476B2 true JP3856476B2 (en) | 2006-12-13 |
Family
ID=8166239
Family Applications (1)
| Application Number | Title | Priority Date | Filing Date |
|---|---|---|---|
| JP50109098A Expired - Fee Related JP3856476B2 (en) | 1996-06-14 | 1996-06-14 | System and method for monitoring the physical condition of livestock |
Country Status (6)
| Country | Link |
|---|---|
| US (1) | US6405672B1 (en) |
| EP (1) | EP0903980B1 (en) |
| JP (1) | JP3856476B2 (en) |
| AU (1) | AU6224596A (en) |
| DE (1) | DE69610998T2 (en) |
| WO (1) | WO1997047187A1 (en) |
Families Citing this family (30)
| Publication number | Priority date | Publication date | Assignee | Title |
|---|---|---|---|---|
| AU773798B2 (en) | 1999-09-02 | 2004-06-10 | Kristoffer Larsen Innovation A/S | Method for controlling breeding of free-range animals |
| NL1015120C2 (en) | 2000-05-04 | 2001-11-06 | Inst Voor Milieu En Agritechni | Stasticcal analysis of cow characteristics using fuzzy logic to detect oestrum and mastitis with high sensitivity and few false positives |
| SE0002082D0 (en) * | 2000-06-05 | 2000-06-05 | Delaval Holding Ab | Notification method and system |
| EP1502499A1 (en) * | 2001-03-07 | 2005-02-02 | Lattec I/S | System for optimising the production performance of a milk producing animal herd |
| NL1019062C2 (en) * | 2001-09-28 | 2003-04-02 | Lely Entpr Ag | Device for milking animals. |
| NL1019060C2 (en) * | 2001-09-28 | 2003-04-02 | Lely Entpr Ag | Device and method for milking a dairy animal. |
| NL1019059C2 (en) * | 2001-09-28 | 2003-04-02 | Lely Entpr Ag | Device and method for milking dairy animals. |
| NL1019061C2 (en) * | 2001-09-28 | 2003-04-02 | Lely Entpr Ag | Method for collecting measurement data during the automatic milking of an animal. |
| US7302349B2 (en) * | 2002-08-16 | 2007-11-27 | Lattec I/S | System and a method for observing and predicting a physiological state of an animal |
| GB0318733D0 (en) * | 2003-08-11 | 2003-09-10 | Icerobotics Ltd | Improvements in or relating to milking machines |
| CA2537071A1 (en) * | 2003-08-29 | 2005-03-10 | David Eric Akerman | Milk sampling and testing |
| WO2005101273A1 (en) * | 2004-04-13 | 2005-10-27 | Commonwealth Scientific And Industrial Research Organisation | Integrated animal management system and method |
| JP4482399B2 (en) * | 2004-08-16 | 2010-06-16 | 富士通株式会社 | Mortality automatic estimation method and mortality automatic estimation device |
| SE528838C2 (en) | 2005-04-29 | 2007-02-27 | Delaval Holding Ab | Detection method and arrangement for dairy cattle |
| DE102005031425A1 (en) | 2005-07-04 | 2007-01-11 | Westfaliasurge Gmbh | Method and device for the management of dairy animals |
| US8866605B2 (en) * | 2006-05-10 | 2014-10-21 | Say Systems Ltd | Animal monitoring system |
| US7699024B2 (en) * | 2006-09-20 | 2010-04-20 | Rysewyk Terry P | Milk temperature monitor with ambient temperature compensation |
| SE531678C2 (en) * | 2006-11-30 | 2009-06-30 | Delaval Holding Ab | Method for detecting mastitis in dairy animals, a milking system and a computer program product |
| NL1033926C2 (en) * | 2007-06-03 | 2008-12-08 | Maasland Nv | Method and device for managing a group of dairy animals, as well as a computer program product thereof. |
| GB0716333D0 (en) * | 2007-08-22 | 2007-10-03 | White Spark Holdings Ltd | Method and apparatus for the automatic grading of condition of livestock |
| US9162249B2 (en) * | 2008-10-01 | 2015-10-20 | Panasonic Intellectual Property Management Co., Ltd. | Paste dispenser for applying paste containing fillers using nozzle with pin and application method using the same |
| US20120115184A1 (en) * | 2009-06-09 | 2012-05-10 | University of Tarty | Method for the detection of mastitis and milk quality and mastitis sensor |
| NL1037157C2 (en) * | 2009-07-29 | 2011-02-02 | Lely Patent Nv | GENERATING AN ATTENTION VALUE IN AN AUTOMATED MILK DEVICE. |
| CA2785222C (en) | 2010-01-29 | 2015-11-03 | Gea Houle Inc. | Rotary milking station, kit for assembling the same, and methods of assembling and operating associated thereto |
| JP5756967B2 (en) * | 2011-03-30 | 2015-07-29 | 国立研究開発法人農業・食品産業技術総合研究機構 | Milk cow health condition management method and management system |
| US8972308B2 (en) * | 2011-10-31 | 2015-03-03 | Hewlett-Packard Development Company, L.P. | Combining multivariate time-series prediction with motif discovery |
| SE538015C2 (en) | 2012-11-01 | 2016-02-09 | Delaval Holding Ab | Method, computer program and computer program product for controlling the milking by means of a milking device, as well as a single milking arrangement |
| US20140261189A1 (en) * | 2013-03-15 | 2014-09-18 | Mitchell Barry Chait | Automated monitoring of compliance in an egg farm based on egg counts |
| JP6465443B2 (en) * | 2014-12-12 | 2019-02-06 | 株式会社エー・アンド・デイ | Animal behavior observation system |
| CN116439158B (en) * | 2023-06-20 | 2023-09-12 | 厦门农芯数字科技有限公司 | Sow oestrus checking method, system, equipment and storage medium based on infrared identification |
Family Cites Families (8)
| Publication number | Priority date | Publication date | Assignee | Title |
|---|---|---|---|---|
| US5568788A (en) * | 1990-02-27 | 1996-10-29 | C. Van Der Lely N.V. | Implement for and a method of milking animals automatically |
| US5152246A (en) | 1990-06-30 | 1992-10-06 | Arion Machinery Co., Ltd. | Method of monitoring milking |
| US5351644B1 (en) * | 1993-02-25 | 2000-04-18 | Cornell Res Foundation Inc | Method of bovine herd management |
| NL9300443A (en) * | 1993-03-11 | 1994-10-03 | Prolion Bv | Method and device for monitoring animal functions. |
| NL9302154A (en) | 1993-12-10 | 1995-07-03 | Nedap Nv | Information system for dairy farming. |
| NL9401801A (en) * | 1994-08-23 | 1996-04-01 | Maasland Nv | Construction with a device for milking animals. |
| NL1002471C2 (en) * | 1996-02-28 | 1997-08-29 | Maasland Nv | Method for the care, in particular the feeding, of animals. |
| US5996529A (en) * | 1998-01-13 | 1999-12-07 | Dairy Creations, Inc. | Milk metering and cow ID system |
-
1996
- 1996-06-14 WO PCT/EP1996/002604 patent/WO1997047187A1/en active IP Right Grant
- 1996-06-14 AU AU62245/96A patent/AU6224596A/en not_active Abandoned
- 1996-06-14 JP JP50109098A patent/JP3856476B2/en not_active Expired - Fee Related
- 1996-06-14 US US09/202,380 patent/US6405672B1/en not_active Expired - Fee Related
- 1996-06-14 EP EP96920821A patent/EP0903980B1/en not_active Revoked
- 1996-06-14 DE DE69610998T patent/DE69610998T2/en not_active Revoked
Also Published As
| Publication number | Publication date |
|---|---|
| DE69610998D1 (en) | 2000-12-21 |
| EP0903980B1 (en) | 2000-11-15 |
| AU6224596A (en) | 1998-01-07 |
| DE69610998T2 (en) | 2001-05-31 |
| EP0903980A1 (en) | 1999-03-31 |
| JP2000511778A (en) | 2000-09-12 |
| US6405672B1 (en) | 2002-06-18 |
| WO1997047187A1 (en) | 1997-12-18 |
Similar Documents
| Publication | Publication Date | Title |
|---|---|---|
| JP3856476B2 (en) | System and method for monitoring the physical condition of livestock | |
| Firk et al. | Automation of oestrus detection in dairy cows: a review | |
| Thorup et al. | Lameness detection via leg-mounted accelerometers on dairy cows on four commercial farms | |
| AU2011218640B2 (en) | Detection apparatus | |
| US10761107B2 (en) | Apparatus and method for detecting disease in dairy animals | |
| CA2692699C (en) | Method for detecting oestrus behaviour of a milking animal | |
| EP3468351B1 (en) | A livestock management system and method of operation | |
| Firk et al. | Improving oestrus detection by combination of activity measurements with information about previous oestrus cases | |
| CN114051377B (en) | Animal weight determination based on 3D imaging | |
| EP1552737B1 (en) | Milking method and apparatus | |
| JP4229757B2 (en) | Estrus discovery method and apparatus for dairy cows | |
| US10278675B2 (en) | Implantable estrus detection devices, systems, and methods | |
| WO2019117707A1 (en) | Dairy animal monitoring system with stress reduction means | |
| CN114521106B (en) | Automatic milking system and method for determining the health status of an animal | |
| JP7080390B1 (en) | Drinking status identification device, drinking status identification program and storage medium | |
| NZ586888A (en) | Apparatus for the detection of health conditions and oestrus in milking animals using temperature sensors | |
| EP2458976A1 (en) | Method of and device for generating an attention indication for a dairy animal | |
| NL9400527A (en) | Device for the automatic analysis of animal data | |
| CN117281062A (en) | Safety control system for milking cows for livestock | |
| De Mol et al. | Detection model for oestrus and mastitis in cows milked in an automatic milking system |
Legal Events
| Date | Code | Title | Description |
|---|---|---|---|
| A711 | Notification of change in applicant |
Free format text: JAPANESE INTERMEDIATE CODE: A711 Effective date: 20050126 |
|
| A72 | Notification of change in name of applicant |
Free format text: JAPANESE INTERMEDIATE CODE: A721 Effective date: 20050126 |
|
| A131 | Notification of reasons for refusal |
Free format text: JAPANESE INTERMEDIATE CODE: A131 Effective date: 20050621 |
|
| A601 | Written request for extension of time |
Free format text: JAPANESE INTERMEDIATE CODE: A601 Effective date: 20050921 |
|
| A602 | Written permission of extension of time |
Free format text: JAPANESE INTERMEDIATE CODE: A602 Effective date: 20051031 |
|
| A313 | Final decision of rejection without a dissenting response from the applicant |
Free format text: JAPANESE INTERMEDIATE CODE: A313 Effective date: 20060206 |
|
| A131 | Notification of reasons for refusal |
Free format text: JAPANESE INTERMEDIATE CODE: A131 Effective date: 20060314 |
|
| A521 | Request for written amendment filed |
Free format text: JAPANESE INTERMEDIATE CODE: A523 Effective date: 20060518 |
|
| TRDD | Decision of grant or rejection written | ||
| A01 | Written decision to grant a patent or to grant a registration (utility model) |
Free format text: JAPANESE INTERMEDIATE CODE: A01 Effective date: 20060815 |
|
| A61 | First payment of annual fees (during grant procedure) |
Free format text: JAPANESE INTERMEDIATE CODE: A61 Effective date: 20060912 |
|
| R150 | Certificate of patent or registration of utility model |
Free format text: JAPANESE INTERMEDIATE CODE: R150 |
|
| FPAY | Renewal fee payment (event date is renewal date of database) |
Free format text: PAYMENT UNTIL: 20100922 Year of fee payment: 4 |
|
| LAPS | Cancellation because of no payment of annual fees |