JP3820144B2 - Signal evaluation apparatus and signal evaluation method - Google Patents
Signal evaluation apparatus and signal evaluation method Download PDFInfo
- Publication number
- JP3820144B2 JP3820144B2 JP2001378485A JP2001378485A JP3820144B2 JP 3820144 B2 JP3820144 B2 JP 3820144B2 JP 2001378485 A JP2001378485 A JP 2001378485A JP 2001378485 A JP2001378485 A JP 2001378485A JP 3820144 B2 JP3820144 B2 JP 3820144B2
- Authority
- JP
- Japan
- Prior art keywords
- signal
- relative frequency
- value
- relative
- frequency
- Prior art date
- Legal status (The legal status is an assumption and is not a legal conclusion. Google has not performed a legal analysis and makes no representation as to the accuracy of the status listed.)
- Expired - Fee Related
Links
Images


Description
【0001】
【発明の属する技術分野】
この発明は、PRML(Partial Response Maximum Likelihood)方式の再生信号の品質を評価する信号評価装置および信号評価方法に関する。
【0002】
【従来の技術】
従来、信号評価装置としては、光ディスクの再生信号品質の評価値としてジッタが用いられることが多かったが、近年、より高密度記録を実現するためのデータ検出方式としてPRML方式が採用されつつあり、このような状況においては、時間軸方向のばらつきを示すジッタは評価値として適当ではない。また、PRMLによるデータ検出結果のビットエラーレートを評価値として用いることも行われているが、必要な測定サンプルビット数が多い点や、ディスクのキズなどに起因するディフェクトの影響を受けやすい点などの短所が多い。
【0003】
このような背景において、SAM(Sequenced Amplitude Margin)と呼ばれる再生信号品質の評価方法が提案されている(T.Perkins, "A Window Margin Like Procedure for Evaluating PRML Channel Performance";IEEE Transactions on Magnetics, Vol.31, No2, 1995, p1109-1114)。
【0004】
図8〜図10を用いてSAMの概念を説明する。ここでは(1,7)RLL(Run Length Limited)符号で記録されたビット列の再生信号をPR(1,2,1)特性に基づいてPRML検出する場合について説明する。
【0005】
上記PR(1,2,1)特性に従う歪みおよびノイズのない理想的な1Tマークの再生信号波形は、図8で示すようにチャネルクロック毎のサンプルレベル比が1:2:1になる。また、2T以上のマークの再生信号波形については、この1Tマークの再生信号波形の重ね合わせによって求められ、例えば2Tマークなら1:3:3:1に、3Tマークなら1:3:4:3:1に、4Tマークなら1:3:4:4:3:1になる。こうして任意のビット列について理想的な再生信号波形が想定され、理想的なサンプルレベルとしては、0、1、2、3、4の5レベルをとることになる。ここで、便宜上、最大振幅が±1になるようにサンプルレベルを正規化する。このとき、理想的なサンプルレベルは、−1、−0.5、0、+0.5、+1の5レベルとなる。
【0006】
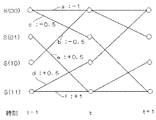
上記信号評価装置では、PRML復号を具体的に実現する手法としてビタビ復号を用いる。このビタビ復号において、図9に示すトレリス線図を考える。図9においてS(00)、S(01)、S(10)、S(11)は状態を表し、例えば状態S(00)は前ビットが0で現在ビットが0であったことを示している。また、状態と状態を結ぶ線は「ブランチ」と呼ばれ、状態遷移を表している。例えば、S(00)→S(01)のブランチによって「001」なるビット列を表すことができる。図9では各ブランチの識別子としてa〜fの各文字をあてており、その横に、各状態遷移において期待される理想波形レベルを附している。例えば、aは「000」なるビット列を表すので−1、bは「100」なるビット列を表すので−0.5が理想レベルである。ここで、S(01)→S(10)およびS(10)→S(01)なるブランチが存在しないのは、(1,7)RLL符号ではd=1のランレングス制限により「010」,「101」なるビット列があり得ないことを反映している。
【0007】
上記トレリス線図において、任意の状態から任意の状態を経て生成される全てのブランチの組み合わせ(これを「パス」と呼ぶ)を考えることは、全てのあり得るビット列を考えることに相当する。よって、全てのパスについて期待される理想波形と、実際に光記録媒体から再生した再生波形を比べて、波形が最も近い、すなわちユークリッド距離が最も小さい理想波形を持つパスを探索すれば、最も確からしい最尤パスを正解パスとして決定することができる。
【0008】
次に、トレリス線図を用いたビタビ復号の手順を具体的に説明する。任意の時刻において、状態S(00)とS(11)には2本のパスが合流し、S(01)とS(10)には1本のパスが合流する。2本のパスが合流する状態S(00)とS(11)について、各パスの理想波形と再生信号波形とのユークリッド距離が小さい方を生き残りパスとして残すことにすれば、任意の時刻において、4つの各状態に至るパスが各1本ずつ、計4本のパスが残ることになる。パスの理想波形と再生信号波形とのユークリッド距離の二乗は「パスメトリック」と呼ばれ、ブランチの理想波形のサンプルレベルと再生波形のサンプルレベルとの差の二乗として求められるブランチメトリックを、パスを構成する全ブランチについて累積することによってパスメトリックを計算する。
【0009】
ここで時刻tにおける再生信号波形のサンプルレベルをX[t]とし、ブランチa、b、c、d、e、fの時刻tにおけるブランチメトリックそれぞれを、
Ba[t]、Bb[t]、Bc[t]、Bd[t]、Be[t]、Bf[t]
とし、時刻tにおける各状態S(00),S(01),S(10),S(11)への生き残りパスのパスメトリックそれぞれを、
M(00)[t]、M(01)[t]、M(10)[t]、M(11)[t]
とすると、ブランチメトリックは次の〔式2〕に従って計算され、パスメトリックは次の(式2)に従って計算される。M(00)[t]とM(11)[t]におけるパスメトリックが小さい方を選ぶ処理は、生き残りパスの決定に対応している。
【0010】
ブランチメトリックを求める〔式1〕
Ba[t]=(X[t]+1)2
Bb[t]=Bc[t]=(X[t]+0.5)2
Bd[t]=Be[t]=(X[t]−0.5)2
Bf[t]=(X[t]−1)2
生き残りのパスメトリックを求める〔式2〕
M(00)[t]=Min{M(00)[t-1]+Ba[t],M(10)[t-1]+Bb[t]}
M(01)[t]=M(00)[t-1]+Bc[t]
M(10)[t]=M(11)[t-1]+Bd[t]
M(11)[t]=Min{M(01)[t-1]+Be[t],M(11)[t-1]+Bf[t]}
( Min{m,n}= m(if m≦n): n(if m>n) )
【0011】
こうして再生信号波形のサンプル値が入力される毎に生き残りパスを決定する手順を繰り返していくと、パスメトリックが大きいパスが淘汰されていくため、次第にパスは1本に収束していく。これを正解パスとすることにより、元のデータビット列が正しく再生されることになる。
【0012】
ここで、ビタビ復号が正しく行われる条件を考えると、最終的に1本に収束していくパスが正解パスとなるためには、各時刻において生き残りパスを決定する過程で、正解パスのパスメトリックが、間違いパスであるもう一方のパスのパスメトリックよりも小さくなければならない。この条件は、次の〔式3〕のように表される。
【0013】
パスメトリック差を求める〔式3〕
正解ビット列が「・・・000」の場合、
ΔM=(M(01)[t-1]+Bb[t])− (M(00)[t-1]+Ba[t]) >0
正解ビット列が「・・・100」の場合、
ΔM=(M(00)[t-1]+Ba[t])− (M(01)[t-1]+Bb[t]) >0
正解ビット列が「・・・011」の場合、
ΔM=(M(11)[t-1]+Bf[t])− (M(01)[t-1]+Be[t]) >0
正解ビット列が「・・・111」の場合、
ΔM=(M(01)[t-1]+Be[t])− (M(11)[t-1]+Bf[t]) >0
正解ビット列が「・・・001」または「・・・110」の場合、
ΔM >0
(生き残りパスの決定は必ず正しく行われるため、常にΔM>0が成り立つ)
【0014】
上記〔式3〕において、ΔMは、生き残りを賭けて対決する2本のパスのパスメトリック差であり、このパスメトリック差を「SAM値」と呼ぶ。エラーが発生しないためには、
SAM値>0
である必要があり、またSAM値が大きい程エラーを起こしにくいことを意味している。
【0015】
さて、上記SAM値を用いてシステムの信頼性を評価するためには、各時刻毎に計算されるSAM値全体の分布状態をマクロ的に評価する必要がある。図10(a)は、実際に光磁気ディスクに記録した(1,7)RLL符号パターンの再生信号から求めたSAM値の度数分布を示すグラフである。この結果から分かるように、SAM値の度数分布は2つの山をもっている。これは、全再生信号に対してSAM値を求める場合、ビットパターンによって正解パスと間違いパスとのユークリッド距離が異なることに起因する。このため、図10(b)に示すように、(1,7)RLL符号列から求めたノイズの全くない理想的な再生信号におけるSAM値の度数分布は、
1.5、2.5、3.5、4.5、5、6、7、8、9
と離散的な複数の理想値をとる。このように理想値の度数が異なるのは、各理想値となるビットパターンの種類の数が異なるのに加え、(1,7)RLL符号列において各ビットパターンの出現頻度が異なっているためである。実際の再生信号には様々なノイズがのっているため、これらの理想値がばらつきを持ち、結果として図10(a)のように複数の分布が重なり合った分布形状となっている。SAM値の度数分布にはこのような特徴があり、正規分布とは大きく異なる分布であるため、単純にこの分布から標準偏差を求めてもビットエラーレートとの相関性は小さい。
【0016】
そこで、先に本出願人は、SAM値の度数分布について異なる2種類のしきい値により相対度数を求め、それらからビットエラーレートを計算して再生装置の信頼性を検査する手法を提案している。なお、この再生装置の信頼性を検査する手法は、この発明を理解しやすくするために説明するものであって、公知技術ではなく、従来技術ではない。
【0017】
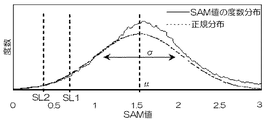
以下、この再生装置の信頼性を検査する手法を説明する。図10を用いて説明したように、SAM値の度数分布は、複数のSAM理想値がノイズによりばらつきを持つため、複数の分布が重なり合った分布形状となっているが、ノイズがホワイトノイズに近ければ個々の分布は正規分布に近似できるので、SAM理想値の最小値である1.5より小さい部分については、1.5に近い値を最頻値μとして持つ正規分布にほぼ近似できると考えられる。このとき、近似された正規分布のばらつきを表す標準偏差σとビットエラーレートBERは1対1に対応し、この関係は、次の〔式4〕により表される。図11は、実際の光ディスク再生装置におけるSAM値の度数分布の実測結果(実線)と、そのビットエラーレートに対応する標準偏差σの正規分布(点線)を重ね合わせたグラフである。
【数1】

上記〔式4〕の右辺の後半部分は、統計学において正規分布の確率密度関数の積分として求められる分布関数として知られており、最頻値μと標準偏差σで決まる正規分布について、0以下の部分の相対度数を表している。一方、原理的にSAM値<0となったときにエラービットが発生することから、ビットエラーレートBERは、SAM値の度数分布の総度数に対する0以下の部分の割合に等しいと考えられる。したがって、上記正規分布の0以下の相対度数に母数変換の係数Kを掛けた値はビットエラーレートに一致する。具体的には、SAM値の度数分布の総度数をN、この全測定ビット系列においてSAM理想値が最小、すなわち1.5となるパターン(このパターンのSAM値のみで生成した分布が約1.5を最頻値とする正規分布に近似される)の個数をnとしたとき、係数Kは、
K=n/N
により求められる。
【0019】
まず、SAM値の度数分布について、所定のしきい値SL1,SL2より小さい部分の相対度数R1’,R2’を実測する。そうすると、次の〔式5〕と〔式6〕の関係が成り立つため、この連立方程式を解けば、標準偏差σと最頻値μを計算により求めることができる。
【数2】
次に、求まった標準偏差σと最頻値μを〔式4〕に代入すれば、ビットエラーレートBERを計算することができる。
【0021】
【発明が解決しようとする課題】
ところで、上記信号評価装置では、2つの異なるしきい値により求めたSAM値の度数分布の相対度数からエラーレートを計算するとき、〔式5〕と〔式6〕で表される非常に複雑な方程式を解いたうえに、さらに〔式4〕を計算しなければならず、これをマイクロコンピュータ(以下、マイコンという)などを用いてソフトウェアにより計算するには極めて長い時間がかかってしまうという問題がある。
【0022】
そこで、この発明の目的は、簡単な回路構成でかつ短時間で信頼性の高い再生信号の品質評価ができる信号評価装置および信号評価方法を提供することにある。
【0023】
【課題を解決するための手段】
上記目的を達成するため、この発明の信号評価装置は、記録媒体を再生する再生手段と、上記再生手段により上記記録媒体から再生された再生信号のPRML復号過程においてトレリス線図の正解状態に入力される2本のパスのパスメトリック差を求めるパスメトリック差検出手段と、上記パスメトリック差の度数分布を第1のしきい値で区切った片側部分の相対度数である第1相対度数を求める第1相対度数検出手段と、上記パスメトリック差の度数分布を第2のしきい値で区切った片側部分の相対度数である第2相対度数を求める第2相対度数検出手段と、予め作成されたルックアップテーブルを参照することによって、上記第1相対度数検出手段により求められた第1相対度数および上記第2相対度数検出手段により求められた第2相対度数に基づいて再生信号の品質を評価する信号評価手段とを備えたことを特徴としている。
【0024】
上記構成の信号評価装置によれば、上記記録媒体からの再生信号のPRML復号過程においてトレリス線図の正解状態に入力される2本のパスのパスメトリック差の度数分布について、第1,第2のしきい値より例えば小さい部分の第1,第2相対度数に基づいて、上記パスメトリック差の度数分布の標準偏差と最頻値を求めることが可能である。このようにして求めたパスメトリック差の度数分布の標準偏差と最頻値を用いて、再生信号の品質を表す信号品質評価値(ビットエラーレート)が第1,第2相対度数の組み合わせ毎に得られ、その信号品質評価値を第1,第2相対度数の組み合わせ毎に登録したルックアップテーブルを予め作成する。そして、実際に再生信号の品質を評価するとき、上記パスメトリック差検出手段により求められたパスメトリック差の度数分布を第1のしきい値で区切った片側部分の相対度数である第1相対度数を上記第1相対度数検出手段により求めると共に、上記パスメトリック差の度数分布を第2のしきい値で区切った片側部分の相対度数である第2相対度数を第2相対度数検出手段により求める。そうして、上記第1相対度数検出手段により求められた第1相対度数および上記第2相対度数検出手段により求められた第2相対度数に基づいて、上記信号評価手段によって上記ルックアップテーブルを参照することにより再生信号の品質を評価する。したがって、パスメトリック差の度数分布の2つの相対度数に対応する再生信号品質を予め計算してルックアップテーブルとして作成することによって、装置のマイコンによって複雑な統計演算を実行する必要がなくなり、極めて短時間で簡単に信号品質を評価することができる。
【0025】
また、一実施形態の信号評価装置は、上記ルックアップテーブルは、上記第1相対度数を行見出しまたは列の見出しとし、上記第2相対度数を列見出しまたは行見出しとして、上記行見出しと上記列見出しに対応する信号品質評価値が登録された行列型テーブルであることを特徴としている。
【0026】
上記実施形態の信号評価装置によれば、例えば上記第1相対度数を行見出しとし、上記第2相対度数を列見出しとした場合、上記第1相対度数検出手段により求められた第1相対度数に最も近い値の行見出しと、上記第2相対度数検出手段により求められた第2相対度数に最も近い列見出しを探して、それらに対応する信号品質評価値を上記ルックアップテーブルから読み出すことによって、複雑な計算を行うことなく信号品質評価値を求めることができる。
【0027】
また、一実施形態の信号評価装置は、上記ルックアップテーブルが、上記第1相対度数毎に有効な範囲の上記第2相対度数が登録された配列型テーブルと、上記第1相対度数毎に有効な範囲の上記第2相対度数に対応する信号品質評価値が登録された配列型テーブルとの集合であることを特徴としている。
【0028】
上記実施形態の信号評価装置によれば、メモリ容量を大幅に節約することができると共に、同じ容量のメモリを用いる場合には、第1相対度数,第2相対度数の刻み幅をより小さくすることができるので、丸め誤差のさらに小さな信号品質評価値を得ることができる。
【0029】
また、一実施形態の信号評価装置は、上記ルックアップテーブルの上記第1相対度数または上記第2相対度数の少なくとも一方を指数関数的に変化させることを特徴としている。
【0030】
上記実施形態の信号評価装置によれば、上記ルックアップテーブルの第1相対度数または第2相対度数の少なくとも一方の刻み幅を指数関数的に変化させることによって、上記ルックアップテーブルに登録される信号品質評価値の変化率をほぼ均等にすることができるため、信号品質評価値の丸め誤差を小さくすることができる。
【0031】
また、一実施形態の信号評価装置は、上記ルックアップテーブルは、所定の母数に対するエラー個数を信号品質評価値としており、上記エラー個数の範囲が1バイト整数の範囲に収まるように所定の母数が決められていることを特徴としている。
【0032】
上記実施形態の信号評価装置によれば、1バイト整数の範囲に収まるような所定の母数に対するエラー個数を信号品質評価値として上記ルックアップテーブルを作成することによって、メモリ容量を小さく抑えることができる。
【0033】
また、一実施形態の信号評価装置は、上記ルックアップテーブルは、上記信号品質評価値の想定範囲と上記パスメトリック差の度数分布の最頻値の想定範囲とから求められた上記第1相対度数および上記第2相対度数の変動範囲に対応して作成されていることを特徴としている。
【0034】
上記実施形態の信号評価装置によれば、上記信号品質評価値の想定範囲とパスメトリック差の度数分布の最頻値の想定範囲とから2つの第1,第2相対度数の変動範囲を限定してルックアップテーブルを作成することによって、実装するメモリ容量を必要最小限とすることができる。
【0035】
また、一実施形態の信号評価装置は、上記ルックアップテーブルは、上記信号品質評価値の変化率がほぼ均等となるように上記第1相対度数または上記第2相対度数の少なくとも一方の見出しが設定されていることを特徴としている。
【0036】
上記実施形態の信号評価装置によれば、上記第1相対度数または第2相対度数の少なくとも一方の見出しを上記信号品質評価値の変化率がほぼ均等となるように設定することによって、信号品質評価値の丸め誤差を小さくすることができる。
【0037】
また、この発明の信号評価方法は、情報を記録した媒体から再生される再生信号に基づいて、その信号をPRML復号過程においてトレリす線図の正解状態に入力する2本のパスのパスメトリック差を求めるステップと、上記パスメトリック差が第1のしきい値よりも小さいときまたは大きいときに第1の累積値をカウントするステップと、上記パスメトリック差を第2のしきい値よりも小さいときまたは大きいときに第2の累積値をカウントするステップと、上記第1,第2の累積値に基づいて、上記第1,第2の累積値に関連付けて信号品質評価値を登録することにより予め作成されたルックアップテーブルを参照して上記再生信号の信号品質評価値を読み出すステップとを有することを特徴とする信号評価方法。特徴としている。
【0038】
上記信号評価方法によれば、情報を記録した媒体から再生される再生信号に基づいて、その信号をPRML復号過程においてトレリス線図の正解状態に入力する2本のパスのパスメトリック差を求め、そのパスメトリック差が第1のしきい値よりも小さいときに第1の累積値(パスメトリック差の度数分布を第1のしきい値で区切った片側部分の相対度数に相当)をカウントすると共に、そのパスメトリック差を第2のしきい値よりも小さいときに第2の累積値(パスメトリック差の度数分布を第2のしきい値で区切った片側部分の相対度数に相当)をカウントして、それぞれカウントされた第1,第2の累積値に基づいて、第1,第2の累積値に関連付けられて予め作成されたルックアップテーブルを参照して上記再生信号の評価値を読み出す。そうすることによって、複雑な統計演算を実行する必要がなくなり、極めて短時間で簡単に信号品質を評価することができる。
【0039】
【発明の実施の形態】
以下、この発明の信号評価装置および信号評価方法を図示の実施の形態により詳細に説明する。
【0040】
(第1実施形態)
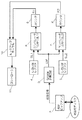
図1はこの発明の第1実施形態の信号評価装置および信号評価方法を用いた光磁気ディスク再生装置の構成図である。
【0041】
この光磁気ディスク再生装置は、図1に示すように、記録媒体としての光磁気ディスク1と、再生手段としての光学ピックアップ2と、パスメトリック差検出手段としてのSAM値計算回路3と、しきい値レジスタ4,7と、コンパレータ5,8と、カウンタ6,9と、ルックアップテーブル10と、コントローラ11とを備えている。上記しきい値レジスタ4とコンパレータ5とカウンタ6で第1相対度数検出手段を構成すると共に、しきい値レジスタ7とコンパレータ8とカウンタ9で第2相対度数検出手段を構成している。また、上記ルックアップテーブル10とコントローラ11で信号評価手段を構成している。
【0042】
次に、上記構成の光磁気ディスク再生装置における再生動作について説明する。
【0043】
まず、光学ピックアップ2から光磁気ディスク1上に光ビームが照射されると、その反射光が光学ピックアップ2に入力され、電気信号に変換されて再生信号が出力される。この再生信号は、SAM値計算回路3に入力され、SAM値計算回路3ではパスメトリック差の計算が行われる。すなわち、上記〔式2〕,(式2)および〔式3〕を用いて、パスメトリック差を求める。
【0044】
上記SAM値計算回路3から出力されたパスメトリック差すなわちSAM値ΔMは、しきい値レジスタ4に記憶された所定しきい値SL1とコンパレータ5により比較される。上記コンパレータ5は、ΔM<SL1とき、すなわちSAM値がしきい値SL1より小さいときにパルスを1つ出力する。このパルスはカウンタ6に入力されるので、カウンタ6の出力R1はしきい値SL1より小さいSAM値の個数(第1相対度数)を表している。SAM値を計算する総ビット数を固定とすれば、このSAM値の個数R1は、SAM値の度数分布の相対度数(全度数に占める割合)R1’と同等であると言える。
【0045】
一方、SAM値ΔMは、しきい値レジスタ7に記憶された所定しきい値SL2(ただし、SL2<SL1とする)ともコンパレータ8により比較されるので、同様にカウンタ9はSAM値の度数分布のしきい値SL2より小さい部分の相対度数R2’と同等なSAM値の個数R2(第2相対度数)を出力している。こうして求められたSAM値の個数R1とR2に基づき、コントローラ11によりルックアップテーブル10を参照することによって、再生信号の品質を評価することができる。
【0046】
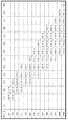
また、図2は半導体メモリによって構成されるルックアップテーブル10の内容を例示する模式図である。以下、図2を用いて、コントローラ11がルックアップテーブル10を参照して再生信号の品質を評価する手順についてさらに詳細に説明する。
【0047】
上記ルックアップテーブル10(図1に示す)は、図2に示すように、14行14列の行列型のテーブルであり、行見出しがSAM値の個数R1、列見出しがSAM値の個数R2となっている。ただし、総ビット数は50000ビットであり、見出しの数値としては、
R1=50000×R1’
R2=50000×R2’
ということになる。また、しきい値SL1,SL2は、
SL1=0.6
SL2=0.4
である。各(R1,R2)の組み合わせに対する登録値としては、SAM値の個数R1とR2から〔式4〕〜〔式6〕を用いて予め計算しておいたビットエラーレートBERを記憶しておく。なお、図2では、ビットエラーレートBERの表示形式「E−n」(n=1,2,3,…)は、「×10-n」のことである(図3,図4,図6も同様)。
【0048】
上記コントローラ11は、SAM値の個数R1とR2が入力されると、SAM値の個数R1に最も近い値の行見出しと、SAM値の個数R2に最も近い列見出しを探して、それらに対応する登録されたビットエラーレートBERを読み出すことによって、複雑な計算を行うことなくビットエラーレートBERを求めることができる。例えば、SAM値の個数R1として500、SAM値の個数R2として200が入力された場合、(504,206)に対応する登録値である1.7×10⁻⁴(図2では「1.7E−4」)がビットエラーレートBERとして簡単に求められる。
【0049】
次に、具体的にルックアップテーブル10を作成する方法について説明する。まず、信号評価値の想定範囲とSAM値の度数分布の最頻値μの想定範囲を決める。例えば、再生用のレーザパワーの最適値を求める所謂テストリードに適用する場合、その基準ビットエラーレートBERとして5×10⁻⁴を想定するならば、信号評価値としては1×10⁻⁴〜1×10⁻³程度の範囲が正確に計算できればよいと考えられる。また、再生信号のノイズがホワイトノイズであれば最頻値は1.5となるので、有色ノイズによる変動を±0.2と想定すれば、最頻値μは1.3〜1.7の範囲となる。原理的に、ビットエラーレートBERが大きくなるほどSAM値の個数R1,R2は大きくなり、最頻値μが大きくなるほどSAM値の個数R1,R2は小さくなるので、SAM値の個数R1,R2の最小値は、上記〔式5〕と〔式6〕に、
BER=1×10⁻⁴、μ=1.7
を代入すれば計算でき、SAM値の個数R1は233、SAM値の個数R2は75となる。同様に、SAM値の個数R1,R2の最大値は、上記〔式5〕と〔式6〕に、
BER=1×10⁻³、μ=1.3
代入して計算でき、SAM値の個数R1が1241、R2が501となる。これらから、ルックアップテーブル10は、
R1:233〜1241
R2:75〜501
の範囲について作成すればよいことになる。テーブルサイズが14×14であれば、これらをそれぞれ14ステップに等分割した値について上記〔式4〕〜〔式6〕からビットエラーレートBERを予め計算して、その値を登録値としてメモリに記憶すればよい。
【0050】
このように信号評価値と最頻値の想定範囲を決めた後、それに対応する相対度数の変化範囲に限定してルックアップテーブルを作成することによって、必要最小限のメモリ容量で実装することができる。
【0051】
なお、ここでテーブルサイズを14×14としたのは説明の便宜のためであるが、テーブルサイズを大きくすればするほど、SAM値の個数R1とR2の刻み幅を小さくできるので、より正確にビットエラーレートBERを求めることができる。実際には、システム設計上許容できるメモリ容量に応じて、もっと大きなテーブルを用意すればよい。
【0052】
また、ルックアップテーブルの一部に登録が空白になっている部分があるが、これはR1≦R2という、あり得ない組み合わせの場合に相当している。
【0053】
以上のように、上記光磁気ディスク再生装置においては、従来のように〔式4〕〜〔式6〕を用いて複雑な計算を行う構成を必要としないため、簡単かつ短時間で再生信号品質を評価することが可能となる。
【0054】
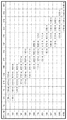
なお、上記第1実施形態では、ルックアップテーブル10の行見出しと列見出しの刻み幅をSAM値の個数R1とR2の想定範囲を等分割したが、この場合に次のような課題がある。図3は、図2のルックアップテーブル10のうち、必要なビットエラーレートBERの評価範囲である1×10⁻⁴〜1×10⁻³の部分だけを抜き出したものである。この図3から分かるように、SAM値の個数R1,R2が大きい部分では、隣り合うビットエラーレートBERの変化率は小さいが、SAM値の個数R1,R2が小さい部分では、隣り合うビットエラーレートBERの変化率が大き過ぎるために、丸め誤差が極めて大きくなってしまう危険性がある。
【0055】
このような課題を解決するために、SAM値の個数R1,R2が小さいほど刻み幅が小さくなるように、かつ、SAM値の個数R1,R2が大きいほど刻み幅が大きくなるように、SAM値の個数R1とR2の刻み幅を指数関数的に変化させればよい。例えば、図4はi(i=1〜14)に対してSAM値の個数R1,R2の想定範囲をそれぞれ次の〔式7〕と〔式8〕に従って14個に分割して作成したルックアップテーブルの内容を示す模式図であり、ビットエラーレートBERの変化幅がほぼ均等になっていることが分かる。これにより、ビットエラーレートBERの丸め誤差を小さくすることができる。
R1[i] = 203×exp(i/7.7) ……… 〔式7〕
R2[i] = 64×exp(i/6.8) ……… 〔式8〕
【0056】
なお、上記第1実施形態では、ルックアップテーブル10の登録値をビットエラーレートBERそのものとしたが、ルックアップテーブル10の実装形態が半導体メモリであることを考えると、テーブルサイズおよびデータ操作性の観点から、登録値は1バイトで表現できる整数とすることが望ましい。したがって、想定ビットエラーレートBER範囲に所定の母数をかけた数値の範囲が0〜255に収まるように所定の母数を決めればよい。例えば、上記光磁気ディスク再生装置では、想定ビットエラーレートBER範囲が1×10⁻⁴〜1×10⁻³なので、所定の母数を250000とすれば登録値の範囲は25〜250となり、1バイトに収めることができる。図5はこの場合のルックアップテーブル10の内容の模式図を示している。
【0057】
(第2実施形態)
次に、この発明の第2実施形態の信号評価装置および信号評価方法を用いた光磁気ディスク再生装置について、図4,図6および図7を用いて説明する。なお、この第2実施形態の光磁気ディスク再生装置は、ルックアップテーブル10の内容以外は第1実施形態の図1に示す光磁気ディスク再生装置と同一の構成をしており、説明を省略し、図1を援用する。
【0058】
図4は既に説明したように、SAM値の個数R1,R2を指数関数的に変化させて作成したルックアップテーブル10(図1に示す)の内容を示すが、有効な想定ビットエラーレートBER範囲は平行四辺形状であるため、14×14=196のテーブルサイズに対して、実際に有効なデータ量はもっと少ない。これは、ルックアップテーブル10を、SAM値の個数R1とR2を見出しとする行列型のテーブルで実現しているためである。
【0059】
そこで、図6に示すように、ルックアップテーブル10を2つの配列型テーブルの集合によって構成する。図6(a)は、各SAM値の個数R1に対して、有効なビットエラーレートBER範囲に対応するSAM値の個数R2を登録値とする配列型テーブルの集合である。例えば、R1=300に対して有効なビットエラーレートBER範囲である1×10⁻⁴〜1×10⁻³に対応するSAM値の個数R2の範囲は、図4から99、115、134、155の4つであるので、これを順に並べた配列をR1=300に対する配列として作成する。このようにして、想定する14種類のSAM値の個数R1に対して同様に配列を作成してできたものがテーブルAである。
【0060】
また、図6(b)は、各SAM値の個数R1に対して、テーブルAの配列に登録されたSAM値の個数R2とから求められるビットエラーレートBERを登録値とする配列型テーブルの集合である。例えば、R1=300に対して、テーブルAのR1=300の配列に登録された99、115、134、155のそれぞれから求められるビットエラーレートBERは、
1.4×10⁻⁴、 2.4×10⁻⁴、 4.1×10⁻⁴、 6.9×10⁻⁴
の4つであるので、これを順に並べた配列をR1=300に対する配列として作成する。このようにして、想定する14種類のSAM値の個数R1に対して同様に配列を作成してできたものがテーブルBである。
【0061】
こうして作成されたルックアップテーブル10を参照して、SAM値の個数R1とR2からビットエラーレートBERを求める手順を、図6,図7に示すフローチャートを用いて説明する。
【0062】
まず、ステップS1にて、SAM値の相対度数からしきい値SL1以下の相対度数(相対度数に総ビット数をかけた値)R1としきい値SL2以下の相対度数(相対度数に総ビット数をかけた値)R2を求める。例えば、R1=500、R2=200であったとする。
次に、ステップS2に進み、求められたSAM値の個数R1に最も近い見出しをテーブルAから探して、対応する配列である7行目の配列(見出しは504)を選び出す。
続いて、ステップS3に進み、選んだ配列の登録値からSAM値の個数R2に最も近い値、すなわち208(配列内位置3番目)を探し出す。
さらに、ステップS4に進み、SAM値の個数R1に最も近い見出しを今度はテーブルBから探して、対応する配列である7行目の配列(見出しは504)を選び出す。
最後に、ステップS5に進み、その配列について、ステップS3で求めたSAM値の個数R2に最も近い値の配列内位置である3番目の登録値を読み出すことによって、対応するビットエラーレートBER=5.0×10⁻⁴を(図6(b)では「5.0E−4」)得ることができる。
【0063】
このルックアップテーブル10のサイズは、テーブルAが14×5=70であり、テーブルBも14×5=70であるので、合わせて140のメモリ容量となり、SAM値の個数R1とR2を見出しとする行列型テーブルとした場合のメモリ容量196よりも大幅に小さくできることが分かる。また、同じ容量のメモリを用いる場合には、SAM値の個数R1,R2の刻み幅をより小さくすることができるので、丸め誤差のさらに小さなビットエラーレートBERの計算が実現できる。
【0064】
なお、上記第1,第2実施形態では、信号評価装置および信号評価方法を用いた光磁気ディスク再生装置について説明したが、これに限られるものではなく、PRML方式の信号再生を行う装置において等しくその効果を発揮すべきものである。すなわち、相変化方式の光ディスク装置、磁気記録装置、通信データ受信装置など、全てこの発明が適用可能である。
【0065】
また、上記第1,第2実施形態では、パスメトリック差であるSAM値の度数分布について、第1,第2のしきい値SL1,SL2より小さい部分の相対度数R1’,R2’を実測して、〔式5〕,〔式6〕の連立方程式を解いて、標準偏差σと最頻値μを計算により求めたが、パスメトリック差の度数分布を第1のしきい値よりも大きな相対度数と、上記パスメトリック差の度数分布を第2のしきい値よりも大きな相対度数に基づいて、標準偏差σと最頻値μを求めてもよい。また、パスメトリック差の度数分布を第1のしきい値,第2のしきい値の一方よりも小さい相対度数および他方よりも大きい相対度数に基づいて、標準偏差σと最頻値μを求めてもよい。
【0066】
【発明の効果】
以上より明らかなように、この発明の信号評価装置および信号評価方法によれば、測定されたパスメトリック差(SAM値)の度数分布の2つの相対度数に対応する信号品質評価値を予め計算してルックアップテーブルとして作成することによって、装置のマイコンによって複雑な統計演算を実行する必要がなくなり、極めて短時間で簡単に信号品質を評価することができる。
【0067】
また、信号品質評価値の想定範囲とパスメトリック差(SAM値)の度数分布の最頻値の想定範囲とから2つの相対度数の変動範囲を限定してルックアップテーブルを作成することによって、実装するメモリ容量を必要最小限とすることができる。
【0068】
さらに、ルックアップテーブルを作成する相対度数の刻み幅を指数関数的に変化させることによって、テーブルに登録される信号品質評価値(ビットエラーレートBER)の変化率をほぼ均等にすることができるため、信号品質評価値の丸め誤差を小さくすることができる。
【0069】
さらに、1バイト整数の範囲に収まるような所定の母数に対するエラー個数を信号品質評価値としてルックアップテーブルを作成することによって、メモリ容量を小さく抑えることができる。
【0070】
さらに、第1相対度数毎に有効な範囲の第2相対度数が登録された配列型テーブルと、第1相対度数毎に有効な範囲の第2相対度数に対応する信号品質評価値が登録された配列型テーブルとの集合であるルックアップテーブルを構成することによって、メモリ容量を大幅に節約することができると共に、同じ容量のメモリを用いる場合には、第1相対度数,第2相対度数の刻み幅をより小さくすることができるので、丸め誤差のさらに小さな信号品質評価値の計算が可能となる。
【図面の簡単な説明】
【図1】 図1はこの発明の第1実施形態の信号評価装置および信号評価方法を用いた光磁気ディスク再生装置の構成図である。
【図2】 図2は上記再生装置のルックアップテーブルの内容を示す模式図である。
【図3】 図3は有効データのみを登録するルックアップテーブルの内容を示す模式図である。
【図4】 図4は見出しを指数関数的に変化させたルックアップテーブルの内容を示す模式図である。
【図5】 図5は登録値を1ビットの整数としたルックアップテーブルの内容を示す模式図である。
【図6】 図6はこの発明の第2実施形態の信号評価装置および信号評価方法を用いた光磁気ディスク再生装置のルックアップテーブルの内容を示す模式図である。
【図7】 図7は上記光磁気ディスク再生装置の動作を示すフローチャートである。
【図8】 図8はPR(1,2,1)特性に従う再生信号波形の模式図である。
【図9】 図9はビタビ復号におけるトレリス線図を示す模式図である。
【図10】 図10は実測波形と理想波形でのSAM値の度数分布を示すグラフである。
【図11】 図11はSAM値の度数分布の実測結果とそのビットエラーレートに対応する正規分布を重ね合わせたグラフである。
【符号の説明】
1…光磁気ディスク、
2…光学ピックアップ、
3…SAM値計算回路、
4,7…しきい値レジスタ、
5,8…コンパレータ、
6,9…カウンタ、
10…ルックアップテーブル、
11…コントローラ。[0001]
BACKGROUND OF THE INVENTION
The present invention relates to a signal evaluation apparatus and a signal evaluation method for evaluating the quality of a reproduction signal of PRML (Partial Response Maximum Likelihood) method.
[0002]
[Prior art]
Conventionally, as a signal evaluation apparatus, jitter is often used as an evaluation value of a reproduction signal quality of an optical disc. However, in recent years, a PRML method is being adopted as a data detection method for realizing higher density recording. In such a situation, jitter indicating variation in the time axis direction is not appropriate as an evaluation value. Although the bit error rate of the data detection result by PRML is also used as an evaluation value, the number of necessary measurement sample bits is large, the point is easily affected by defects caused by disc scratches, etc. There are many disadvantages.
[0003]
Against this background, an evaluation method of reproduction signal quality called SAM (Sequenced Amplitude Margin) has been proposed (T. Perkins, “A Window Margin Like Procedure for Evaluating PRML Channel Performance”; IEEE Transactions on Magnetics, Vol. 31, No2, 1995, p1109-1114).
[0004]
The concept of SAM will be described with reference to FIGS. Here, a case will be described in which PRML detection is performed on a reproduction signal of a bit string recorded with a (1, 7) RLL (Run Length Limited) code based on the PR (1, 2, 1) characteristic.
[0005]
The ideal 1T mark reproduction signal waveform free from distortion and noise according to the PR (1,2,1) characteristic has a sample level ratio of 1: 2: 1 for each channel clock as shown in FIG. Further, the reproduction signal waveform of a mark of 2T or more is obtained by superimposing the reproduction signal waveforms of this 1T mark, for example, 1: 3: 3: 1 for a 2T mark and 1: 3: 4: 3 for a 3T mark. 1: 4T mark becomes 1: 3: 4: 4: 3: 1. In this way, an ideal reproduction signal waveform is assumed for an arbitrary bit string, and five levels of 0, 1, 2, 3, 4 are taken as ideal sample levels. Here, for convenience, the sample level is normalized so that the maximum amplitude becomes ± 1. At this time, ideal sample levels are five levels of −1, −0.5, 0, +0.5, and +1.
[0006]
In the signal evaluation apparatus, Viterbi decoding is used as a method for specifically realizing PRML decoding. In this Viterbi decoding, consider the trellis diagram shown in FIG. In FIG. 9, S (00), S (01), S (10), and S (11) represent states. For example, the state S (00) indicates that the previous bit is 0 and the current bit is 0. Yes. A line connecting the states is called a “branch” and represents a state transition. For example, a bit string “001” can be represented by a branch of S (00) → S (01). In FIG. 9, letters a to f are assigned as identifiers of the respective branches, and the ideal waveform level expected in each state transition is attached to the side. For example, since a represents a bit string “000”, −1, and b represents a bit string “100”, so −0.5 is an ideal level. Here, the branches S (01) → S (10) and S (10) → S (01) do not exist because the run length restriction of d = 1 in the (1,7) RLL code is “010”, This reflects that a bit string “101” cannot exist.
[0007]
In the trellis diagram, considering all combinations of branches (referred to as “paths”) generated from an arbitrary state through an arbitrary state corresponds to considering all possible bit strings. Therefore, comparing the ideal waveform expected for all paths with the reproduced waveform actually reproduced from the optical recording medium, it is most reliable to search for the path having the ideal waveform with the closest waveform, that is, the smallest Euclidean distance. The most likely path can be determined as the correct path.
[0008]
Next, the procedure of Viterbi decoding using a trellis diagram will be specifically described. At an arbitrary time, two paths merge in states S (00) and S (11), and one path merges in S (01) and S (10). In the states S (00) and S (11) where the two paths merge, if the Euclidean distance between the ideal waveform and the reproduced signal waveform of each path is left as a surviving path, at any time, A total of four paths remain, one for each of the four states. The square of the Euclidean distance between the ideal waveform of the path and the playback signal waveform is called the “path metric”, and the branch metric calculated as the square of the difference between the sample level of the ideal waveform of the branch and the sample level of the playback waveform is The path metric is calculated by accumulating for all the branches that make up.
[0009]
Here, the sample level of the reproduction signal waveform at time t is X [t], and the branch metrics at time t of branches a, b, c, d, e, and f are
Ba [t], Bb [t], Bc [t], Bd [t], Be [t], Bf [t]
And each path metric of the surviving path to each state S (00), S (01), S (10), S (11) at time t,
M (00) [t], M (01) [t], M (10) [t], M (11) [t]
Then, the branch metric is calculated according to the following [Expression 2], and the path metric is calculated according to the following (Expression 2). The process of selecting the smaller path metric in M (00) [t] and M (11) [t] corresponds to the determination of the surviving path.
[0010]
Find branch metric [Equation 1]
Ba [t] = (X [t] +1)2
Bb [t] = Bc [t] = (X [t] +0.5)2
Bd [t] = Be [t] = (X [t] −0.5)2
Bf [t] = (X [t] -1)2
Find the surviving path metric [Equation 2]
M (00) [t] = Min {M (00) [t-1] + Ba [t], M (10) [t-1] + Bb [t]}
M (01) [t] = M (00) [t-1] + Bc [t]
M (10) [t] = M (11) [t-1] + Bd [t]
M (11) [t] = Min {M (01) [t-1] + Be [t], M (11) [t-1] + Bf [t]}
(Min {m, n} = m (if m ≦ n): n (if m> n))
[0011]
When the procedure for determining the surviving path is repeated each time the sample value of the reproduction signal waveform is input in this way, paths with a large path metric are deceived, so that the paths gradually converge to one. By making this a correct path, the original data bit string is correctly reproduced.
[0012]
Here, considering the conditions under which Viterbi decoding is performed correctly, the path metric of the correct path is determined in the process of determining the surviving path at each time in order for the path that converges to one finally becomes the correct path. Must be smaller than the path metric of the other path that is the wrong path. This condition is expressed as the following [Equation 3].
[0013]
Find path metric difference [Equation 3]
When the correct bit string is “... 000”,
ΔM = (M (01) [t−1] + Bb [t]) − (M (00) [t−1] + Ba [t])> 0
When the correct bit string is “... 100”,
ΔM = (M (00) [t−1] + Ba [t]) − (M (01) [t−1] + Bb [t])> 0
When the correct bit string is “... 011”,
ΔM = (M (11) [t−1] + Bf [t]) − (M (01) [t−1] + Be [t])> 0
If the correct bit string is “... 111”,
ΔM = (M (01) [t−1] + Be [t]) − (M (11) [t−1] + Bf [t])> 0
If the correct bit string is "... 001" or "... 110"
ΔM> 0
(Since the determination of the survival path is always performed correctly, ΔM> 0 always holds)
[0014]
In the above [Expression 3], ΔM is a path metric difference between two paths that confront the survivors, and this path metric difference is referred to as a “SAM value”. To avoid errors,
SAM value> 0
This means that the larger the SAM value, the less likely an error occurs.
[0015]
Now, in order to evaluate the reliability of the system using the SAM value, it is necessary to evaluate macroscopically the distribution state of the entire SAM value calculated at each time. FIG. 10A is a graph showing the frequency distribution of the SAM value obtained from the reproduction signal of the (1,7) RLL code pattern actually recorded on the magneto-optical disk. As can be seen from this result, the frequency distribution of the SAM value has two peaks. This is due to the fact that the Euclidean distance between the correct path and the incorrect path differs depending on the bit pattern when obtaining the SAM value for all reproduced signals. For this reason, as shown in FIG. 10B, the frequency distribution of the SAM value in an ideal reproduction signal having no noise obtained from the (1,7) RLL code string is
1.5, 2.5, 3.5, 4.5, 5, 6, 7, 8, 9
And take multiple discrete ideal values. The frequency of the ideal value is different because the frequency of appearance of each bit pattern is different in the (1,7) RLL code string in addition to the number of types of bit patterns that are each ideal value. is there. Since various noises are present in the actual reproduction signal, these ideal values have variations, and as a result, a distribution shape in which a plurality of distributions overlap as shown in FIG. The frequency distribution of SAM values has such characteristics, and is a distribution that is significantly different from the normal distribution. Therefore, even if the standard deviation is simply obtained from this distribution, the correlation with the bit error rate is small.
[0016]
Therefore, the present applicant has previously proposed a method for checking the reliability of the playback device by calculating the relative frequency from two different threshold values for the frequency distribution of the SAM value, and calculating the bit error rate therefrom. Yes. It should be noted that this method of checking the reliability of the reproducing apparatus is described for easy understanding of the present invention, and is not a known technique and not a conventional technique.
[0017]
Hereinafter, a method for inspecting the reliability of the reproducing apparatus will be described. As described with reference to FIG. 10, the frequency distribution of SAM values has a distribution shape in which a plurality of SAM ideal values have variations due to noise, and thus a plurality of distributions overlap each other, but the noise is close to white noise. For example, since each distribution can be approximated to a normal distribution, a portion smaller than 1.5, which is the minimum value of the SAM ideal value, can be approximated to a normal distribution having a value close to 1.5 as the mode value μ. It is done. At this time, the standard deviation σ representing the variation of the approximated normal distribution and the bit error rate BER have a one-to-one correspondence, and this relationship is expressed by the following [Equation 4]. FIG. 11 is a graph in which an actual measurement result (solid line) of the frequency distribution of the SAM value in an actual optical disc reproducing apparatus and a normal distribution (dotted line) of the standard deviation σ corresponding to the bit error rate are superimposed.
[Expression 1]
The latter half of the right side of [Equation 4] is known as a distribution function obtained as an integral of the probability density function of a normal distribution in statistics, and is 0 or less for a normal distribution determined by the mode value μ and the standard deviation σ. This represents the relative frequency of the part. On the other hand, since an error bit is generated when the SAM value <0 in principle, the bit error rate BER is considered to be equal to the ratio of the portion below 0 to the total frequency of the frequency distribution of the SAM value. Therefore, the value obtained by multiplying the relative frequency of 0 or less in the normal distribution by the coefficient K of the parameter conversion matches the bit error rate. Specifically, the total frequency of the frequency distribution of SAM values is N, and the pattern in which the SAM ideal value is minimum, that is, 1.5 in all the measurement bit sequences (the distribution generated only by the SAM value of this pattern is about 1. The coefficient K is expressed as follows, where n is the number of normal distributions having a mode value of 5).
K = n / N
Is required.
[0019]
First, with respect to the frequency distribution of the SAM value, the relative frequencies R1 'and R2' of the portion smaller than the predetermined threshold values SL1 and SL2 are measured. Then, since the relationship of the following [Formula 5] and [Formula 6] is established, the standard deviation σ and the mode value μ can be obtained by calculation by solving the simultaneous equations.
[Expression 2]
Next, the bit error rate BER can be calculated by substituting the obtained standard deviation σ and mode value μ into [Expression 4].
[0021]
[Problems to be solved by the invention]
By the way, in the signal evaluation apparatus, when calculating the error rate from the relative frequency of the frequency distribution of the SAM value obtained by two different threshold values, it is very complicated expressed by [Equation 5] and [Equation 6]. [Equation 4] must be calculated after solving the equation, and it takes a very long time to calculate this by software using a microcomputer (hereinafter referred to as a microcomputer). is there.
[0022]
SUMMARY OF THE INVENTION Accordingly, an object of the present invention is to provide a signal evaluation apparatus and a signal evaluation method capable of evaluating the quality of a reproduced signal with a simple circuit configuration and high reliability in a short time.
[0023]
[Means for Solving the Problems]
In order to achieve the above object, a signal evaluation apparatus according to the present invention inputs a reproduction means for reproducing a recording medium and a correct state of a trellis diagram in a PRML decoding process of a reproduction signal reproduced from the recording medium by the reproduction means. Path metric difference detecting means for obtaining a path metric difference between two paths, and a first relative frequency which is a relative frequency of one side portion obtained by dividing the frequency distribution of the path metric difference by a first threshold value. 1 relative frequency detection means, a second relative frequency detection means for obtaining a second relative frequency that is a relative frequency of one side portion obtained by dividing the frequency distribution of the path metric difference by a second threshold value, and a look created in advance The first relative frequency obtained by the first relative frequency detection means by referring to the up tableandSignal evaluation means for evaluating the quality of the reproduction signal based on the second relative power obtained by the second relative power detection means.
[0024]
According to the signal evaluation apparatus having the above-described configuration, the first and second frequency distributions of the path metric difference between the two paths input to the correct state of the trellis diagram in the PRML decoding process of the reproduction signal from the recording medium For example, the standard deviation and the mode value of the frequency distribution of the path metric difference can be obtained based on the first and second relative frequencies of a portion smaller than the threshold value. Using the standard deviation and the mode value of the frequency distribution of the path metric difference thus obtained, the signal quality evaluation value (bit error rate) representing the quality of the reproduced signal is set for each combination of the first and second relative frequencies. A lookup table in which the obtained signal quality evaluation value is registered for each combination of the first and second relative frequencies is created in advance. When the quality of the reproduced signal is actually evaluated, the first relative frequency which is the relative frequency of the one side portion obtained by dividing the frequency distribution of the path metric difference obtained by the path metric difference detecting means by the first threshold value. Is obtained by the first relative frequency detection means, and a second relative frequency which is a relative frequency of one side portion obtained by dividing the frequency distribution of the path metric difference by a second threshold is obtained by the second relative frequency detection means. Then, the first relative frequency obtained by the first relative frequency detection meansandBased on the second relative frequency obtained by the second relative frequency detection means, the quality of the reproduction signal is evaluated by referring to the lookup table by the signal evaluation means. Therefore, by calculating the reproduction signal quality corresponding to two relative frequencies of the frequency distribution of the path metric difference in advance and creating a lookup table, it is not necessary to perform complicated statistical calculation by the microcomputer of the apparatus, which is extremely short. The signal quality can be easily evaluated in time.
[0025]
In the signal evaluation apparatus according to one embodiment, the lookup table includes the row heading and the column using the first relative frequency as a row heading or a column heading, and the second relative frequency as a column heading or a row heading. It is a matrix table in which signal quality evaluation values corresponding to headings are registered.
[0026]
According to the signal evaluation apparatus of the above embodiment, for example, when the first relative frequency is a row header and the second relative frequency is a column header, the first relative frequency obtained by the first relative frequency detection means is By searching for the closest value row header and the column header closest to the second relative frequency obtained by the second relative frequency detection means, and reading the corresponding signal quality evaluation value from the lookup table, The signal quality evaluation value can be obtained without performing complicated calculation.
[0027]
In the signal evaluation apparatus according to an embodiment, the lookup table includes an array type table in which the second relative frequencies in a valid range for each first relative frequency are registered, and valid for each first relative frequency. It is a set with an array type table in which signal quality evaluation values corresponding to the second relative frequency in a wide range are registered.
[0028]
According to the signal evaluation apparatus of the above embodiment, the memory capacity can be greatly saved, and when the same capacity memory is used, the step size of the first relative frequency and the second relative frequency can be made smaller. Therefore, a signal quality evaluation value with a smaller rounding error can be obtained.
[0029]
The signal evaluation apparatus according to an embodiment is characterized in that at least one of the first relative frequency and the second relative frequency of the lookup table is changed exponentially.
[0030]
According to the signal evaluation apparatus of the embodiment, the signal registered in the lookup table by changing the step size of at least one of the first relative frequency and the second relative frequency in the lookup table exponentially. Since the rate of change of the quality evaluation value can be made substantially uniform, the rounding error of the signal quality evaluation value can be reduced.
[0031]
In the signal evaluation apparatus according to an embodiment, the lookup table uses the number of errors with respect to a predetermined parameter as a signal quality evaluation value, and the predetermined number of errors is within a 1-byte integer range. It is characterized by a fixed number.
[0032]
According to the signal evaluation apparatus of the above embodiment, the memory capacity can be kept small by creating the lookup table using the number of errors for a predetermined parameter that falls within a 1-byte integer range as a signal quality evaluation value. it can.
[0033]
In the signal evaluation apparatus according to an embodiment, the lookup table includes the first relative frequency obtained from the assumed range of the signal quality evaluation value and the assumed range of the mode value of the frequency distribution of the path metric difference. It is characterized by being created corresponding to the fluctuation range of the second relative frequency.
[0034]
According to the signal evaluation apparatus of the above embodiment, the fluctuation range of the two first and second relative frequencies is limited from the assumed range of the signal quality evaluation value and the assumed range of the mode value of the frequency distribution of the path metric difference. By creating a lookup table, the memory capacity to be mounted can be minimized.
[0035]
In the signal evaluation apparatus according to an embodiment, at least one heading of the first relative frequency or the second relative frequency is set in the lookup table so that a change rate of the signal quality evaluation value is substantially equal. It is characterized by being.
[0036]
According to the signal evaluation apparatus of the above embodiment, the signal quality evaluation is performed by setting at least one heading of the first relative frequency or the second relative frequency so that the rate of change of the signal quality evaluation value is substantially equal. The rounding error of the value can be reduced.
[0037]
Further, the signal evaluation method of the present invention is based on a reproduction signal reproduced from a medium on which information is recorded, and the path metric difference between two paths for inputting the signal to the correct state of a diagram to be traced in the PRML decoding process. Determining the first cumulative value when the path metric difference is smaller or larger than the first threshold, and when the path metric difference is smaller than the second threshold. Or by counting the second cumulative value when it is larger and registering the signal quality evaluation value in association with the first and second cumulative values based on the first and second cumulative values in advance. And a step of reading a signal quality evaluation value of the reproduction signal with reference to the created lookup table. It is a feature.
[0038]
According to the signal evaluation method, based on a reproduction signal reproduced from a medium on which information is recorded, a path metric difference between two paths for inputting the signal to a correct state of a trellis diagram in a PRML decoding process is obtained. When the path metric difference is smaller than the first threshold value, the first cumulative value (corresponding to the relative frequency of one side portion obtained by dividing the frequency distribution of the path metric difference by the first threshold value) is counted. When the path metric difference is smaller than the second threshold value, the second cumulative value (corresponding to the relative frequency of one side portion obtained by dividing the frequency distribution of the path metric difference by the second threshold value) is counted. Then, based on the first and second cumulative values counted, the reproduction signal evaluation value is read with reference to a lookup table created in advance in association with the first and second cumulative values. By doing so, it is not necessary to perform complicated statistical calculation, and signal quality can be evaluated easily in a very short time.
[0039]
DETAILED DESCRIPTION OF THE INVENTION
Hereinafter, a signal evaluation apparatus and a signal evaluation method of the present invention will be described in detail with reference to embodiments shown in the drawings.
[0040]
(First embodiment)
FIG. 1 is a block diagram of a magneto-optical disk reproducing apparatus using the signal evaluation apparatus and signal evaluation method of the first embodiment of the present invention.
[0041]
As shown in FIG. 1, the magneto-optical disk reproducing apparatus includes a magneto-
[0042]
Next, the reproducing operation in the magneto-optical disk reproducing apparatus having the above configuration will be described.
[0043]
First, when a light beam is irradiated onto the magneto-
[0044]
The path metric difference output from the SAM
[0045]
On the other hand, the SAM value ΔM is also compared with the predetermined threshold value SL2 (where SL2 <SL1) stored in the
[0046]
FIG. 2 is a schematic view illustrating the contents of a lookup table 10 constituted by a semiconductor memory. Hereinafter, the procedure in which the
[0047]
As shown in FIG. 2, the lookup table 10 (shown in FIG. 1) is a matrix of 14 rows and 14 columns, the row heading being the number of SAM values R1, and the column heading being the number of SAM values R2. It has become. However, the total number of bits is 50,000 bits.
R1 = 50000 × R1 ′
R2 = 50000 × R2 ′
It turns out that. The thresholds SL1 and SL2 are
SL1 = 0.6
SL2 = 0.4
It is. As a registered value for each (R1, R2) combination, a bit error rate BER calculated in advance using [Expression 4] to [Expression 6] from the number of SAM values R1 and R2 is stored. In FIG. 2, the bit error rate BER display format “E−n” (n = 1, 2, 3,...) Is “× 10-n(The same applies to FIGS. 3, 4 and 6).
[0048]
When the number of SAM values R1 and R2 is input, the
[0049]
Next, a method for creating the lookup table 10 will be specifically described. First, the assumed range of the signal evaluation value and the assumed range of the mode value μ of the frequency distribution of the SAM value are determined. For example, when applied to a so-called test lead for obtaining the optimum value of the laser power for reproduction, the reference bit error rate BER is 5 × 10 5.-FourIs assumed to be 1 × 10 as the signal evaluation value.-Four~ 1x10⁻³It is considered that the range of the degree may be calculated accurately. If the reproduction signal noise is white noise, the mode value is 1.5. Therefore, if the variation due to the colored noise is assumed to be ± 0.2, the mode value μ is 1.3 to 1.7. It becomes a range. In principle, the number of SAM values R1, R2 increases as the bit error rate BER increases, and the number of SAM values R1, R2 decreases as the mode value μ increases, so the minimum number of SAM values R1, R2 is minimum. The values are the above [Formula 5] and [Formula 6].
BER = 1 × 10-Four, Μ = 1.7
The number of SAM values R1 is 233, and the number of SAM values R2 is 75. Similarly, the maximum value of the number of SAM values R1 and R2 is expressed by the above [Expression 5] and [Expression 6].
BER = 1 × 10⁻³, Μ = 1.3
The number of SAM values R1 is 1241, and R2 is 501. From these, the lookup table 10 is
R1: 233 to 1241
R2: 75-501
It would be sufficient to create a range of. If the table size is 14 × 14, the bit error rate BER is calculated in advance from the above [Expression 4] to [Expression 6] for the values obtained by equally dividing these into 14 steps, and the value is stored in the memory as a registered value. Just remember.
[0050]
After determining the assumed range of the signal evaluation value and the mode value in this way, the lookup table is created only for the corresponding relative frequency change range, so that it can be implemented with the minimum necessary memory capacity. it can.
[0051]
Here, the table size is set to 14 × 14 for the convenience of explanation. However, as the table size is increased, the step size of the number of SAM values R1 and R2 can be reduced, so that the table size is more accurate. The bit error rate BER can be obtained. Actually, a larger table may be prepared in accordance with the memory capacity allowable in the system design.
[0052]
In addition, there is a part where the registration is blank in a part of the lookup table, which corresponds to the case of an impossible combination of R1 ≦ R2.
[0053]
As described above, the magneto-optical disk reproducing apparatus does not require a complicated calculation using [Equation 4] to [Equation 6] as in the prior art. Can be evaluated.
[0054]
In the first embodiment, the assumed range of the number of SAM values R1 and R2 is divided into equal increments for the row heading and the column heading of the lookup table 10, but this case has the following problems. FIG. 3 shows a 1 × 10 evaluation range of the required bit error rate BER in the lookup table 10 of FIG.-Four~ 1x10⁻³Only the part of is extracted. As can be seen from FIG. 3, the change rate of the adjacent bit error rate BER is small in the portion where the number of SAM values R1, R2 is large, but the adjacent bit error rate in the portion where the number of SAM values R1, R2 is small. Since the rate of change of BER is too large, there is a risk that the rounding error becomes extremely large.
[0055]
In order to solve such a problem, the SAM value is set such that the smaller the SAM value number R1, R2, the smaller the step size, and the larger the SAM value number R1, R2, the larger the step size. The step size of the number R1 and R2 may be changed exponentially. For example, FIG. 4 shows a lookup created by dividing the assumed range of the number of SAM values R1 and R2 into 14 according to the following [Equation 7] and [Equation 8] for i (i = 1 to 14), respectively. It is a schematic diagram showing the contents of the table, and it can be seen that the variation width of the bit error rate BER is substantially uniform. Thereby, the rounding error of the bit error rate BER can be reduced.
R1 [i] = 203 × exp (i / 7.7) (Equation 7)
R2 [i] = 64 × exp (i / 6.8) (Equation 8)
[0056]
In the first embodiment, the registered value of the lookup table 10 is the bit error rate BER itself. However, considering that the mounting form of the lookup table 10 is a semiconductor memory, the table size and data operability are reduced. From the viewpoint, it is desirable that the registered value is an integer that can be expressed by 1 byte. Therefore, the predetermined parameter may be determined so that the range of the numerical value obtained by multiplying the assumed bit error rate BER range by the predetermined parameter falls within the range of 0 to 255. For example, in the magneto-optical disk reproducing apparatus, the assumed bit error rate BER range is 1 × 10.-Four~ 1x10⁻³Therefore, if the predetermined parameter is 250,000, the range of registered values is 25 to 250, which can be contained in 1 byte. FIG. 5 shows a schematic diagram of the contents of the lookup table 10 in this case.
[0057]
(Second embodiment)
Next, a magneto-optical disk reproducing apparatus using the signal evaluation apparatus and signal evaluation method of the second embodiment of the present invention will be described with reference to FIG. 4, FIG. 6, and FIG. The magneto-optical disk reproducing apparatus of the second embodiment has the same configuration as that of the magneto-optical disk reproducing apparatus shown in FIG. 1 of the first embodiment except for the contents of the lookup table 10, and the description thereof is omitted. FIG. 1 is incorporated.
[0058]
FIG. 4 shows the contents of the look-up table 10 (shown in FIG. 1) created by exponentially changing the number of SAM values R1 and R2, as already described. Since is a parallelogram shape, the effective data amount is actually smaller for a table size of 14 × 14 = 196. This is because the look-up table 10 is realized by a matrix type table having the number of SAM values R1 and R2 as headings.
[0059]
Therefore, as shown in FIG. 6, the lookup table 10 is constituted by a set of two array type tables. FIG. 6A shows a set of array-type tables in which the number R2 of SAM values corresponding to the effective bit error rate BER range is registered as the registration value for each number R1 of SAM values. For example, the effective bit error rate BER range for R1 = 300 is 1 × 10-Four~ 1x10⁻³Since the range of the number R2 of SAM values corresponding to is four from 99 to 115, 115, 134, and 155, an array in which these are sequentially arranged is created as an array for R1 = 300. In this way, Table A is obtained by similarly creating an array for the assumed number of SAM values R1.
[0060]
FIG. 6B shows a set of array-type tables in which the bit error rate BER obtained from the number R2 of SAM values registered in the array of Table A is registered as the registered value for the number R1 of each SAM value. It is. For example, for R1 = 300, the bit error rate BER obtained from each of 99, 115, 134, and 155 registered in the array of R1 = 300 in Table A is
1.4 × 10-Four2.4 × 10-Four4.1 × 10-Four6.9 × 10-Four
Therefore, an array in which these are arranged in order is created as an array for R1 = 300. In this way, Table B is obtained by similarly creating an array for the assumed number of SAM values R1.
[0061]
A procedure for obtaining the bit error rate BER from the number of SAM values R1 and R2 with reference to the lookup table 10 thus created will be described with reference to the flowcharts shown in FIGS.
[0062]
First, in step S1, the relative frequency from the relative frequency of the SAM value to the threshold SL1 or less (a value obtained by multiplying the relative frequency by the total number of bits) R1 and the relative frequency of the threshold SL2 or less (the total frequency is set to the relative frequency). Multiply value) R2. For example, assume that R1 = 500 and R2 = 200.
Next, proceeding to step S2, a heading closest to the obtained number of SAM values R1 is searched from the table A, and an array in the seventh row (heading is 504) which is a corresponding array is selected.
Subsequently, the process proceeds to step S3, and a value closest to the number of SAM values R2, that is, 208 (third position in the array) is found from the registered values of the selected array.
In step S4, the heading closest to the number of SAM values R1 is searched from the table B, and the seventh row array (heading is 504), which is the corresponding array, is selected.
Finally, the process proceeds to step S5, and for the array, the third registered value that is the position in the array closest to the number of SAM values R2 obtained in step S3 is read, so that the corresponding bit error rate BER = 5 0.0 × 10-Four("5.0E-4" in FIG. 6B) can be obtained.
[0063]
The size of the lookup table 10 is 14 × 5 = 70 in the table A and 14 × 5 = 70 in the table B, so that the memory capacity is 140 in total, and the number of SAM values R1 and R2 is found. It can be seen that the memory capacity 196 in the case of the matrix type table can be significantly reduced. Further, when using memories having the same capacity, the step size of the number of SAM values R1 and R2 can be made smaller, so that the bit error rate BER with a smaller rounding error can be calculated.
[0064]
In the first and second embodiments, the magneto-optical disk reproducing apparatus using the signal evaluation apparatus and the signal evaluation method has been described. However, the present invention is not limited to this, and is equally applied to an apparatus that performs PRML signal reproduction. The effect should be demonstrated. That is, the present invention can be applied to optical disk devices, magnetic recording devices, communication data receiving devices, and the like of phase change systems.
[0065]
In the first and second embodiments, the relative frequencies R1 ′ and R2 ′ of the portion smaller than the first and second thresholds SL1 and SL2 are actually measured for the frequency distribution of the SAM value that is a path metric difference. Thus, by solving the simultaneous equations of [Equation 5] and [Equation 6] and calculating the standard deviation σ and the mode value μ, the frequency distribution of the path metric difference is relatively larger than the first threshold value. The standard deviation σ and the mode value μ may be obtained based on the frequency and the frequency distribution of the path metric difference based on the relative frequency larger than the second threshold value. Also, the standard deviation σ and the mode value μ are obtained from the frequency distribution of the path metric difference based on the relative frequency smaller than one of the first threshold and the second threshold and the relative frequency larger than the other. May be.
[0066]
【The invention's effect】
As is clear from the above, according to the signal evaluation apparatus and signal evaluation method of the present invention, signal quality evaluation values corresponding to two relative frequencies of the frequency distribution of the measured path metric difference (SAM value) are calculated in advance. By creating a look-up table, it is not necessary to perform complicated statistical calculations by the microcomputer of the apparatus, and signal quality can be easily evaluated in an extremely short time.
[0067]
Also, by implementing a lookup table by limiting the range of fluctuation of two relative frequencies from the assumed range of signal quality evaluation values and the assumed range of mode distributions of frequency distributions of path metric differences (SAM values). The required memory capacity can be minimized.
[0068]
Furthermore, by changing the step size of the relative frequency for creating the lookup table exponentially, the rate of change of the signal quality evaluation value (bit error rate BER) registered in the table can be made substantially uniform. The rounding error of the signal quality evaluation value can be reduced.
[0069]
Furthermore, the memory capacity can be kept small by creating a lookup table using the number of errors for a predetermined parameter that falls within the range of a 1-byte integer as a signal quality evaluation value.
[0070]
Furthermore, an array type table in which the second relative frequencies in the valid range for each first relative frequency are registered, and a signal quality evaluation value corresponding to the second relative frequency in the valid range for each first relative frequency is registered. By constructing a look-up table that is a set with an array type table, it is possible to greatly save the memory capacity, and when using the same capacity memory, the increments of the first relative frequency and the second relative frequency are obtained. Since the width can be further reduced, it is possible to calculate a signal quality evaluation value with a smaller rounding error.
[Brief description of the drawings]
FIG. 1 is a block diagram of a magneto-optical disk reproducing apparatus using a signal evaluation apparatus and a signal evaluation method according to a first embodiment of the present invention.
FIG. 2 is a schematic diagram showing the contents of a lookup table of the playback apparatus.
FIG. 3 is a schematic diagram showing the contents of a lookup table for registering only valid data.
FIG. 4 is a schematic diagram showing the contents of a lookup table in which headings are changed exponentially.
FIG. 5 is a schematic diagram showing the contents of a lookup table in which a registered value is a 1-bit integer.
FIG. 6 is a schematic diagram showing the contents of a lookup table of a magneto-optical disk reproducing apparatus using a signal evaluation apparatus and a signal evaluation method according to a second embodiment of the present invention.
FIG. 7 is a flowchart showing the operation of the magneto-optical disk reproducing apparatus.
FIG. 8 is a schematic diagram of a reproduced signal waveform in accordance with PR (1, 2, 1) characteristics.
FIG. 9 is a schematic diagram showing a trellis diagram in Viterbi decoding.
FIG. 10 is a graph showing a frequency distribution of SAM values in an actually measured waveform and an ideal waveform.
FIG. 11 is a graph in which an actual measurement result of a frequency distribution of SAM values and a normal distribution corresponding to the bit error rate are superimposed.
[Explanation of symbols]
1 ... magneto-optical disk,
2 ... Optical pickup,
3 ... SAM value calculation circuit,
4,7 ... Threshold register,
5,8 ... comparator,
6,9 ... Counter,
10 ... Lookup table,
11 ... Controller.
Claims (8)
上記再生手段により上記記録媒体から再生された再生信号のPRML復号過程においてトレリス線図の正解状態に入力される2本のパスのパスメトリック差を求めるパスメトリック差検出手段と、
上記パスメトリック差の度数分布を第1のしきい値で区切った片側部分の相対度数である第1相対度数を求める第1相対度数検出手段と、
上記パスメトリック差の度数分布を第2のしきい値で区切った片側部分の相対度数である第2相対度数を求める第2相対度数検出手段と、
予め作成されたルックアップテーブルを参照することによって、上記第1相対度数検出手段により求められた第1相対度数および上記第2相対度数検出手段により求められた第2相対度数に基づいて再生信号の品質を評価する信号評価手段とを備えたことを特徴とする信号評価装置。Reproducing means for reproducing the recording medium;
Path metric difference detecting means for obtaining a path metric difference between two paths input to a correct state of a trellis diagram in a PRML decoding process of a reproduced signal reproduced from the recording medium by the reproducing means;
First relative frequency detection means for obtaining a first relative frequency that is a relative frequency of one side portion obtained by dividing the frequency distribution of the path metric difference by a first threshold;
Second relative frequency detection means for obtaining a second relative frequency that is a relative frequency of one side portion obtained by dividing the frequency distribution of the path metric difference by a second threshold value;
By referring to a lookup table prepared in advance, the reproduction signal is reproduced based on the first relative power obtained by the first relative power detection means and the second relative power obtained by the second relative power detection means. A signal evaluation device comprising signal evaluation means for evaluating quality.
上記ルックアップテーブルは、上記第1相対度数を行見出しまたは列の見出しとし、上記第2相対度数を列見出しまたは行見出しとして、上記行見出しと上記列見出しに対応する信号品質評価値が登録された行列型テーブルであることを特徴とする信号評価装置。The signal evaluation apparatus according to claim 1,
In the lookup table, signal quality evaluation values corresponding to the row header and the column header are registered with the first relative frequency as a row header or a column header and the second relative frequency as a column header or a row header. A signal evaluation apparatus characterized by being a matrix type table.
上記ルックアップテーブルは、上記第1相対度数毎に有効な範囲の上記第2相対度数が登録された配列型テーブルと、上記第1相対度数毎に有効な範囲の上記第2相対度数に対応する信号品質評価値が登録された配列型テーブルとの集合であることを特徴とする信号評価装置。The signal evaluation apparatus according to claim 1,
The look-up table corresponds to an array type table in which the second relative frequencies in a valid range for each first relative frequency are registered, and the second relative frequencies in a valid range for each first relative frequency. A signal evaluation apparatus characterized by being a set with an array type table in which signal quality evaluation values are registered.
上記ルックアップテーブルの上記第1相対度数または上記第2相対度数の少なくとも一方を指数関数的に変化させることを特徴とする信号評価装置。In the signal evaluation apparatus according to claim 2 or 3,
A signal evaluation apparatus characterized in that at least one of the first relative frequency and the second relative frequency of the lookup table is changed exponentially.
上記ルックアップテーブルは、所定の母数に対するエラー個数を信号品質評価値としており、上記エラー個数の範囲が1バイト整数の範囲に収まるように所定の母数が決められていることを特徴とする信号評価装置。In the signal evaluation apparatus according to claim 2 or 3,
In the lookup table, the number of errors with respect to a predetermined parameter is used as a signal quality evaluation value, and the predetermined parameter is determined so that the range of the number of errors falls within a 1-byte integer range. Signal evaluation device.
上記ルックアップテーブルは、上記信号品質評価値の想定範囲と上記パスメトリック差の度数分布の最頻値の想定範囲とから求められた上記第1相対度数および上記第2相対度数の変動範囲に対応して作成されていることを特徴とする信号評価装置。In the signal evaluation apparatus according to claim 2 or 3,
The look-up table corresponds to the fluctuation range of the first relative frequency and the second relative frequency obtained from the assumed range of the signal quality evaluation value and the assumed range of the mode value of the frequency distribution of the path metric difference. The signal evaluation apparatus characterized by being produced.
上記ルックアップテーブルは、上記信号品質評価値の変化率がほぼ均等となるように上記第1相対度数または上記第2相対度数の少なくとも一方の見出しが設定されていることを特徴とする信号評価装置。In the signal evaluation apparatus according to claim 2 or 3,
In the look-up table, at least one heading of the first relative frequency or the second relative frequency is set so that the rate of change of the signal quality evaluation value is substantially uniform. .
上記パスメトリック差が第1のしきい値よりも小さいときまたは大きいときに第1の累積値をカウントするステップと、
上記パスメトリック差を第2のしきい値よりも小さいときまたは大きいときに第2の累積値をカウントするステップと、
上記第1,第2の累積値に基づいて、上記第1,第2の累積値に関連付けて信号品質評価値を登録することにより予め作成されたルックアップテーブルを参照して上記再生信号の信号品質評価値を読み出すステップとを有することを特徴とする信号評価方法。Obtaining a path metric difference between two paths based on a reproduction signal reproduced from a medium on which information is recorded, and inputting the signal to a correct state of a diagram to be trellised in a PRML decoding process;
Counting a first cumulative value when the path metric difference is less than or greater than a first threshold;
Counting a second cumulative value when the path metric difference is less than or greater than a second threshold;
Based on the first and second accumulated values, a signal quality evaluation value is registered in association with the first and second accumulated values, and a signal of the reproduction signal is referred to with reference to a lookup table created in advance. And a step of reading a quality evaluation value.
Priority Applications (5)
| Application Number | Priority Date | Filing Date | Title |
|---|---|---|---|
| JP2001378485A JP3820144B2 (en) | 2001-12-12 | 2001-12-12 | Signal evaluation apparatus and signal evaluation method |
| US10/154,898 US7206351B2 (en) | 2001-05-28 | 2002-05-24 | Signal evaluation devices and signal evaluation methods, signal quality evaluation methods and reproducing devices and recording devices |
| DE60233092T DE60233092D1 (en) | 2001-05-28 | 2002-05-24 | Estimate the BER in an optical disk decoder based on the number of signals that have a probability below a threshold after PRML detection. |
| EP02011480A EP1262971B1 (en) | 2001-05-28 | 2002-05-24 | BER evaluation in an optical disk decoder by counting a number of signals after PRML having a likelihood below a threshold. |
| KR10-2002-0029686A KR100527153B1 (en) | 2001-05-28 | 2002-05-28 | Signal evaluation devices and signal evaluation methods, signal quality evaluation methods and reproducing devices and recording devices |
Applications Claiming Priority (1)
| Application Number | Priority Date | Filing Date | Title |
|---|---|---|---|
| JP2001378485A JP3820144B2 (en) | 2001-12-12 | 2001-12-12 | Signal evaluation apparatus and signal evaluation method |
Publications (3)
| Publication Number | Publication Date |
|---|---|
| JP2003178537A JP2003178537A (en) | 2003-06-27 |
| JP2003178537A5 JP2003178537A5 (en) | 2005-04-28 |
| JP3820144B2 true JP3820144B2 (en) | 2006-09-13 |
Family
ID=19186197
Family Applications (1)
| Application Number | Title | Priority Date | Filing Date |
|---|---|---|---|
| JP2001378485A Expired - Fee Related JP3820144B2 (en) | 2001-05-28 | 2001-12-12 | Signal evaluation apparatus and signal evaluation method |
Country Status (1)
| Country | Link |
|---|---|
| JP (1) | JP3820144B2 (en) |
Families Citing this family (4)
| Publication number | Priority date | Publication date | Assignee | Title |
|---|---|---|---|---|
| JP4622632B2 (en) | 2005-03-31 | 2011-02-02 | ソニー株式会社 | Maximum likelihood decoding apparatus, signal evaluation method, reproduction apparatus |
| JP4750488B2 (en) | 2005-07-08 | 2011-08-17 | ソニー株式会社 | Evaluation device, playback device, and evaluation method |
| JP5003284B2 (en) * | 2007-05-24 | 2012-08-15 | 日本電気株式会社 | Signal quality measuring apparatus and information reproducing apparatus |
| JP6995629B2 (en) * | 2018-01-05 | 2022-01-14 | 日本電信電話株式会社 | Arithmetic circuit |
-
2001
- 2001-12-12 JP JP2001378485A patent/JP3820144B2/en not_active Expired - Fee Related
Also Published As
| Publication number | Publication date |
|---|---|
| JP2003178537A (en) | 2003-06-27 |
Similar Documents
| Publication | Publication Date | Title |
|---|---|---|
| KR100527153B1 (en) | Signal evaluation devices and signal evaluation methods, signal quality evaluation methods and reproducing devices and recording devices | |
| US6292912B1 (en) | Disk drive having built-in self-test system for characterizing performance of the drive | |
| US7403460B2 (en) | Information recording and reproducing apparatus, evaluation method, and information recording and reproducing medium | |
| US7664208B2 (en) | Evaluating device, reproducing device, and evaluating method | |
| US7471601B2 (en) | Optical disk recording/reproducing method, optical disk recording/reproducing apparatus and optical disk | |
| US6046873A (en) | Magnetic recording and reproducing apparatus including a viterbi detector having a variable reference amplitude value | |
| US7428203B2 (en) | Signal evaluation method, information recording/reproducing apparatus, information reproducing apparatus, and information recording medium | |
| JP3820144B2 (en) | Signal evaluation apparatus and signal evaluation method | |
| US7080313B2 (en) | Signal evaluation apparatus and signal evaluation method | |
| JP4118918B2 (en) | Signal quality evaluation apparatus, information recording / reproducing apparatus, signal quality evaluation method, recording condition determination method, signal quality evaluation program, and computer-readable recording medium recording the signal quality evaluation program | |
| US20060015797A1 (en) | Information reproducing method and information recording reproducing apparatus with maximum likelihood decoding | |
| JP2003051163A (en) | Method for evaluating signal quality and reproducing device | |
| US7441177B2 (en) | Information reproduction apparatus and method using maximum likelihood decoding | |
| JP3668178B2 (en) | Information recording / reproducing apparatus, signal evaluation method thereof, and information recording / reproducing medium | |
| JP3822111B2 (en) | SIGNAL QUALITY EVALUATION METHOD, SIGNAL QUALITY EVALUATION DEVICE, REPRODUCTION DEVICE EQUIPPED WITH THE SAME, CONTROL PROGRAM FOR SIGNAL QUALITY EVALUATION DEVICE, AND COMPUTER READABLE RECORDING MEDIUM CONTAINING THE PROGRAM | |
| US7561642B2 (en) | Recording condition setting device, recording/reproducing device, recording condition setting method, control program, and recording medium | |
| JP3819287B2 (en) | Recording medium evaluation method, evaluation apparatus and reproducing apparatus | |
| US20060013344A1 (en) | Method and system for maximum likelihood detection | |
| JP4254799B2 (en) | Information playback device | |
| KR100641770B1 (en) | Information reproducing apparatus and viterbi decoding method | |
| JP2004022156A (en) | Signal reproducing method and signal reproducing device | |
| JP2008198300A (en) | Noise prediction decoder and decoding method | |
| JP2007537558A (en) | Viterbi coding quality indicator based on sequence amplitude margin (SAM) | |
| JPH10283739A (en) | Information reproduction device and method |
Legal Events
| Date | Code | Title | Description |
|---|---|---|---|
| A521 | Written amendment |
Free format text: JAPANESE INTERMEDIATE CODE: A523 Effective date: 20040617 |
|
| A621 | Written request for application examination |
Free format text: JAPANESE INTERMEDIATE CODE: A621 Effective date: 20040617 |
|
| A977 | Report on retrieval |
Free format text: JAPANESE INTERMEDIATE CODE: A971007 Effective date: 20060530 |
|
| TRDD | Decision of grant or rejection written | ||
| A01 | Written decision to grant a patent or to grant a registration (utility model) |
Free format text: JAPANESE INTERMEDIATE CODE: A01 Effective date: 20060613 |
|
| A61 | First payment of annual fees (during grant procedure) |
Free format text: JAPANESE INTERMEDIATE CODE: A61 Effective date: 20060616 |
|
| R150 | Certificate of patent or registration of utility model |
Free format text: JAPANESE INTERMEDIATE CODE: R150 |
|
| FPAY | Renewal fee payment (event date is renewal date of database) |
Free format text: PAYMENT UNTIL: 20100623 Year of fee payment: 4 |
|
| FPAY | Renewal fee payment (event date is renewal date of database) |
Free format text: PAYMENT UNTIL: 20100623 Year of fee payment: 4 |
|
| FPAY | Renewal fee payment (event date is renewal date of database) |
Free format text: PAYMENT UNTIL: 20110623 Year of fee payment: 5 |
|
| FPAY | Renewal fee payment (event date is renewal date of database) |
Free format text: PAYMENT UNTIL: 20120623 Year of fee payment: 6 |
|
| FPAY | Renewal fee payment (event date is renewal date of database) |
Free format text: PAYMENT UNTIL: 20120623 Year of fee payment: 6 |
|
| FPAY | Renewal fee payment (event date is renewal date of database) |
Free format text: PAYMENT UNTIL: 20130623 Year of fee payment: 7 |
|
| LAPS | Cancellation because of no payment of annual fees |