JP3712350B2 - Cardiac magnetic field diagnostic apparatus for ventricular delayed potential and method for operating the same - Google Patents
Cardiac magnetic field diagnostic apparatus for ventricular delayed potential and method for operating the same Download PDFInfo
- Publication number
- JP3712350B2 JP3712350B2 JP2000217835A JP2000217835A JP3712350B2 JP 3712350 B2 JP3712350 B2 JP 3712350B2 JP 2000217835 A JP2000217835 A JP 2000217835A JP 2000217835 A JP2000217835 A JP 2000217835A JP 3712350 B2 JP3712350 B2 JP 3712350B2
- Authority
- JP
- Japan
- Prior art keywords
- magnetic field
- data
- excitation
- myocardium
- intramyocardial
- Prior art date
- Legal status (The legal status is an assumption and is not a legal conclusion. Google has not performed a legal analysis and makes no representation as to the accuracy of the status listed.)
- Expired - Fee Related
Links
Images


Classifications
-
- A—HUMAN NECESSITIES
- A61—MEDICAL OR VETERINARY SCIENCE; HYGIENE
- A61B—DIAGNOSIS; SURGERY; IDENTIFICATION
- A61B6/00—Apparatus for radiation diagnosis, e.g. combined with radiation therapy equipment
- A61B6/02—Devices for diagnosis sequentially in different planes; Stereoscopic radiation diagnosis
- A61B6/03—Computerised tomographs
- A61B6/032—Transmission computed tomography [CT]
-
- A—HUMAN NECESSITIES
- A61—MEDICAL OR VETERINARY SCIENCE; HYGIENE
- A61B—DIAGNOSIS; SURGERY; IDENTIFICATION
- A61B5/00—Measuring for diagnostic purposes; Identification of persons
- A61B5/24—Detecting, measuring or recording bioelectric or biomagnetic signals of the body or parts thereof
- A61B5/242—Detecting biomagnetic fields, e.g. magnetic fields produced by bioelectric currents
- A61B5/243—Detecting biomagnetic fields, e.g. magnetic fields produced by bioelectric currents specially adapted for magnetocardiographic [MCG] signals
-
- A—HUMAN NECESSITIES
- A61—MEDICAL OR VETERINARY SCIENCE; HYGIENE
- A61B—DIAGNOSIS; SURGERY; IDENTIFICATION
- A61B5/00—Measuring for diagnostic purposes; Identification of persons
- A61B5/24—Detecting, measuring or recording bioelectric or biomagnetic signals of the body or parts thereof
- A61B5/316—Modalities, i.e. specific diagnostic methods
- A61B5/318—Heart-related electrical modalities, e.g. electrocardiography [ECG]
- A61B5/346—Analysis of electrocardiograms
- A61B5/349—Detecting specific parameters of the electrocardiograph cycle
-
- A—HUMAN NECESSITIES
- A61—MEDICAL OR VETERINARY SCIENCE; HYGIENE
- A61B—DIAGNOSIS; SURGERY; IDENTIFICATION
- A61B6/00—Apparatus for radiation diagnosis, e.g. combined with radiation therapy equipment
- A61B6/02—Devices for diagnosis sequentially in different planes; Stereoscopic radiation diagnosis
- A61B6/03—Computerised tomographs
- A61B6/037—Emission tomography
-
- A—HUMAN NECESSITIES
- A61—MEDICAL OR VETERINARY SCIENCE; HYGIENE
- A61B—DIAGNOSIS; SURGERY; IDENTIFICATION
- A61B6/00—Apparatus for radiation diagnosis, e.g. combined with radiation therapy equipment
- A61B6/50—Clinical applications
- A61B6/503—Clinical applications involving diagnosis of heart
-
- A—HUMAN NECESSITIES
- A61—MEDICAL OR VETERINARY SCIENCE; HYGIENE
- A61B—DIAGNOSIS; SURGERY; IDENTIFICATION
- A61B6/00—Apparatus for radiation diagnosis, e.g. combined with radiation therapy equipment
- A61B6/52—Devices using data or image processing specially adapted for radiation diagnosis
- A61B6/5211—Devices using data or image processing specially adapted for radiation diagnosis involving processing of medical diagnostic data
- A61B6/5229—Devices using data or image processing specially adapted for radiation diagnosis involving processing of medical diagnostic data combining image data of a patient, e.g. combining a functional image with an anatomical image
- A61B6/5235—Devices using data or image processing specially adapted for radiation diagnosis involving processing of medical diagnostic data combining image data of a patient, e.g. combining a functional image with an anatomical image combining images from the same or different ionising radiation imaging techniques, e.g. PET and CT
-
- A—HUMAN NECESSITIES
- A61—MEDICAL OR VETERINARY SCIENCE; HYGIENE
- A61B—DIAGNOSIS; SURGERY; IDENTIFICATION
- A61B6/00—Apparatus for radiation diagnosis, e.g. combined with radiation therapy equipment
- A61B6/52—Devices using data or image processing specially adapted for radiation diagnosis
- A61B6/5211—Devices using data or image processing specially adapted for radiation diagnosis involving processing of medical diagnostic data
- A61B6/5229—Devices using data or image processing specially adapted for radiation diagnosis involving processing of medical diagnostic data combining image data of a patient, e.g. combining a functional image with an anatomical image
- A61B6/5247—Devices using data or image processing specially adapted for radiation diagnosis involving processing of medical diagnostic data combining image data of a patient, e.g. combining a functional image with an anatomical image combining images from an ionising-radiation diagnostic technique and a non-ionising radiation diagnostic technique, e.g. X-ray and ultrasound
-
- A—HUMAN NECESSITIES
- A61—MEDICAL OR VETERINARY SCIENCE; HYGIENE
- A61B—DIAGNOSIS; SURGERY; IDENTIFICATION
- A61B8/00—Diagnosis using ultrasonic, sonic or infrasonic waves
- A61B8/52—Devices using data or image processing specially adapted for diagnosis using ultrasonic, sonic or infrasonic waves
- A61B8/5215—Devices using data or image processing specially adapted for diagnosis using ultrasonic, sonic or infrasonic waves involving processing of medical diagnostic data
- A61B8/5238—Devices using data or image processing specially adapted for diagnosis using ultrasonic, sonic or infrasonic waves involving processing of medical diagnostic data for combining image data of patient, e.g. merging several images from different acquisition modes into one image
-
- G—PHYSICS
- G06—COMPUTING; CALCULATING OR COUNTING
- G06T—IMAGE DATA PROCESSING OR GENERATION, IN GENERAL
- G06T19/00—Manipulating 3D models or images for computer graphics
-
- A—HUMAN NECESSITIES
- A61—MEDICAL OR VETERINARY SCIENCE; HYGIENE
- A61B—DIAGNOSIS; SURGERY; IDENTIFICATION
- A61B5/00—Measuring for diagnostic purposes; Identification of persons
- A61B5/05—Detecting, measuring or recording for diagnosis by means of electric currents or magnetic fields; Measuring using microwaves or radio waves
- A61B5/055—Detecting, measuring or recording for diagnosis by means of electric currents or magnetic fields; Measuring using microwaves or radio waves involving electronic [EMR] or nuclear [NMR] magnetic resonance, e.g. magnetic resonance imaging
-
- A—HUMAN NECESSITIES
- A61—MEDICAL OR VETERINARY SCIENCE; HYGIENE
- A61B—DIAGNOSIS; SURGERY; IDENTIFICATION
- A61B5/00—Measuring for diagnostic purposes; Identification of persons
- A61B5/74—Details of notification to user or communication with user or patient ; user input means
- A61B5/742—Details of notification to user or communication with user or patient ; user input means using visual displays
- A61B5/743—Displaying an image simultaneously with additional graphical information, e.g. symbols, charts, function plots
Description
【0001】
【発明の属する技術分野】
この発明は、心室遅延電位の心臓磁界診断装置および心筋内興奮不均一伝播部位の同定方法に関し、より特定的には、心室頻拍の原因となる心室遅延電位、すなわち心筋内興奮不均一伝播部位の3次元的発生位置を非接触磁気計測により非侵襲的に診断するための心室遅延電位の心臓磁界診断装置および心筋内興奮不均一伝播部位の同定方法に関する。
【0002】
【従来の技術】
従来、心疾患の診断を行なうために、心電図を記録する方法が一般的に採用されている。
【0003】
しかしながら、従来の心電図法では、たとえば心臓手術の際に治療すべき部位の位置、大きさ、形状を推定するためには不充分であり、患部位置の満足できる推定を行なうことができなかった。
【0004】
これは、心電図法が間接的な計測方法であることによる。すなわち、心臓から体表面までに存在する組織、心臓と他の臓器や骨との位置的関係、心臓の大きさ、人体の各組織ごとの電気伝導率などが被験者ごとに大きく異なるため、心電図のような間接的計測で得られる情報では患部位置を正確に特定することは極めて困難であった。
【0005】
一方、心筋梗塞症の発症から一定期間後に、または心筋症などの心疾患により、正常な心筋組織中に斑紋状組織が形成されると、心室頻拍を誘発することが近年の研究から明らかにされている。
【0006】
斑紋状組織とは、正常な心筋組織中に、壊死したまたは変性した組織が島状に存在する状態を指すものである。このような心筋部位で不均一な興奮伝播が生じることとなり、心室遅延電位が発生する。またこのような斑紋状組織においては、壊死または変性した組織と正常組織との間の電気的伝導特性の違いから二重の興奮伝播路(リエントリ回路)が形成されることがある。
【0007】
すなわち、興奮信号はこのリエントリ回路内を旋回することとなり、その結果として心室頻拍が誘発される。したがって、このような心室遅延電位の発生部位を3次元的に正確に同定することが強く要望されている。
【0008】
しかしながら、上述のように、心電図法では、心電図同期加算の技術を用いて心室遅延電位の有無を非侵襲的に検出することはできても、心筋内興奮の不均一伝播部位の局在の3次元的な同定はできなかった。また、多チャンネル心電図計測データから心室遅延電位発生部位の位置、大きさ、形状を推定する試みもなされてきたが、そのような位置推定を行なうには精度が不十分であり、到底満足できるものではなかった。
【0009】
現在のところ、侵襲的検査であるカテーテルを用いた心内膜マッピングを行ない、fragmented activityを見ることによって心筋内興奮の不均一伝播部位の同定を行なっている。特に、このカテーテルを用いた電気生理学的検査で心筋内興奮の不均一伝播部位を同定し、さらに異常興奮伝播部位を高周波で焼灼するという治療(カテーテル焼灼法)を兼ね備えた方法が採用されている。
【0010】
しかしながら、この方法では、胸部X線透視をしながらカテーテルの挿入、移動などを行なうので、患者、医師、放射線技師は長時間にわたってX線被爆を受けることになる。特に、医師および放射線技師の年間X線被爆量が大きく、検査時間の大幅な短縮が強く望まれている。
【0011】
一方、地磁気の10億分の1程度の磁束を高感度に検出することができる超電導量子干渉素子(Superconducting Quantum Interference Device:以下、SQUIDと称する)を用いたSQUID磁束計がさまざまな分野で応用されている。特に、前述のように非侵襲性の計測が強く要望されている生体計測の分野では、SQUID磁束計を用いた人体の非接触磁気計測が試みられている。
【0012】
特に、近年の薄膜素子製造技術の進歩によりDC−SQUIDが開発されたことにより、SQUID磁束計を用いて心臓の磁界分布である心磁図を計測することが試みられつつある。
【0013】
【発明が解決しようとする課題】
しかしながら、心磁図だけでは、人体内における心筋内興奮の不均一伝播部位の位置、大きさ、形状を直接表示することはできず、心臓内における患部の相対的な位置関係を医師に的確に知らせることが困難であった。
【0014】
このため、心磁図が示す心磁界分布から心筋内の電流活動を可視化する方法が提案されてきた。そして、そのような方法として、1つまたは複数個の微小電流素片(電流ダイポール)で磁場源を模倣して可視化する方法が採用されてきた。このような方法では、WPW症候群における特殊な電気生理特性を有するバイパス回路(副伝播路)、たとえばKent束の位置推定については有効性が確認されている。
【0015】
一方、洞房結節から房室結節−ヒス束−プルキンエ繊維系に至る興奮伝播経路を、上述の電流ダイポールを用いた信号源推定法によって表現できることが確認されている。
【0016】
しかしながら、1つまたは複数個の電流ダイポールで磁場源を模倣して可視化する方法では、ある時刻における電流ダイポールの位置情報が得られるだけであり、心筋内で心室遅延電位が発生している部位、すなわち心筋内興奮の不均一伝播部位の位置、大きさ、形状を3次元的に同定することはできなかった。
【0017】
それゆえに、この発明の目的は、非侵襲的な磁気計測により得られた心筋内の3次元電気的活動状態を示すデータに基づいて、心筋内における心室遅延電位の発生部位、すなわち心筋内興奮の不均一伝播部位の位置関係を安全、迅速かつ高精度に3次元的に同定することができる心室遅延電位の心臓磁界診断装置および心筋内興奮不均一伝播部位の同定方法を提供することである。
【0018】
【課題を解決するための手段】
この発明による心室遅延電位の心臓磁界診断装置は、磁界分布計測手段と、第1の演算手段と、第2の演算手段と、表示装置とを備える。磁界分布計測手段は、被験者の胸部上の複数の座標における非接触磁気計測により複数の座標に対応する複数の磁界時系列データを取得し、かつ複数の磁界時系列データに基づいて胸部上の磁界分布時系列データを生成する。第1の演算手段は、生成された磁界分布時系列データに基づいて被験者の心筋内の3次元電気的活動状態を示すデータを生成する。第2の演算手段は、別途供給された被験者の胸部断層画像データを加工して解剖学的画像を示すデータを生成する。表示手段は、第1の演算手段により生成されたデータが示す心筋内の3次元電気的活動状態の画像を、第2の演算手段により生成されたデータが示す解剖学的画像に重ね合わせて表示する表示処理を行なう。これにより、心筋内興奮不均一伝播による心室遅延電位の局在を3次元的に同定することができる。
【0019】
好ましくは、第1の演算手段によって生成される心筋内の3次元電気的活動状態を示すデータは、心筋内興奮の伝播速度を示すデータである。
【0020】
さらに好ましくは、第1の演算手段は、心筋内の興奮伝播路部位を1つまたは複数の微小電流素片を用いて近似し、微小電流素片の位置の時間的変化を算出することにより、心筋内興奮の伝播速度を示すデータを生成する。
【0021】
さらに好ましくは、第1の演算手段は、算出された微小電流素片の位置の時間的変化に基づいて、興奮伝播路ごとの心筋内興奮の伝播速度の差を示すデータを生成する。
【0022】
この発明の他の局面に従うと、心室遅延電位の心臓磁界診断装置は、磁界分布計測手段と、演算手段と、表示手段とを備える。磁界分布計測手段は、被験者の胸部上の複数の座標における非接触磁気計測により複数の座標に対応する複数の磁界時系列データを取得し、かつ複数の磁界時系列データに基づいて胸部上の磁界分布時系列データを生成する。演算手段は、生成された磁界分布時系列データに基づいて被験者の心筋内の3次元電気的活動状態を示すデータを生成する。表示手段は、演算手段により生成されたデータに基づいて、被験者の心臓の洞房結節からヒス束−プルキンエ繊維系への刺激伝播経路を示す画像と、心筋内の3次元電気的活動状態を示す画像とを重ね合わせて表示する表示処理を行なう。これにより、心筋内興奮不均一伝播による心室遅延電位の局在を3次元的に同定することができる。
【0023】
好ましくは、演算手段によって生成される心筋内の3次元電気的活動状態を示すデータは、心筋内興奮の伝播速度を示すデータである。
【0024】
さらに好ましくは、演算手段は、心筋内興奮伝播路部位を1つまたは複数の微小電流素片を用いて近似し、微小電流素片の位置の時間的変化を算出することにより、心筋内興奮の伝播速度を示すデータを生成する。
【0025】
さらに好ましくは、演算手段は、算出された微小電流素片の位置の時間的変化に基づいて、興奮伝播路ごとの心筋内興奮の伝播速度の差を示すデータを生成する。
【0026】
この発明のさらに他の局面に従うと、心筋内興奮不均一伝播部位の同定方法は、被験者の胸部上の複数の座標における非接触磁気計測により取得された複数の座標に対応する複数の磁界時系列データに基づいて生成された胸部上の磁界分布時系列データに基づいて、被験者の心筋内の3次元電気的活動状態を示す第1のデータを生成するステップと、別途供給された被験者の胸部断層画像データを加工して解剖学的画像を示す第2のデータを生成するステップと、第1のデータが示す心筋内の3次元電気的活動状態の画像を、第2のデータが示す解剖学的画像に重ね合わせて表示することにより、心筋内興奮不均一伝播による心室遅延電位の局在を3次元的に同定することを可能にするステップとを備える。
【0027】
好ましくは、第1のデータが示す心筋内の3次元電気活動状態は、心筋内興奮の伝播速度である。
【0028】
さらに好ましくは、第1のデータを生成するステップは、心筋内興奮伝播路部位を1つまたは複数の微小電流素片を用いて近似し、微小電流素片の位置の時間的変化を算出することにより、心筋内興奮の伝播速度を示すデータを生成する。
【0029】
さらに好ましくは、第1のデータを生成するステップは、算出された微小電流素片の位置の時間的変化に基づいて、興奮伝播路ごとの伝播速度の差を示すデータを生成する。
【0030】
この発明のさらに他の局面に従うと、心筋内興奮不均一伝播部位の同定方法は、被験者の胸部上の複数の座標における非接触磁気計測により取得された複数の座標に対応する複数の磁界時系列データに基づいて生成された胸部上の磁界分布時系列データに基づいて、被験者の心筋内の3次元電気的活動状態を示すデータを生成するステップと、生成されたデータに基づいて、被験者の心臓の洞房結節からヒス束−プルキンエ繊維系への刺激伝播経路を示す画像と、心筋内の3次元電気的活動状態を示す画像とを重ね合わせて表示することにより、心筋内興奮不均一伝播による心室遅延電位の局在を3次元的に同定することを可能にするステップとを備える。
【0031】
好ましくは、データが示す心筋内の3次元電気的活動状態は、心筋内興奮の伝播速度である。
【0032】
さらに好ましくは、データを生成するステップは、心筋内の興奮伝播路部位を1つまたは複数の微小電流素片を用いて近似し、微小電流素片の位置の時間的変化を算出することにより、心筋内興奮の伝播速度を示すデータを生成する。
【0033】
さらに好ましくは、データを生成するステップは、算出された微小電流素片の位置の時間的変化に基づいて、興奮伝播路ごとの心筋内興奮の伝播速度の差を示すデータを生成する。
【0034】
したがって、この発明によれば、非侵襲的な磁気計測により得た心筋内の3次元電気的活動状態を示す画像を、他の医用診断装置で撮影された同一被験者の胸部断層画像データを加工して得られた解剖学的画像上に重ね合わせて表示することにより、心室頻拍の原因となる心室遅延電位の発生部位、すなわち心筋内の興奮不均一伝播部位の局在を医師が安全、迅速かつ高精度に同定することが可能となる。
【0035】
さらに、この発明によれば、非侵襲的な磁気計測により得た心筋内の3次元電気的活動状態を示す画像を、同一被験者の心臓の洞房結節からヒス束−プルキンエ繊維系への刺激伝播経路を示す画像上に重ね合わせて表示することにより、心室頻拍の原因となる心室遅延電位の発生部位、すなわち心筋内の興奮不均一伝播部位の局在を医師が安全、迅速かつ高精度に同定することが可能となる。
【0036】
【発明の実施の形態】
以下、この発明の実施の形態を図面を参照して詳しく説明する。なお、図中同一または相当部分には同一符号を付してその説明は繰返さない。
【0037】
[実施の形態1]
図1は、この発明の実施の形態1による、心室遅延電位の心臓磁界診断装置の構成を概略的に示す機能ブロック図である。
【0038】
図1を参照して、磁界分布計測装置1は、たとえば、後で詳述するSQUID磁束計のような計測手段を用いて、被験者の胸部上の複数の座標における非接触磁気計測を行ない、複数の座標に対応する複数の磁界時系列データを取得する。そして、取得した複数の磁界時系列データに基づいて、胸部上の、すなわち心臓磁場の磁界分布時系列データを生成して出力する。
【0039】
磁界分布計測装置1によって計測された心臓の磁界分布時系列データに基づいて、第1の演算装置2は、後述する公知の計算手法を用いて、心筋内の3次元電気的活動状態を示す第1のデータを生成して出力する。
【0040】
より特定的には、第1の演算装置2は、心筋内興奮の伝播速度を示すデータを生成する。この伝播速度は、後述するように、心筋内の興奮伝播路部位を1つまたは複数の微小電流素片すなわち電流ダイポールを用いて近似し、電流ダイポールの位置の時間的変化を算出することにより得られる。得られた電流ダイポールの時間的変化に基づいて、興奮伝播路ごとの伝播速度のデータが得られる。この結果、興奮の不均一伝播により発生する心室遅延電位の局在を特定することができる。
【0041】
一方、核磁気共鳴(MRI)法、X線CT法、心エコー図法、心筋SPECT法などの断層診断装置によって別途得られた同一被験者の胸部の断層画像データ(複数枚の断層画像データを含む)が、第2の演算装置3に与えられ、第2の演算装置3は、これらの断層画像データを加工して3次元的な解剖学的画像を示す第2のデータを生成して出力する。
【0042】
ここで、上述の第1のデータを画像で表現した場合、第1の演算装置2で得られた電気的活動状態が心筋内興奮の伝播速度であるときには、画面上に何らかの形で表示される興奮伝播路ごとの心筋内興奮の伝播速度の不均一に着目することによって、心室遅延電位の発生部位の3次元的な同定が可能となる。
【0043】
表示装置4は、第1の演算装置によって生成された第1のデータが示す心筋内の3次元電気的活動(たとえば興奮伝播路ごとの伝播速度)を示す画像を、第2の演算装置3によって生成された第2のデータが示す被験者の胸部の3次元解剖学的画像に重ね合せて表示する。この結果、解剖学的画像上において心筋内の心室遅延電位の局在を3次元的に同定することができる。
【0044】
次に、図2は、図1に示したこの発明の実施の形態1による心室遅延電位の心臓磁界診断装置の構成をより具体化して示したブロック図である。
【0045】
図2を参照して、磁界分布計測装置1は、磁気シールドルーム(Magnetic Shield Room:以下、MSR)11内において、被験者12の胸部上において非接触の磁気計測を行なうように設置された、SQUID磁束計を内蔵するデュワー13と、磁界分布データの演算部14とを備えている。
【0046】
デュワー13内には液体ヘリウムが満たされて超電導が生じる低温系の環境が形成されており、その中に、超電導体からなる検出コイルで構成されたSQUID磁束計が収納されている。
【0047】
図3は、図2に示したMSR11内のデュワー13内の超低温系に設置されるSQUID磁束計15、および常温系のMSR11内に設置される演算部14をより詳細に示すブロック図である。
【0048】
なお、図3に示した構成は、被験者の胸部上の1点の磁界データを計測するための1チャネル分の構成である。後述するように、この発明では、被験者の胸部上において複数の座標における磁場の多点同時計測を行なう。したがって、図2のMSR11内には、図3に示す1チャネル分の構成が、計測に必要な複数チャネル分設けられていることになる。
【0049】
以下に、図3を参照して、1チャネル分のSQUID磁束計による磁界データの生成について説明する。
【0050】
まず、SQUID磁束計15は、被験者の胸部表面から発生する磁場を検出するための、超電導体からなるピックアップコイル16を備える。ピックアップコイル16が磁場を捉えると電流が流れ、この電流はコイル17に引き込まれてNbシールド20内に磁場を生じさせる。
【0051】
この結果、この磁場に対して線形に変化する磁場が超電導ループ18内に形成され、この超電導ループ18の両端の電圧を、常温系のMSR11内に設置された演算部14の増幅器によって検出し、演算部14は、検出電圧に変化が生じないよう、Nbシールド20内のモジュレーションコイル19に流れる電流を調整する。
【0052】
すなわち、このSQUIDによる生体の磁場の検出は、発生する磁場を直接計測するものではなく、いわゆるゼロ位法を用いて、超電導リング18内の磁場が常に一定値となるようにフィードバックをかける(具体的にはモジュレーションコイル19に流れる電流を調整してモジュレーションコイル19に発生する磁場を制御することにより、超電導ループ18内に常に一定の磁場が生じるようにする)ことにより、ピックアップコイル16で検出される磁場を、演算部14が電気信号に変換して出力するものである。このようなフィードバックの手法は通常、フラックスロックトループ(flux locked loop:以下、FLL)と呼ばれる周知の技術である。
【0053】
このようなSQUID磁束計15およびその演算部14は周知の技術であるため、これ以上の説明を省略する。
【0054】
前述のように、図3に示した構成は、1チャネル分の磁界データの計測に必要な構成であり、被験者の胸部前面上における1点で計測された磁場の磁界時系列データを示す電気信号を出力するものである。
【0055】
この発明では、前述のように被験者の胸部前面に多くのセンサ(SQUID磁束計)を配列し、胸部前面上の磁場を多点測定しようとするものである。磁場は時間的に変化するものであり、たとえば1心拍に相当する期間中においても、測定場所が異なれば磁場は場所に応じた異なる変化をする。
【0056】
図4は、被験者の胸部前面上における複数のセンサ(各々が1チャネルのSQUID磁束計)の配置の一例を示す図である。また、図5は、図4の複数のセンサのそれぞれの位置に対応してそれぞれのセンサから得られた、1心拍期間における磁場の変化を示す1群の磁界時系列データを示している。
【0057】
図2に示す磁界分布計測装置1から出力されるデータは、図5に示すような複数の測定位置(座標)に対応する1群の磁界時系列データであるが、ある特定の時刻に着目してこれらの1群の磁界時系列データを捉えると、測定対象である胸部前面上におけるある時刻の磁場の強さの分布状態を示す実際の山谷の様子をグラフ(図)で表現するのは困難なので、天気図の気圧のように等高線図で表現している磁界分布データが得られる。この意味からも、磁界分布計測装置1から出力されるデータは、胸部前面上の磁界分布時系列データとして捉えることができる。
【0058】
磁界分布計測装置1から出力されるこのような1群の磁界時系列データ、すなわち磁界分布時系列データは、図2の第1の演算装置2に与えられる。この第1の演算装置2は、磁界分布データに基づいて胸部内の電気的活動、たとえば心筋内興奮の伝播速度を求めるように機能する。
【0059】
第1の演算装置2が、磁界分布計測装置1によって生成された磁界分布時系列データから、測定対象となる人体内の部位(この発明では心臓)における3次元的な電気的活動の情報、たとえば心筋内興奮の伝播速度を求める手法について説明する。
【0060】
第1の演算装置2は、磁界分布計測装置1によって生成された磁界分布時系列データを、1つまたは複数の微小電流素片(すなわち電流ダイポール)を用いて近似する。すなわち、計測された心磁界分布中に上記の微小電流素片をばらまき、周知の解析方法により、それぞれの測定点に対応する各微小電流素片のパラメータ(位置情報および電流ベクトル)を決定する。このような電流ダイポールを用いた解析方法は、たとえば特開平5−157735号公報に詳細に開示されているように、周知の手法であり、ここではその詳細な説明は省略する。
【0061】
上述の解析手法を用いて、ある時刻における心磁界分布内の各微小電流素片のパラメータ(すなわち、その位置および電流の方向)が決定されれば、その経時的な変化を観測することにより、電流の伝播速度に関する情報を得ることができる。
【0062】
第1の演算装置2は、まず、このような微小電流素片の位置および電流の方向の経時的な変化を示すデータを生成し、表示装置4の一方入力に与える。また、第1の演算装置2は、上述の経時的な変化に基づいて心筋内興奮の伝播速度を計算し、その結果を数値データとして生成してもよく、さらには伝播速度の速さを矢印の長さなどで可視表示する画像データとして生成してもよい。
【0063】
このようにして、第1の演算装置2は、磁界分布計測装置1によって生成された磁界分布データから解析対象である心筋内興奮の伝播速度を示す種々の形態の時系列データを生成し、表示装置4の一方入力に与える。
【0064】
一方、図2に示す第2の演算装置3には、図示しない他の断層診断装置、たとえばMRI法、X線CT法、心エコー図法、心筋SPECT法などを用いて予め、心電図同期トリガをかけて撮影された同一被験者の胸部の複数のスライス画像(たとえば5ミリピッチで十数枚程度)の画像データが入力される。
【0065】
第2の演算装置3は、これらの複数のスライス画像のデータを加工(補間)して所定視点から3次元透視変換を施し、解剖学的画像を示す第2のデータを生成する。このように複数のスライス画像から3次元的な解剖学的画像を形成する技術は周知であり、たとえば特開平11−128224号公報、国際公開WO98/15226号公報などに詳細に開示されている。したがって、その詳細はここでは説明しない。
【0066】
このようにして、第2の演算装置3は、同一被験者の心臓付近の胸部の3次元的な解剖学的画像を示す第2のデータを生成し、表示装置4の他方入力に与える。
【0067】
図2の表示装置4は、第2の演算装置3からの第2のデータに基づいて形成した被験者の胸部の3次元的な解剖学的画像上に、第1の演算装置2からの第1のデータに基づいて形成した心筋内の微小電流素片の位置および電流の方向の経時的な変化を示す画像を重ね合わせて表示する。
【0068】
図6は、表示装置4によって表示される3次元的な解剖学的画像に重ね合わされた、ある時刻における心磁界分布内の心筋内興奮電流を表わす微小電流素片の位置および方向、ならびにその時刻に至るまでの興奮伝播路を表示した態様を示す図である。
【0069】
図6は、たとえば被験者の胸部を5ミリピッチでスライスして得た5枚程度の断層画像を補間処理した3次元的画像である。実際の表示画像の奥行き感を図面上で表現することは困難ではあるが、複数のスライス画像の合成により形成された奥行き感のある立体的な解剖学的画像を示しているものとする。
【0070】
図6において、Aで示す矢印は、その時刻における心筋内興奮電流を表わす微小電流素片の位置および方向を示し、矢印の長さは電流の大きさを示している。また、B,C,Dで示す太線は、当該時刻に至るまでに、微小電流素片によって心磁場を近似して得られた心筋内の興奮伝播路の軌跡を示しており、具体的には、微小電流素片の位置の変化を経時的につなぎ合わせたものである。
【0071】
したがって、心筋内興奮の伝播速度の遅い部位では、微小電流素片のそのときどきの位置からなる軌跡は密となり、逆に伝播速度の速い部位では、微小電流素片のそのときどきの位置からなる軌跡は粗となる。したがって、画面上に表示された興奮伝播路を示す太線B,C,Dの各々を構成する微小電流素片位置の粗密によって、それぞれの心筋内興奮の伝播速度を視覚的に認識することが可能となる。
【0072】
また、前述のように、第1の演算装置2によってそれぞれの心筋内興奮の伝播速度そのものを算出して数値として表示装置4上に表示してもよい。
【0073】
このように、深さのある3次元的な解剖学的画像上に、心筋内興奮の伝播速度を興奮伝播路ごとに表示することにより、医師は心筋内の心室遅延電位の発生部位、すなわち心筋内興奮の不均一伝播部位の解剖学的画像上における相対的な位置関係を的確に把握することができる。
【0074】
図7は、以上の実施の形態1による心臓磁界診断装置によって実行される心筋内興奮の不均一伝播部位の同定方法を示すフロー図である。
【0075】
図7を参照すると、まずステップS1において、磁界分布計測装置1により、人体胸部上の複数の座標において非接触磁気計測を行ない、複数の時系列データを生成し、必要であれば記録する。
【0076】
次に、ステップS2において、予め心電図同期トリガをかけて撮影した複数のMRI画像に対して、第2の演算装置3により補間演算(所定視点からの3次元透視変換)を施し、3次元の解剖学的画像を得る。
【0077】
次に、ステップS3において、解析の初期時刻をts、解析の終了時刻をte、解析の時間間隔をΔtと定める。
【0078】
次に、ステップS4において、解析時刻tに初期時刻tsを代入して解析を開始する。そして、ステップS5において、解析時刻tが終了時刻teに達するまで、以下のループ状の処理を繰り返して行なう。
【0079】
すなわち、ステップS6において、第1の演算装置2により、指定解析時刻tにおける心臓磁界分布データを1つまたは複数の微小電流素片で近似して心筋内の興奮電流の位置、方向、大きさに関するデータを得る。
【0080】
次に、ステップS7において、時間Δtだけ先行する前回のループのステップS6において得られた、時刻t−Δtにおける心筋内興奮電流の位置、方向、大きさに関するデータと、今回ステップS6において得られた時刻tにおけるデータとを対比して、心筋内興奮の伝播速度を算出する。
【0081】
次に、ステップS8において、表示装置4により、心筋内興奮の伝播速度を示すデータを、所定視点から3次元透視変換を施した解剖学的画像に重ね合わせて表示する。
【0082】
次に、ステップS9において解析時刻tにΔtを加算する。
これらのステップS6〜S9の処理が、解析時刻tが終了時刻teに達したことがステップS5で判断されるまで繰返され、終了時刻teに達すると、解剖学的画像に重ね合わされた心筋内興奮の伝播速度を表わすデータの表示を終了する。
【0083】
以上のように、この発明の実施の形態1によれば、SQUID磁束計を用いた被験者の胸部上の非侵襲的な磁気計測によって得られた心筋内興奮の伝播速度を示す画像を3次元的解剖学的画像に重ねて表示することにより、心室頻拍の原因となる心筋内の心室遅延電位の発生部位、すなわち心筋内興奮の不均一伝播部位の解剖学的位置関係、大きさ、形状を医師が3次元的に同定することが可能となる。
【0084】
特に、高周波によるカテーテル焼灼法による治療を行なう場合には、カテーテルを用いて行なう電気生理学的検査の対象領域を事前に著しく絞り込むことが可能となり、X線透視を実施しながら行なう検査時間を著しく短縮することができる。この結果、医師および放射線技師の年間X線被爆線量を著しく軽減することができる。
【0085】
また、この実施の形態1による心筋内興奮の不均一伝播部位の同定方法を、高周波によるカテーテル焼灼法と併用することにより、低侵襲性の内科的手術で心室頻拍を治療することができ、患者の負担をさらに軽減することができる。
【0086】
[実施の形態2]
上述の実施の形態1では、解剖学的画像を形成するために、被験者の多数の断層像を得る必要があり、MRI法、X線CT法等による検査を事前に行なっていた。このため、検査回数が多くなり、患者の負担となるとともに、検査と直結した治療を行なうことができなかった。
【0087】
この発明の実施の形態2は、解剖学的画像の形成を不要とすることにより、検査回数を減らし、診断と検査とを直結して実施することができる心室遅延電位の心臓磁界診断装置および心筋内興奮の不均一伝播部位の同定方法を提供するものである。
【0088】
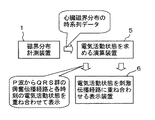
図8は、この発明の実施の形態2による心室遅延電位の心臓磁界診断装置の構成を概略的に示す機能ブロック図である。
【0089】
図8を参照して、磁界分布計測装置1については、実施の形態1に関連して既に説明したので、ここでは繰返して説明しない。
【0090】
磁界分布計測装置1によって生成された磁界分布時系列データは、演算装置5に与えられる。演算装置5は、与えられた磁界分布時系列データに基づいて、先に述べた電流ダイポールを用いる解析手法を用いて、心筋内の3次元電気的活動状態、たとえば心筋内の興奮電流に関するデータを生成する。そして、演算装置5は、生成された興奮電流に関するデータに基づいて、心電図のP波からQRS群に相当する期間の心室の心筋内の興奮(刺激)伝播経路を示すデータと、心筋内興奮の伝播速度を示すデータとを、重ね合わせて発生し、表示装置6に与える。
【0091】
表示装置6は、演算装置5によって生成されたデータが示す心筋内興奮の伝播速度を示す画像を、同じく演算装置5によって求められた心電図のP波からQRS群の期間に相当する興奮伝播経路の3次元的画像に重ね合わせて表示する。この結果、実施の形態1のような解剖学的画像を用いなくても、心筋内興奮の不均一伝播部位の位置関係を3次元的に同定することが可能となる。
【0092】
次に、図9は、図8に示したこの発明の実施の形態2による心室遅延電位の心臓磁界診断装置の構成をより具体化して示したブロック図である。
【0093】
図9を参照して、磁界分布計測装置1は、図2および図3に関連して説明した磁界分布計測装置1と同じなので、ここでは説明を省略する。
【0094】
磁界分布計測装置1から出力された磁界分布時系列データは、図9の演算装置5に与えられ、この演算装置5は、前述の電流ダイポールを用いた解析方法により、磁界分布時系列データから、心筋内の興奮電流に関するデータを生成する。
【0095】
ここで、被験者12の心電図を記録する心電計21が設けられており、これにより測定された被験者12の心電図波形データは演算装置5に与えられる。
【0096】
ここで、心電図の波形と、生成された心筋内興奮電流に関するデータとを対応づければ、心電図と、心臓において発生している事象との対応づけも可能となる。
【0097】
ここで、図10の(a)は、心臓における正常な刺激伝播経路を模式的に示す図であり、(b)は1心拍分の心電図波形を示している。
【0098】
図10を参照して、心臓の洞房結節は心拍を決定するペースメーカとしての機能を有し、一定間隔(心電図のP波のタイミング)で発火してパルスを発生する。このパルスは、決められた刺激伝播経路を介して房室結節に伝わり、ここで一定時間遅延後、ヒス(HIS)束からプルキンエ繊維系を介して下方の心室にパルスを伝達し、一気に心筋の収縮が生じる。このヒス束からプルキンエ繊維系の刺激の伝播は、心電図のQRS群の期間に相当する。
【0099】
したがって、このP波からQRS群の期間に関連づけた心臓磁界、すなわち心筋内興奮電流の解析により、演算装置5は、図10(a)において示すような正常ルートとしての刺激伝播経路を示す画像データを生成する。
【0100】
このような図10(a)に示す刺激伝播経路の画像は、実施の形態1の解剖学的画像の代わりにテンプレート表示として使用することができる。すなわち、実施の形態1のような3次元の解剖学的画像がなくても、この図10(a)に示す正常ルートの刺激伝播経路が表示されれば、その周辺の心室に生じた、心室遅延電位部位、すなわち心筋内興奮の不均一伝播部位は、医師であれば容易に解剖学的な対応づけが可能であり、その位置、大きさ、形状を同定することができる。
【0101】
図9の演算装置5は、このようなテンプレートとしての刺激伝播経路の表示に重ね合わせて、生成された心筋内興奮の伝播速度を示すデータを生成する。前述のように、心筋内興奮の伝播速度を表わす画像に着目することによって、心室における心筋内興奮の不均一伝播部位または心室遅延電位発生部位を見出すことが可能である。そのような画像データが上述のテンプレートの画像データに合成されて、表示装置6に与えられる。
【0102】
図9に示す表示装置6は、演算装置5からのデータに基づいて、テンプレートとしての正常な刺激伝播経路に重ね合わせて、心筋内興奮の伝播速度を示す画像を表示する。これにより、医師は、心室筋においてリエントリ回路が形成されやすい状態となっているか否かの判断を容易に行なうことができる。
【0103】
図11は、表示装置6によって実際に表示される画面の一例であり、テンプレートとしての正常刺激伝播経路に重ね合わせて、興奮伝播路ごとの心筋内興奮の伝播速度を示す画像が表示されている。
【0104】
図11において、2つの矢印はそれぞれ微小電流素片(電流ダイポール)によって近似された興奮伝播路の位置を表わしており、特に各矢印の長さは興奮伝播速度の速さを表わしている。
【0105】
医師であれば、図11に示すテンプレートとしての正常刺激伝播経路に対するそれぞれの興奮伝播路の相対的位置関係に基づいて、容易に解剖学的な対応づけが可能である。また、それぞれの興奮伝播路間の伝播速度の差異に基づいて、心室における心室遅延電位発生部位、すなわち心筋内興奮の不均一伝播部位の位置、大きさ、形状を同定することができる。
【0106】
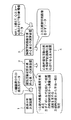
図12および図13は、以上の実施の形態2による心室遅延電位の診断装置によって実行された心筋内興奮の不均一伝播部位の同定方法を示すフロー図である。
【0107】
まず、図12を参照して、ステップS11において、磁界分布計測装置1を用いて人体胸部上の複数の座標において非接触磁気計測を行ない、複数の磁界時系列データを生成し記録する。
【0108】
次に、ステップS12において、解析の初期時間を、心電図のP波開始時刻tsPと定め、解析終了時刻を心電図のQRS群終了時刻teQRSと定め、解析の時間間隔をΔTと定める。
【0109】
次に、ステップS13において、解析時刻tに、P波の開始時刻であるtsPを代入する。
【0110】
そして、ステップS14において、解析時間が終了時刻teQRSに到達するまで、以下のステップS15〜17の処理が繰返される。
【0111】
すなわち、ステップS15において、演算装置5により、指定解析時刻tにおける心臓磁界分布データを1つまたは複数の微小電流素片で近似して心筋内の興奮電流の位置、方向、大きさに関するデータを得る。
【0112】
次に、ステップS16において、ステップS15で得た心筋内興奮電流のデータに所定視点から3次元透視変換を施した画像を表示する。
【0113】
次に、ステップS17において、解析時刻tにΔtを加算し、ステップS14に戻って終了時刻teQRSに達したか否かを判定する。ここで終了時刻teQRSに達したことが判定されると、心電図の波形のうちP波からQRS群に相当する期間に対応づけて図10(a)に示す正常ルートである刺激伝播経路を示す画像データが得られたことになる。
【0114】
次に、図13のステップS18に進み、解析の初期時刻をtsと定め、解析の終了時刻とteと定め、解析時間間隔をΔtと定める。
【0115】
次に、ステップS19において、解析時刻tに初期時刻tsを代入する。
次に、ステップS20において、解析時刻tが終了時刻teに到達したことが判断されるまで、以下のステップS21〜S24がループ状に実行される。
【0116】
すなわち、ステップS21において、演算装置5により、指定解析時刻tにおける心臓磁界分布データを1つまたは複数の微小電流素片で近似して心筋内の興奮電流の位置、方向、大きさに関するデータを得る。
【0117】
次に、ステップS22において、時間Δtだけ先行する前回のループのステップS21において得られた、時刻t−Δtにおける心筋内興奮電流の位置、方向大きさに関するデータと、今回ステップS21で得られた時刻tにおけるデータとを対比して、心筋内興奮の伝播速度を算出する。
【0118】
次に、ステップS23において、表示装置6により、心筋内興奮の伝播速度を表わすデータを、所定視点から3次元透視変換を施した正常刺激伝播回路の画像に重ね合わせて表示する。
【0119】
さらにステップS24において、解析時刻tにΔtを加算し、ステップS20に戻って終了時刻teに達したか否かを判定する。これにより、心筋内興奮の伝播速度を示すデータが、図12のフロー図で得られた刺激伝播経路(図10(a))の画像に重ね合わせて表示されることになる。
【0120】
以上のように、この発明の実施の形態2によれば、SQUID磁束計を用いた被験者の胸部上の非侵襲的な磁気計測によって得られた心筋内興奮の伝播速度を示す画像を、テンプレートとしての正常刺激伝播経路に重ねて表示することにより、他の解剖学的画像と重ね合せることなく、心室頻拍の原因となる心筋内の心室遅延電位の発生部位、すなわち心筋内興奮の不均一伝播部位の刺激伝播経路に対する相対的な位置関係、大きさ、形状を医師が3次元的に同定することが可能となる。したがって、この実施の形態2では、解剖学的画像を得るための事前の検査を省略することができる。
【0121】
特に、高周波によるカテーテル焼灼法による治療を行なう場合には、カテーテルを用いて行なう電気生理学的検査の対象領域を事前に著しく絞り込むことが可能となり、X線透視を実施しながら行なう検査時間を著しく短縮することができる。この結果、医師および放射線技師の年間X線被爆線量を著しく軽減することができる。
【0122】
さらに、この実施の形態2による心筋内興奮の不均一伝播部位の同定方法を、高周波によるカテーテル焼灼法と併用することにより、低侵襲性の内科的手術で心室頻拍を治療することができ、患者の負担をさらに軽減することができる。
【0123】
なお、この発明の実施の形態2では、テンプレート表示としての正常刺激伝播経路の画像データを作成するために電流ダイポールを用いた興奮伝播路の近似を行なっていたが、このような正常刺激伝播経路の画像は、磁界分布計測装置1によって生成された磁界分布時系列データから、演算装置5が心筋内の電流密度分布を求めることによって得ることができる。このような磁界分布時系列データから、心筋内の電流密度分布を求める手法としては、以下の手法が挙げられる。すなわち、SAM(Synthetic Aperture Magnetometry)あるいはMUSIC(Multiple Signal Classification)などの種々の手法を用いることができる。SAMやMUSICは、これまで、レーダやソナーなどの分野で研究開発が行なわれてきたものであり、それぞれの手法は周知であるが、未だ心臓磁界の診断に応用されたことはない。
【0124】
SAMやMUSICの技術そのものは周知であり、またこれらの手法を用いて電流密度分布を求めるアルゴリズムは極めて複雑なため、ここではその詳細な説明を省略するが、SAMについては、1999年発行のProceedings of the 11th International Conference on Biomagnetismの“Reent Advances in Biomagnetism”(Tohoku University Press発行)の第302頁から第305頁のRobinson SE および Vrba J による“Functional Neuroimaging by Synthetic Aperture Magnetometry (SAM)”に詳細に説明されている。MUSICについては、平成9年1月25日発行の原宏および栗城真也による「脳磁気科学−SQUID計測と医学応用−」(オーム社)の第117頁から第119頁に詳細に説明されている。
【0125】
今回開示された実施の形態はすべての点で例示であって制限的なものではないと考えられるべきである。本発明の範囲は上記した説明ではなくて特許請求の範囲によって示され、特許請求の範囲と均等の意味および範囲内でのすべての変更が含まれることが意図される。
【0126】
【発明の効果】
以上のように、この発明によれば、患者の胸部上における非侵襲磁気計測によって得られた心筋内興奮の伝播速度を、3次元的な解剖学的画像上で可視表示することができるので、心室遅延電位の発生部位、すなわち心筋内興奮の不均一伝播部位の位置、大きさ、形状を3次元的に同定することができる。したがって、心室頻拍の原因となる心筋内興奮の不均一伝播部位または心室遅延電位発生部位を非侵襲で診断できるので、患者に負担を強いることなく、迅速かつ安全な検査を行なうことができる。
【0127】
特に、高周波によるカテーテル焼灼法による治療を行なう場合には、電気生理学的検査の対象領域を事前に著しく絞り込むことができ、医師および放射線技師のX線被爆量を著しく低減することができるという効果を奏する。
【0128】
この発明のさらに他の局面によると、同一被験者の洞房結節からヒス束−プルキンエ繊維系への正常刺激伝播経路に、心筋内興奮の伝播速度を重ね合わせて3次元表示することにより、解剖学的画像を得ることなく、心筋内興奮の不均一伝播部位の位置、すなわち心室遅延電位の局在や広がりを3次元的に同定することができる。また、解剖学的画像を得るための検査を省略でき、より経済効率に優れた診断を行なうことができるという効果を奏する。
【図面の簡単な説明】
【図1】 この発明の実施の形態1による心室遅延電位の心臓磁界診断装置の構成を概略的に示す機能ブロック図である。
【図2】 図1に示した心臓磁界診断装置の構成をより具体化して示したブロック図である。
【図3】 図2に示した磁界分布計測装置の詳細な構成を示すブロック図である。
【図4】 被験者の胸部前面上における複数の磁界センサの配列例を示す図である。
【図5】 図4の複数のセンサのそれぞれから得られた磁界時系列データを示す図である。
【図6】 表示装置4に表示される3次元的解剖学的画像の例を示す図である。
【図7】 この発明の実施の形態1による心臓磁界診断装置の動作を説明するフロー図である。
【図8】 この発明の実施の形態2による心室遅延電位の心臓磁界診断装置の構成を概略的に示す機能ブロック図である。
【図9】 図8に示したこの発明の実施の形態2による心臓磁界診断装置の構成をより具体化して示したブロック図である。
【図10】 心臓における正常刺激伝播経路および心電図波形を模式的に示す図である。
【図11】 表示装置6によって実際に表示された正常刺激伝播経路および興奮伝播路の画像を示す図である。
【図12】 実施の形態2による心臓磁界診断装置の動作の前半を説明するフロー図である。
【図13】 実施の形態2による心臓磁界診断装置の動作の後半を説明するフロー図である。
【符号の説明】
1 磁界分布計測装置、2 第1の演算装置、3 第2の演算装置、4,6 表示装置、5 演算装置、11 MSR、12 被験者、13 デュワー、14演算部、15 SQUID磁束計、16 検出コイル、17 コイル、18 超電導ループ、19 モジュレーションコイル、20 Nbシールド、21 心電計。[0001]
BACKGROUND OF THE INVENTION
The present invention relates to a cardiac magnetic field diagnostic apparatus for ventricular delayed potential and a method for identifying an intramyocardial excitation non-uniform propagation site, and more specifically, a ventricular delayed potential that causes ventricular tachycardia, that is, an intramyocardial excitation non-uniform propagation site. The present invention relates to a cardiac magnetic field diagnostic apparatus for ventricular delayed potential for non-invasively diagnosing the three-dimensional generation position of the subject by non-contact magnetic measurement, and a method for identifying an intra-myocardial non-uniform propagation site.
[0002]
[Prior art]
Conventionally, a method of recording an electrocardiogram is generally employed to diagnose a heart disease.
[0003]
However, conventional electrocardiograms are insufficient for estimating the position, size, and shape of a site to be treated, for example, during cardiac surgery, and it has not been possible to satisfactorily estimate the position of an affected area.
[0004]
This is because the electrocardiogram is an indirect measurement method. In other words, the tissue existing from the heart to the body surface, the positional relationship between the heart and other organs and bones, the size of the heart, the electrical conductivity of each tissue of the human body, etc. vary greatly from subject to subject. It has been extremely difficult to accurately identify the position of the affected area using information obtained by such indirect measurement.
[0005]
On the other hand, recent studies have shown that ventricular tachycardia is induced when patchy tissue is formed in normal myocardial tissue after a certain period from the onset of myocardial infarction or due to heart disease such as cardiomyopathy Has been.
[0006]
The patchy tissue refers to a state in which necrotic or degenerated tissue is present in an island shape in normal myocardial tissue. Uneven excitement propagation occurs in such a myocardial region, and a ventricular delay potential is generated. Further, in such a patchy tissue, a double excitation propagation path (reentry circuit) may be formed due to a difference in electrical conduction characteristics between necrotic or degenerated tissue and normal tissue.
[0007]
That is, the excitement signal turns in the reentry circuit, resulting in a ventricular tachycardia. Therefore, there is a strong demand to accurately identify such a ventricular delayed potential generation site three-dimensionally.
[0008]
However, as described above, in the electrocardiogram, although the presence or absence of the ventricular delayed potential can be detected non-invasively using the technique of synchronous addition of the electrocardiogram, the localization of the non-uniform propagation site of intramyocardial excitation is detected. Dimensional identification was not possible. In addition, attempts have been made to estimate the position, size, and shape of the ventricular delayed potential generation site from multi-channel ECG measurement data, but the accuracy is insufficient to perform such position estimation, which is satisfactory. It wasn't.
[0009]
At present, endocardial mapping using a catheter, which is an invasive test, is performed, and the site of heterogeneous propagation of intramyocardial excitation is identified by looking at the fragmented activity. In particular, a method that combines treatment (catheter ablation) to identify the heterogeneous propagation site of intramyocardial excitability by electrophysiological examination using this catheter and then cauterize abnormal excitation propagation site at high frequency is adopted. .
[0010]
However, in this method, the insertion, movement, and the like of the catheter are performed while performing chest X-ray fluoroscopy, so that the patient, doctor, and radiologist are exposed to X-ray exposure for a long time. In particular, the annual X-ray exposure doses of doctors and radiographers are large, and it is strongly desired to greatly shorten the examination time.
[0011]
On the other hand, SQUID magnetometers using a superconducting quantum interference device (hereinafter referred to as SQUID) that can detect magnetic flux of about one billionth of geomagnetism with high sensitivity are applied in various fields. ing. In particular, in the field of biological measurement where non-invasive measurement is strongly desired as described above, non-contact magnetic measurement of a human body using a SQUID magnetometer has been attempted.
[0012]
In particular, due to the development of DC-SQUID due to recent advances in thin film element manufacturing technology, attempts are being made to measure the magnetocardiogram, which is the magnetic field distribution of the heart, using a SQUID magnetometer.
[0013]
[Problems to be solved by the invention]
However, the magnetocardiogram alone cannot directly display the position, size, and shape of the non-uniform propagation site of intramyocardial excitation in the human body, and accurately informs the doctor of the relative positional relationship of the affected area in the heart. It was difficult.
[0014]
For this reason, a method has been proposed for visualizing the current activity in the myocardium from the magnetocardiogram distribution indicated by the magnetocardiogram. And as such a method, the method of imitating and visualizing a magnetic field source with one or a plurality of minute current elements (current dipole) has been adopted. Such a method has been confirmed to be effective for a position estimation of a bypass circuit (sub propagation path) having special electrophysiological characteristics in WPW syndrome, for example, the Kent bundle.
[0015]
On the other hand, it has been confirmed that the excitation propagation path from the sinoatrial node to the atrioventricular node-His bundle-Purkinje fiber system can be expressed by the signal source estimation method using the above-described current dipole.
[0016]
However, in the method of visualizing by imitating a magnetic field source with one or a plurality of current dipoles, only the position information of the current dipole at a certain time can be obtained, and the site where the ventricular delayed potential is generated in the myocardium, That is, the position, size, and shape of the non-uniform propagation site of intramyocardial excitation could not be identified three-dimensionally.
[0017]
Therefore, an object of the present invention is to generate a ventricular delayed potential site in the myocardium, that is, an intramyocardial excitation based on data indicating a three-dimensional electrical activity state in the myocardium obtained by noninvasive magnetic measurement. To provide a cardiac magnetic field diagnostic apparatus for ventricular delayed potential and a method for identifying an intra-myocardial excitation non-uniform propagation site capable of three-dimensionally identifying the positional relationship of the non-uniform propagation site safely, quickly and with high accuracy.
[0018]
[Means for Solving the Problems]
A cardiac magnetic field diagnostic apparatus for ventricular delayed potential according to the present invention comprises a magnetic field distribution measuring means, a first computing means, a second computing means, and a display device. The magnetic field distribution measuring means acquires a plurality of magnetic field time-series data corresponding to a plurality of coordinates by non-contact magnetic measurement at a plurality of coordinates on the chest of the subject, and a magnetic field on the chest based on the plurality of magnetic field time-series data Generate distributed time series data. The first calculation means generates data indicating a three-dimensional electrical activity state in the subject's myocardium based on the generated magnetic field distribution time-series data. The second computing means processes the tomographic image data of the subject supplied separately to generate data indicating an anatomical image. The display means superimposes and displays an image of the three-dimensional electrical activity state in the myocardium indicated by the data generated by the first calculation means on the anatomical image indicated by the data generated by the second calculation means. Display processing to be performed. As a result, it is possible to three-dimensionally identify the localization of the ventricular delayed potential due to non-uniform propagation of intramyocardial excitation.
[0019]
Preferably, the data indicating the three-dimensional electrical activity state in the myocardium generated by the first calculating means is data indicating the propagation speed of intramyocardial excitation.
[0020]
More preferably, the first calculation means approximates the excitation propagation path site in the myocardium using one or a plurality of minute current elements, and calculates a temporal change in the position of the minute current element, Data indicating the propagation speed of intramyocardial excitation is generated.
[0021]
More preferably, the first calculation means generates data indicating a difference in propagation speed of intramyocardial excitation for each excitation propagation path based on the temporal change of the calculated position of the minute current element.
[0022]
According to another aspect of the present invention, a cardiac magnetic field diagnostic apparatus for ventricular delay potential includes a magnetic field distribution measuring means, a computing means, and a display means. The magnetic field distribution measuring means acquires a plurality of magnetic field time-series data corresponding to a plurality of coordinates by non-contact magnetic measurement at a plurality of coordinates on the chest of the subject, and a magnetic field on the chest based on the plurality of magnetic field time-series data Generate distributed time series data. The calculation means generates data indicating a three-dimensional electrical activity state in the subject's myocardium based on the generated magnetic field distribution time-series data. The display means is an image showing a stimulus propagation path from the sinoatrial node of the subject's heart to the His bundle-Purkinje fiber system based on the data generated by the computing means, and an image showing the three-dimensional electrical activity state in the myocardium Display processing is performed to superimpose and display. As a result, it is possible to three-dimensionally identify the localization of the ventricular delayed potential due to non-uniform propagation of intramyocardial excitation.
[0023]
Preferably, the data indicating the three-dimensional electrical activity state in the myocardium generated by the calculation means is data indicating the propagation speed of intramyocardial excitation.
[0024]
More preferably, the calculation means approximates the intramyocardial excitation propagation path using one or more minute current elements, and calculates temporal changes in the position of the minute current elements, thereby Generate data indicating propagation speed.
[0025]
More preferably, the calculation means generates data indicating a difference in propagation speed of intramyocardial excitation for each excitation propagation path based on the temporal change of the calculated position of the minute current element.
[0026]
According to still another aspect of the present invention, a method for identifying an intra-myocardial excitation non-uniform propagation site includes a plurality of magnetic field time series corresponding to a plurality of coordinates acquired by non-contact magnetic measurement at a plurality of coordinates on a subject's chest. Generating first data indicating a three-dimensional electrical activity state in the subject's myocardium based on magnetic field distribution time-series data on the chest generated based on the data; Processing the image data to generate second data indicating an anatomical image, and an image of the three-dimensional electrical activity state in the myocardium indicated by the first data is indicated by the second data. By superimposing and displaying on the image, it is possible to three-dimensionally identify the localization of the ventricular delayed potential due to non-uniform propagation of intra-myocardial excitation.
[0027]
Preferably, the three-dimensional electrical activity state in the myocardium indicated by the first data is a propagation speed of intramyocardial excitation.
[0028]
More preferably, the step of generating the first data includes approximating an intramyocardial excitation propagation path portion using one or a plurality of minute current elements, and calculating a temporal change in the position of the minute current element. Thus, data indicating the propagation speed of intramyocardial excitation is generated.
[0029]
More preferably, the step of generating the first data generates data indicating a difference in propagation speed for each excitation propagation path based on the temporal change in the calculated position of the minute current element.
[0030]
According to still another aspect of the present invention, a method for identifying an intra-myocardial excitation non-uniform propagation site includes a plurality of magnetic field time series corresponding to a plurality of coordinates acquired by non-contact magnetic measurement at a plurality of coordinates on a subject's chest. Generating data indicating a three-dimensional electrical activity state in the subject's myocardium based on the magnetic field distribution time series data on the chest generated based on the data, and the subject's heart based on the generated data The ventricle due to non-uniform propagation of intra-myocardial excitation is displayed by superimposing and displaying an image showing a stimulus propagation path from the sinoatrial node to the His bundle-Purkinje fiber system and an image showing a three-dimensional electrical activity state in the myocardium. Allowing the localization of the delayed potential to be identified three-dimensionally.
[0031]
Preferably, the three-dimensional electrical activity state in the myocardium indicated by the data is the propagation speed of intramyocardial excitation.
[0032]
More preferably, the step of generating data approximates the excitation propagation path site in the myocardium using one or a plurality of minute current elements, and calculates a temporal change in the position of the minute current element, Data indicating the propagation speed of intramyocardial excitation is generated.
[0033]
More preferably, the step of generating data generates data indicating a difference in propagation speed of intramyocardial excitation for each excitation propagation path based on the temporal change in the position of the calculated minute current element.
[0034]
Therefore, according to the present invention, an image showing a three-dimensional electrical activity state in the myocardium obtained by noninvasive magnetic measurement is processed from the tomographic image data of the same subject taken by another medical diagnostic apparatus. By superimposing and displaying on the anatomical image obtained in this way, the doctor can safely and quickly locate the location of the ventricular delayed potential that causes ventricular tachycardia, that is, the location of the heterogeneous propagation site in the myocardium. And it becomes possible to identify with high precision.
[0035]
Further, according to the present invention, an image showing a three-dimensional electrical activity state in the myocardium obtained by non-invasive magnetic measurement is transmitted from the sinoatrial node of the heart of the same subject to the His bundle-Purkinje fiber system. By superimposing and displaying the image on the image indicating the presence of the ventricular tachycardia, the location of the ventricular delayed potential, that is, the location of the heterogeneous propagation site in the myocardium, can be safely, quickly and accurately identified by the doctor. It becomes possible to do.
[0036]
DETAILED DESCRIPTION OF THE INVENTION
Hereinafter, embodiments of the present invention will be described in detail with reference to the drawings. In the drawings, the same or corresponding parts are denoted by the same reference numerals and description thereof will not be repeated.
[0037]
[Embodiment 1]
FIG. 1 is a functional block diagram schematically showing a configuration of a cardiac magnetic field diagnostic apparatus for ventricular delayed potential according to
[0038]
Referring to FIG. 1, magnetic field
[0039]
Based on the magnetic field distribution time series data of the heart measured by the magnetic field
[0040]
More specifically, the
[0041]
On the other hand, tomographic image data (including multiple pieces of tomographic image data) of the chest of the same subject obtained separately by a tomographic diagnostic apparatus such as nuclear magnetic resonance (MRI), X-ray CT, echocardiography, myocardial SPECT or the like Is provided to the second
[0042]
Here, when the first data described above is expressed as an image, if the electrical activity state obtained by the first
[0043]
The
[0044]
Next, FIG. 2 is a block diagram showing a more specific configuration of the cardiac magnetic field diagnostic apparatus for ventricular delay potential according to
[0045]
Referring to FIG. 2, a magnetic field
[0046]
The
[0047]
FIG. 3 is a block diagram showing in more detail the
[0048]
Note that the configuration shown in FIG. 3 is a configuration for one channel for measuring magnetic field data at one point on the subject's chest. As will be described later, in the present invention, multipoint simultaneous measurement of magnetic fields at a plurality of coordinates is performed on the subject's chest. Therefore, the configuration for one channel shown in FIG. 3 is provided in the
[0049]
Hereinafter, generation of magnetic field data by the SQUID magnetometer for one channel will be described with reference to FIG.
[0050]
First, the
[0051]
As a result, a magnetic field that changes linearly with respect to this magnetic field is formed in the
[0052]
That is, the detection of the magnetic field of the living body by this SQUID does not directly measure the generated magnetic field, but feedback is performed using the so-called zero position method so that the magnetic field in the
[0053]
Since such a
[0054]
As described above, the configuration shown in FIG. 3 is a configuration necessary for measuring the magnetic field data for one channel, and is an electric signal indicating the magnetic field time-series data of the magnetic field measured at one point on the front of the subject's chest. Is output.
[0055]
In the present invention, as described above, many sensors (SQUID magnetometers) are arranged on the front side of the subject's chest, and the magnetic field on the front side of the chest is to be measured at multiple points. The magnetic field changes with time. For example, even during a period corresponding to one heartbeat, the magnetic field changes differently depending on the location if the measurement location is different.
[0056]
FIG. 4 is a diagram showing an example of an arrangement of a plurality of sensors (each of which is a one-channel SQUID magnetometer) on the front of the subject's chest. FIG. 5 shows a group of magnetic field time-series data indicating changes in the magnetic field in one heartbeat period, obtained from each sensor corresponding to each position of the plurality of sensors in FIG.
[0057]
The data output from the magnetic field
[0058]
Such a group of magnetic field time-series data output from the magnetic field
[0059]
From the magnetic field distribution time-series data generated by the magnetic field
[0060]
The first
[0061]
Using the above analysis method, once the parameters of each microcurrent element in the magnetocardiogram distribution at a certain time (that is, its position and current direction) are determined, by observing its change over time, Information about the current propagation speed can be obtained.
[0062]
First, the first
[0063]
In this way, the first
[0064]
On the other hand, an electrocardiogram synchronization trigger is previously applied to the second
[0065]
The second
[0066]
In this way, the
[0067]
The
[0068]
FIG. 6 shows the position and direction of a minute current element representing the intramyocardial excitation current in the cardiac magnetic field distribution at a certain time and the time superimposed on the three-dimensional anatomical image displayed by the
[0069]
FIG. 6 is a three-dimensional image obtained by interpolating about five tomographic images obtained by slicing the chest of a subject at a pitch of 5 mm, for example. Although it is difficult to express the sense of depth of an actual display image on the drawing, a three-dimensional anatomical image having a sense of depth formed by combining a plurality of slice images is shown.
[0070]
In FIG. 6, the arrow indicated by A indicates the position and direction of the minute current element representing the intramyocardial excitation current at that time, and the length of the arrow indicates the magnitude of the current. In addition, the thick lines indicated by B, C, and D indicate the locus of the excitation propagation path in the myocardium obtained by approximating the cardiac magnetic field with a minute current element until the time, specifically, The change in the position of the minute current piece is connected over time.
[0071]
Therefore, in the part where the propagation speed of the intramyocardial excitation is slow, the locus composed of the current position of the minute current element is dense, and conversely, in the part where the propagation speed is fast, the locus composed of the current position of the minute current element. Becomes rough. Therefore, it is possible to visually recognize the propagation speed of each intramyocardial excitation by the density of the position of the minute current element constituting each of the thick lines B, C, D indicating the excitation propagation path displayed on the screen. It becomes.
[0072]
Further, as described above, the propagation speed of each intramyocardial excitement itself may be calculated by the first
[0073]
In this way, by displaying the propagation speed of intra-myocardial excitation for each excitation propagation path on a three-dimensional anatomical image having a depth, the doctor can generate a ventricular delayed potential in the myocardium, that is, the myocardium. It is possible to accurately grasp the relative positional relationship on the anatomical image of the non-uniform propagation site of internal excitement.
[0074]
FIG. 7 is a flowchart showing a method for identifying a non-uniform propagation site of intramyocardial excitation executed by the cardiac magnetic field diagnostic apparatus according to the first embodiment.
[0075]
Referring to FIG. 7, first, in step S1, the magnetic field
[0076]
Next, in step S2, interpolation calculation (three-dimensional perspective transformation from a predetermined viewpoint) is performed by the
[0077]
Next, in step S3, the initial analysis time is set to t. s , The end time of analysis is t e The time interval for analysis is defined as Δt.
[0078]
Next, in step S4, the initial time t is added to the analysis time t. s Substitute and start the analysis. In step S5, the analysis time t is the end time t. e The following loop processing is repeated until the value reaches.
[0079]
That is, in step S6, the first
[0080]
Next, in step S7, data on the position, direction, and magnitude of the intramyocardial excitation current at time t-Δt obtained in step S6 of the previous loop preceding the time Δt, and obtained in step S6 this time. The propagation speed of intramyocardial excitation is calculated by comparing with the data at time t.
[0081]
Next, in step S8, the
[0082]
Next, Δt is added to the analysis time t in step S9.
The processing of these steps S6 to S9 is the analysis time t is the end time t e Is repeated until it is determined in step S5 that the end time t e When the value reaches, the display of data representing the propagation speed of intramyocardial excitation superimposed on the anatomical image is terminated.
[0083]
As described above, according to the first embodiment of the present invention, an image showing the propagation speed of intramyocardial excitation obtained by noninvasive magnetic measurement on the subject's chest using the SQUID magnetometer is three-dimensionally displayed. By overlaying and displaying on the anatomical image, the anatomical positional relationship, size, and shape of the ventricular delayed potential generation site in the myocardium that causes ventricular tachycardia, that is, the uneven propagation site of intramyocardial excitation, It is possible for a doctor to identify three-dimensionally.
[0084]
In particular, when performing treatment using high-frequency catheter ablation, it is possible to narrow down the target area for electrophysiological examination using a catheter in advance, and to significantly reduce examination time while performing fluoroscopy. can do. As a result, the annual X-ray exposure dose of doctors and radiologist can be significantly reduced.
[0085]
In addition, by using the method for identifying the heterogeneous propagation site of intramyocardial excitation according to
[0086]
[Embodiment 2]
In the first embodiment described above, in order to form an anatomical image, it is necessary to obtain a large number of tomographic images of the subject, and examinations using the MRI method, the X-ray CT method, and the like have been performed in advance. For this reason, the number of examinations increases, which is a burden on the patient and treatment that is directly connected to the examination cannot be performed.
[0087]
[0088]
FIG. 8 is a functional block diagram schematically showing the configuration of a cardiac magnetic field diagnostic apparatus for ventricular delayed potential according to
[0089]
Referring to FIG. 8, magnetic field
[0090]
The magnetic field distribution time series data generated by the magnetic field
[0091]
The
[0092]
FIG. 9 is a block diagram showing a more specific configuration of the cardiac magnetic field diagnostic apparatus for ventricular delayed potential according to the second embodiment of the present invention shown in FIG.
[0093]
Referring to FIG. 9, magnetic field
[0094]
The magnetic field distribution time-series data output from the magnetic field
[0095]
Here, an
[0096]
Here, if the waveform of the electrocardiogram is associated with the generated data relating to the intramyocardial excitation current, the electrocardiogram can be associated with the event occurring in the heart.
[0097]
Here, FIG. 10A is a diagram schematically showing a normal stimulus propagation path in the heart, and FIG. 10B shows an electrocardiogram waveform for one heartbeat.
[0098]
Referring to FIG. 10, the sinoatrial node of the heart has a function as a pacemaker for determining a heartbeat, and fires at a constant interval (timing of P wave of electrocardiogram) to generate a pulse. This pulse is transmitted to the atrioventricular node through a predetermined stimulation propagation path, and after a certain time delay, the pulse is transmitted from the His (HIS) bundle to the lower ventricle through the Purkinje fiber system, Shrinkage occurs. The propagation of the Purkinje fiber-based stimulus from this His bundle corresponds to the period of the QRS group of the electrocardiogram.
[0099]
Therefore, by analyzing the cardiac magnetic field associated with the period of the QRS group from this P wave, that is, the intramyocardial excitation current, the
[0100]
Such an image of the stimulus propagation path shown in FIG. 10A can be used as a template display instead of the anatomical image of the first embodiment. That is, even if there is no three-dimensional anatomical image as in the first embodiment, if the normal route of stimulus propagation shown in FIG. 10A is displayed, the ventricle generated in the surrounding ventricle is displayed. The delayed potential site, that is, the site of non-uniform propagation of intramyocardial excitation can be easily anatomically matched by a doctor, and the position, size, and shape can be identified.
[0101]
The
[0102]
The
[0103]
FIG. 11 is an example of a screen that is actually displayed by the
[0104]
In FIG. 11, two arrows represent the positions of the excitation propagation paths approximated by minute current segments (current dipoles), and in particular, the length of each arrow represents the speed of excitation propagation speed.
[0105]
If it is a doctor, anatomical matching is easily possible based on the relative positional relationship of each excitation propagation path with respect to the normal stimulus propagation path as a template shown in FIG. Further, the position, size, and shape of the ventricular delayed potential generation site in the ventricle, that is, the non-uniform propagation site of intramyocardial excitation, can be identified based on the difference in propagation speed between the respective excitation propagation paths.
[0106]
FIGS. 12 and 13 are flowcharts showing the method for identifying the heterogeneous propagation site of intramyocardial excitation executed by the ventricular delayed potential diagnostic apparatus according to the second embodiment.
[0107]
First, referring to FIG. 12, in step S11, non-contact magnetic measurement is performed at a plurality of coordinates on the human chest using the magnetic field
[0108]
Next, in step S12, the initial analysis time is set as the P wave start time t of the electrocardiogram. sP The analysis end time is defined as the QRS group end time t of the electrocardiogram. eQRS And the analysis time interval is defined as ΔT.
[0109]
Next, in step S13, at the analysis time t, the start time of the P wave t sP Is assigned.
[0110]
In step S14, the analysis time is the end time t. eQRS The process of the following steps S15 to S17 is repeated until reaching.
[0111]
That is, in step S15, the
[0112]
Next, in step S16, an image obtained by performing three-dimensional perspective transformation from a predetermined viewpoint on the intramyocardial excitation current data obtained in step S15 is displayed.
[0113]
Next, in step S17, Δt is added to the analysis time t, and the process returns to step S14 to return to the end time t. eQRS It is determined whether or not it has been reached. End time t eQRS When it is determined that the signal has reached the value, image data indicating the stimulus propagation path, which is the normal route shown in FIG. 10A, is obtained in association with the period corresponding to the QRS group from the P wave in the ECG waveform. It will be.
[0114]
Next, the process proceeds to step S18 in FIG. s The analysis end time and t e And the analysis time interval is defined as Δt.
[0115]
Next, in step S19, the initial time t is added to the analysis time t. s Is assigned.
Next, in step S20, the analysis time t is the end time t. e The following steps S21 to S24 are executed in a loop until it is determined that the value has been reached.
[0116]
That is, in step S21, the
[0117]
Next, in step S22, data on the position and direction magnitude of the intramyocardial excitation current at time t-Δt obtained in step S21 of the previous loop preceding the time Δt, and the time obtained in step S21 this time. The propagation speed of intramyocardial excitation is calculated by comparison with the data at t.
[0118]
Next, in step S23, the
[0119]
Further, in step S24, Δt is added to the analysis time t, and the process returns to step S20 to return to the end time t. e It is determined whether or not it has been reached. As a result, the data indicating the propagation speed of intramyocardial excitation is displayed superimposed on the image of the stimulus propagation path (FIG. 10A) obtained in the flowchart of FIG.
[0120]
As described above, according to the second embodiment of the present invention, an image indicating the propagation speed of intramyocardial excitement obtained by noninvasive magnetic measurement on the subject's chest using a SQUID magnetometer is used as a template. By overlapping and displaying on the normal stimulus propagation path, the non-uniform propagation of intraventricular delayed potential in the myocardium that causes ventricular tachycardia, that is, without overlapping with other anatomical images, that is, intramyocardial excitation The doctor can three-dimensionally identify the relative positional relationship, size, and shape of the part with respect to the stimulus propagation path. Therefore, in the second embodiment, it is possible to omit a preliminary examination for obtaining an anatomical image.
[0121]
In particular, when performing treatment using high-frequency catheter ablation, it is possible to narrow down the target area for electrophysiological examination using a catheter in advance, and to significantly reduce examination time while performing fluoroscopy. can do. As a result, the annual X-ray exposure dose of doctors and radiologist can be significantly reduced.
[0122]
Furthermore, by using the method for identifying the heterogeneous propagation site of intramyocardial excitation according to
[0123]
In the second embodiment of the present invention, the excitation propagation path is approximated using a current dipole in order to create the image data of the normal stimulation propagation path as a template display. This image can be obtained when the
[0124]
The SAM and MUSIC technologies themselves are well known, and the algorithm for obtaining the current density distribution using these methods is extremely complicated, so a detailed description thereof will be omitted here, but SAM is a Proceedings published in 1999. Explain in detail in “Functional Neuroimaging by Synthetic Aperture Magnetometry (SAM)” by Robinson SE and Vrba J from page 302 to page 305 of “Reent Advances in Biomagnetism” (published by Tohoku University Press) of the 11th International Conference on Biomagnetism Has been. MUSIC is described in detail on pages 117 to 119 of “Neuromagnetic Science: SQUID Measurement and Medical Application” (Ohm Co., Ltd.) by Hiroshi Hara and Shinya Kuriki, published on January 25, 1997. .
[0125]
The embodiment disclosed this time should be considered as illustrative in all points and not restrictive. The scope of the present invention is defined by the terms of the claims, rather than the description above, and is intended to include any modifications within the scope and meaning equivalent to the terms of the claims.
[0126]
【The invention's effect】
As described above, according to the present invention, the propagation speed of intramyocardial excitation obtained by noninvasive magnetic measurement on the chest of a patient can be visually displayed on a three-dimensional anatomical image. It is possible to three-dimensionally identify the position, size, and shape of the ventricular delayed potential generation site, that is, the non-uniform propagation site of intramyocardial excitation. Therefore, since the site of non-uniform propagation of intramyocardial excitation or ventricular delayed potential generation site causing ventricular tachycardia can be diagnosed non-invasively, a quick and safe examination can be performed without imposing a burden on the patient.
[0127]
In particular, when performing treatment by high-frequency catheter ablation, the target area of electrophysiological examination can be remarkably narrowed in advance, and the X-ray exposure dose of doctors and radiologist can be significantly reduced. Play.
[0128]
According to still another aspect of the present invention, the propagation speed of intramyocardial excitation is superimposed and displayed in a three-dimensional manner on the normal stimulus propagation path from the sinoatrial node to the His bundle-Purkinje fiber system of the same subject. Without obtaining an image, it is possible to three-dimensionally identify the position of the non-uniform propagation site of intramyocardial excitation, that is, the localization and spread of the ventricular delay potential. In addition, an examination for obtaining an anatomical image can be omitted, and an effect that a more economically efficient diagnosis can be performed is achieved.
[Brief description of the drawings]
FIG. 1 is a functional block diagram schematically showing the configuration of a cardiac magnetic field diagnostic apparatus for ventricular delay potential according to
FIG. 2 is a block diagram showing a more specific configuration of the cardiac magnetic field diagnostic apparatus shown in FIG.
3 is a block diagram showing a detailed configuration of the magnetic field distribution measuring apparatus shown in FIG. 2. FIG.
FIG. 4 is a diagram showing an example of arrangement of a plurality of magnetic field sensors on the front surface of a subject's chest.
5 is a diagram showing magnetic field time-series data obtained from each of the plurality of sensors in FIG. 4. FIG.
6 is a diagram showing an example of a three-dimensional anatomical image displayed on the
FIG. 7 is a flowchart for explaining the operation of the cardiac magnetic field diagnostic apparatus according to
FIG. 8 is a functional block diagram schematically showing a configuration of a cardiac magnetic field diagnostic apparatus for ventricular delay potential according to
FIG. 9 is a block diagram showing a more specific configuration of the cardiac magnetic field diagnostic apparatus according to
FIG. 10 is a diagram schematically showing a normal stimulus propagation path and an electrocardiogram waveform in the heart.
11 is a diagram showing images of a normal stimulus propagation path and an excitation propagation path actually displayed by the
FIG. 12 is a flowchart for explaining the first half of the operation of the cardiac magnetic field diagnostic apparatus according to the second embodiment.
FIG. 13 is a flowchart illustrating the second half of the operation of the cardiac magnetic field diagnostic apparatus according to the second embodiment.
[Explanation of symbols]
DESCRIPTION OF
Claims (14)
被験者の胸部上の複数の座標における非接触磁気計測により前記複数の座標に対応する複数の磁界時系列データを取得し、かつ前記複数の磁界時系列データに基づいて前記胸部上の磁界分布時系列データを生成する磁界分布計測手段と、
前記生成された磁界分布時系列データに基づいて前記被験者の心筋内の3次元電気的活動状態を示すデータを生成する第1の演算手段と、
別途供給された前記被験者の胸部断層画像データを加工して解剖学的画像を示すデータを生成する第2の演算手段と、
前記第1の演算手段により生成されたデータが示す前記心筋内の3次元電気的活動状態の画像を、前記第2の演算手段により生成されたデータが示す前記解剖学的画像に重ね合わせて表示する表示処理を行なう表示手段とを備え、これにより、心筋内興奮不均一伝播による心室遅延電位の局在を3次元的に同定することができ、
前記第1の演算手段によって生成される前記心筋内の3次元電気的活動状態を示すデータは、心筋内興奮の伝播速度を示すデータであり、
前記第1の演算手段は、心筋内の興奮伝播路部位を1つまたは複数の微小電流素片を用いて近似し、前記微小電流素片の位置の時間的変化を算出することにより、心筋内興奮の伝播速度を示すデータを生成する、心臓磁界診断装置。A cardiac magnetic field diagnostic apparatus for ventricular delayed potential,
A plurality of magnetic field time series data corresponding to the plurality of coordinates is obtained by non-contact magnetic measurement at a plurality of coordinates on the chest of the subject, and a magnetic field distribution time series on the chest is obtained based on the plurality of magnetic field time series data Magnetic field distribution measuring means for generating data;
First calculation means for generating data indicating a three-dimensional electrical activity state in the myocardium of the subject based on the generated magnetic field distribution time-series data;
A second computing means for processing chest tomographic image data of the subject supplied separately to generate data indicating an anatomical image;
The image of the three-dimensional electrical activity state in the myocardium indicated by the data generated by the first calculation means is displayed superimposed on the anatomical image indicated by the data generated by the second calculation means. Display means for performing display processing, and thereby, the localization of the ventricular delayed potential due to non-uniform propagation in the myocardium can be identified three-dimensionally,
The data indicating the three-dimensional electrical activity state in the myocardium generated by the first calculation means is data indicating the propagation speed of intramyocardial excitation,
The first calculation means approximates an excitation propagation path site in the myocardium using one or a plurality of minute current elements, and calculates a temporal change in the position of the minute current element, thereby A cardiac magnetic field diagnostic apparatus that generates data indicating the propagation speed of excitement.
被験者の胸部上の複数の座標における非接触磁気計測により前記複数の座標に対応する複数の磁界時系列データを取得し、かつ前記複数の磁界時系列データに基づいて前記胸部上の磁界分布時系列データを生成する磁界分布計測手段と、
前記生成された磁界分布時系列データに基づいて前記被験者の心筋内の3次元電気的活動状態を示すデータを生成する演算手段と、
前記演算手段により生成されたデータに基づいて、前記被験者の心臓の洞房結節からヒス束−プルキンエ繊維系への刺激伝播経路を示す画像と、心筋内の3次元電気的活動状態を示す画像とを重ね合わせて表示する表示処理を行なう表示手段とを備え、これにより、心筋内興奮不均一伝播による心室遅延電位の局在を3次元的に同定することができる、心臓磁界診断装置。A cardiac magnetic field diagnostic apparatus for ventricular delayed potential,
A plurality of magnetic field time series data corresponding to the plurality of coordinates is obtained by non-contact magnetic measurement at a plurality of coordinates on the chest of the subject, and a magnetic field distribution time series on the chest is obtained based on the plurality of magnetic field time series data Magnetic field distribution measuring means for generating data;
Calculation means for generating data indicating a three-dimensional electrical activity state in the myocardium of the subject based on the generated magnetic field distribution time-series data;
Based on the data generated by the computing means, an image showing a stimulus propagation path from the sinoatrial node of the subject's heart to the His bundle-Purkinje fiber system, and an image showing a three-dimensional electrical activity state in the myocardium A cardiac magnetic field diagnostic apparatus comprising: display means for performing a display process of overlapping display, whereby the localization of ventricular delay potential due to non-uniform propagation of intramyocardial excitation can be identified three-dimensionally.
被験者の胸部上の複数の座標における非接触磁気計測により取得された前記複数の座標に対応する複数の磁界時系列データに基づいて生成された前記胸部上の磁界分布時系列データに基づいて、前記被験者の心筋内の3次元電気的活動状態を示す第1のデータを生成するステップと、
別途供給された前記被験者の胸部断層画像データを加工して3次元的解剖学的画像を示す第2のデータを生成するステップと、
前記第1のデータが示す前記心筋内の3次元電気的活動状態の画像を、前記第2のデータが示す前記3次元的解剖学的画像に重ね合わせて、心筋内興奮不均一伝播部位による心室遅延電位の局在を3次元的に同定するための画像を表示するステップとを備える、心臓磁界診断装置の作動方法。 A method for operating a cardiac magnetic field diagnostic apparatus for ventricular delayed potential , comprising:
Based on magnetic field distribution time series data on the chest generated based on a plurality of magnetic field time series data corresponding to the plurality of coordinates acquired by non-contact magnetic measurement at a plurality of coordinates on the subject's chest, Generating first data indicative of a three-dimensional electrical activity state in the subject's myocardium;
Processing the tomographic image data of the subject separately supplied to generate second data indicating a three-dimensional anatomical image;
The image of the three-dimensional electrical activity state in the myocardium indicated by the first data is superimposed on the three-dimensional anatomical image indicated by the second data , and the ventricle by the non-uniform propagation site in the myocardium. and a step of displaying the image to identify the localization of late potentials in three dimensions, a method of operating a cardiac magnetic field diagnostic apparatus.
被験者の胸部上の複数の座標における非接触磁気計測により取得された前記複数の座標に対応する複数の磁界時系列データに基づいて生成された前記胸部上の磁界分布時系列データに基づいて、前記被験者の心筋内の3次元電気的活動状態を示す第1のデータを生成するステップと、
別途供給された前記被験者の胸部断層画像データを加工して解剖学的画像を示す第2のデータを生成するステップと、
前記第1のデータが示す前記心筋内の3次元電気的活動状態の画像を、前記第2のデータが示す前記解剖学的画像に重ね合わせて、心筋内興奮不均一伝播部位による心室遅延電位の局在を3次元的に同定するための画像を表示するステップとを備え、
前記第1のデータが示す心筋内の3次元電気活動状態は、心筋内興奮の伝播速度であり、
前記第1のデータを生成するステップは、心筋内興奮伝播路部位を1つまたは複数の微小電流素片を用いて近似し、前記微小電流素片の位置の時間的変化を算出することにより、前記心筋内興奮の伝播速度を示すデータを生成する、心臓磁界診断装置の作動方法。 A method for operating a cardiac magnetic field diagnostic apparatus for ventricular delayed potential , comprising:
Based on magnetic field distribution time series data on the chest generated based on a plurality of magnetic field time series data corresponding to the plurality of coordinates acquired by non-contact magnetic measurement at a plurality of coordinates on the subject's chest, Generating first data indicative of a three-dimensional electrical activity state in the subject's myocardium;
Processing the tomographic image data of the subject separately supplied to generate second data indicating an anatomical image;
The image of the three-dimensional electrical activity state in the myocardium indicated by the first data is superimposed on the anatomical image indicated by the second data , and the ventricular delay potential due to the intra-myocardial excitation non-uniform propagation site is superimposed. Displaying an image for identifying the localization three-dimensionally,
The three-dimensional electrical activity state in the myocardium indicated by the first data is a propagation speed of intramyocardial excitation,
The step of generating the first data includes approximating an intramyocardial excitation propagation path site using one or a plurality of minute current elements, and calculating a temporal change in the position of the minute current element, An operation method of a cardiac magnetic field diagnostic apparatus , which generates data indicating a propagation speed of the intramyocardial excitation.
被験者の胸部上の複数の座標における非接触磁気計測により取得された前記複数の座標に対応する複数の磁界時系列データに基づいて生成された前記胸部上の磁界分布時系列データに基づいて、前記被験者の心筋内の3次元電気的活動状態を示すデータを生成するステップと、
前記生成されたデータに基づいて、前記被験者の心臓の洞房結節からヒス束−プルキンエ繊維系の刺激伝播経路を示す画像と、心筋内の3次元電気的活動状態を示す画像とを重ね合わせて、心筋内興奮不均一伝播による心室遅延電位の局在を3次元的に同定するための画像を表示するステップとを備える、心臓磁界診断装置の作動方法。 A method for operating a cardiac magnetic field diagnostic apparatus for ventricular delayed potential , comprising:
Based on magnetic field distribution time series data on the chest generated based on a plurality of magnetic field time series data corresponding to the plurality of coordinates acquired by non-contact magnetic measurement at a plurality of coordinates on the subject's chest, Generating data indicative of a three-dimensional electrical activity state in the subject's myocardium;
Based on the generated data, an image showing a stimulus propagation path of the His bundle-Purkinje fiber system from the sinoatrial node of the subject's heart and an image showing a three-dimensional electrical activity state in the myocardium are superimposed , and a step of displaying the image to identify the localization of ventricular late potential by intramyocardial excitation uneven propagation in three dimensions, a method of operating a cardiac magnetic field diagnostic apparatus.
Priority Applications (5)
| Application Number | Priority Date | Filing Date | Title |
|---|---|---|---|
| JP2000217835A JP3712350B2 (en) | 2000-07-18 | 2000-07-18 | Cardiac magnetic field diagnostic apparatus for ventricular delayed potential and method for operating the same |
| EP01950019A EP1302161A4 (en) | 2000-07-18 | 2001-07-17 | Cardiac magnetic field diagnosing apparatus by late ventricular potential and method of locating intramyocardial excitement uneven propagation portion |
| US10/333,056 US6941165B2 (en) | 2000-07-18 | 2001-07-17 | Cardiac magnetic field diagnosing apparatus by late ventricular potential and method of locating intramyocardial excitement uneven propagation portion |
| PCT/JP2001/006194 WO2002005715A1 (en) | 2000-07-18 | 2001-07-17 | Cardiac magnetic field diagnosing apparatus by late ventricular potential and method of locating intramyocardial excitement uneven propagation portion |
| AU2001271070A AU2001271070A1 (en) | 2000-07-18 | 2001-07-17 | Cardiac magnetic field diagnosing apparatus by late ventricular potential and method of locating intramyocardial excitement uneven propagation portion |
Applications Claiming Priority (1)
| Application Number | Priority Date | Filing Date | Title |
|---|---|---|---|
| JP2000217835A JP3712350B2 (en) | 2000-07-18 | 2000-07-18 | Cardiac magnetic field diagnostic apparatus for ventricular delayed potential and method for operating the same |
Publications (3)
| Publication Number | Publication Date |
|---|---|
| JP2002028145A JP2002028145A (en) | 2002-01-29 |
| JP2002028145A5 JP2002028145A5 (en) | 2005-08-25 |
| JP3712350B2 true JP3712350B2 (en) | 2005-11-02 |
Family
ID=18712890
Family Applications (1)
| Application Number | Title | Priority Date | Filing Date |
|---|---|---|---|
| JP2000217835A Expired - Fee Related JP3712350B2 (en) | 2000-07-18 | 2000-07-18 | Cardiac magnetic field diagnostic apparatus for ventricular delayed potential and method for operating the same |
Country Status (5)
| Country | Link |
|---|---|
| US (1) | US6941165B2 (en) |
| EP (1) | EP1302161A4 (en) |
| JP (1) | JP3712350B2 (en) |
| AU (1) | AU2001271070A1 (en) |
| WO (1) | WO2002005715A1 (en) |
Families Citing this family (7)
| Publication number | Priority date | Publication date | Assignee | Title |
|---|---|---|---|---|
| JP3712348B2 (en) * | 2000-07-18 | 2005-11-02 | 独立行政法人科学技術振興機構 | Cardiac magnetic field diagnostic apparatus for atrial flutter and atrial fibrillation and method for operating the same |
| JP3712349B2 (en) * | 2000-07-18 | 2005-11-02 | 独立行政法人科学技術振興機構 | Surviving myocardial diagnostic apparatus and operating method thereof |
| JP4027867B2 (en) * | 2003-09-10 | 2007-12-26 | 株式会社日立ハイテクノロジーズ | Biomagnetic field measurement device |
| US9585600B2 (en) | 2012-10-02 | 2017-03-07 | Covidien Lp | Magnetic field viewing film for tracking in-situ surgical applications |
| JP6399852B2 (en) * | 2014-08-07 | 2018-10-03 | フクダ電子株式会社 | Pulse wave measuring device and biological information measuring device |
| WO2018168864A1 (en) * | 2017-03-17 | 2018-09-20 | Ricoh Company, Ltd. | Information processing apparatus, information processing method, program, and biological signal measurement system |
| CN113317793B (en) * | 2021-06-11 | 2023-02-17 | 宁波大学 | Magnetocardiogram high-frequency signal analysis method, storage medium, and electronic device |
Family Cites Families (18)
| Publication number | Priority date | Publication date | Assignee | Title |
|---|---|---|---|---|
| EP0443069A1 (en) * | 1990-02-22 | 1991-08-28 | Siemens Aktiengesellschaft | Method of measuring the electric or magnetic field pattern with a sensor arrangement |
| US5341811A (en) * | 1991-03-26 | 1994-08-30 | Allegheny-Singer Research Institute | Method and apparatus for observation of ventricular late potentials |
| JP2949983B2 (en) | 1991-12-10 | 1999-09-20 | ダイキン工業株式会社 | Physical source analysis method and apparatus |
| JPH05220124A (en) * | 1992-02-13 | 1993-08-31 | Fujitsu Ltd | Biomagnetism measuring instrument |
| US5228443A (en) * | 1992-03-27 | 1993-07-20 | General Electric Company | Method for estimation and display of current source distribution from electric and magnetic measurements and 3D anatomical data |
| GB9310604D0 (en) * | 1993-05-21 | 1993-07-07 | British Tech Group | Analysis of heart waveforms |
| WO1995003843A1 (en) * | 1993-07-30 | 1995-02-09 | The Regents Of The University Of California | Endocardial infusion catheter |
| JPH08289877A (en) | 1995-04-24 | 1996-11-05 | Toshiba Corp | Simulation method for excitation propagation process of tissue and intra-tissue electromagnetic phenomenon diagnostic device |
| EP0968683B1 (en) | 1996-10-08 | 2011-05-25 | Hitachi Medical Corporation | Method and apparatus for forming and displaying image from a plurality of sectional images |
| DE19808985B4 (en) * | 1997-03-07 | 2012-06-14 | Hitachi, Ltd. | Method and device for biomagnetic field measurement |
| JPH10276998A (en) * | 1997-04-10 | 1998-10-20 | Toshiba Corp | Simulation system for excitation propagation process |
| US5827195A (en) * | 1997-05-09 | 1998-10-27 | Cambridge Heart, Inc. | Electrocardiogram noise reduction using multi-dimensional filtering |
| JP3660781B2 (en) | 1997-05-26 | 2005-06-15 | 株式会社東芝 | Diagnostic device for intracardiac electrical phenomena |
| US6473518B1 (en) * | 1997-10-02 | 2002-10-29 | Hitachi, Ltd. | Method of measuring a biomagnetic field, method of analyzing a measured biomagnetic field, method of displaying biomagnetic field data, and apparatus therefor |
| JPH11128224A (en) | 1997-10-28 | 1999-05-18 | Mitsubishi Heavy Ind Ltd | Ultrasonic 3-dimensional image reorganizing device |
| JP4208275B2 (en) * | 1997-10-30 | 2009-01-14 | 株式会社東芝 | Diagnostic device for intracardiac electrical phenomenon and method for displaying the phenomenon |
| IT1302900B1 (en) * | 1998-12-04 | 2000-10-10 | Riccardo Fenici | AMAGNETIC CATHETER FOR THE SINGLE-CATHETER REGISTRATION OF MULTIPLE SINGLE-PHASE ACTION POTENTIALS, LOCABLE THREE-DIMENSIONALLY AND |
| JP2001112732A (en) * | 1999-10-15 | 2001-04-24 | Hitachi Ltd | Examination apparatus using nuclear magnetic resonance |
-
2000
- 2000-07-18 JP JP2000217835A patent/JP3712350B2/en not_active Expired - Fee Related
-
2001
- 2001-07-17 US US10/333,056 patent/US6941165B2/en not_active Expired - Fee Related
- 2001-07-17 EP EP01950019A patent/EP1302161A4/en not_active Withdrawn
- 2001-07-17 AU AU2001271070A patent/AU2001271070A1/en not_active Abandoned
- 2001-07-17 WO PCT/JP2001/006194 patent/WO2002005715A1/en active Application Filing
Also Published As
| Publication number | Publication date |
|---|---|
| US6941165B2 (en) | 2005-09-06 |
| JP2002028145A (en) | 2002-01-29 |
| EP1302161A4 (en) | 2008-02-13 |
| US20040049119A1 (en) | 2004-03-11 |
| AU2001271070A1 (en) | 2002-01-30 |
| EP1302161A1 (en) | 2003-04-16 |
| WO2002005715A1 (en) | 2002-01-24 |
Similar Documents
| Publication | Publication Date | Title |
|---|---|---|
| JP7047016B2 (en) | Alignment map using intracardiac signal | |
| US7805182B2 (en) | System and method for the guidance of a catheter in electrophysiologic interventions | |
| WO2005117695A1 (en) | Cardiac magnetic field diagnostic apparatus and damaged cardiac muscle three-dimensional localization evaluating method | |
| Tavarozzi et al. | Current perspective Magnetocardiography: current status and perspectives. Part II: Clinical applications | |
| JP2018525041A (en) | Methods and systems for functional cardiac electrophysiology assessment | |
| JP3712348B2 (en) | Cardiac magnetic field diagnostic apparatus for atrial flutter and atrial fibrillation and method for operating the same | |
| JP3712349B2 (en) | Surviving myocardial diagnostic apparatus and operating method thereof | |
| Leder et al. | Noninvasive biomagnetic imaging in coronary artery disease based on individual current density maps of the heart | |
| JP3712350B2 (en) | Cardiac magnetic field diagnostic apparatus for ventricular delayed potential and method for operating the same | |
| JP3835805B2 (en) | Cardiac magnetic field diagnostic apparatus and operating method thereof | |
| Brisinda et al. | First 36-channel magnetocardiographic study of CAD patients in an unshielded laboratory for interventional and intensive cardiac care | |
| Muller et al. | Localization of a ventricular tachycardia-focus with multichannel magnetocardiography and three-dimensional current density reconstruction | |
| JP3809454B2 (en) | Cardiac magnetic field diagnostic apparatus and operating method thereof | |
| JP2002355229A (en) | Method to analyze magnetic field and instrument to visualize current distribution | |
| Agren et al. | Magnetocardiographic localization of arrhythmia substrates: a methodology study with accessory pathway ablation as reference | |
| Mäkijärvi et al. | New trends in clinical magnetocardiography | |
| Fenici et al. | Magnetocardiography provides non-invasive three-dimensional electroanatomical imaging of cardiac electrophysiology. | |
| Fenici et al. | From 3D to 4D imaging: is that useful for interventional cardiac electrophysiology? | |
| Stroink | Forty years of magnetocardiology | |
| Fenici et al. | Magnetocardiography provides non-invasive three-dimensional electroanatomical imaging of cardiac electrophysiology | |
| JP4972443B2 (en) | Biomagnetic field measurement device | |
| Baron-Palucka | Magnetocardiography-measurement conduction, data formats and diagnostic applications. | |
| Leder et al. | Application of anatomically constrained minimum norm solution in coronary artery disease (myocardial current imaging) |
Legal Events
| Date | Code | Title | Description |
|---|---|---|---|
| A711 | Notification of change in applicant |
Free format text: JAPANESE INTERMEDIATE CODE: A712 Effective date: 20031031 |
|
| RD03 | Notification of appointment of power of attorney |
Free format text: JAPANESE INTERMEDIATE CODE: A7423 Effective date: 20040129 |
|
| A711 | Notification of change in applicant |
Free format text: JAPANESE INTERMEDIATE CODE: A711 Effective date: 20040723 |
|
| RD03 | Notification of appointment of power of attorney |
Free format text: JAPANESE INTERMEDIATE CODE: A7423 Effective date: 20040723 |
|
| A521 | Written amendment |
Free format text: JAPANESE INTERMEDIATE CODE: A821 Effective date: 20040723 |
|
| A521 | Written amendment |
Free format text: JAPANESE INTERMEDIATE CODE: A523 Effective date: 20050221 |
|
| A621 | Written request for application examination |
Free format text: JAPANESE INTERMEDIATE CODE: A621 Effective date: 20050221 |
|
| A871 | Explanation of circumstances concerning accelerated examination |
Free format text: JAPANESE INTERMEDIATE CODE: A871 Effective date: 20050221 |
|
| A975 | Report on accelerated examination |
Free format text: JAPANESE INTERMEDIATE CODE: A971005 Effective date: 20050317 |
|
| A521 | Written amendment |
Free format text: JAPANESE INTERMEDIATE CODE: A821 Effective date: 20050221 |
|
| A131 | Notification of reasons for refusal |
Free format text: JAPANESE INTERMEDIATE CODE: A131 Effective date: 20050426 |
|
| A521 | Written amendment |
Free format text: JAPANESE INTERMEDIATE CODE: A523 Effective date: 20050621 |
|
| TRDD | Decision of grant or rejection written | ||
| A01 | Written decision to grant a patent or to grant a registration (utility model) |
Free format text: JAPANESE INTERMEDIATE CODE: A01 Effective date: 20050726 |
|
| A61 | First payment of annual fees (during grant procedure) |
Free format text: JAPANESE INTERMEDIATE CODE: A61 Effective date: 20050816 |
|
| R150 | Certificate of patent or registration of utility model |
Free format text: JAPANESE INTERMEDIATE CODE: R150 |
|
| FPAY | Renewal fee payment (event date is renewal date of database) |
Free format text: PAYMENT UNTIL: 20080826 Year of fee payment: 3 |
|
| FPAY | Renewal fee payment (event date is renewal date of database) |
Free format text: PAYMENT UNTIL: 20090826 Year of fee payment: 4 |
|
| FPAY | Renewal fee payment (event date is renewal date of database) |
Free format text: PAYMENT UNTIL: 20100826 Year of fee payment: 5 |
|
| LAPS | Cancellation because of no payment of annual fees |